Zip Codes with the Highest Percentage of Population with a Degree in Liberal Arts and History in Hawaii
RELATED REPORTS & OPTIONS
Liberal Arts and History
Hawaii
Compare Zip Codes
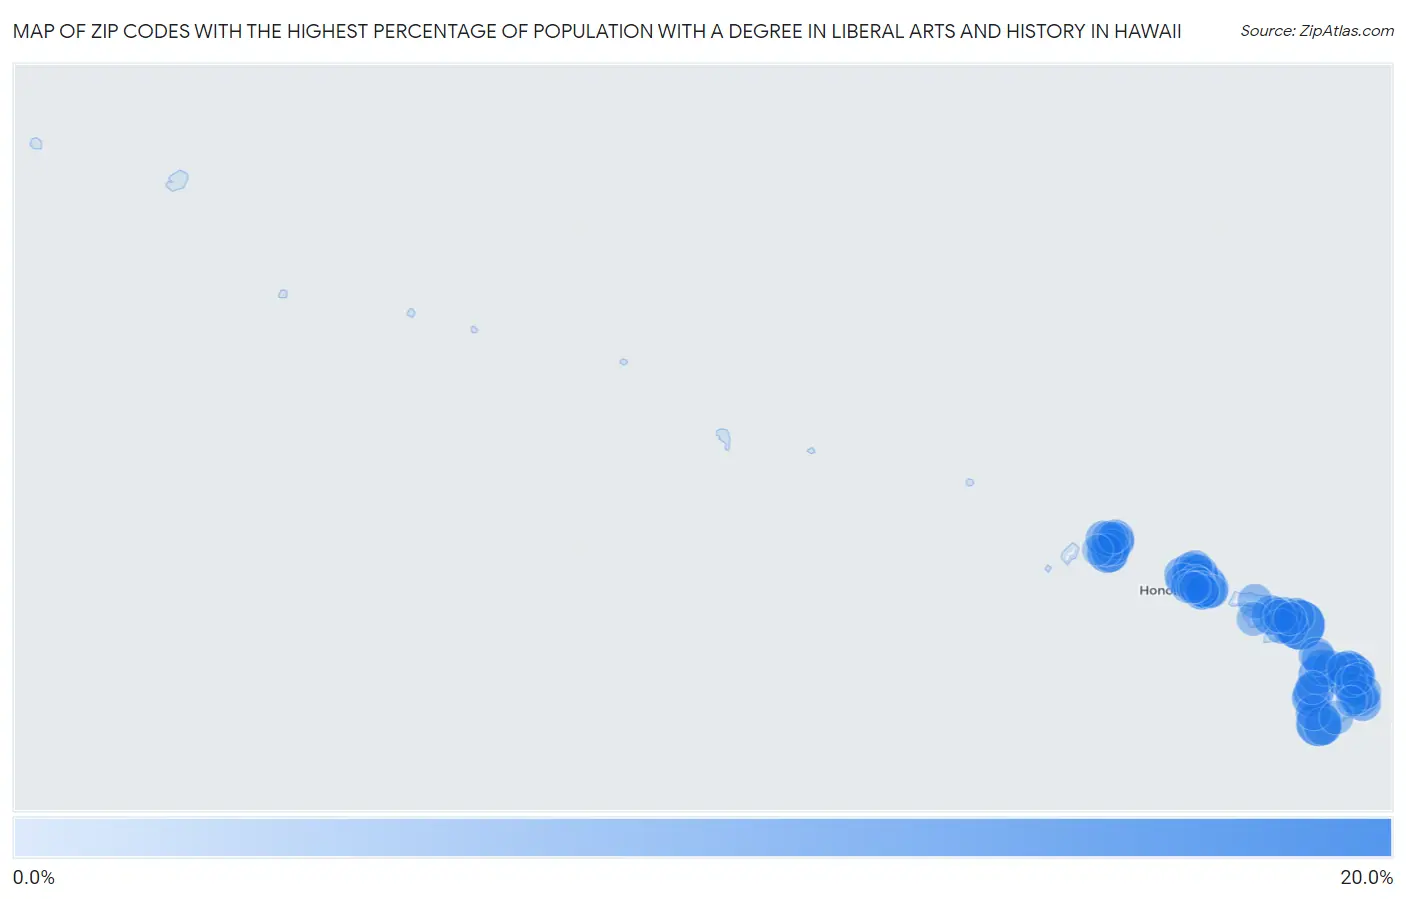
Map of Zip Codes with the Highest Percentage of Population with a Degree in Liberal Arts and History in Hawaii
0.0%
20.0%
Zip Codes with the Highest Percentage of Population with a Degree in Liberal Arts and History in Hawaii
| Zip Code | % Graduates | vs State | vs National | |
| 1. | 96713 | 18.1% | 4.1%(+14.0)#1 | 4.9%(+13.2)#1,028 |
| 2. | 96710 | 16.4% | 4.1%(+12.3)#2 | 4.9%(+11.5)#1,212 |
| 3. | 96737 | 13.7% | 4.1%(+9.65)#3 | 4.9%(+8.85)#1,704 |
| 4. | 96765 | 9.7% | 4.1%(+5.61)#4 | 4.9%(+4.81)#3,320 |
| 5. | 96717 | 9.0% | 4.1%(+4.97)#5 | 4.9%(+4.17)#3,811 |
| 6. | 96725 | 9.0% | 4.1%(+4.96)#6 | 4.9%(+4.16)#3,819 |
| 7. | 96761 | 8.3% | 4.1%(+4.20)#7 | 4.9%(+3.40)#4,573 |
| 8. | 96764 | 7.9% | 4.1%(+3.82)#8 | 4.9%(+3.02)#5,044 |
| 9. | 96750 | 7.8% | 4.1%(+3.76)#9 | 4.9%(+2.96)#5,122 |
| 10. | 96857 | 7.5% | 4.1%(+3.43)#10 | 4.9%(+2.63)#5,583 |
| 11. | 96703 | 7.5% | 4.1%(+3.41)#11 | 4.9%(+2.60)#5,623 |
| 12. | 96738 | 7.4% | 4.1%(+3.32)#12 | 4.9%(+2.52)#5,748 |
| 13. | 96760 | 6.9% | 4.1%(+2.84)#13 | 4.9%(+2.04)#6,542 |
| 14. | 96772 | 6.9% | 4.1%(+2.83)#14 | 4.9%(+2.02)#6,558 |
| 15. | 96795 | 6.6% | 4.1%(+2.56)#15 | 4.9%(+1.76)#7,080 |
| 16. | 96778 | 6.3% | 4.1%(+2.26)#16 | 4.9%(+1.46)#7,699 |
| 17. | 96814 | 6.1% | 4.1%(+2.02)#17 | 4.9%(+1.22)#8,283 |
| 18. | 96756 | 6.1% | 4.1%(+1.99)#18 | 4.9%(+1.19)#8,350 |
| 19. | 96728 | 5.9% | 4.1%(+1.81)#19 | 4.9%(+1.01)#8,832 |
| 20. | 96708 | 5.9% | 4.1%(+1.80)#20 | 4.9%(+1.00)#8,861 |
| 21. | 96734 | 5.9% | 4.1%(+1.80)#21 | 4.9%(+0.999)#8,870 |
| 22. | 96790 | 5.8% | 4.1%(+1.73)#22 | 4.9%(+0.927)#9,038 |
| 23. | 96791 | 5.8% | 4.1%(+1.70)#23 | 4.9%(+0.895)#9,127 |
| 24. | 96818 | 5.5% | 4.1%(+1.40)#24 | 4.9%(+0.600)#9,943 |
| 25. | 96743 | 5.5% | 4.1%(+1.39)#25 | 4.9%(+0.592)#9,968 |
| 26. | 96714 | 5.4% | 4.1%(+1.35)#26 | 4.9%(+0.554)#10,073 |
| 27. | 96727 | 5.3% | 4.1%(+1.27)#27 | 4.9%(+0.469)#10,304 |
| 28. | 96746 | 5.3% | 4.1%(+1.26)#28 | 4.9%(+0.457)#10,350 |
| 29. | 96779 | 5.3% | 4.1%(+1.23)#29 | 4.9%(+0.425)#10,455 |
| 30. | 96704 | 5.1% | 4.1%(+1.01)#30 | 4.9%(+0.208)#11,099 |
| 31. | 96766 | 5.0% | 4.1%(+0.950)#31 | 4.9%(+0.149)#11,280 |
| 32. | 96786 | 4.9% | 4.1%(+0.816)#32 | 4.9%(+0.015)#11,677 |
| 33. | 96848 | 4.8% | 4.1%(+0.690)#33 | 4.9%(-0.110)#12,113 |
| 34. | 96793 | 4.7% | 4.1%(+0.669)#34 | 4.9%(-0.132)#12,192 |
| 35. | 96712 | 4.7% | 4.1%(+0.645)#35 | 4.9%(-0.156)#12,274 |
| 36. | 96744 | 4.7% | 4.1%(+0.639)#36 | 4.9%(-0.162)#12,289 |
| 37. | 96821 | 4.7% | 4.1%(+0.625)#37 | 4.9%(-0.176)#12,329 |
| 38. | 96719 | 4.5% | 4.1%(+0.393)#38 | 4.9%(-0.408)#13,072 |
| 39. | 96822 | 4.5% | 4.1%(+0.380)#39 | 4.9%(-0.421)#13,117 |
| 40. | 96722 | 4.4% | 4.1%(+0.375)#40 | 4.9%(-0.426)#13,136 |
| 41. | 96797 | 4.3% | 4.1%(+0.208)#41 | 4.9%(-0.593)#13,709 |
| 42. | 96753 | 4.2% | 4.1%(+0.172)#42 | 4.9%(-0.628)#13,844 |
| 43. | 96749 | 4.1% | 4.1%(+0.047)#43 | 4.9%(-0.754)#14,340 |
| 44. | 96730 | 4.1% | 4.1%(+0.045)#44 | 4.9%(-0.756)#14,343 |
| 45. | 96755 | 4.1% | 4.1%(-0.017)#45 | 4.9%(-0.818)#14,563 |
| 46. | 96762 | 4.0% | 4.1%(-0.053)#46 | 4.9%(-0.853)#14,705 |
| 47. | 96731 | 4.0% | 4.1%(-0.072)#47 | 4.9%(-0.872)#14,775 |
| 48. | 96748 | 4.0% | 4.1%(-0.103)#48 | 4.9%(-0.904)#14,910 |
| 49. | 96817 | 4.0% | 4.1%(-0.113)#49 | 4.9%(-0.914)#14,950 |
| 50. | 96816 | 3.9% | 4.1%(-0.194)#50 | 4.9%(-0.995)#15,242 |
| 51. | 96720 | 3.8% | 4.1%(-0.266)#51 | 4.9%(-1.07)#15,505 |
| 52. | 96763 | 3.5% | 4.1%(-0.540)#52 | 4.9%(-1.34)#16,478 |
| 53. | 96776 | 3.4% | 4.1%(-0.655)#53 | 4.9%(-1.46)#16,918 |
| 54. | 96815 | 3.4% | 4.1%(-0.706)#54 | 4.9%(-1.51)#17,093 |
| 55. | 96782 | 3.2% | 4.1%(-0.834)#55 | 4.9%(-1.63)#17,532 |
| 56. | 96771 | 3.2% | 4.1%(-0.837)#56 | 4.9%(-1.64)#17,543 |
| 57. | 96777 | 3.2% | 4.1%(-0.869)#57 | 4.9%(-1.67)#17,634 |
| 58. | 96792 | 3.1% | 4.1%(-0.969)#58 | 4.9%(-1.77)#17,995 |
| 59. | 96813 | 3.1% | 4.1%(-0.976)#59 | 4.9%(-1.78)#18,015 |
| 60. | 96789 | 3.0% | 4.1%(-1.10)#60 | 4.9%(-1.90)#18,441 |
| 61. | 96707 | 2.9% | 4.1%(-1.12)#61 | 4.9%(-1.92)#18,534 |
| 62. | 96740 | 2.8% | 4.1%(-1.23)#62 | 4.9%(-2.03)#18,879 |
| 63. | 96825 | 2.8% | 4.1%(-1.30)#63 | 4.9%(-2.11)#19,105 |
| 64. | 96701 | 2.7% | 4.1%(-1.33)#64 | 4.9%(-2.13)#19,197 |
| 65. | 96732 | 2.7% | 4.1%(-1.37)#65 | 4.9%(-2.17)#19,295 |
| 66. | 96819 | 2.6% | 4.1%(-1.44)#66 | 4.9%(-2.24)#19,535 |
| 67. | 96768 | 2.6% | 4.1%(-1.45)#67 | 4.9%(-2.25)#19,578 |
| 68. | 96826 | 2.6% | 4.1%(-1.50)#68 | 4.9%(-2.30)#19,746 |
| 69. | 96741 | 2.0% | 4.1%(-2.08)#69 | 4.9%(-2.88)#21,395 |
| 70. | 96706 | 2.0% | 4.1%(-2.09)#70 | 4.9%(-2.89)#21,409 |
| 71. | 96754 | 1.5% | 4.1%(-2.55)#71 | 4.9%(-3.35)#22,460 |
| 72. | 96860 | 1.2% | 4.1%(-2.87)#72 | 4.9%(-3.67)#23,042 |
| 73. | 96781 | 1.2% | 4.1%(-2.89)#73 | 4.9%(-3.69)#23,067 |
| 74. | 96783 | 0.91% | 4.1%(-3.16)#74 | 4.9%(-3.96)#23,535 |
| 75. | 96796 | 0.61% | 4.1%(-3.46)#75 | 4.9%(-4.26)#23,901 |
| 76. | 96785 | 0.56% | 4.1%(-3.51)#76 | 4.9%(-4.31)#23,959 |
1
Common Questions
What are the Top 10 Zip Codes with the Highest Percentage of Population with a Degree in Liberal Arts and History in Hawaii?
Top 10 Zip Codes with the Highest Percentage of Population with a Degree in Liberal Arts and History in Hawaii are:
What zip code has the Highest Percentage of Population with a Degree in Liberal Arts and History in Hawaii?
96713 has the Highest Percentage of Population with a Degree in Liberal Arts and History in Hawaii with 18.1%.
What is the Percentage of Population with a Degree in Liberal Arts and History in the State of Hawaii?
Percentage of Population with a Degree in Liberal Arts and History in Hawaii is 4.1%.
What is the Percentage of Population with a Degree in Liberal Arts and History in the United States?
Percentage of Population with a Degree in Liberal Arts and History in the United States is 4.9%.