North Bay, WI Map & Demographics
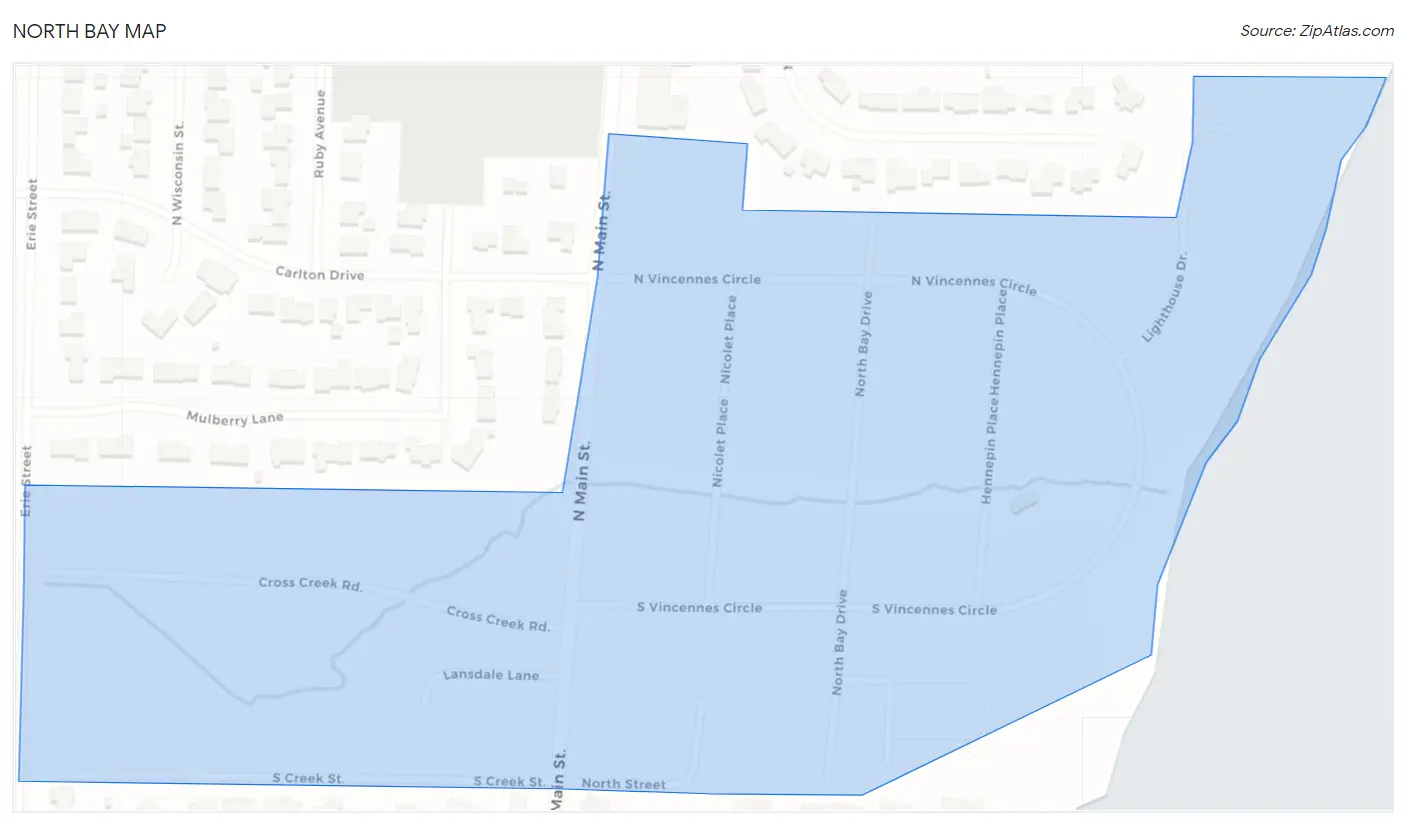
North Bay Map
North Bay Overview
$70,540
PER CAPITA INCOME
$153,056
AVG FAMILY INCOME
$105,833
AVG HOUSEHOLD INCOME
3.9%
WAGE / INCOME GAP [ % ]
96.1¢/ $1
WAGE / INCOME GAP [ $ ]
0.45
INEQUALITY / GINI INDEX
227
TOTAL POPULATION
90
MALE POPULATION
137
FEMALE POPULATION
65.69
MALES / 100 FEMALES
152.22
FEMALES / 100 MALES
51.8
MEDIAN AGE
2.4
AVG FAMILY SIZE
1.9
AVG HOUSEHOLD SIZE
83
LABOR FORCE [ PEOPLE ]
41.7%
PERCENT IN LABOR FORCE
Income in North Bay
Income Overview in North Bay
Per Capita Income in North Bay is $70,540, while median incomes of families and households are $153,056 and $105,833 respectively.
| Characteristic | Number | Measure |
| Per Capita Income | 227 | $70,540 |
| Median Family Income | 76 | $153,056 |
| Mean Family Income | 76 | $187,692 |
| Median Household Income | 118 | $105,833 |
| Mean Household Income | 118 | $154,364 |
| Income Deficit | 76 | $0 |
| Wage / Income Gap (%) | 227 | 3.91% |
| Wage / Income Gap ($) | 227 | 96.09¢ per $1 |
| Gini / Inequality Index | 227 | 0.45 |
Earnings by Sex in North Bay
Average Earnings in North Bay are $51,741, $53,750 for men and $51,650 for women, a difference of 3.9%.
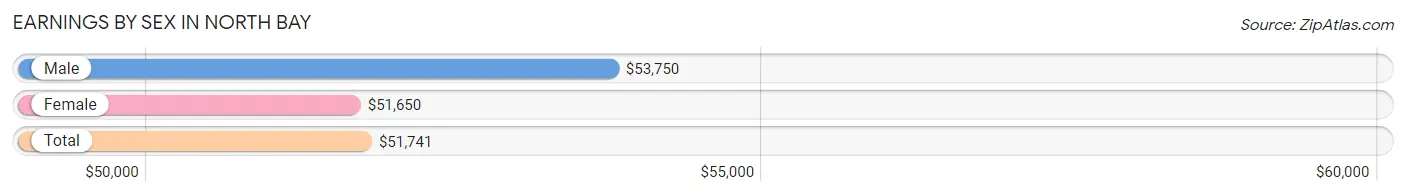
| Sex | Number | Average Earnings |
| Male | 46 (37.4%) | $53,750 |
| Female | 77 (62.6%) | $51,650 |
| Total | 123 (100.0%) | $51,741 |
Earnings by Sex by Income Bracket in North Bay
The most common earnings brackets in North Bay are $100,000+ for men (15 | 32.6%) and $50,000 to $54,999 for women (26 | 33.8%).
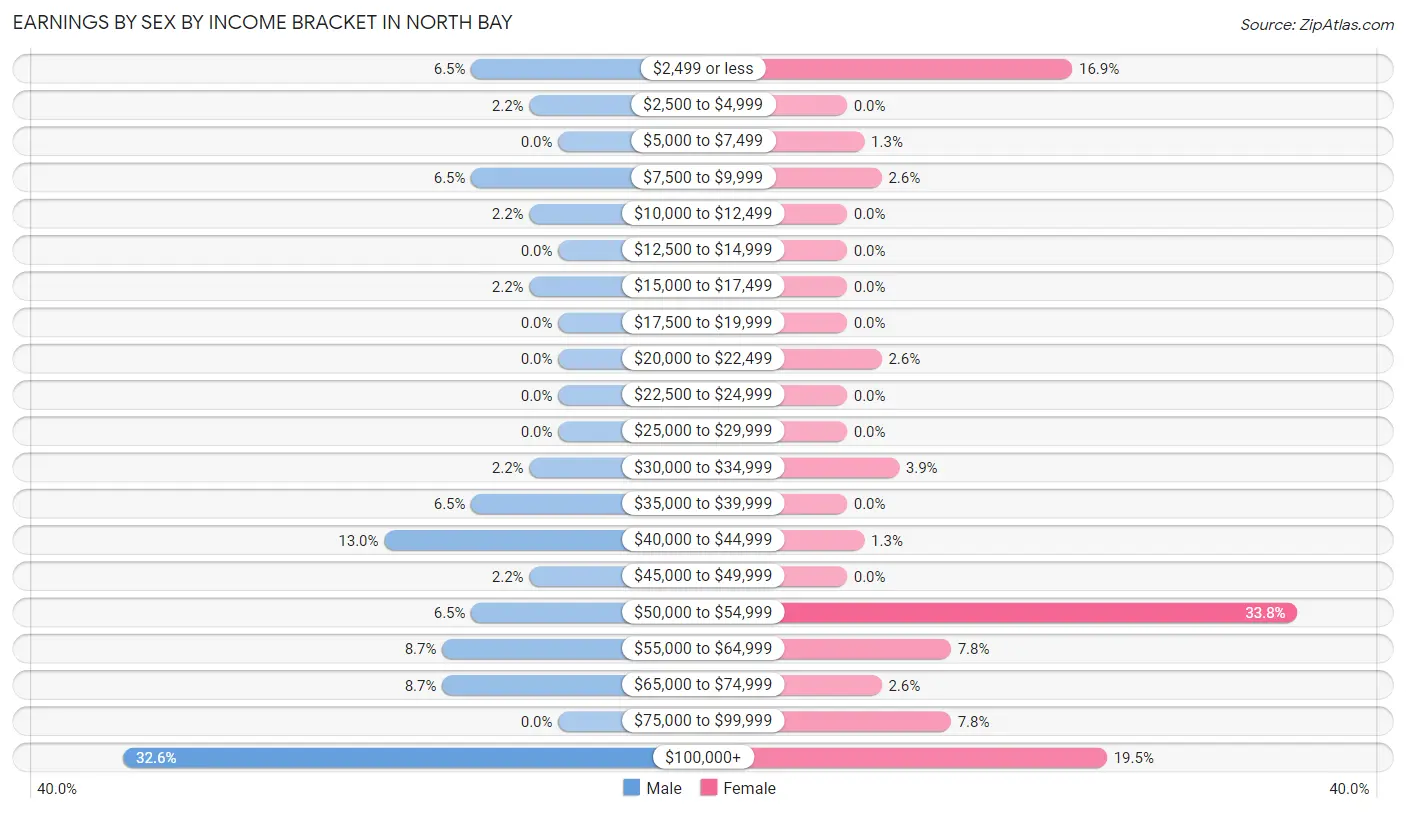
| Income | Male | Female |
| $2,499 or less | 3 (6.5%) | 13 (16.9%) |
| $2,500 to $4,999 | 1 (2.2%) | 0 (0.0%) |
| $5,000 to $7,499 | 0 (0.0%) | 1 (1.3%) |
| $7,500 to $9,999 | 3 (6.5%) | 2 (2.6%) |
| $10,000 to $12,499 | 1 (2.2%) | 0 (0.0%) |
| $12,500 to $14,999 | 0 (0.0%) | 0 (0.0%) |
| $15,000 to $17,499 | 1 (2.2%) | 0 (0.0%) |
| $17,500 to $19,999 | 0 (0.0%) | 0 (0.0%) |
| $20,000 to $22,499 | 0 (0.0%) | 2 (2.6%) |
| $22,500 to $24,999 | 0 (0.0%) | 0 (0.0%) |
| $25,000 to $29,999 | 0 (0.0%) | 0 (0.0%) |
| $30,000 to $34,999 | 1 (2.2%) | 3 (3.9%) |
| $35,000 to $39,999 | 3 (6.5%) | 0 (0.0%) |
| $40,000 to $44,999 | 6 (13.0%) | 1 (1.3%) |
| $45,000 to $49,999 | 1 (2.2%) | 0 (0.0%) |
| $50,000 to $54,999 | 3 (6.5%) | 26 (33.8%) |
| $55,000 to $64,999 | 4 (8.7%) | 6 (7.8%) |
| $65,000 to $74,999 | 4 (8.7%) | 2 (2.6%) |
| $75,000 to $99,999 | 0 (0.0%) | 6 (7.8%) |
| $100,000+ | 15 (32.6%) | 15 (19.5%) |
| Total | 46 (100.0%) | 77 (100.0%) |
Earnings by Sex by Educational Attainment in North Bay
Average earnings in North Bay are $59,375 for men and $52,000 for women, a difference of 12.4%. Men with an educational attainment of graduate degree enjoy the highest average annual earnings of $107,500, while those with college or associate's degree education earn the least with $38,750. Women with an educational attainment of college or associate's degree earn the most with the average annual earnings of $188,000, while those with bachelor's degree education have the smallest earnings of $51,350.
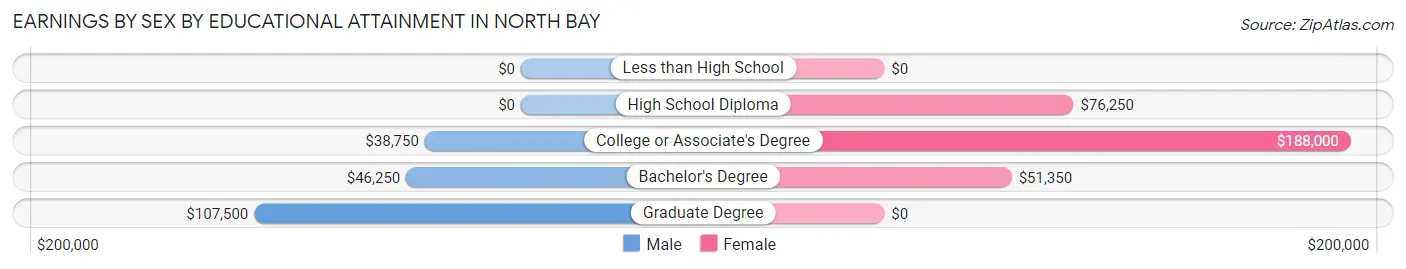
| Educational Attainment | Male Income | Female Income |
| Less than High School | - | - |
| High School Diploma | - | - |
| College or Associate's Degree | $38,750 | $188,000 |
| Bachelor's Degree | $46,250 | $51,350 |
| Graduate Degree | $107,500 | $0 |
| Total | $59,375 | $52,000 |
Family Income in North Bay
Family Income Brackets in North Bay
According to the North Bay family income data, there are 27 families falling into the $200,000+ income range, which is the most common income bracket and makes up 35.5% of all families.
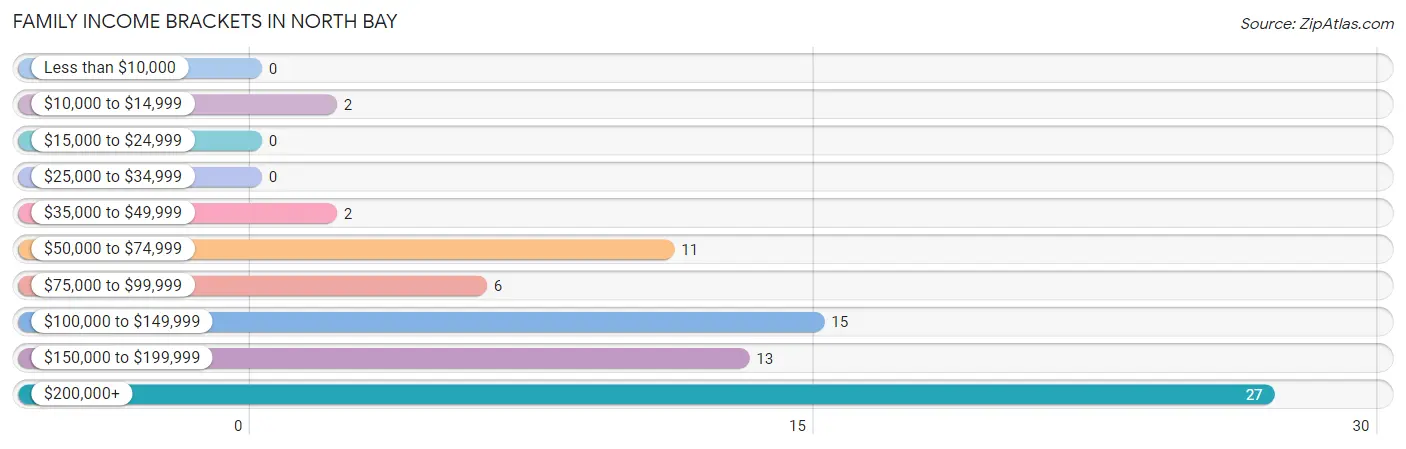
| Income Bracket | # Families | % Families |
| Less than $10,000 | 0 | 0.0% |
| $10,000 to $14,999 | 2 | 2.6% |
| $15,000 to $24,999 | 0 | 0.0% |
| $25,000 to $34,999 | 0 | 0.0% |
| $35,000 to $49,999 | 2 | 2.6% |
| $50,000 to $74,999 | 11 | 14.5% |
| $75,000 to $99,999 | 6 | 7.9% |
| $100,000 to $149,999 | 15 | 19.7% |
| $150,000 to $199,999 | 13 | 17.1% |
| $200,000+ | 27 | 35.5% |
Family Income by Famaliy Size in North Bay
4-person families (17 | 22.4%) account for the highest median family income in North Bay with $250,001 per family, while 2-person families (44 | 57.9%) have the highest median income of $76,528 per family member.
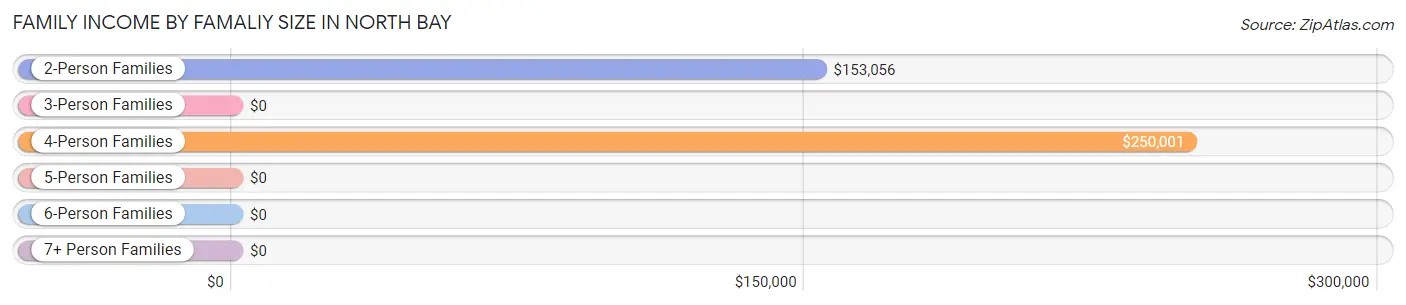
| Income Bracket | # Families | Median Income |
| 2-Person Families | 44 (57.9%) | $153,056 |
| 3-Person Families | 13 (17.1%) | $0 |
| 4-Person Families | 17 (22.4%) | $250,001 |
| 5-Person Families | 2 (2.6%) | $0 |
| 6-Person Families | 0 (0.0%) | $0 |
| 7+ Person Families | 0 (0.0%) | $0 |
| Total | 76 (100.0%) | $153,056 |
Family Income by Number of Earners in North Bay
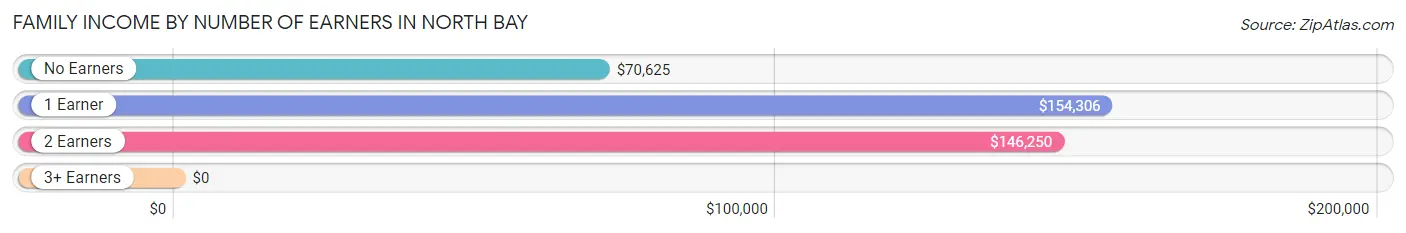
| Number of Earners | # Families | Median Income |
| No Earners | 21 (27.6%) | $70,625 |
| 1 Earner | 21 (27.6%) | $154,306 |
| 2 Earners | 29 (38.2%) | $146,250 |
| 3+ Earners | 5 (6.6%) | $0 |
| Total | 76 (100.0%) | $153,056 |
Household Income in North Bay
Household Income Brackets in North Bay
With 38 households falling in the category, the $50,000 to $74,999 income range is the most frequent in North Bay, accounting for 32.2% of all households.
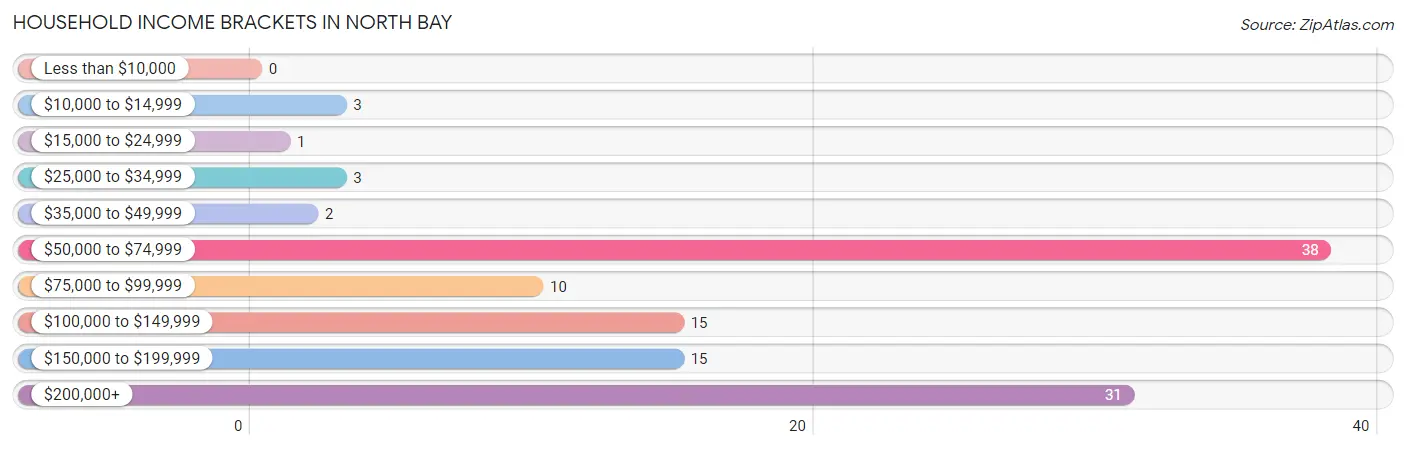
| Income Bracket | # Households | % Households |
| Less than $10,000 | 0 | 0.0% |
| $10,000 to $14,999 | 3 | 2.5% |
| $15,000 to $24,999 | 1 | 0.8% |
| $25,000 to $34,999 | 3 | 2.5% |
| $35,000 to $49,999 | 2 | 1.7% |
| $50,000 to $74,999 | 38 | 32.2% |
| $75,000 to $99,999 | 10 | 8.5% |
| $100,000 to $149,999 | 15 | 12.7% |
| $150,000 to $199,999 | 15 | 12.7% |
| $200,000+ | 31 | 26.3% |
Household Income by Householder Age in North Bay
The median household income in North Bay is $105,833, with the highest median household income of $223,750 found in the 25 to 44 years age bracket for the primary householder. A total of 8 households (6.8%) fall into this category. Meanwhile, the 15 to 24 years age bracket for the primary householder has the lowest median household income of $0, with 3 households (2.5%) in this group.
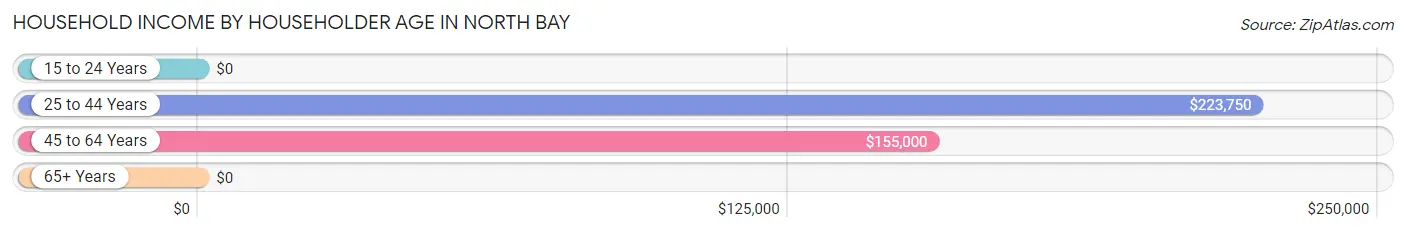
| Income Bracket | # Households | Median Income |
| 15 to 24 Years | 3 (2.5%) | $0 |
| 25 to 44 Years | 8 (6.8%) | $223,750 |
| 45 to 64 Years | 42 (35.6%) | $155,000 |
| 65+ Years | 65 (55.1%) | $0 |
| Total | 118 (100.0%) | $105,833 |
Poverty in North Bay
Income Below Poverty by Sex and Age in North Bay
With 5.6% poverty level for males and 2.9% for females among the residents of North Bay, 18 to 24 year old males and 55 to 64 year old females are the most vulnerable to poverty, with 5 males (45.5%) and 2 females (15.4%) in their respective age groups living below the poverty level.
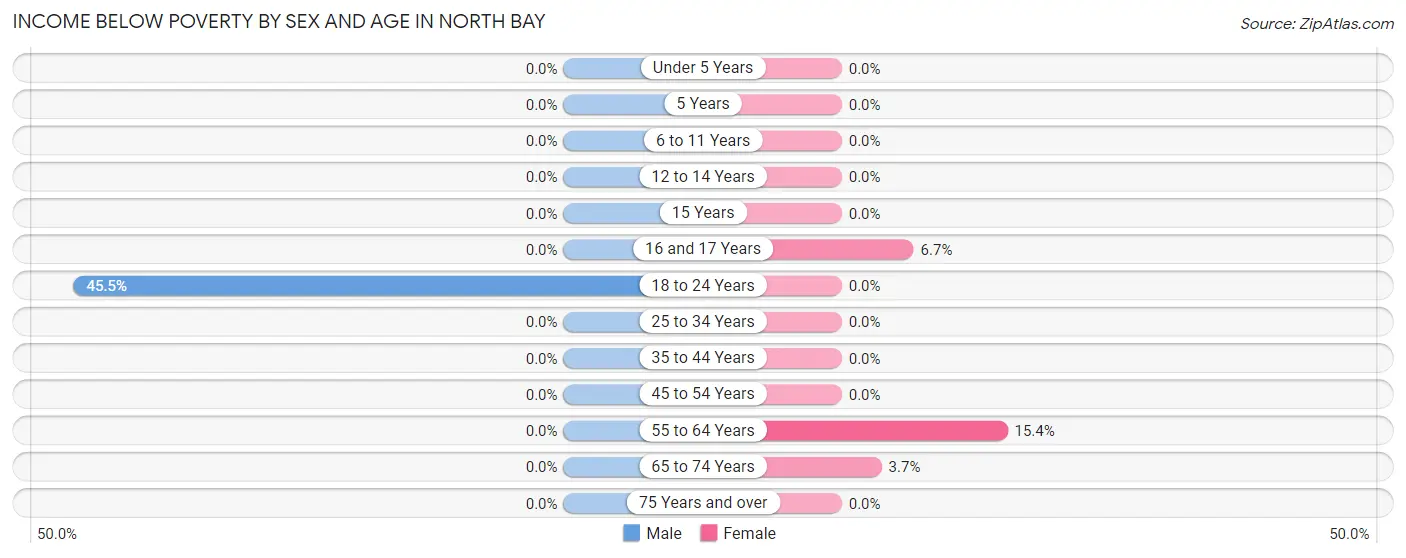
| Age Bracket | Male | Female |
| Under 5 Years | 0 (0.0%) | 0 (0.0%) |
| 5 Years | 0 (0.0%) | 0 (0.0%) |
| 6 to 11 Years | 0 (0.0%) | 0 (0.0%) |
| 12 to 14 Years | 0 (0.0%) | 0 (0.0%) |
| 15 Years | 0 (0.0%) | 0 (0.0%) |
| 16 and 17 Years | 0 (0.0%) | 1 (6.7%) |
| 18 to 24 Years | 5 (45.5%) | 0 (0.0%) |
| 25 to 34 Years | 0 (0.0%) | 0 (0.0%) |
| 35 to 44 Years | 0 (0.0%) | 0 (0.0%) |
| 45 to 54 Years | 0 (0.0%) | 0 (0.0%) |
| 55 to 64 Years | 0 (0.0%) | 2 (15.4%) |
| 65 to 74 Years | 0 (0.0%) | 1 (3.7%) |
| 75 Years and over | 0 (0.0%) | 0 (0.0%) |
| Total | 5 (5.6%) | 4 (2.9%) |
Income Above Poverty by Sex and Age in North Bay
According to the poverty statistics in North Bay, males aged under 5 years and females aged under 5 years are the age groups that are most secure financially, with 100.0% of males and 100.0% of females in these age groups living above the poverty line.
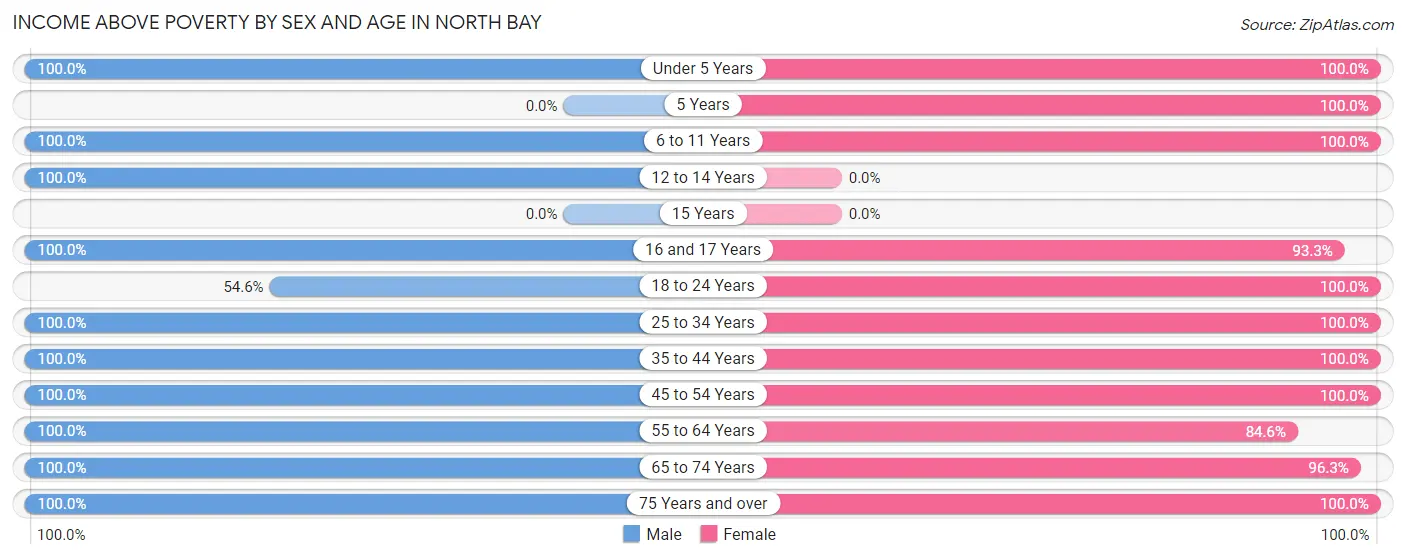
| Age Bracket | Male | Female |
| Under 5 Years | 5 (100.0%) | 4 (100.0%) |
| 5 Years | 0 (0.0%) | 2 (100.0%) |
| 6 to 11 Years | 2 (100.0%) | 6 (100.0%) |
| 12 to 14 Years | 8 (100.0%) | 0 (0.0%) |
| 15 Years | 0 (0.0%) | 0 (0.0%) |
| 16 and 17 Years | 1 (100.0%) | 14 (93.3%) |
| 18 to 24 Years | 6 (54.5%) | 4 (100.0%) |
| 25 to 34 Years | 6 (100.0%) | 5 (100.0%) |
| 35 to 44 Years | 6 (100.0%) | 2 (100.0%) |
| 45 to 54 Years | 12 (100.0%) | 28 (100.0%) |
| 55 to 64 Years | 9 (100.0%) | 11 (84.6%) |
| 65 to 74 Years | 20 (100.0%) | 26 (96.3%) |
| 75 Years and over | 9 (100.0%) | 31 (100.0%) |
| Total | 84 (94.4%) | 133 (97.1%) |
Income Below Poverty Among Married-Couple Families in North Bay
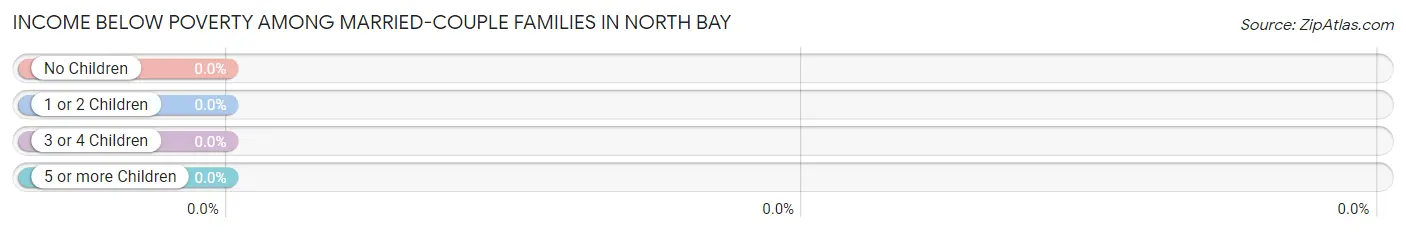
| Children | Above Poverty | Below Poverty |
| No Children | 45 (100.0%) | 0 (0.0%) |
| 1 or 2 Children | 21 (100.0%) | 0 (0.0%) |
| 3 or 4 Children | 2 (100.0%) | 0 (0.0%) |
| 5 or more Children | 0 (0.0%) | 0 (0.0%) |
| Total | 68 (100.0%) | 0 (0.0%) |
Income Below Poverty Among Single-Parent Households in North Bay
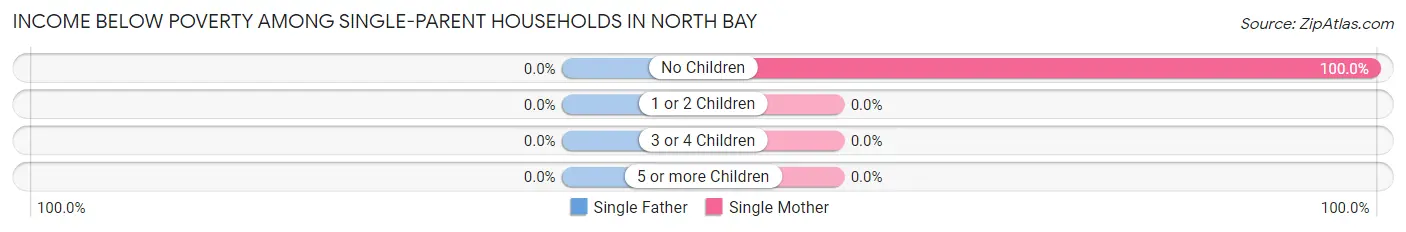
| Children | Single Father | Single Mother |
| No Children | 0 (0.0%) | 2 (100.0%) |
| 1 or 2 Children | 0 (0.0%) | 0 (0.0%) |
| 3 or 4 Children | 0 (0.0%) | 0 (0.0%) |
| 5 or more Children | 0 (0.0%) | 0 (0.0%) |
| Total | 0 (0.0%) | 2 (25.0%) |
Income Below Poverty Among Married-Couple vs Single-Parent Households in North Bay
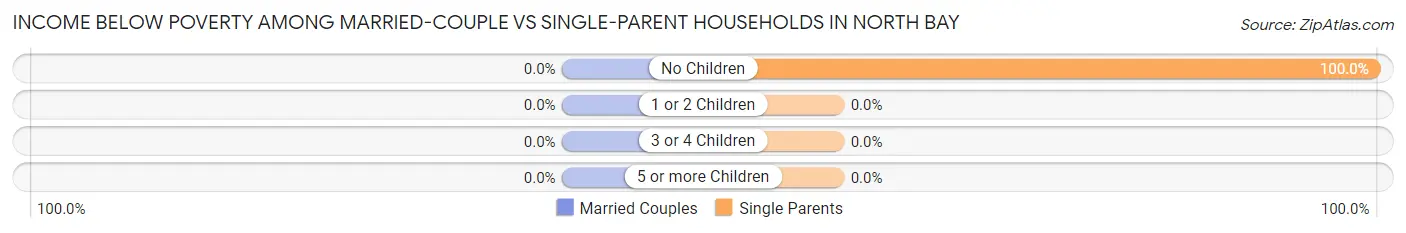
| Children | Married-Couple Families | Single-Parent Households |
| No Children | 0 (0.0%) | 2 (100.0%) |
| 1 or 2 Children | 0 (0.0%) | 0 (0.0%) |
| 3 or 4 Children | 0 (0.0%) | 0 (0.0%) |
| 5 or more Children | 0 (0.0%) | 0 (0.0%) |
| Total | 0 (0.0%) | 2 (25.0%) |
Race in North Bay
The most populous races in North Bay are White / Caucasian (206 | 90.7%), Two or more Races (16 | 7.0%), and Hispanic or Latino (12 | 5.3%).
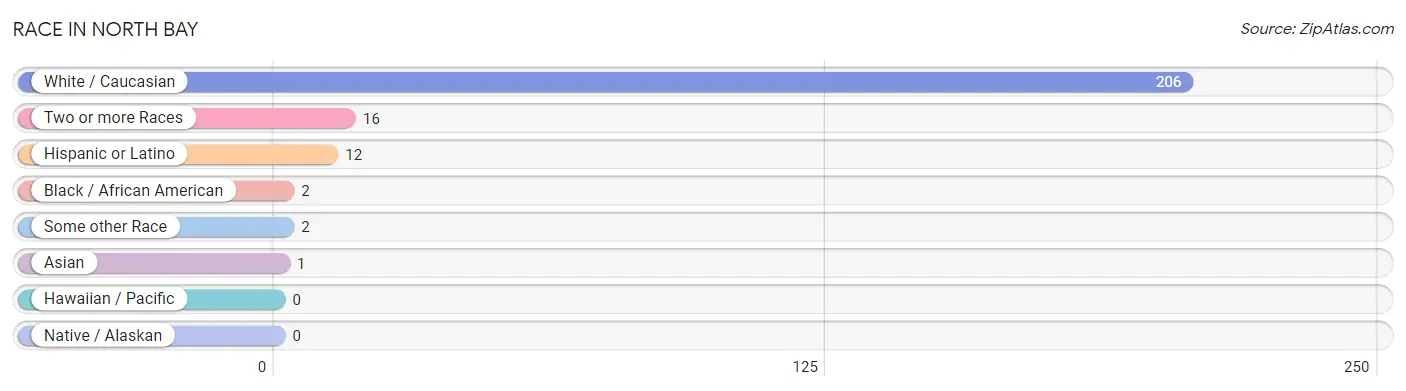
| Race | # Population | % Population |
| Asian | 1 | 0.4% |
| Black / African American | 2 | 0.9% |
| Hawaiian / Pacific | 0 | 0.0% |
| Hispanic or Latino | 12 | 5.3% |
| Native / Alaskan | 0 | 0.0% |
| White / Caucasian | 206 | 90.7% |
| Two or more Races | 16 | 7.0% |
| Some other Race | 2 | 0.9% |
| Total | 227 | 100.0% |
Ancestry in North Bay
The most populous ancestries reported in North Bay are German (75 | 33.0%), Irish (66 | 29.1%), Austrian (25 | 11.0%), Italian (24 | 10.6%), and Polish (23 | 10.1%), together accounting for 93.8% of all North Bay residents.
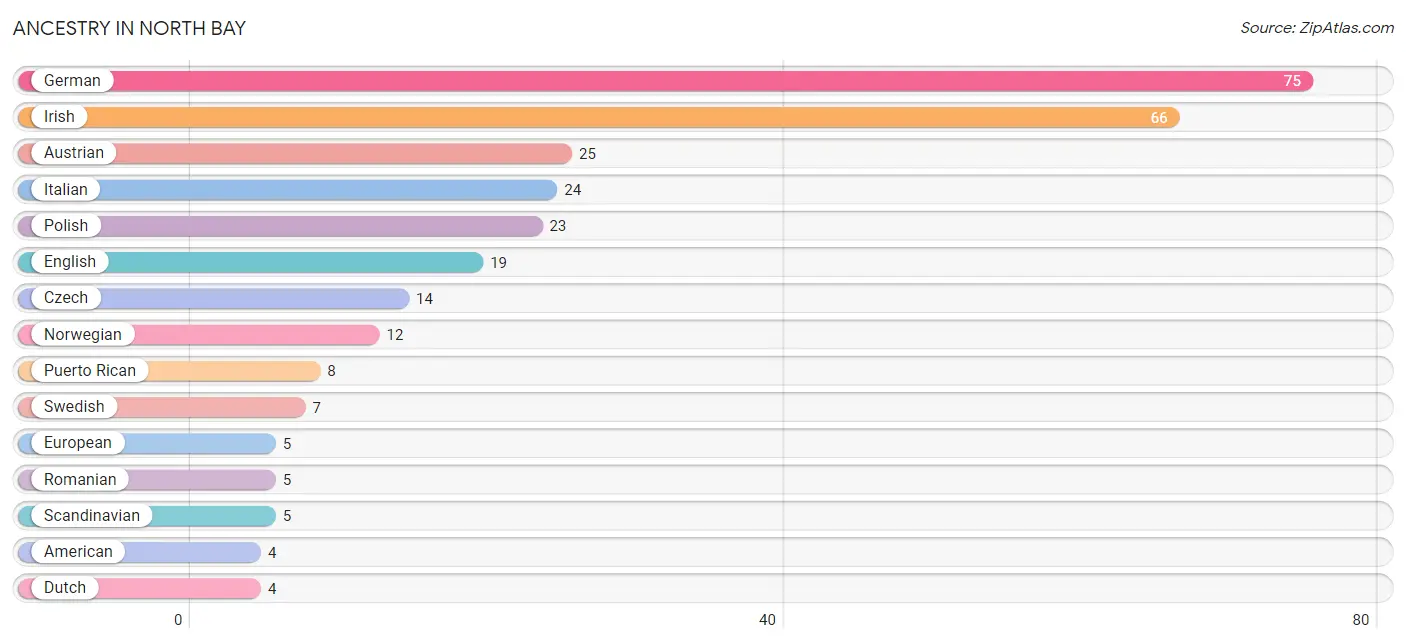
| Ancestry | # Population | % Population |
| American | 4 | 1.8% |
| Austrian | 25 | 11.0% |
| British | 2 | 0.9% |
| Croatian | 2 | 0.9% |
| Czech | 14 | 6.2% |
| Danish | 2 | 0.9% |
| Dutch | 4 | 1.8% |
| English | 19 | 8.4% |
| European | 5 | 2.2% |
| German | 75 | 33.0% |
| Hungarian | 1 | 0.4% |
| Indian (Asian) | 1 | 0.4% |
| Irish | 66 | 29.1% |
| Italian | 24 | 10.6% |
| Mexican | 2 | 0.9% |
| Norwegian | 12 | 5.3% |
| Peruvian | 2 | 0.9% |
| Polish | 23 | 10.1% |
| Puerto Rican | 8 | 3.5% |
| Romanian | 5 | 2.2% |
| Russian | 1 | 0.4% |
| Scandinavian | 5 | 2.2% |
| Scotch-Irish | 2 | 0.9% |
| Scottish | 3 | 1.3% |
| Slovene | 1 | 0.4% |
| South American | 2 | 0.9% |
| Swedish | 7 | 3.1% |
| Welsh | 3 | 1.3% | View All 28 Rows |
Immigrants in North Bay
The most numerous immigrant groups reported in North Bay came from Latin America (3 | 1.3%), Canada (2 | 0.9%), Peru (2 | 0.9%), South America (2 | 0.9%), and Asia (1 | 0.4%), together accounting for 4.4% of all North Bay residents.
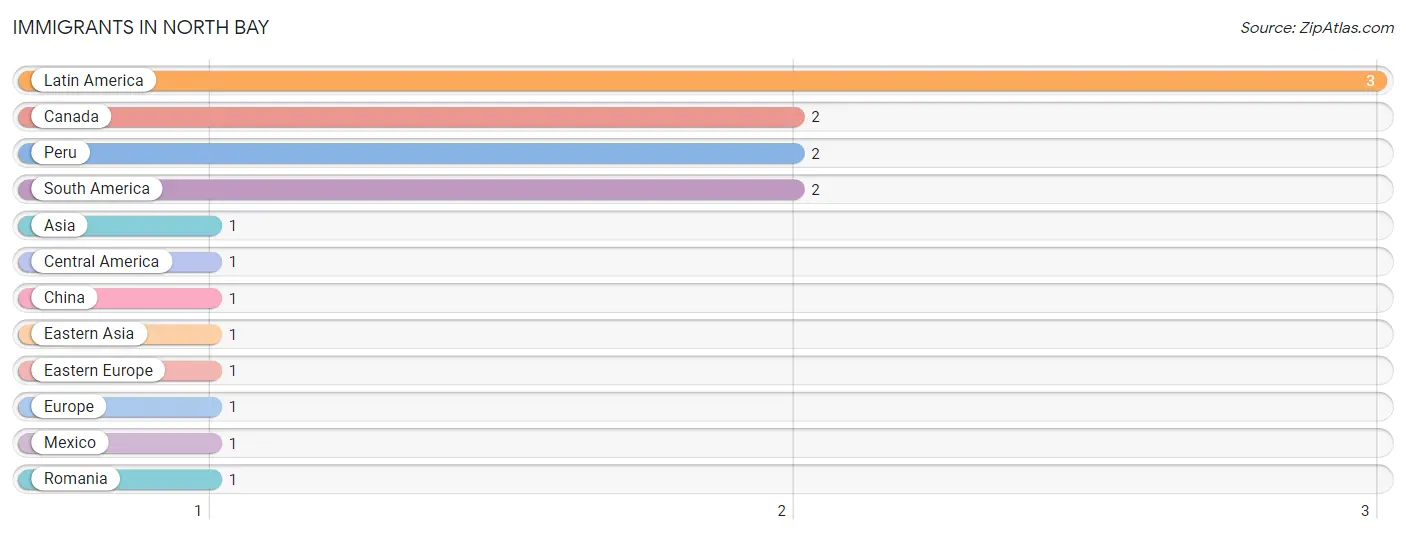
| Immigration Origin | # Population | % Population |
| Asia | 1 | 0.4% |
| Canada | 2 | 0.9% |
| Central America | 1 | 0.4% |
| China | 1 | 0.4% |
| Eastern Asia | 1 | 0.4% |
| Eastern Europe | 1 | 0.4% |
| Europe | 1 | 0.4% |
| Latin America | 3 | 1.3% |
| Mexico | 1 | 0.4% |
| Peru | 2 | 0.9% |
| Romania | 1 | 0.4% |
| South America | 2 | 0.9% | View All 12 Rows |
Sex and Age in North Bay
Sex and Age in North Bay
The most populous age groups in North Bay are 15 to 19 Years (12 | 13.3%) for men and 75 to 79 Years (26 | 19.0%) for women.
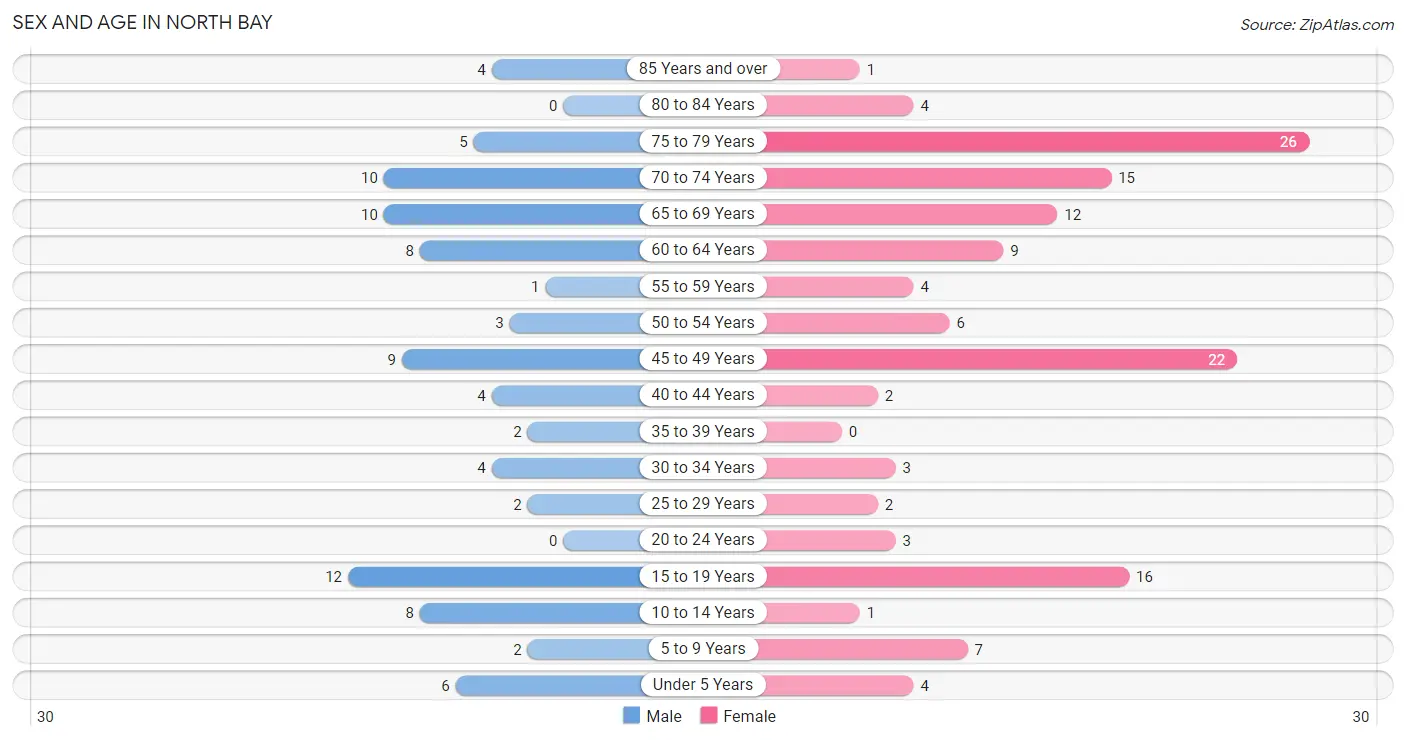
| Age Bracket | Male | Female |
| Under 5 Years | 6 (6.7%) | 4 (2.9%) |
| 5 to 9 Years | 2 (2.2%) | 7 (5.1%) |
| 10 to 14 Years | 8 (8.9%) | 1 (0.7%) |
| 15 to 19 Years | 12 (13.3%) | 16 (11.7%) |
| 20 to 24 Years | 0 (0.0%) | 3 (2.2%) |
| 25 to 29 Years | 2 (2.2%) | 2 (1.5%) |
| 30 to 34 Years | 4 (4.4%) | 3 (2.2%) |
| 35 to 39 Years | 2 (2.2%) | 0 (0.0%) |
| 40 to 44 Years | 4 (4.4%) | 2 (1.5%) |
| 45 to 49 Years | 9 (10.0%) | 22 (16.1%) |
| 50 to 54 Years | 3 (3.3%) | 6 (4.4%) |
| 55 to 59 Years | 1 (1.1%) | 4 (2.9%) |
| 60 to 64 Years | 8 (8.9%) | 9 (6.6%) |
| 65 to 69 Years | 10 (11.1%) | 12 (8.8%) |
| 70 to 74 Years | 10 (11.1%) | 15 (11.0%) |
| 75 to 79 Years | 5 (5.6%) | 26 (19.0%) |
| 80 to 84 Years | 0 (0.0%) | 4 (2.9%) |
| 85 Years and over | 4 (4.4%) | 1 (0.7%) |
| Total | 90 (100.0%) | 137 (100.0%) |
Families and Households in North Bay
Median Family Size in North Bay
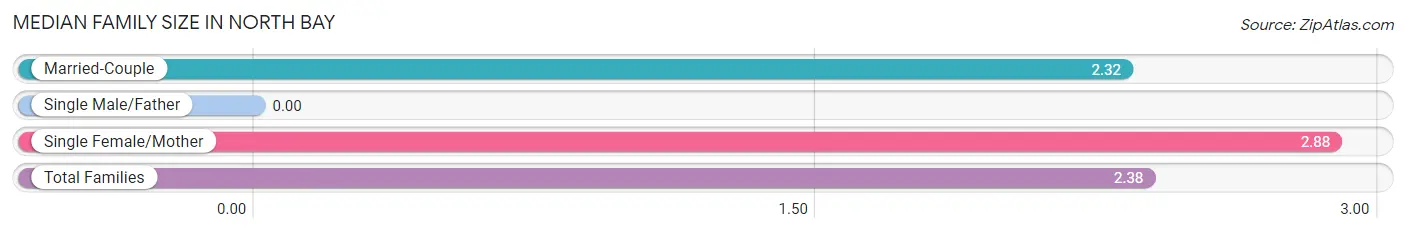
| Family Type | # Families | Family Size |
| Married-Couple | 68 (89.5%) | 2.32 |
| Single Male/Father | 0 (0.0%) | - |
| Single Female/Mother | 8 (10.5%) | 2.88 |
| Total Families | 76 (100.0%) | 2.38 |
Median Household Size in North Bay
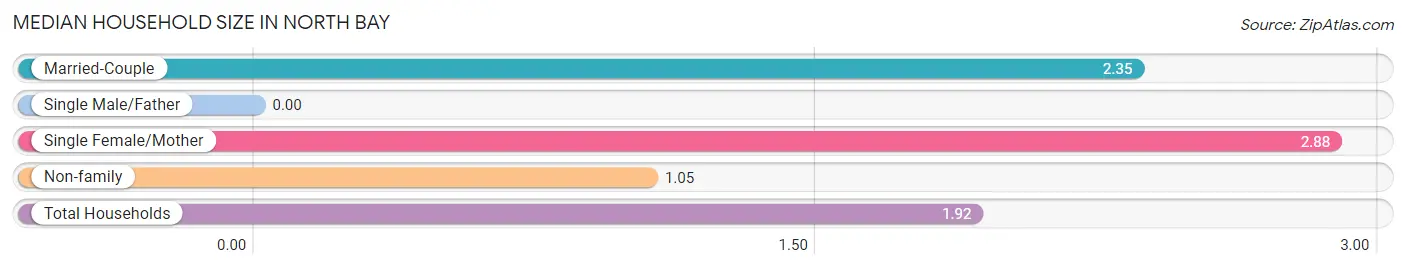
| Household Type | # Households | Household Size |
| Married-Couple | 68 (57.6%) | 2.35 |
| Single Male/Father | 0 (0.0%) | - |
| Single Female/Mother | 8 (6.8%) | 2.88 |
| Non-family | 42 (35.6%) | 1.05 |
| Total Households | 118 (100.0%) | 1.92 |
Household Size by Marriage Status in North Bay
Out of a total of 118 households in North Bay, 76 (64.4%) are family households, while 42 (35.6%) are nonfamily households. The most numerous type of family households are 2-person households, comprising 42, and the most common type of nonfamily households are 1-person households, comprising 41.
| Household Size | Family Households | Nonfamily Households |
| 1-Person Households | - | 41 (34.7%) |
| 2-Person Households | 42 (35.6%) | 1 (0.9%) |
| 3-Person Households | 13 (11.0%) | 0 (0.0%) |
| 4-Person Households | 19 (16.1%) | 0 (0.0%) |
| 5-Person Households | 2 (1.7%) | 0 (0.0%) |
| 6-Person Households | 0 (0.0%) | 0 (0.0%) |
| 7+ Person Households | 0 (0.0%) | 0 (0.0%) |
| Total | 76 (64.4%) | 42 (35.6%) |
Female Fertility in North Bay
Fertility by Age in North Bay
Average fertility rate in North Bay is 41.0 births per 1,000 women. Women in the age bracket of 20 to 34 years have the highest fertility rate with 250.0 births per 1,000 women. Women in the age bracket of 20 to 34 years acount for 100.0% of all women with births.
| Age Bracket | Women with Births | Births / 1,000 Women |
| 15 to 19 years | 0 (0.0%) | 0.0 |
| 20 to 34 years | 2 (100.0%) | 250.0 |
| 35 to 50 years | 0 (0.0%) | 0.0 |
| Total | 2 (100.0%) | 41.0 |
Fertility by Age by Marriage Status in North Bay
| Age Bracket | Married | Unmarried |
| 15 to 19 years | 0 (0.0%) | 0 (0.0%) |
| 20 to 34 years | 2 (100.0%) | 0 (0.0%) |
| 35 to 50 years | 0 (0.0%) | 0 (0.0%) |
| Total | 2 (100.0%) | 0 (0.0%) |
Fertility by Education in North Bay
| Educational Attainment | Women with Births | Births / 1,000 Women |
| Less than High School | 0 (0.0%) | 0.0 |
| High School Diploma | 0 (0.0%) | 0.0 |
| College or Associate's Degree | 0 (0.0%) | 0.0 |
| Bachelor's Degree | 2 (100.0%) | 250.0 |
| Graduate Degree | 0 (0.0%) | 0.0 |
| Total | 2 (100.0%) | 41.0 |
Fertility by Education by Marriage Status in North Bay
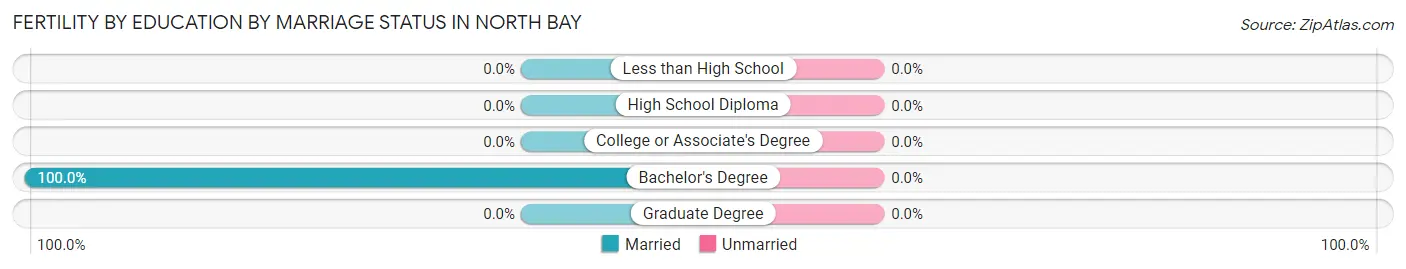
| Educational Attainment | Married | Unmarried |
| Less than High School | 0 (0.0%) | 0 (0.0%) |
| High School Diploma | 0 (0.0%) | 0 (0.0%) |
| College or Associate's Degree | 0 (0.0%) | 0 (0.0%) |
| Bachelor's Degree | 2 (100.0%) | 0 (0.0%) |
| Graduate Degree | 0 (0.0%) | 0 (0.0%) |
| Total | 2 (100.0%) | 0 (0.0%) |
Employment Characteristics in North Bay
Employment by Class of Employer in North Bay
Among the 83 employed individuals in North Bay, private company employees (56 | 67.5%), self-employed (incorporated) (10 | 12.0%), and not-for-profit organizations (5 | 6.0%) make up the most common classes of employment.
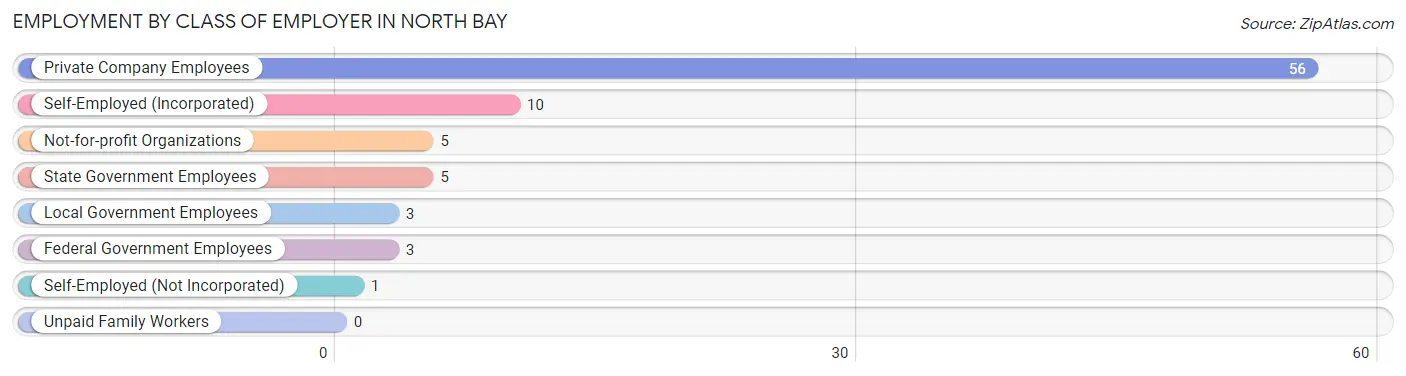
| Employer Class | # Employees | % Employees |
| Private Company Employees | 56 | 67.5% |
| Self-Employed (Incorporated) | 10 | 12.0% |
| Self-Employed (Not Incorporated) | 1 | 1.2% |
| Not-for-profit Organizations | 5 | 6.0% |
| Local Government Employees | 3 | 3.6% |
| State Government Employees | 5 | 6.0% |
| Federal Government Employees | 3 | 3.6% |
| Unpaid Family Workers | 0 | 0.0% |
| Total | 83 | 100.0% |
Employment Status by Age in North Bay
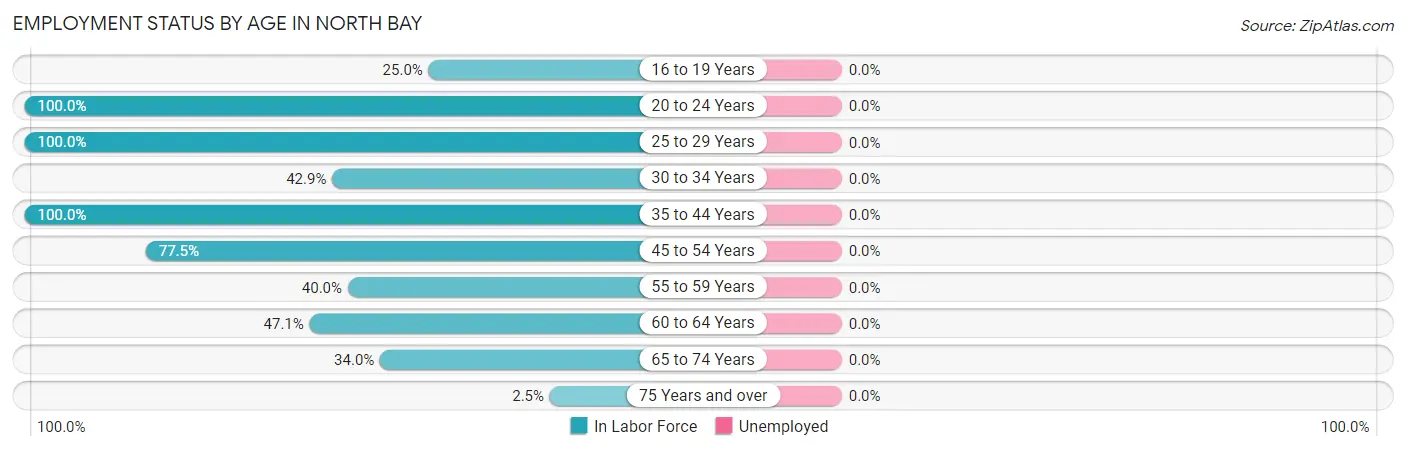
| Age Bracket | In Labor Force | Unemployed |
| 16 to 19 Years | 7 (25.0%) | 0 (0.0%) |
| 20 to 24 Years | 3 (100.0%) | 0 (0.0%) |
| 25 to 29 Years | 4 (100.0%) | 0 (0.0%) |
| 30 to 34 Years | 3 (42.9%) | 0 (0.0%) |
| 35 to 44 Years | 8 (100.0%) | 0 (0.0%) |
| 45 to 54 Years | 31 (77.5%) | 0 (0.0%) |
| 55 to 59 Years | 2 (40.0%) | 0 (0.0%) |
| 60 to 64 Years | 8 (47.1%) | 0 (0.0%) |
| 65 to 74 Years | 16 (34.0%) | 0 (0.0%) |
| 75 Years and over | 1 (2.5%) | 0 (0.0%) |
| Total | 83 (41.7%) | 0 (0.0%) |
Employment Status by Educational Attainment in North Bay
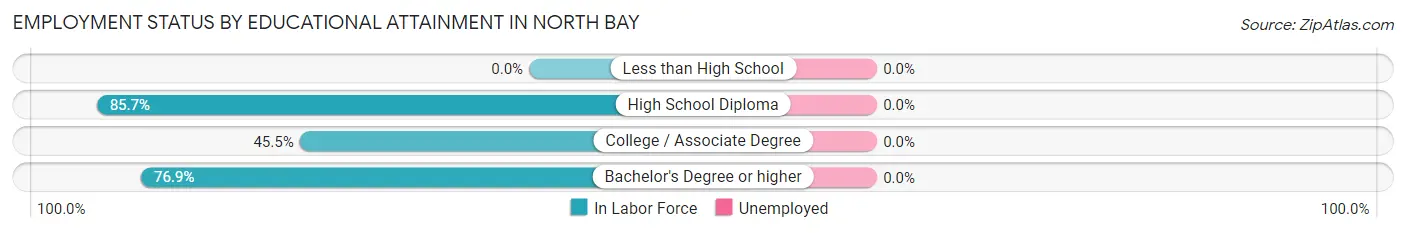
| Educational Attainment | In Labor Force | Unemployed |
| Less than High School | 0 (0.0%) | 0 (0.0%) |
| High School Diploma | 6 (85.7%) | 0 (0.0%) |
| College / Associate Degree | 10 (45.5%) | 0 (0.0%) |
| Bachelor's Degree or higher | 40 (76.9%) | 0 (0.0%) |
| Total | 56 (69.1%) | 0 (0.0%) |
Employment Occupations by Sex in North Bay
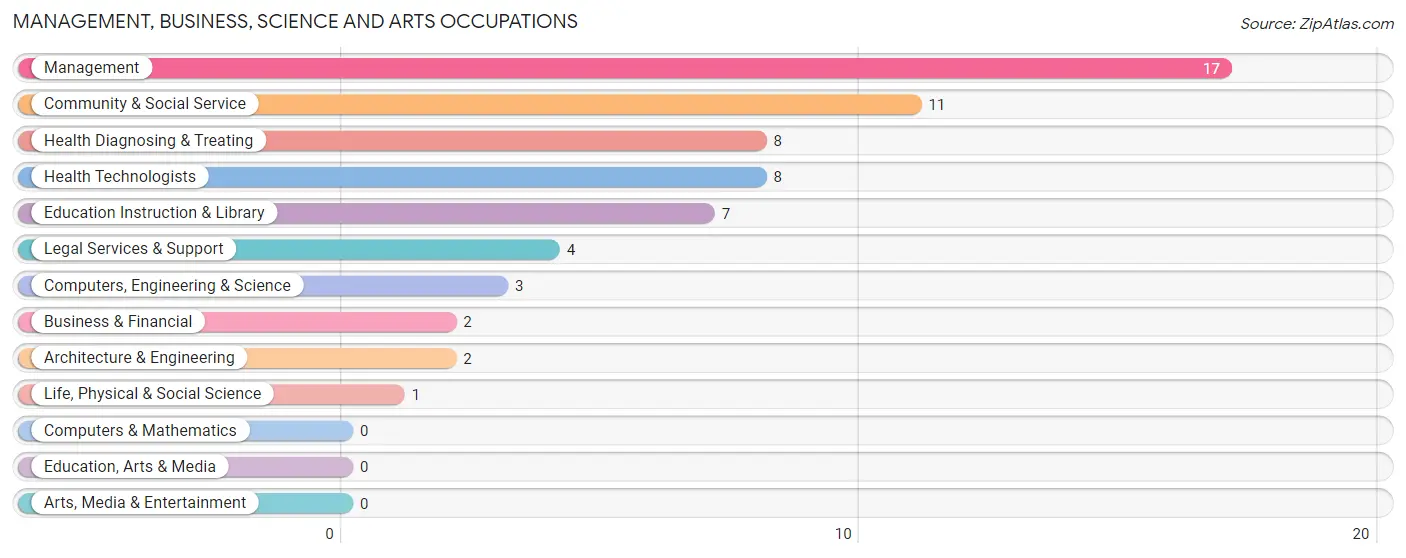
Management, Business, Science and Arts Occupations
The most common Management, Business, Science and Arts occupations in North Bay are Management (17 | 20.5%), Community & Social Service (11 | 13.3%), Health Diagnosing & Treating (8 | 9.6%), Health Technologists (8 | 9.6%), and Education Instruction & Library (7 | 8.4%).
Management, Business, Science and Arts Occupations by Sex
Within the Management, Business, Science and Arts occupations in North Bay, the most male-oriented occupations are Business & Financial (100.0%), Architecture & Engineering (100.0%), and Legal Services & Support (100.0%), while the most female-oriented occupations are Life, Physical & Social Science (100.0%), Health Diagnosing & Treating (87.5%), and Health Technologists (87.5%).
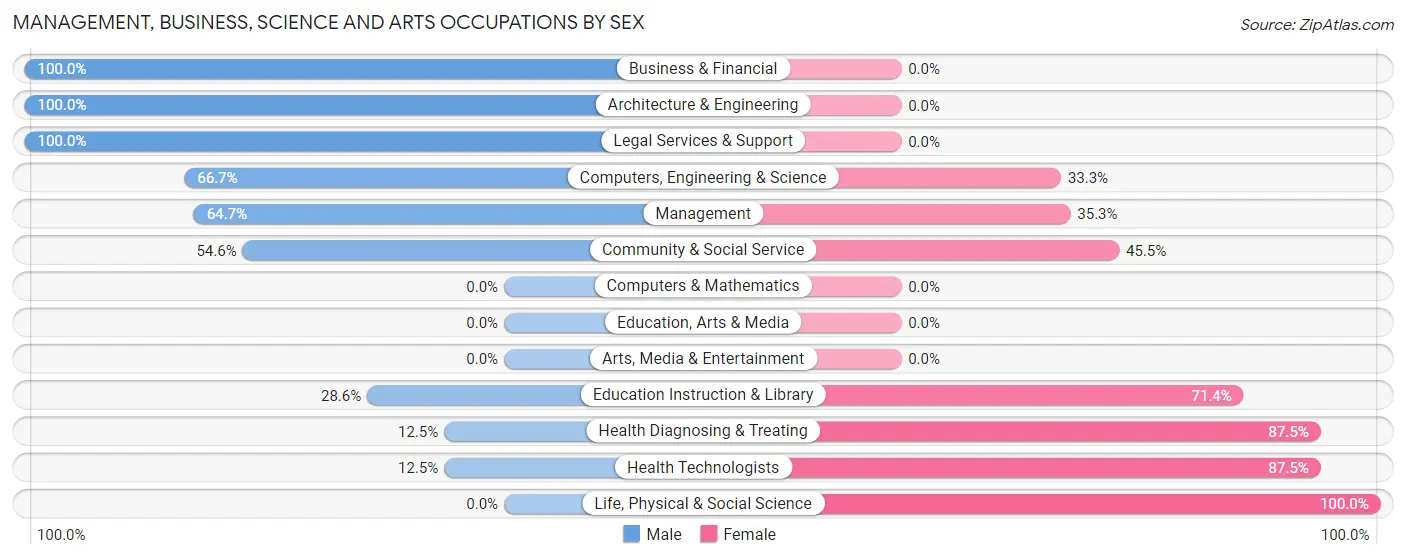
| Occupation | Male | Female |
| Management | 11 (64.7%) | 6 (35.3%) |
| Business & Financial | 2 (100.0%) | 0 (0.0%) |
| Computers, Engineering & Science | 2 (66.7%) | 1 (33.3%) |
| Computers & Mathematics | 0 (0.0%) | 0 (0.0%) |
| Architecture & Engineering | 2 (100.0%) | 0 (0.0%) |
| Life, Physical & Social Science | 0 (0.0%) | 1 (100.0%) |
| Community & Social Service | 6 (54.5%) | 5 (45.5%) |
| Education, Arts & Media | 0 (0.0%) | 0 (0.0%) |
| Legal Services & Support | 4 (100.0%) | 0 (0.0%) |
| Education Instruction & Library | 2 (28.6%) | 5 (71.4%) |
| Arts, Media & Entertainment | 0 (0.0%) | 0 (0.0%) |
| Health Diagnosing & Treating | 1 (12.5%) | 7 (87.5%) |
| Health Technologists | 1 (12.5%) | 7 (87.5%) |
| Total (Category) | 22 (53.7%) | 19 (46.3%) |
| Total (Overall) | 43 (51.8%) | 40 (48.2%) |
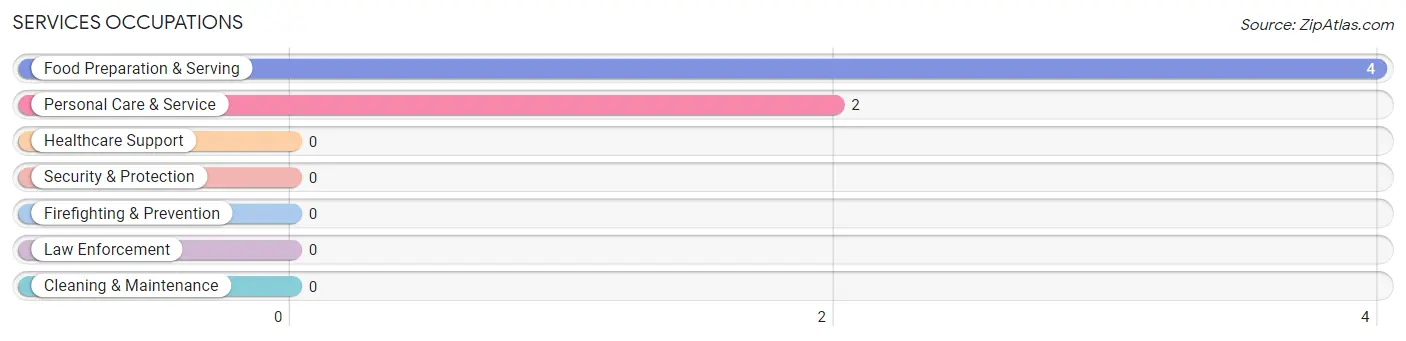
Services Occupations
The most common Services occupations in North Bay are Food Preparation & Serving (4 | 4.8%), and Personal Care & Service (2 | 2.4%).
Services Occupations by Sex
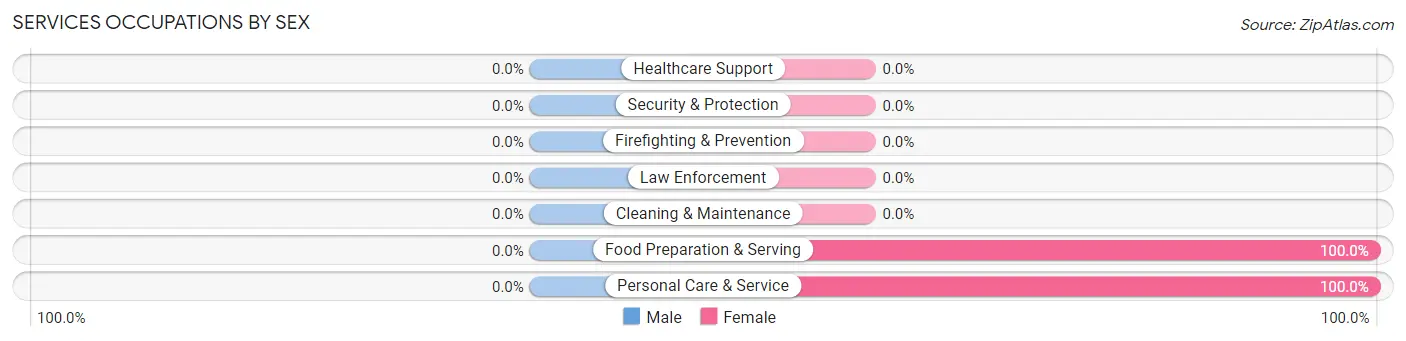
| Occupation | Male | Female |
| Healthcare Support | 0 (0.0%) | 0 (0.0%) |
| Security & Protection | 0 (0.0%) | 0 (0.0%) |
| Firefighting & Prevention | 0 (0.0%) | 0 (0.0%) |
| Law Enforcement | 0 (0.0%) | 0 (0.0%) |
| Food Preparation & Serving | 0 (0.0%) | 4 (100.0%) |
| Cleaning & Maintenance | 0 (0.0%) | 0 (0.0%) |
| Personal Care & Service | 0 (0.0%) | 2 (100.0%) |
| Total (Category) | 0 (0.0%) | 6 (100.0%) |
| Total (Overall) | 43 (51.8%) | 40 (48.2%) |
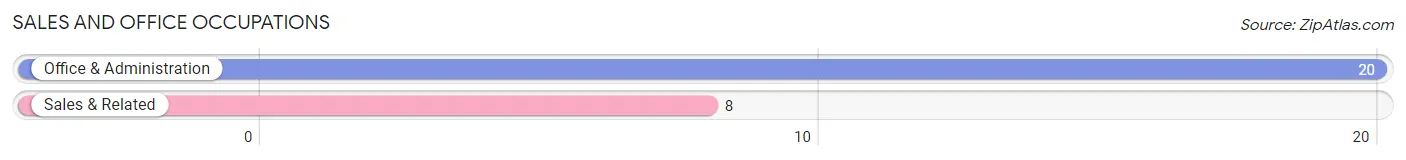
Sales and Office Occupations
The most common Sales and Office occupations in North Bay are Office & Administration (20 | 24.1%), and Sales & Related (8 | 9.6%).
Sales and Office Occupations by Sex
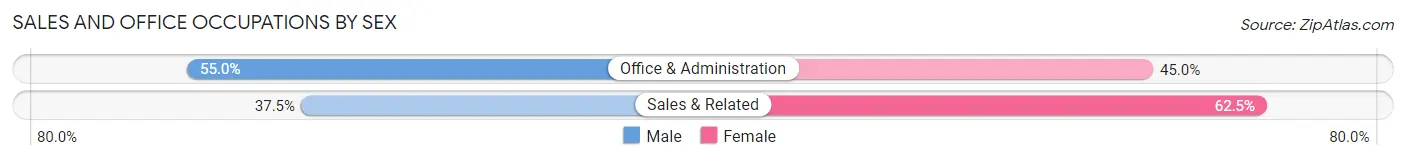
| Occupation | Male | Female |
| Sales & Related | 3 (37.5%) | 5 (62.5%) |
| Office & Administration | 11 (55.0%) | 9 (45.0%) |
| Total (Category) | 14 (50.0%) | 14 (50.0%) |
| Total (Overall) | 43 (51.8%) | 40 (48.2%) |
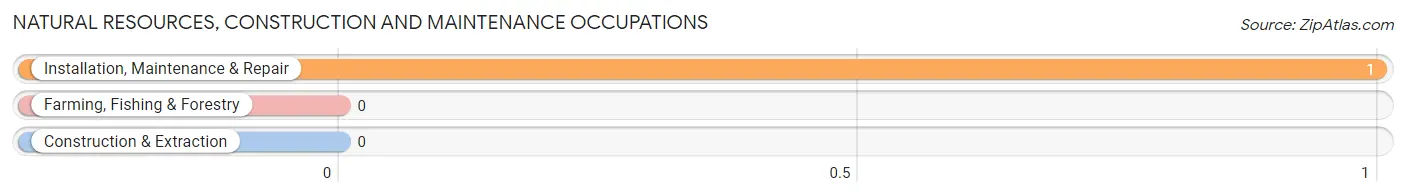
Natural Resources, Construction and Maintenance Occupations
The most common Natural Resources, Construction and Maintenance occupations in North Bay are , and Installation, Maintenance & Repair (1 | 1.2%).
Natural Resources, Construction and Maintenance Occupations by Sex
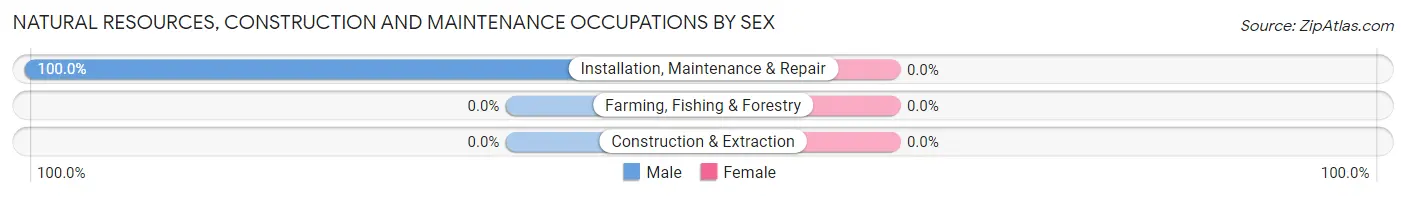
| Occupation | Male | Female |
| Farming, Fishing & Forestry | 0 (0.0%) | 0 (0.0%) |
| Construction & Extraction | 0 (0.0%) | 0 (0.0%) |
| Installation, Maintenance & Repair | 1 (100.0%) | 0 (0.0%) |
| Total (Category) | 1 (100.0%) | 0 (0.0%) |
| Total (Overall) | 43 (51.8%) | 40 (48.2%) |
Production, Transportation and Moving Occupations
The most common Production, Transportation and Moving occupations in North Bay are Production (5 | 6.0%), Transportation (1 | 1.2%), and Material Moving (1 | 1.2%).
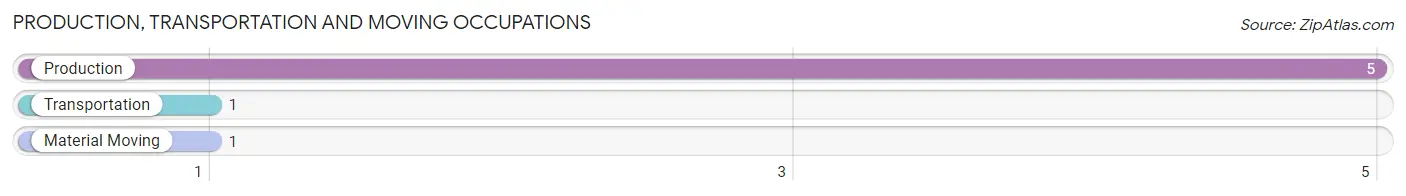
Production, Transportation and Moving Occupations by Sex
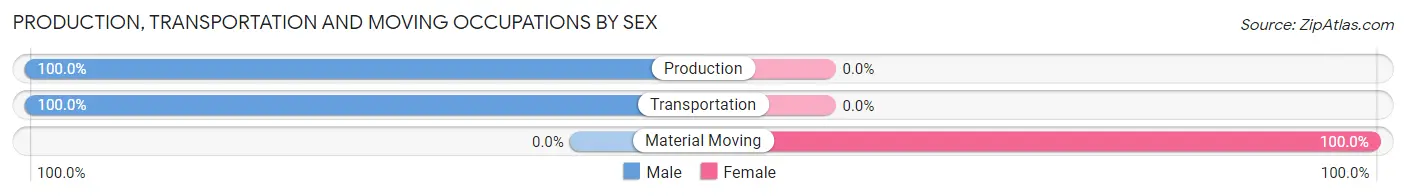
| Occupation | Male | Female |
| Production | 5 (100.0%) | 0 (0.0%) |
| Transportation | 1 (100.0%) | 0 (0.0%) |
| Material Moving | 0 (0.0%) | 1 (100.0%) |
| Total (Category) | 6 (85.7%) | 1 (14.3%) |
| Total (Overall) | 43 (51.8%) | 40 (48.2%) |
Employment Industries by Sex in North Bay
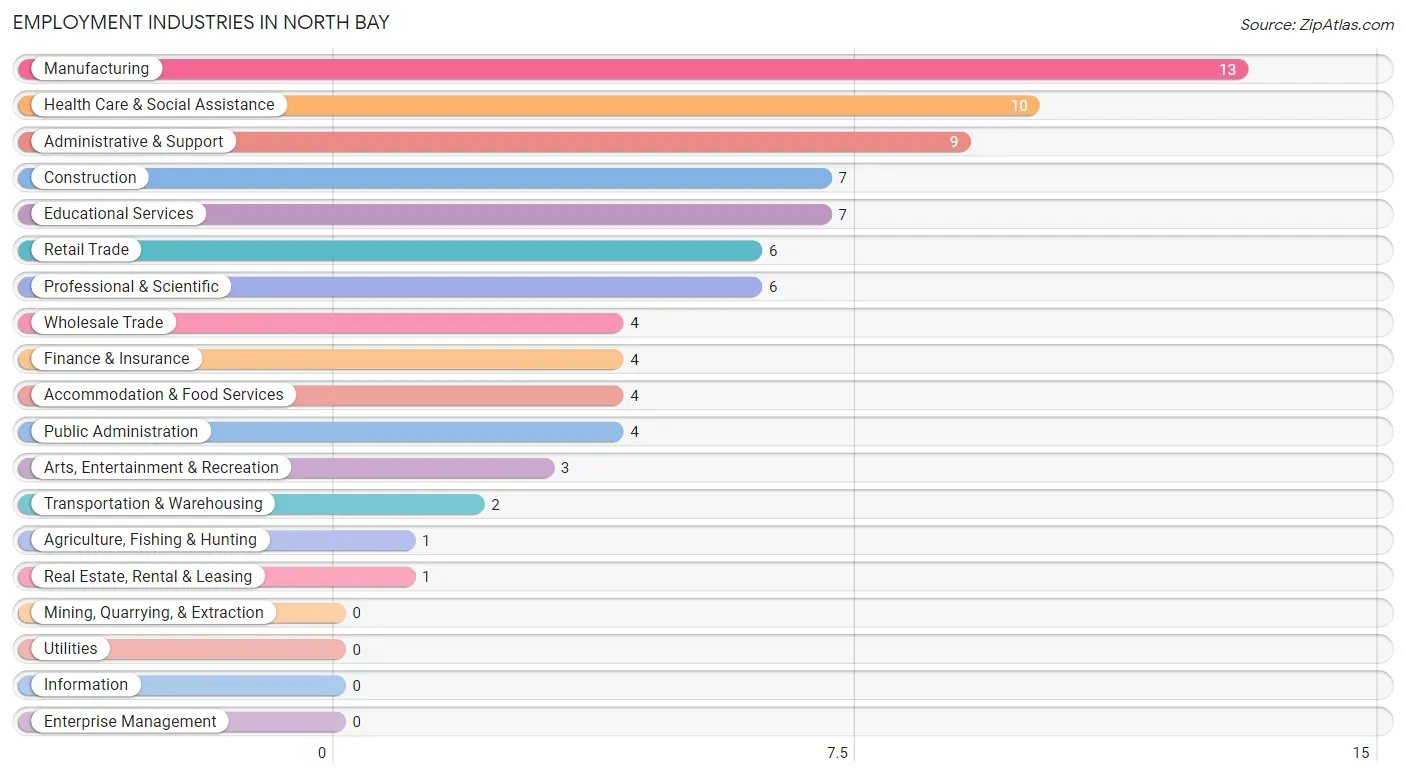
Employment Industries in North Bay
The major employment industries in North Bay include Manufacturing (13 | 15.7%), Health Care & Social Assistance (10 | 12.0%), Administrative & Support (9 | 10.8%), Construction (7 | 8.4%), and Educational Services (7 | 8.4%).
Employment Industries by Sex in North Bay
The North Bay industries that see more men than women are Agriculture, Fishing & Hunting (100.0%), Transportation & Warehousing (100.0%), and Real Estate, Rental & Leasing (100.0%), whereas the industries that tend to have a higher number of women are Accommodation & Food Services (100.0%), Construction (85.7%), and Retail Trade (83.3%).
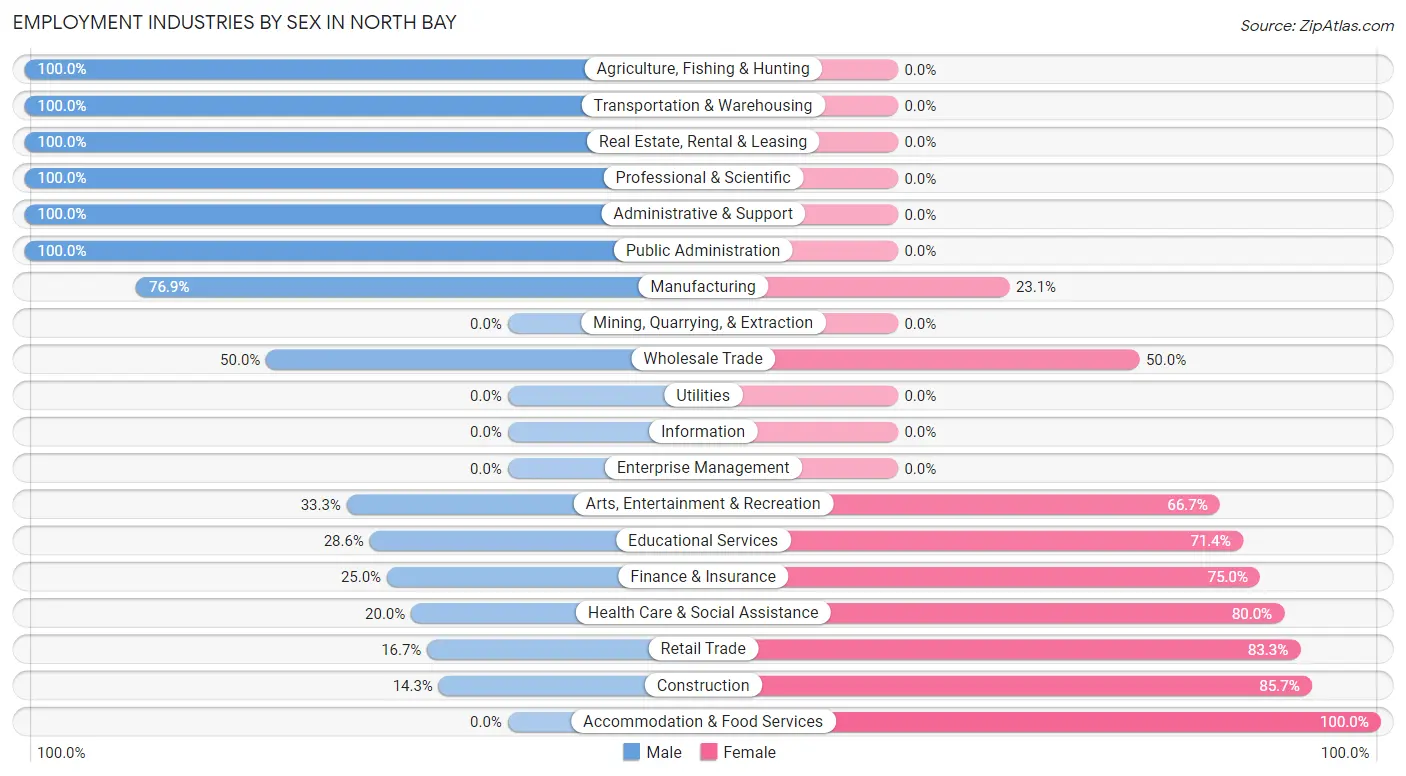
| Industry | Male | Female |
| Agriculture, Fishing & Hunting | 1 (100.0%) | 0 (0.0%) |
| Mining, Quarrying, & Extraction | 0 (0.0%) | 0 (0.0%) |
| Construction | 1 (14.3%) | 6 (85.7%) |
| Manufacturing | 10 (76.9%) | 3 (23.1%) |
| Wholesale Trade | 2 (50.0%) | 2 (50.0%) |
| Retail Trade | 1 (16.7%) | 5 (83.3%) |
| Transportation & Warehousing | 2 (100.0%) | 0 (0.0%) |
| Utilities | 0 (0.0%) | 0 (0.0%) |
| Information | 0 (0.0%) | 0 (0.0%) |
| Finance & Insurance | 1 (25.0%) | 3 (75.0%) |
| Real Estate, Rental & Leasing | 1 (100.0%) | 0 (0.0%) |
| Professional & Scientific | 6 (100.0%) | 0 (0.0%) |
| Enterprise Management | 0 (0.0%) | 0 (0.0%) |
| Administrative & Support | 9 (100.0%) | 0 (0.0%) |
| Educational Services | 2 (28.6%) | 5 (71.4%) |
| Health Care & Social Assistance | 2 (20.0%) | 8 (80.0%) |
| Arts, Entertainment & Recreation | 1 (33.3%) | 2 (66.7%) |
| Accommodation & Food Services | 0 (0.0%) | 4 (100.0%) |
| Public Administration | 4 (100.0%) | 0 (0.0%) |
| Total | 43 (51.8%) | 40 (48.2%) |
Education in North Bay
School Enrollment in North Bay
The most common levels of schooling among the 52 students in North Bay are high school (19 | 36.5%), college / undergraduate (16 | 30.8%), and middle school (6 | 11.5%).
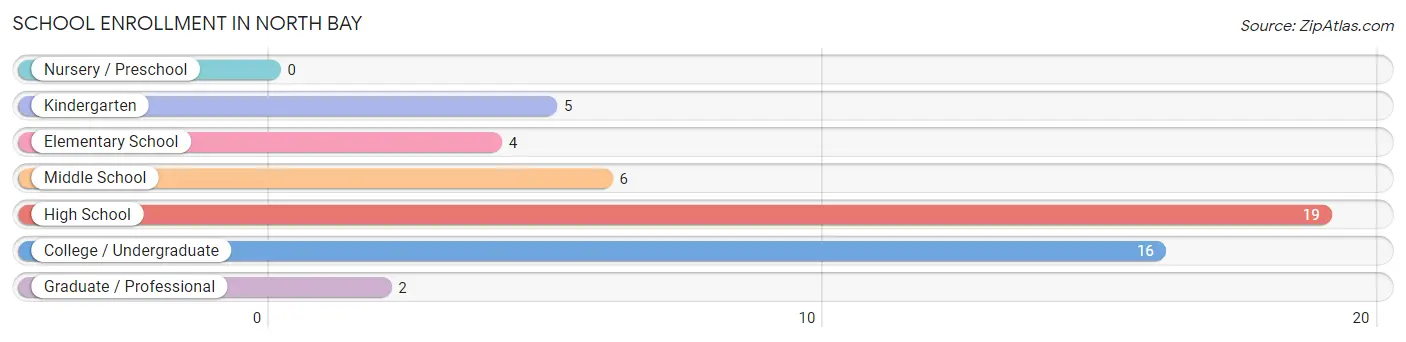
| School Level | # Students | % Students |
| Nursery / Preschool | 0 | 0.0% |
| Kindergarten | 5 | 9.6% |
| Elementary School | 4 | 7.7% |
| Middle School | 6 | 11.5% |
| High School | 19 | 36.5% |
| College / Undergraduate | 16 | 30.8% |
| Graduate / Professional | 2 | 3.8% |
| Total | 52 | 100.0% |
School Enrollment by Age by Funding Source in North Bay
Out of a total of 52 students who are enrolled in schools in North Bay, 33 (63.5%) attend a private institution, while the remaining 19 (36.5%) are enrolled in public schools. The age group of 5 to 9 year old has the highest likelihood of being enrolled in private schools, with 9 (100.0% in the age bracket) enrolled. Conversely, the age group of 20 to 24 year olds has the lowest likelihood of being enrolled in a private school, with 3 (100.0% in the age bracket) attending a public institution.
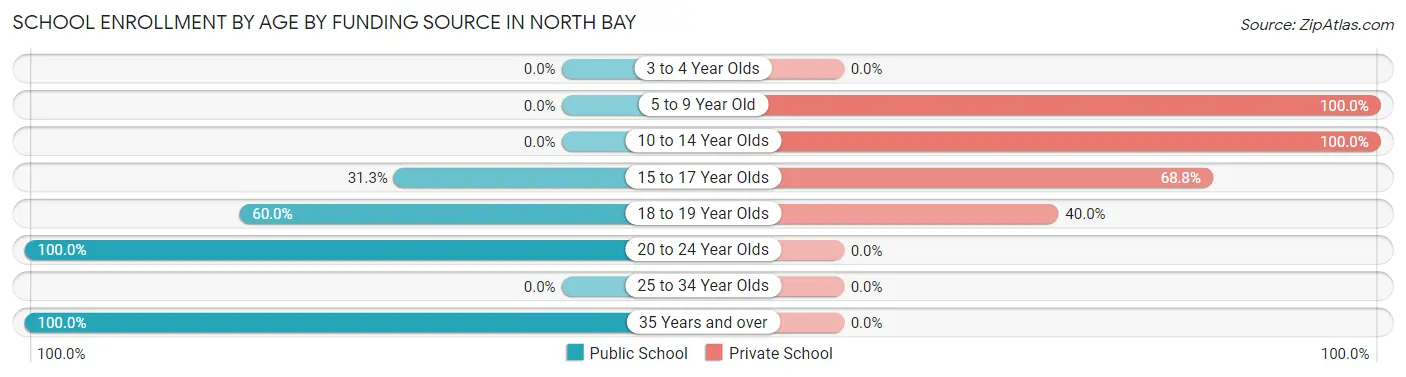
| Age Bracket | Public School | Private School |
| 3 to 4 Year Olds | 0 (0.0%) | 0 (0.0%) |
| 5 to 9 Year Old | 0 (0.0%) | 9 (100.0%) |
| 10 to 14 Year Olds | 0 (0.0%) | 9 (100.0%) |
| 15 to 17 Year Olds | 5 (31.2%) | 11 (68.8%) |
| 18 to 19 Year Olds | 6 (60.0%) | 4 (40.0%) |
| 20 to 24 Year Olds | 3 (100.0%) | 0 (0.0%) |
| 25 to 34 Year Olds | 0 (0.0%) | 0 (0.0%) |
| 35 Years and over | 5 (100.0%) | 0 (0.0%) |
| Total | 19 (36.5%) | 33 (63.5%) |
Educational Attainment by Field of Study in North Bay
Visual & performing arts (29 | 17.9%), communications (27 | 16.7%), education (22 | 13.6%), business (21 | 13.0%), and science & technology (16 | 9.9%) are the most common fields of study among 162 individuals in North Bay who have obtained a bachelor's degree or higher.
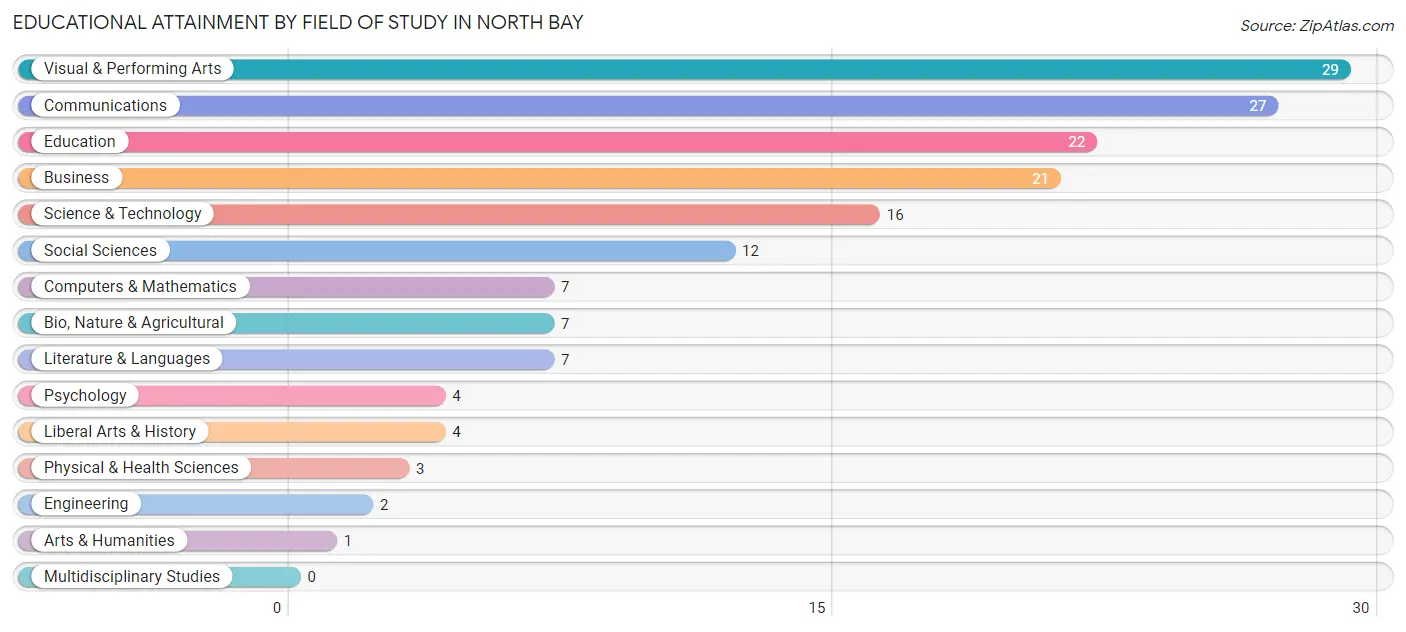
| Field of Study | # Graduates | % Graduates |
| Computers & Mathematics | 7 | 4.3% |
| Bio, Nature & Agricultural | 7 | 4.3% |
| Physical & Health Sciences | 3 | 1.8% |
| Psychology | 4 | 2.5% |
| Social Sciences | 12 | 7.4% |
| Engineering | 2 | 1.2% |
| Multidisciplinary Studies | 0 | 0.0% |
| Science & Technology | 16 | 9.9% |
| Business | 21 | 13.0% |
| Education | 22 | 13.6% |
| Literature & Languages | 7 | 4.3% |
| Liberal Arts & History | 4 | 2.5% |
| Visual & Performing Arts | 29 | 17.9% |
| Communications | 27 | 16.7% |
| Arts & Humanities | 1 | 0.6% |
| Total | 162 | 100.0% |
Transportation & Commute in North Bay
Vehicle Availability by Sex in North Bay
The most prevalent vehicle ownership categories in North Bay are males with 2 vehicles (22, accounting for 51.2%) and females with 2 vehicles (22, making up 55.0%).
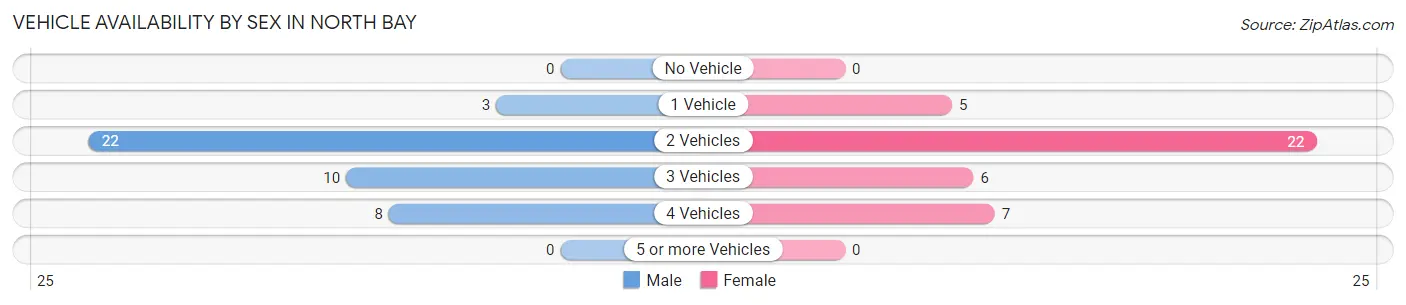
| Vehicles Available | Male | Female |
| No Vehicle | 0 (0.0%) | 0 (0.0%) |
| 1 Vehicle | 3 (7.0%) | 5 (12.5%) |
| 2 Vehicles | 22 (51.2%) | 22 (55.0%) |
| 3 Vehicles | 10 (23.3%) | 6 (15.0%) |
| 4 Vehicles | 8 (18.6%) | 7 (17.5%) |
| 5 or more Vehicles | 0 (0.0%) | 0 (0.0%) |
| Total | 43 (100.0%) | 40 (100.0%) |
Commute Time in North Bay
The most frequently occuring commute durations in North Bay are 60 to 89 minutes (12 commuters, 18.2%), 15 to 19 minutes (10 commuters, 15.1%), and 5 to 9 minutes (8 commuters, 12.1%).
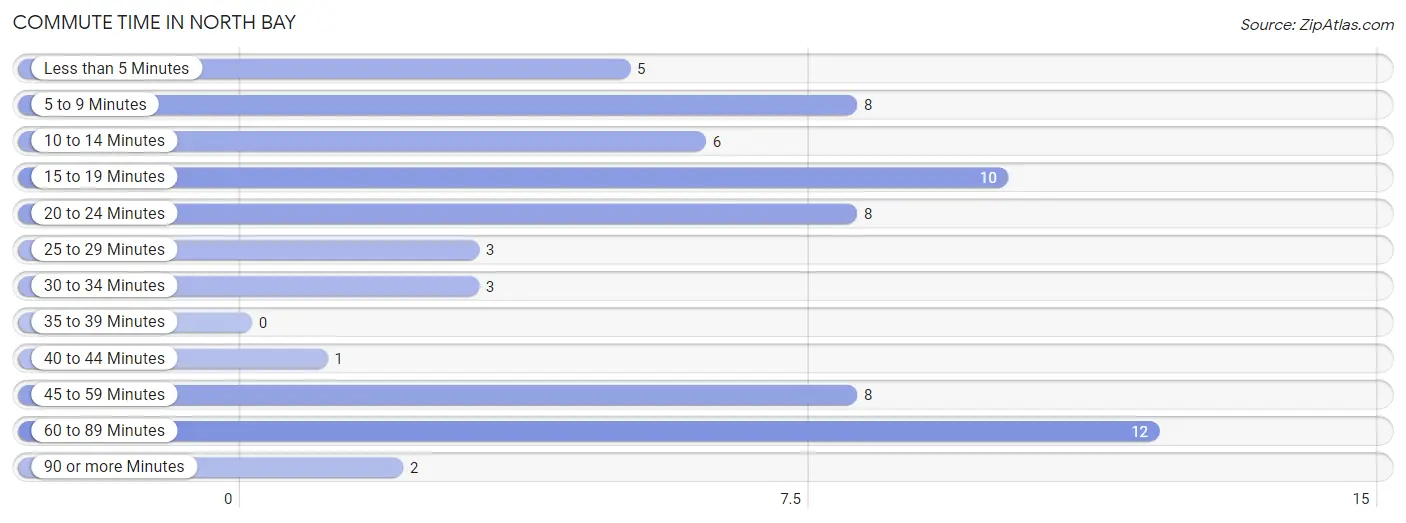
| Commute Time | # Commuters | % Commuters |
| Less than 5 Minutes | 5 | 7.6% |
| 5 to 9 Minutes | 8 | 12.1% |
| 10 to 14 Minutes | 6 | 9.1% |
| 15 to 19 Minutes | 10 | 15.1% |
| 20 to 24 Minutes | 8 | 12.1% |
| 25 to 29 Minutes | 3 | 4.5% |
| 30 to 34 Minutes | 3 | 4.5% |
| 35 to 39 Minutes | 0 | 0.0% |
| 40 to 44 Minutes | 1 | 1.5% |
| 45 to 59 Minutes | 8 | 12.1% |
| 60 to 89 Minutes | 12 | 18.2% |
| 90 or more Minutes | 2 | 3.0% |
Commute Time by Sex in North Bay
The most common commute times in North Bay are 5 to 9 minutes (7 commuters, 20.0%) for males and 15 to 19 minutes (8 commuters, 25.8%) for females.
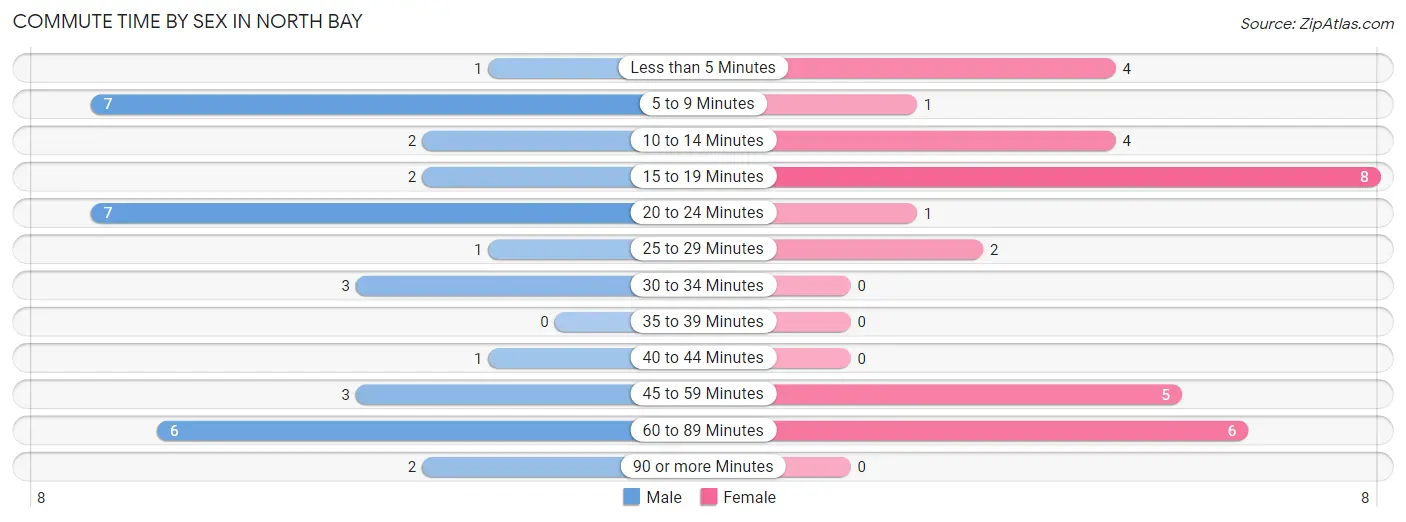
| Commute Time | Male | Female |
| Less than 5 Minutes | 1 (2.9%) | 4 (12.9%) |
| 5 to 9 Minutes | 7 (20.0%) | 1 (3.2%) |
| 10 to 14 Minutes | 2 (5.7%) | 4 (12.9%) |
| 15 to 19 Minutes | 2 (5.7%) | 8 (25.8%) |
| 20 to 24 Minutes | 7 (20.0%) | 1 (3.2%) |
| 25 to 29 Minutes | 1 (2.9%) | 2 (6.5%) |
| 30 to 34 Minutes | 3 (8.6%) | 0 (0.0%) |
| 35 to 39 Minutes | 0 (0.0%) | 0 (0.0%) |
| 40 to 44 Minutes | 1 (2.9%) | 0 (0.0%) |
| 45 to 59 Minutes | 3 (8.6%) | 5 (16.1%) |
| 60 to 89 Minutes | 6 (17.1%) | 6 (19.4%) |
| 90 or more Minutes | 2 (5.7%) | 0 (0.0%) |
Time of Departure to Work by Sex in North Bay
The most frequent times of departure to work in North Bay are 8:00 AM to 8:29 AM (12, 34.3%) for males and 6:00 AM to 6:29 AM (8, 25.8%) for females.
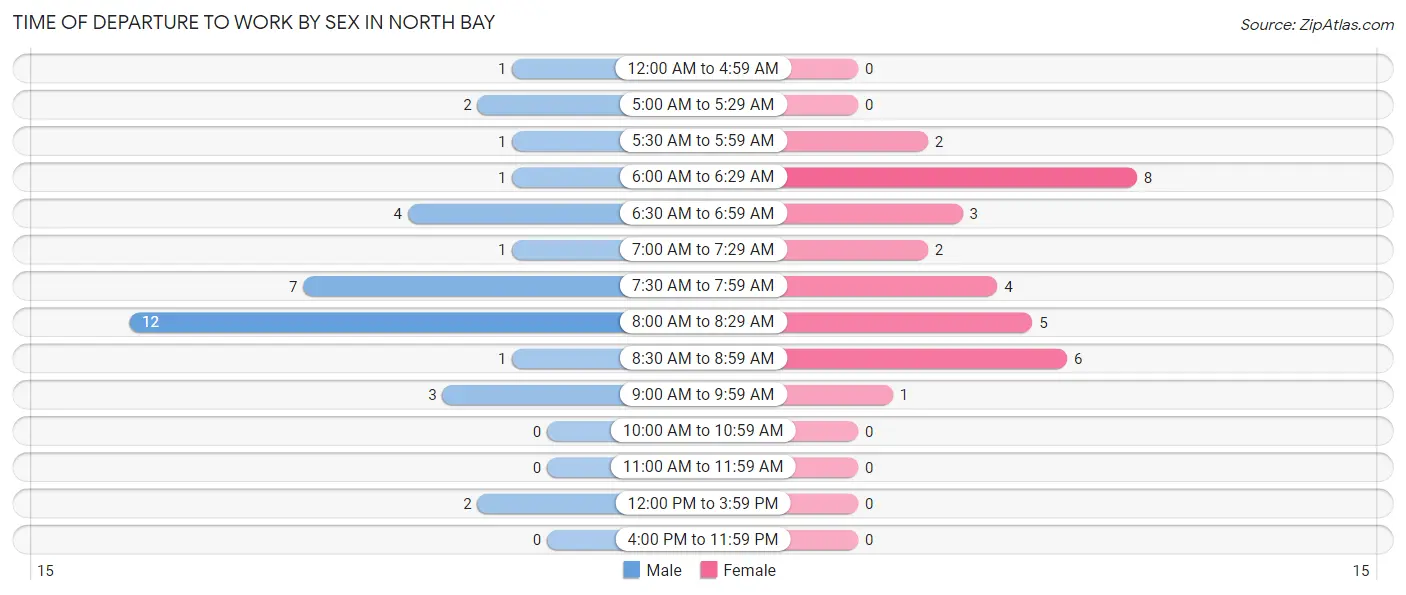
| Time of Departure | Male | Female |
| 12:00 AM to 4:59 AM | 1 (2.9%) | 0 (0.0%) |
| 5:00 AM to 5:29 AM | 2 (5.7%) | 0 (0.0%) |
| 5:30 AM to 5:59 AM | 1 (2.9%) | 2 (6.5%) |
| 6:00 AM to 6:29 AM | 1 (2.9%) | 8 (25.8%) |
| 6:30 AM to 6:59 AM | 4 (11.4%) | 3 (9.7%) |
| 7:00 AM to 7:29 AM | 1 (2.9%) | 2 (6.5%) |
| 7:30 AM to 7:59 AM | 7 (20.0%) | 4 (12.9%) |
| 8:00 AM to 8:29 AM | 12 (34.3%) | 5 (16.1%) |
| 8:30 AM to 8:59 AM | 1 (2.9%) | 6 (19.4%) |
| 9:00 AM to 9:59 AM | 3 (8.6%) | 1 (3.2%) |
| 10:00 AM to 10:59 AM | 0 (0.0%) | 0 (0.0%) |
| 11:00 AM to 11:59 AM | 0 (0.0%) | 0 (0.0%) |
| 12:00 PM to 3:59 PM | 2 (5.7%) | 0 (0.0%) |
| 4:00 PM to 11:59 PM | 0 (0.0%) | 0 (0.0%) |
| Total | 35 (100.0%) | 31 (100.0%) |
Housing Occupancy in North Bay
Occupancy by Ownership in North Bay
Of the total 118 dwellings in North Bay, owner-occupied units account for 118 (100.0%), while renter-occupied units make up 0 (0.0%).
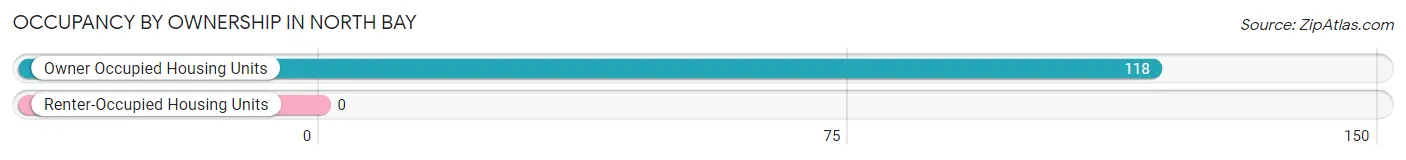
| Occupancy | # Housing Units | % Housing Units |
| Owner Occupied Housing Units | 118 | 100.0% |
| Renter-Occupied Housing Units | 0 | 0.0% |
| Total Occupied Housing Units | 118 | 100.0% |
Occupancy by Household Size in North Bay
| Household Size | # Housing Units | % Housing Units |
| 1-Person Household | 41 | 34.7% |
| 2-Person Household | 43 | 36.4% |
| 3-Person Household | 13 | 11.0% |
| 4+ Person Household | 21 | 17.8% |
| Total Housing Units | 118 | 100.0% |
Occupancy by Ownership by Household Size in North Bay
| Household Size | Owner-occupied | Renter-occupied |
| 1-Person Household | 41 (100.0%) | 0 (0.0%) |
| 2-Person Household | 43 (100.0%) | 0 (0.0%) |
| 3-Person Household | 13 (100.0%) | 0 (0.0%) |
| 4+ Person Household | 21 (100.0%) | 0 (0.0%) |
| Total Housing Units | 118 (100.0%) | 0 (0.0%) |
Occupancy by Educational Attainment in North Bay
| Household Size | Owner-occupied | Renter-occupied |
| Less than High School | 0 (0.0%) | 0 (0.0%) |
| High School Diploma | 7 (100.0%) | 0 (0.0%) |
| College/Associate Degree | 25 (100.0%) | 0 (0.0%) |
| Bachelor's Degree or higher | 86 (100.0%) | 0 (0.0%) |
Occupancy by Age of Householder in North Bay
| Age Bracket | # Households | % Households |
| Under 35 Years | 7 | 5.9% |
| 35 to 44 Years | 4 | 3.4% |
| 45 to 54 Years | 28 | 23.7% |
| 55 to 64 Years | 14 | 11.9% |
| 65 to 74 Years | 30 | 25.4% |
| 75 to 84 Years | 32 | 27.1% |
| 85 Years and Over | 3 | 2.5% |
| Total | 118 | 100.0% |
Housing Finances in North Bay
Median Income by Occupancy in North Bay
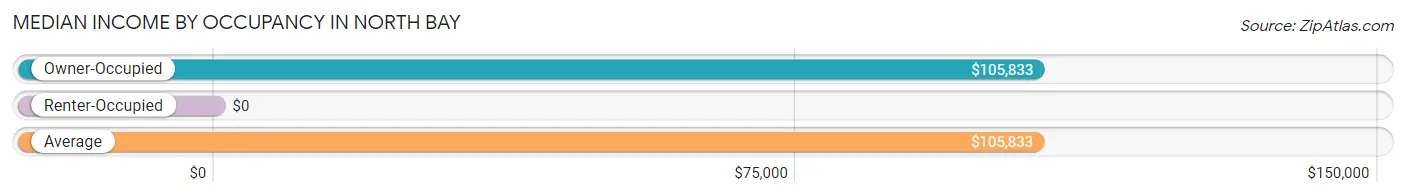
| Occupancy Type | # Households | Median Income |
| Owner-Occupied | 118 (100.0%) | $105,833 |
| Renter-Occupied | 0 (0.0%) | $0 |
| Average | 118 (100.0%) | $105,833 |
Occupancy by Householder Income Bracket in North Bay
| Income Bracket | Owner-occupied | Renter-occupied |
| Less than $5,000 | 0 (0.0%) | 0 (0.0%) |
| $5,000 to $9,999 | 0 (0.0%) | 0 (0.0%) |
| $10,000 to $14,999 | 3 (2.5%) | 0 (0.0%) |
| $15,000 to $19,999 | 1 (0.9%) | 0 (0.0%) |
| $20,000 to $24,999 | 0 (0.0%) | 0 (0.0%) |
| $25,000 to $34,999 | 3 (2.5%) | 0 (0.0%) |
| $35,000 to $49,999 | 2 (1.7%) | 0 (0.0%) |
| $50,000 to $74,999 | 38 (32.2%) | 0 (0.0%) |
| $75,000 to $99,999 | 10 (8.5%) | 0 (0.0%) |
| $100,000 to $149,999 | 15 (12.7%) | 0 (0.0%) |
| $150,000 or more | 46 (39.0%) | 0 (0.0%) |
| Total | 118 (100.0%) | 0 (0.0%) |
Monthly Housing Cost Tiers in North Bay
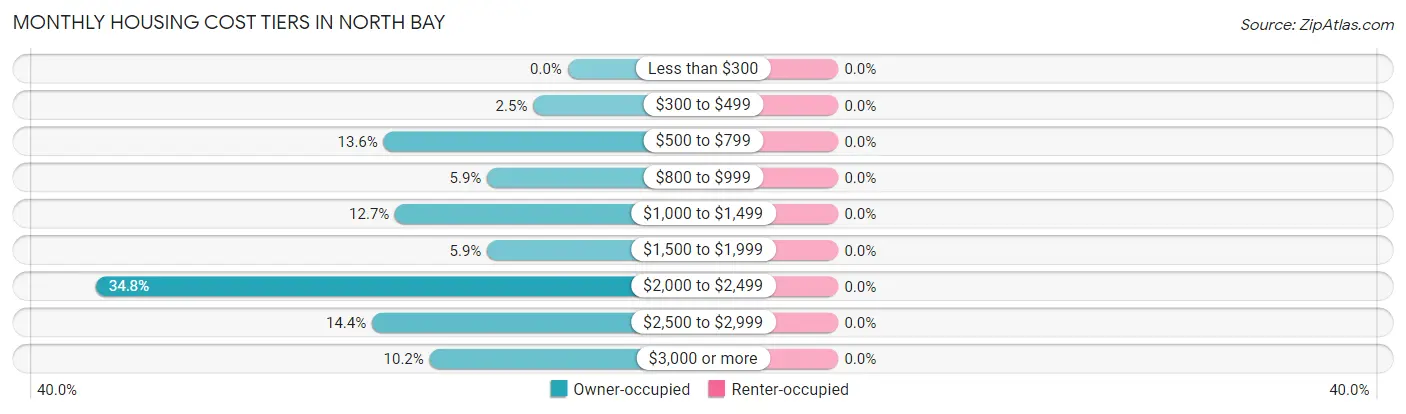
| Monthly Cost | Owner-occupied | Renter-occupied |
| Less than $300 | 0 (0.0%) | 0 (0.0%) |
| $300 to $499 | 3 (2.5%) | 0 (0.0%) |
| $500 to $799 | 16 (13.6%) | 0 (0.0%) |
| $800 to $999 | 7 (5.9%) | 0 (0.0%) |
| $1,000 to $1,499 | 15 (12.7%) | 0 (0.0%) |
| $1,500 to $1,999 | 7 (5.9%) | 0 (0.0%) |
| $2,000 to $2,499 | 41 (34.7%) | 0 (0.0%) |
| $2,500 to $2,999 | 17 (14.4%) | 0 (0.0%) |
| $3,000 or more | 12 (10.2%) | 0 (0.0%) |
| Total | 118 (100.0%) | 0 (0.0%) |
Physical Housing Characteristics in North Bay
Housing Structures in North Bay
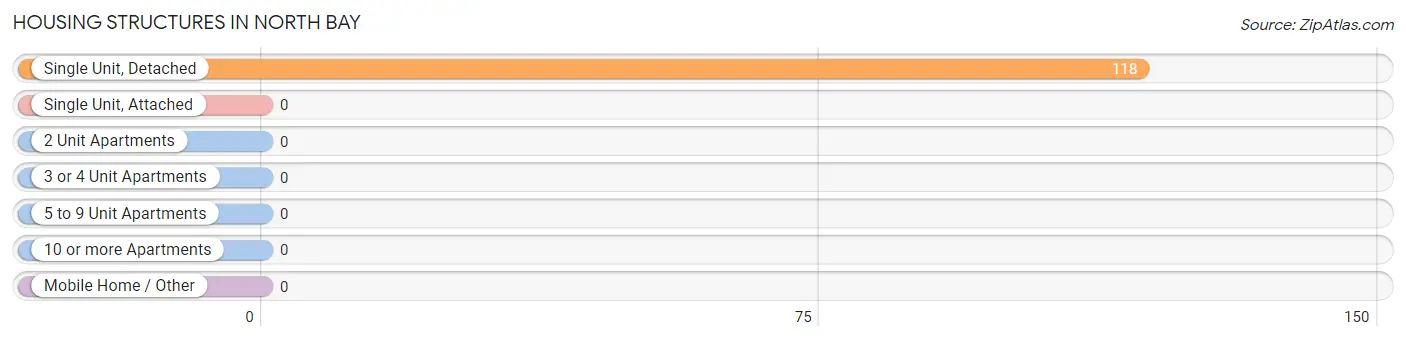
| Structure Type | # Housing Units | % Housing Units |
| Single Unit, Detached | 118 | 100.0% |
| Single Unit, Attached | 0 | 0.0% |
| 2 Unit Apartments | 0 | 0.0% |
| 3 or 4 Unit Apartments | 0 | 0.0% |
| 5 to 9 Unit Apartments | 0 | 0.0% |
| 10 or more Apartments | 0 | 0.0% |
| Mobile Home / Other | 0 | 0.0% |
| Total | 118 | 100.0% |
Housing Structures by Occupancy in North Bay
| Structure Type | Owner-occupied | Renter-occupied |
| Single Unit, Detached | 118 (100.0%) | 0 (0.0%) |
| Single Unit, Attached | 0 (0.0%) | 0 (0.0%) |
| 2 Unit Apartments | 0 (0.0%) | 0 (0.0%) |
| 3 or 4 Unit Apartments | 0 (0.0%) | 0 (0.0%) |
| 5 to 9 Unit Apartments | 0 (0.0%) | 0 (0.0%) |
| 10 or more Apartments | 0 (0.0%) | 0 (0.0%) |
| Mobile Home / Other | 0 (0.0%) | 0 (0.0%) |
| Total | 118 (100.0%) | 0 (0.0%) |
Housing Structures by Number of Rooms in North Bay
| Number of Rooms | Owner-occupied | Renter-occupied |
| 1 Room | 0 (0.0%) | 0 (0.0%) |
| 2 or 3 Rooms | 0 (0.0%) | 0 (0.0%) |
| 4 or 5 Rooms | 6 (5.1%) | 0 (0.0%) |
| 6 or 7 Rooms | 32 (27.1%) | 0 (0.0%) |
| 8 or more Rooms | 80 (67.8%) | 0 (0.0%) |
| Total | 118 (100.0%) | 0 (0.0%) |
Housing Structure by Heating Type in North Bay
| Heating Type | Owner-occupied | Renter-occupied |
| Utility Gas | 86 (72.9%) | 0 (0.0%) |
| Bottled, Tank, or LP Gas | 0 (0.0%) | 0 (0.0%) |
| Electricity | 30 (25.4%) | 0 (0.0%) |
| Fuel Oil or Kerosene | 0 (0.0%) | 0 (0.0%) |
| Coal or Coke | 0 (0.0%) | 0 (0.0%) |
| All other Fuels | 2 (1.7%) | 0 (0.0%) |
| No Fuel Used | 0 (0.0%) | 0 (0.0%) |
| Total | 118 (100.0%) | 0 (0.0%) |
Household Vehicle Usage in North Bay
| Vehicles per Household | Owner-occupied | Renter-occupied |
| No Vehicle | 0 (0.0%) | 0 (0.0%) |
| 1 Vehicle | 51 (43.2%) | 0 (0.0%) |
| 2 Vehicles | 45 (38.1%) | 0 (0.0%) |
| 3 or more Vehicles | 22 (18.6%) | 0 (0.0%) |
| Total | 118 (100.0%) | 0 (0.0%) |
Real Estate & Mortgages in North Bay
Real Estate and Mortgage Overview in North Bay
| Characteristic | Without Mortgage | With Mortgage |
| Housing Units | 48 | 70 |
| Median Property Value | $416,700 | $506,900 |
| Median Household Income | $130,000 | $23 |
| Monthly Housing Costs | $967 | $11 |
| Real Estate Taxes | $7,361 | $0 |
Property Value by Mortgage Status in North Bay

| Property Value | Without Mortgage | With Mortgage |
| Less than $50,000 | 0 (0.0%) | 1 (1.4%) |
| $50,000 to $99,999 | 0 (0.0%) | 0 (0.0%) |
| $100,000 to $299,999 | 15 (31.2%) | 7 (10.0%) |
| $300,000 to $499,999 | 14 (29.2%) | 26 (37.1%) |
| $500,000 to $749,999 | 14 (29.2%) | 36 (51.4%) |
| $750,000 to $999,999 | 4 (8.3%) | 0 (0.0%) |
| $1,000,000 or more | 1 (2.1%) | 0 (0.0%) |
| Total | 48 (100.0%) | 70 (100.0%) |
Household Income by Mortgage Status in North Bay
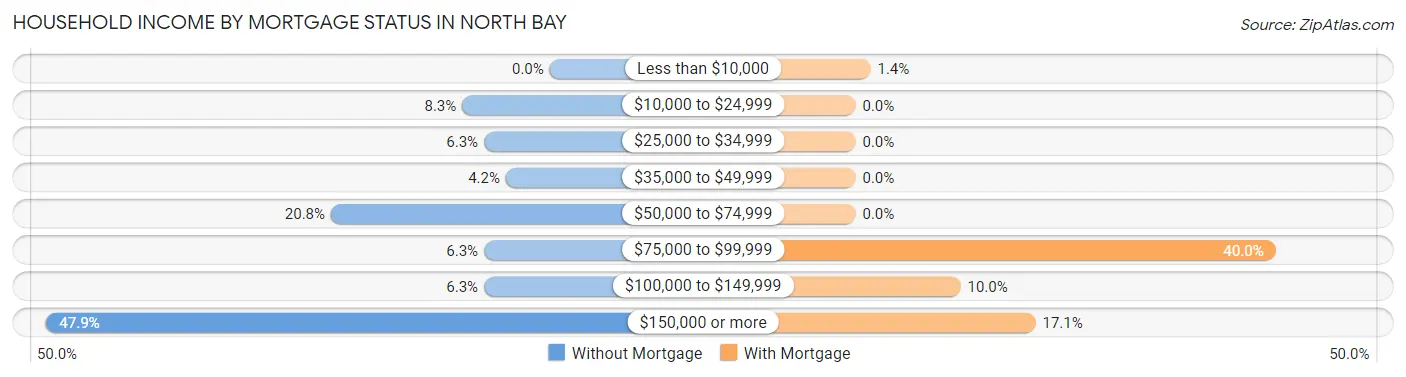
| Household Income | Without Mortgage | With Mortgage |
| Less than $10,000 | 0 (0.0%) | 1 (1.4%) |
| $10,000 to $24,999 | 4 (8.3%) | 0 (0.0%) |
| $25,000 to $34,999 | 3 (6.2%) | 0 (0.0%) |
| $35,000 to $49,999 | 2 (4.2%) | 0 (0.0%) |
| $50,000 to $74,999 | 10 (20.8%) | 0 (0.0%) |
| $75,000 to $99,999 | 3 (6.2%) | 28 (40.0%) |
| $100,000 to $149,999 | 3 (6.2%) | 7 (10.0%) |
| $150,000 or more | 23 (47.9%) | 12 (17.1%) |
| Total | 48 (100.0%) | 70 (100.0%) |
Property Value to Household Income Ratio in North Bay
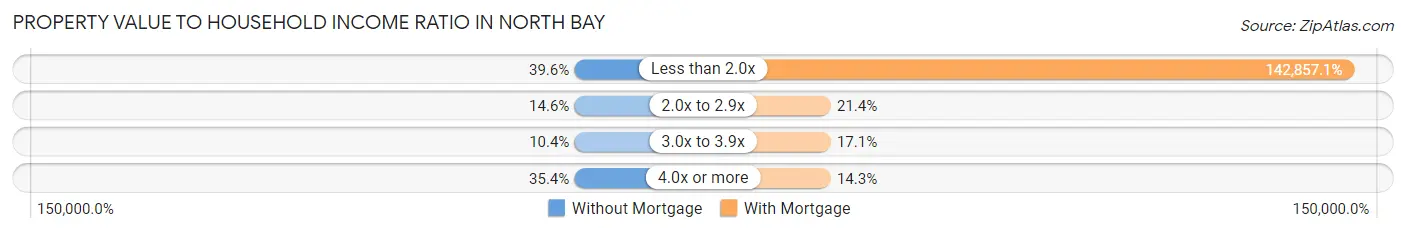
| Value-to-Income Ratio | Without Mortgage | With Mortgage |
| Less than 2.0x | 19 (39.6%) | 100,000 (142,857.1%) |
| 2.0x to 2.9x | 7 (14.6%) | 15 (21.4%) |
| 3.0x to 3.9x | 5 (10.4%) | 12 (17.1%) |
| 4.0x or more | 17 (35.4%) | 10 (14.3%) |
| Total | 48 (100.0%) | 70 (100.0%) |
Real Estate Taxes by Mortgage Status in North Bay
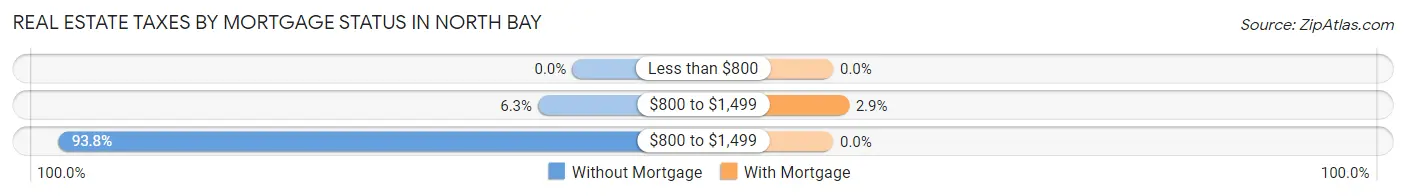
| Property Taxes | Without Mortgage | With Mortgage |
| Less than $800 | 0 (0.0%) | 0 (0.0%) |
| $800 to $1,499 | 3 (6.2%) | 2 (2.9%) |
| $800 to $1,499 | 45 (93.8%) | 0 (0.0%) |
| Total | 48 (100.0%) | 70 (100.0%) |
Health & Disability in North Bay
Health Insurance Coverage by Age in North Bay
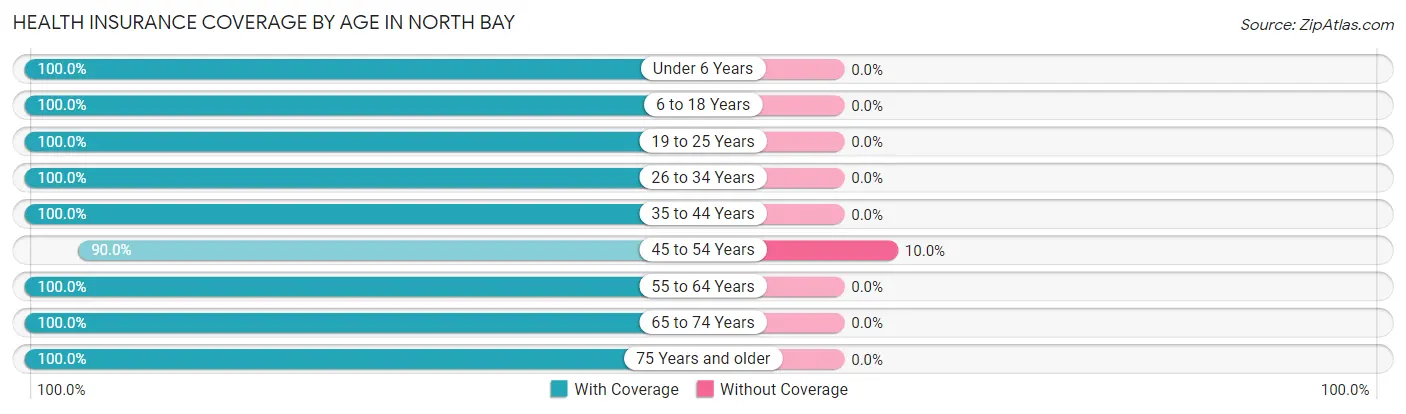
| Age Bracket | With Coverage | Without Coverage |
| Under 6 Years | 12 (100.0%) | 0 (0.0%) |
| 6 to 18 Years | 38 (100.0%) | 0 (0.0%) |
| 19 to 25 Years | 9 (100.0%) | 0 (0.0%) |
| 26 to 34 Years | 11 (100.0%) | 0 (0.0%) |
| 35 to 44 Years | 8 (100.0%) | 0 (0.0%) |
| 45 to 54 Years | 36 (90.0%) | 4 (10.0%) |
| 55 to 64 Years | 22 (100.0%) | 0 (0.0%) |
| 65 to 74 Years | 47 (100.0%) | 0 (0.0%) |
| 75 Years and older | 40 (100.0%) | 0 (0.0%) |
| Total | 223 (98.2%) | 4 (1.8%) |
Health Insurance Coverage by Citizenship Status in North Bay
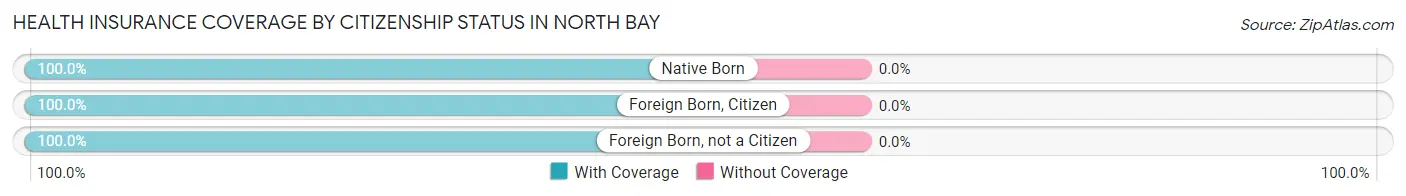
| Citizenship Status | With Coverage | Without Coverage |
| Native Born | 12 (100.0%) | 0 (0.0%) |
| Foreign Born, Citizen | 38 (100.0%) | 0 (0.0%) |
| Foreign Born, not a Citizen | 9 (100.0%) | 0 (0.0%) |
Health Insurance Coverage by Household Income in North Bay
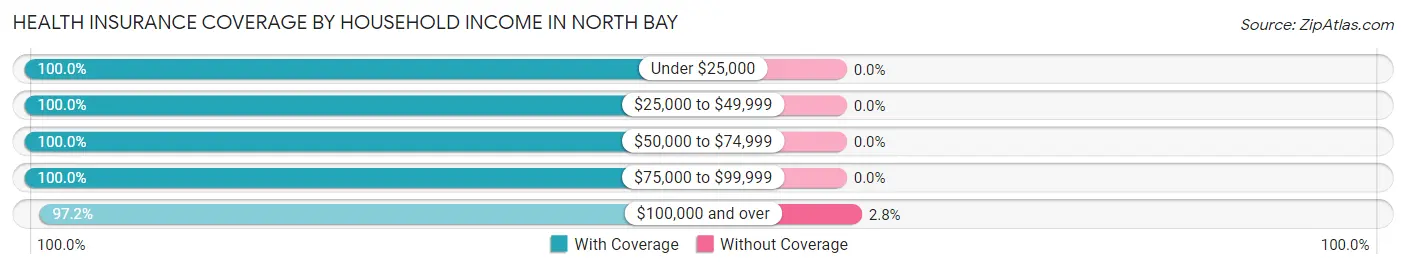
| Household Income | With Coverage | Without Coverage |
| Under $25,000 | 9 (100.0%) | 0 (0.0%) |
| $25,000 to $49,999 | 6 (100.0%) | 0 (0.0%) |
| $50,000 to $74,999 | 51 (100.0%) | 0 (0.0%) |
| $75,000 to $99,999 | 19 (100.0%) | 0 (0.0%) |
| $100,000 and over | 138 (97.2%) | 4 (2.8%) |
Public vs Private Health Insurance Coverage by Age in North Bay
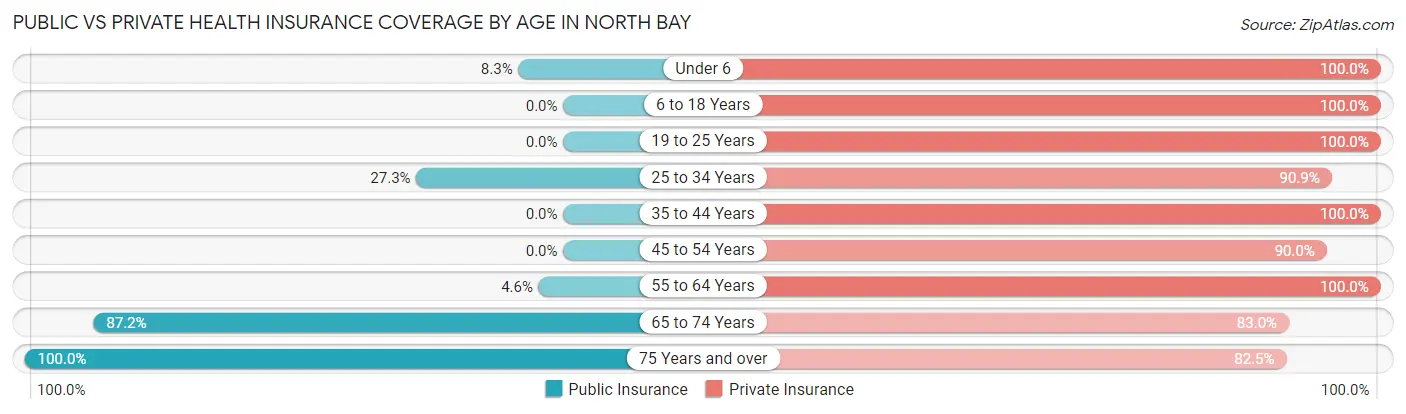
| Age Bracket | Public Insurance | Private Insurance |
| Under 6 | 1 (8.3%) | 12 (100.0%) |
| 6 to 18 Years | 0 (0.0%) | 38 (100.0%) |
| 19 to 25 Years | 0 (0.0%) | 9 (100.0%) |
| 25 to 34 Years | 3 (27.3%) | 10 (90.9%) |
| 35 to 44 Years | 0 (0.0%) | 8 (100.0%) |
| 45 to 54 Years | 0 (0.0%) | 36 (90.0%) |
| 55 to 64 Years | 1 (4.5%) | 22 (100.0%) |
| 65 to 74 Years | 41 (87.2%) | 39 (83.0%) |
| 75 Years and over | 40 (100.0%) | 33 (82.5%) |
| Total | 86 (37.9%) | 207 (91.2%) |
Disability Status by Sex by Age in North Bay
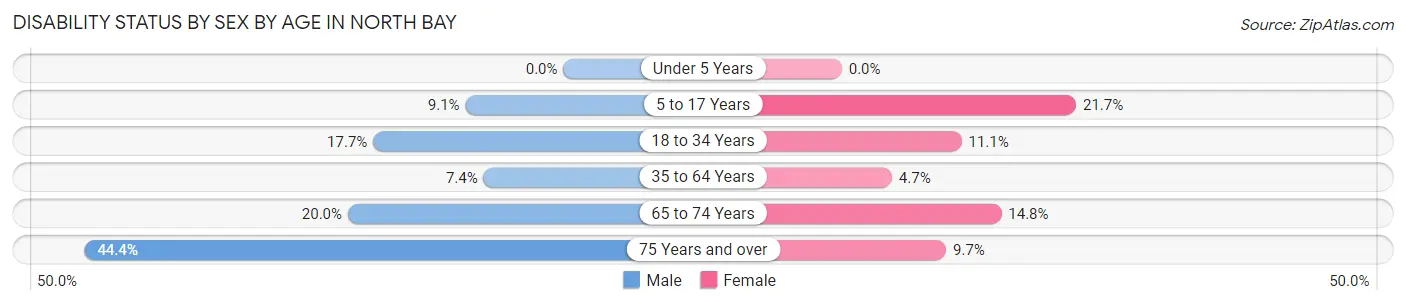
| Age Bracket | Male | Female |
| Under 5 Years | 0 (0.0%) | 0 (0.0%) |
| 5 to 17 Years | 1 (9.1%) | 5 (21.7%) |
| 18 to 34 Years | 3 (17.6%) | 1 (11.1%) |
| 35 to 64 Years | 2 (7.4%) | 2 (4.6%) |
| 65 to 74 Years | 4 (20.0%) | 4 (14.8%) |
| 75 Years and over | 4 (44.4%) | 3 (9.7%) |
Disability Class by Sex by Age in North Bay
Disability Class: Hearing Difficulty
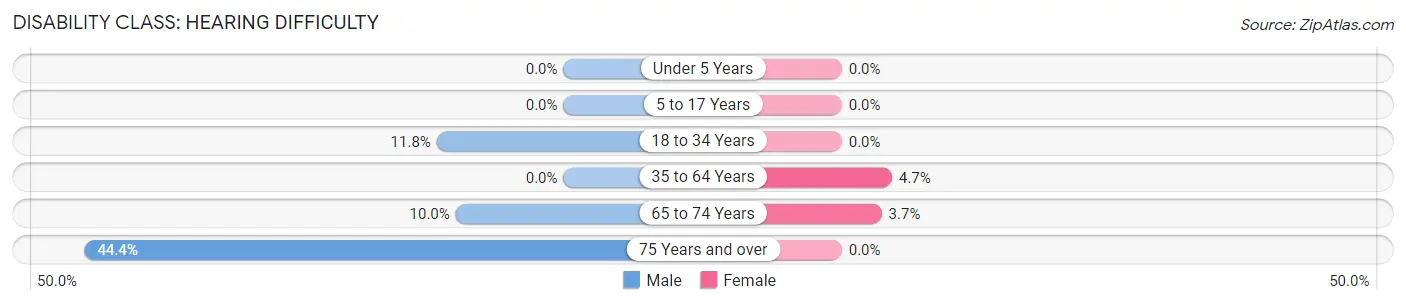
| Age Bracket | Male | Female |
| Under 5 Years | 0 (0.0%) | 0 (0.0%) |
| 5 to 17 Years | 0 (0.0%) | 0 (0.0%) |
| 18 to 34 Years | 2 (11.8%) | 0 (0.0%) |
| 35 to 64 Years | 0 (0.0%) | 2 (4.6%) |
| 65 to 74 Years | 2 (10.0%) | 1 (3.7%) |
| 75 Years and over | 4 (44.4%) | 0 (0.0%) |
Disability Class: Vision Difficulty
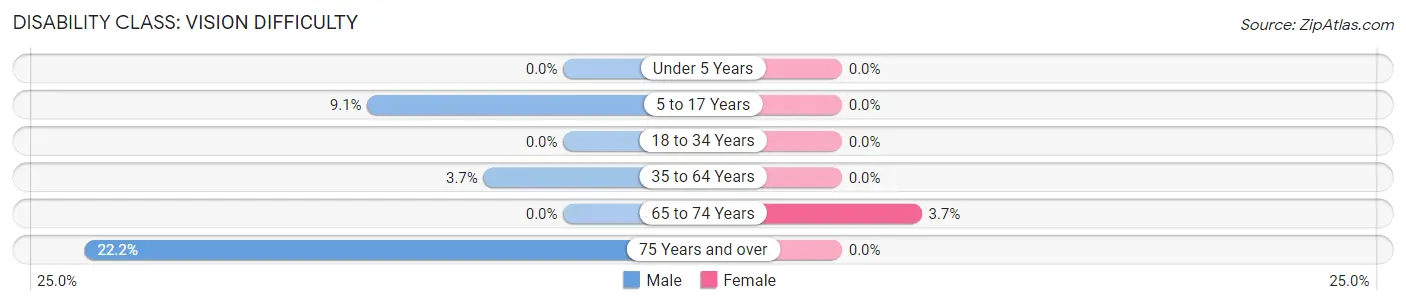
| Age Bracket | Male | Female |
| Under 5 Years | 0 (0.0%) | 0 (0.0%) |
| 5 to 17 Years | 1 (9.1%) | 0 (0.0%) |
| 18 to 34 Years | 0 (0.0%) | 0 (0.0%) |
| 35 to 64 Years | 1 (3.7%) | 0 (0.0%) |
| 65 to 74 Years | 0 (0.0%) | 1 (3.7%) |
| 75 Years and over | 2 (22.2%) | 0 (0.0%) |
Disability Class: Cognitive Difficulty
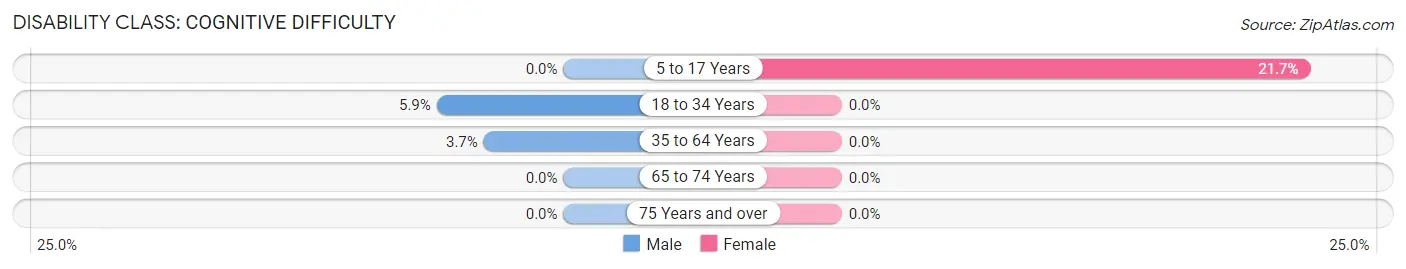
| Age Bracket | Male | Female |
| 5 to 17 Years | 0 (0.0%) | 5 (21.7%) |
| 18 to 34 Years | 1 (5.9%) | 0 (0.0%) |
| 35 to 64 Years | 1 (3.7%) | 0 (0.0%) |
| 65 to 74 Years | 0 (0.0%) | 0 (0.0%) |
| 75 Years and over | 0 (0.0%) | 0 (0.0%) |
Disability Class: Ambulatory Difficulty
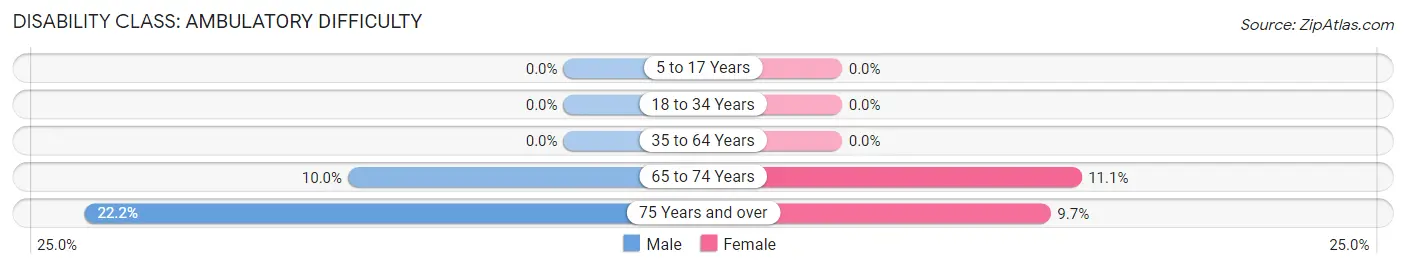
| Age Bracket | Male | Female |
| 5 to 17 Years | 0 (0.0%) | 0 (0.0%) |
| 18 to 34 Years | 0 (0.0%) | 0 (0.0%) |
| 35 to 64 Years | 0 (0.0%) | 0 (0.0%) |
| 65 to 74 Years | 2 (10.0%) | 3 (11.1%) |
| 75 Years and over | 2 (22.2%) | 3 (9.7%) |
Disability Class: Self-Care Difficulty
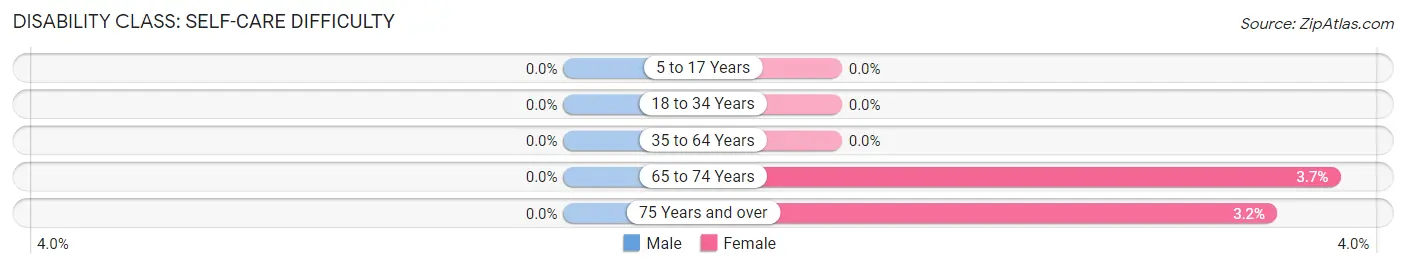
| Age Bracket | Male | Female |
| 5 to 17 Years | 0 (0.0%) | 0 (0.0%) |
| 18 to 34 Years | 0 (0.0%) | 0 (0.0%) |
| 35 to 64 Years | 0 (0.0%) | 0 (0.0%) |
| 65 to 74 Years | 0 (0.0%) | 1 (3.7%) |
| 75 Years and over | 0 (0.0%) | 1 (3.2%) |
Technology Access in North Bay
Computing Device Access in North Bay
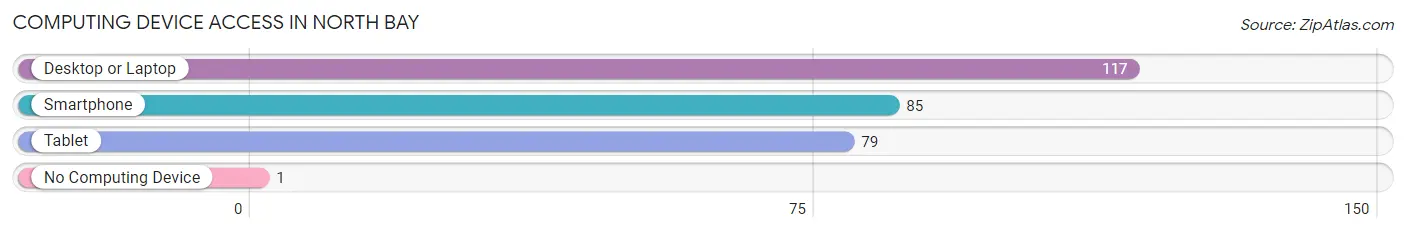
| Device Type | # Households | % Households |
| Desktop or Laptop | 117 | 99.2% |
| Smartphone | 85 | 72.0% |
| Tablet | 79 | 66.9% |
| No Computing Device | 1 | 0.9% |
| Total | 118 | 100.0% |
Internet Access in North Bay
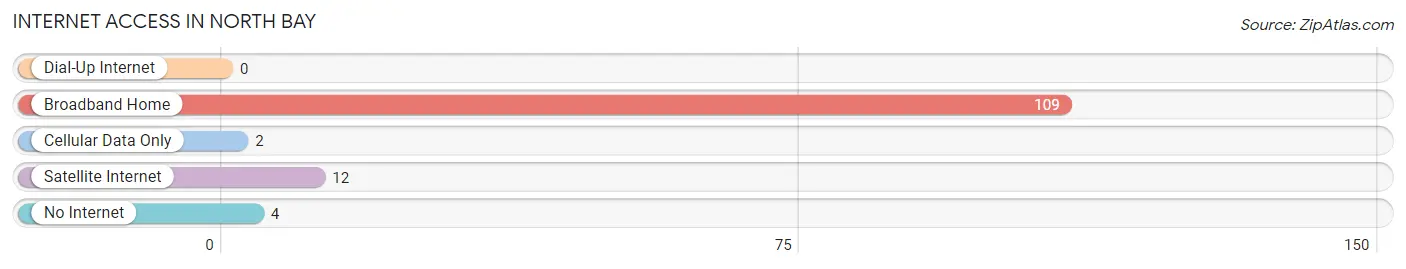
| Internet Type | # Households | % Households |
| Dial-Up Internet | 0 | 0.0% |
| Broadband Home | 109 | 92.4% |
| Cellular Data Only | 2 | 1.7% |
| Satellite Internet | 12 | 10.2% |
| No Internet | 4 | 3.4% |
| Total | 118 | 100.0% |
North Bay Summary
North Bay is a small town located in Bayfield County, Wisconsin, United States. It is situated on the shore of Lake Superior, about 25 miles east of the city of Ashland. The population was 545 at the 2010 census.
History
North Bay was first settled in the late 1800s by a group of Scandinavian immigrants. The town was originally called “Nordby”, which means “north village” in Norwegian. The name was changed to North Bay in 1891.
The town was a popular destination for tourists in the early 1900s, and the area was known for its excellent fishing. In the 1920s, the town was home to a large logging industry, and the lumber was shipped to other parts of the country.
In the 1950s, North Bay began to experience a decline in population as people moved away to larger cities. The town was revitalized in the 1970s when the Wisconsin Department of Natural Resources began to develop the area as a recreational destination.
Geography
North Bay is located at 46°45'N, 90°45'W (46.75, -90.75). According to the United States Census Bureau, the town has a total area of 1.2 square miles (3.2 km2), all of it land.
The town is situated on the shore of Lake Superior, and is surrounded by the Chequamegon National Forest. The area is known for its scenic beauty, and is a popular destination for outdoor activities such as fishing, hunting, camping, and hiking.
Economy
The economy of North Bay is largely based on tourism. The town is home to several resorts and lodges, as well as a marina and boat launch. The area is also popular for its excellent fishing, and is home to several charter fishing companies.
The town is also home to several small businesses, including a grocery store, a hardware store, and a few restaurants.
Demographics
As of the census of 2010, there were 545 people, 246 households, and 145 families residing in the town. The population density was 454.2 people per square mile (175.3/km2). There were 279 housing units at an average density of 231.7 per square mile (89.4/km2). The racial makeup of the town was 97.3% White, 0.2% African American, 0.2% Native American, 0.4% Asian, 0.2% from other races, and 1.7% from two or more races. Hispanic or Latino of any race were 0.7% of the population.
There were 246 households, out of which 22.9% had children under the age of 18 living with them, 48.4% were married couples living together, 8.1% had a female householder with no husband present, and 39.4% were non-families. 33.5% of all households were made up of individuals, and 14.6% had someone living alone who was 65 years of age or older. The average household size was 2.22 and the average family size was 2.83.
In the town, the population was spread out, with 20.2% under the age of 18, 6.2% from 18 to 24, 24.2% from 25 to 44, 30.3% from 45 to 64, and 19.1% who were 65 years of age or older. The median age was 44 years. For every 100 females, there were 97.3 males. For every 100 females age 18 and over, there were 95.2 males.
The median income for a household in the town was $35,000, and the median income for a family was $41,250. Males had a median income of $31,250 versus $21,250 for females. The per capita income for the town was $18,945. About 8.3% of families and 11.2% of the population were below the poverty line, including 16.7% of those under age 18 and 8.3% of those age 65 or over.
Common Questions
What is Per Capita Income in North Bay?
Per Capita income in North Bay is $70,540.
What is the Median Family Income in North Bay?
Median Family Income in North Bay is $153,056.
What is the Median Household income in North Bay?
Median Household Income in North Bay is $105,833.
What is Income or Wage Gap in North Bay?
Income or Wage Gap in North Bay is 3.9%.
Women in North Bay earn 96.1 cents for every dollar earned by a man.
What is Inequality or Gini Index in North Bay?
Inequality or Gini Index in North Bay is 0.45.
What is the Total Population of North Bay?
Total Population of North Bay is 227.
What is the Total Male Population of North Bay?
Total Male Population of North Bay is 90.
What is the Total Female Population of North Bay?
Total Female Population of North Bay is 137.
What is the Ratio of Males per 100 Females in North Bay?
There are 65.69 Males per 100 Females in North Bay.
What is the Ratio of Females per 100 Males in North Bay?
There are 152.22 Females per 100 Males in North Bay.
What is the Median Population Age in North Bay?
Median Population Age in North Bay is 51.8 Years.
What is the Average Family Size in North Bay
Average Family Size in North Bay is 2.4 People.
What is the Average Household Size in North Bay
Average Household Size in North Bay is 1.9 People.
How Large is the Labor Force in North Bay?
There are 83 People in the Labor Forcein in North Bay.
What is the Percentage of People in the Labor Force in North Bay?
41.7% of People are in the Labor Force in North Bay.