Muskego, WI Map & Demographics
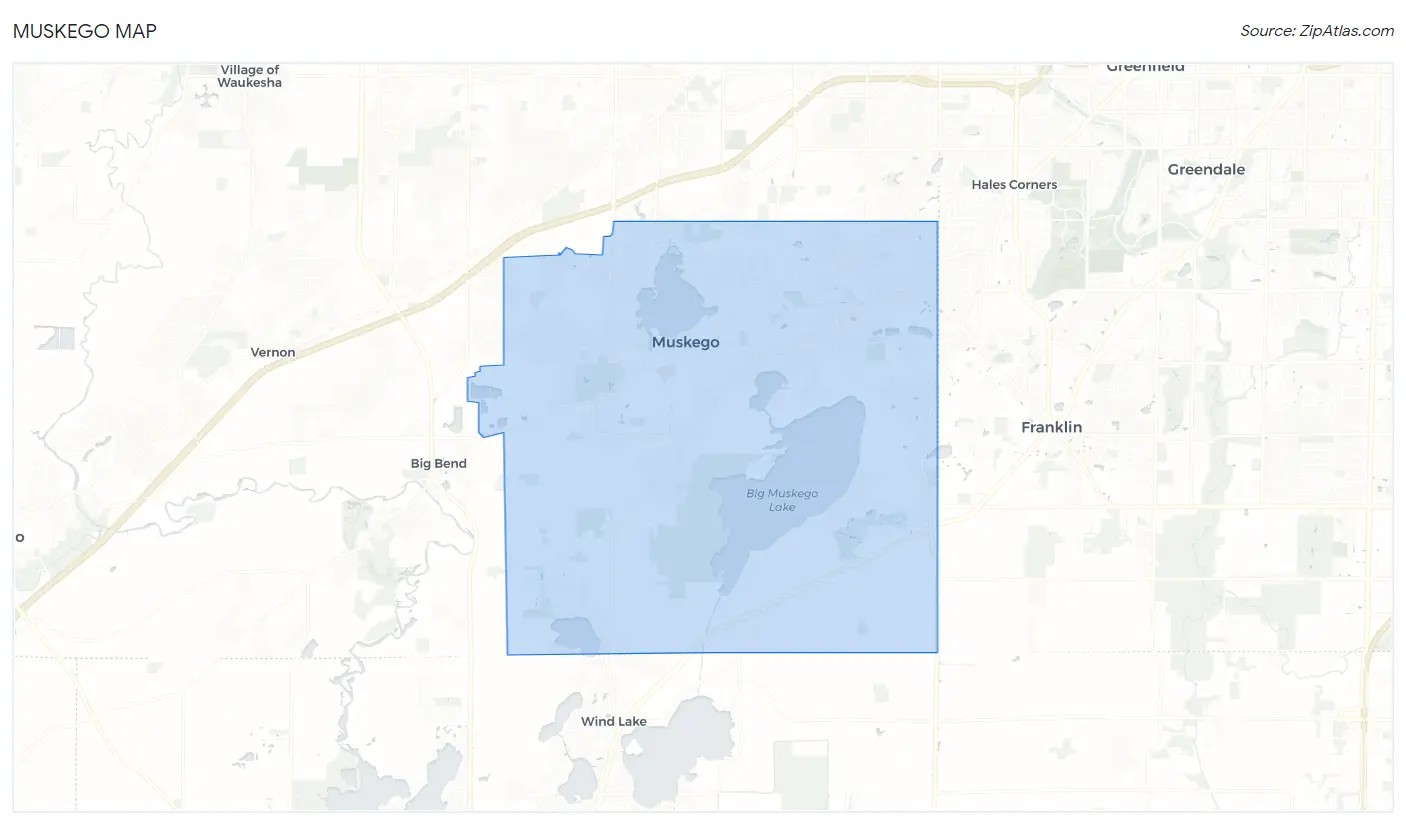
Muskego Map
Muskego Overview
$53,731
PER CAPITA INCOME
$129,842
AVG FAMILY INCOME
$112,537
AVG HOUSEHOLD INCOME
25.9%
WAGE / INCOME GAP [ % ]
74.1¢/ $1
WAGE / INCOME GAP [ $ ]
$7,906
FAMILY INCOME DEFICIT
0.38
INEQUALITY / GINI INDEX
25,073
TOTAL POPULATION
12,848
MALE POPULATION
12,225
FEMALE POPULATION
105.10
MALES / 100 FEMALES
95.15
FEMALES / 100 MALES
46.1
MEDIAN AGE
2.9
AVG FAMILY SIZE
2.5
AVG HOUSEHOLD SIZE
14,028
LABOR FORCE [ PEOPLE ]
67.8%
PERCENT IN LABOR FORCE
3.5%
UNEMPLOYMENT RATE
Muskego Zip Codes
Income in Muskego
Income Overview in Muskego
Per Capita Income in Muskego is $53,731, while median incomes of families and households are $129,842 and $112,537 respectively.
| Characteristic | Number | Measure |
| Per Capita Income | 25,073 | $53,731 |
| Median Family Income | 7,522 | $129,842 |
| Mean Family Income | 7,522 | $152,032 |
| Median Household Income | 9,966 | $112,537 |
| Mean Household Income | 9,966 | $133,062 |
| Income Deficit | 7,522 | $7,906 |
| Wage / Income Gap (%) | 25,073 | 25.91% |
| Wage / Income Gap ($) | 25,073 | 74.09¢ per $1 |
| Gini / Inequality Index | 25,073 | 0.38 |
Earnings by Sex in Muskego
Average Earnings in Muskego are $53,078, $62,940 for men and $46,631 for women, a difference of 25.9%.
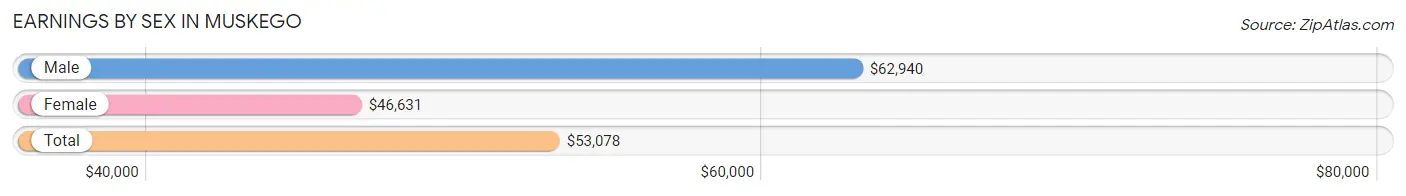
| Sex | Number | Average Earnings |
| Male | 7,845 (52.5%) | $62,940 |
| Female | 7,102 (47.5%) | $46,631 |
| Total | 14,947 (100.0%) | $53,078 |
Earnings by Sex by Income Bracket in Muskego
The most common earnings brackets in Muskego are $100,000+ for men (2,532 | 32.3%) and $100,000+ for women (1,218 | 17.2%).
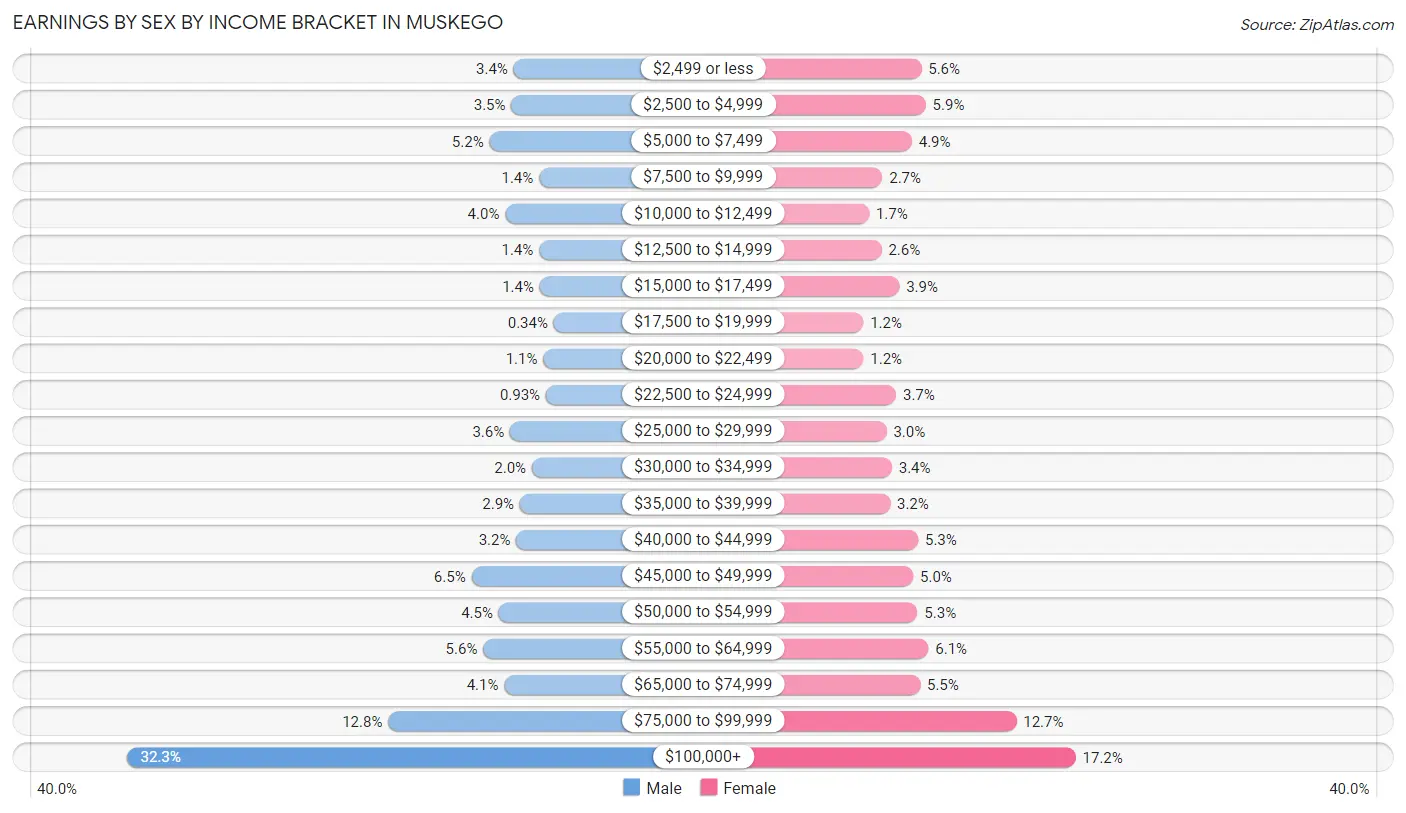
| Income | Male | Female |
| $2,499 or less | 263 (3.4%) | 396 (5.6%) |
| $2,500 to $4,999 | 276 (3.5%) | 420 (5.9%) |
| $5,000 to $7,499 | 405 (5.2%) | 346 (4.9%) |
| $7,500 to $9,999 | 113 (1.4%) | 189 (2.7%) |
| $10,000 to $12,499 | 312 (4.0%) | 118 (1.7%) |
| $12,500 to $14,999 | 113 (1.4%) | 185 (2.6%) |
| $15,000 to $17,499 | 109 (1.4%) | 279 (3.9%) |
| $17,500 to $19,999 | 27 (0.3%) | 87 (1.2%) |
| $20,000 to $22,499 | 89 (1.1%) | 88 (1.2%) |
| $22,500 to $24,999 | 73 (0.9%) | 262 (3.7%) |
| $25,000 to $29,999 | 284 (3.6%) | 211 (3.0%) |
| $30,000 to $34,999 | 155 (2.0%) | 239 (3.4%) |
| $35,000 to $39,999 | 226 (2.9%) | 230 (3.2%) |
| $40,000 to $44,999 | 247 (3.2%) | 379 (5.3%) |
| $45,000 to $49,999 | 511 (6.5%) | 353 (5.0%) |
| $50,000 to $54,999 | 350 (4.5%) | 376 (5.3%) |
| $55,000 to $64,999 | 442 (5.6%) | 434 (6.1%) |
| $65,000 to $74,999 | 318 (4.1%) | 390 (5.5%) |
| $75,000 to $99,999 | 1,000 (12.8%) | 902 (12.7%) |
| $100,000+ | 2,532 (32.3%) | 1,218 (17.2%) |
| Total | 7,845 (100.0%) | 7,102 (100.0%) |
Earnings by Sex by Educational Attainment in Muskego
Average earnings in Muskego are $84,176 for men and $54,191 for women, a difference of 35.6%. Men with an educational attainment of graduate degree enjoy the highest average annual earnings of $147,130, while those with less than high school education earn the least with $50,614. Women with an educational attainment of graduate degree earn the most with the average annual earnings of $78,664, while those with high school diploma education have the smallest earnings of $40,247.
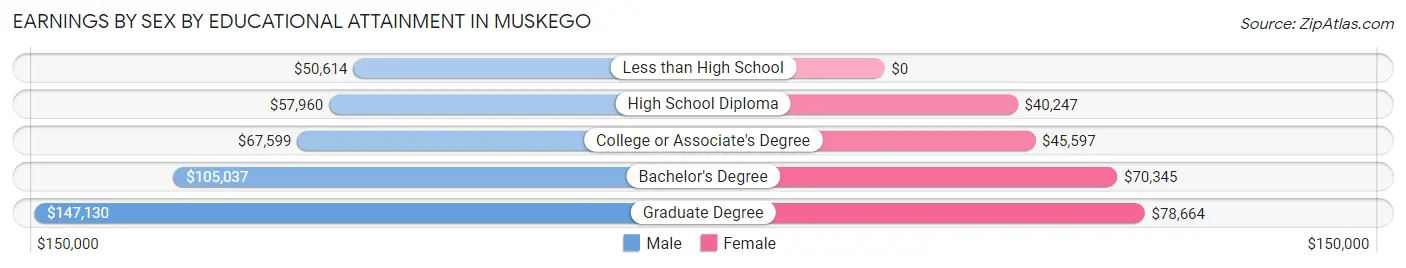
| Educational Attainment | Male Income | Female Income |
| Less than High School | $50,614 | $0 |
| High School Diploma | $57,960 | $40,247 |
| College or Associate's Degree | $67,599 | $45,597 |
| Bachelor's Degree | $105,037 | $70,345 |
| Graduate Degree | $147,130 | $78,664 |
| Total | $84,176 | $54,191 |
Family Income in Muskego
Family Income Brackets in Muskego
According to the Muskego family income data, there are 1,873 families falling into the $100,000 to $149,999 income range, which is the most common income bracket and makes up 24.9% of all families.
| Income Bracket | # Families | % Families |
| Less than $10,000 | 23 | 0.3% |
| $10,000 to $14,999 | 0 | 0.0% |
| $15,000 to $24,999 | 150 | 2.0% |
| $25,000 to $34,999 | 98 | 1.3% |
| $35,000 to $49,999 | 278 | 3.7% |
| $50,000 to $74,999 | 835 | 11.1% |
| $75,000 to $99,999 | 1,076 | 14.3% |
| $100,000 to $149,999 | 1,873 | 24.9% |
| $150,000 to $199,999 | 1,565 | 20.8% |
| $200,000+ | 1,632 | 21.7% |
Family Income by Famaliy Size in Muskego
4-person families (1,288 | 17.1%) account for the highest median family income in Muskego with $177,589 per family, while 2-person families (4,116 | 54.7%) have the highest median income of $54,406 per family member.
| Income Bracket | # Families | Median Income |
| 2-Person Families | 4,116 (54.7%) | $108,811 |
| 3-Person Families | 1,284 (17.1%) | $163,000 |
| 4-Person Families | 1,288 (17.1%) | $177,589 |
| 5-Person Families | 739 (9.8%) | $156,453 |
| 6-Person Families | 87 (1.2%) | $146,705 |
| 7+ Person Families | 8 (0.1%) | $0 |
| Total | 7,522 (100.0%) | $129,842 |
Family Income by Number of Earners in Muskego
The median family income in Muskego is $129,842, with families comprising 2 earners (3,620) having the highest median family income of $158,304, while families with no earners (1,204) have the lowest median family income of $87,994, accounting for 48.1% and 16.0% of families, respectively.
| Number of Earners | # Families | Median Income |
| No Earners | 1,204 (16.0%) | $87,994 |
| 1 Earner | 1,496 (19.9%) | $98,961 |
| 2 Earners | 3,620 (48.1%) | $158,304 |
| 3+ Earners | 1,202 (16.0%) | $157,368 |
| Total | 7,522 (100.0%) | $129,842 |
Household Income in Muskego
Household Income Brackets in Muskego
With 2,103 households falling in the category, the $100,000 to $149,999 income range is the most frequent in Muskego, accounting for 21.1% of all households. In contrast, only 80 households (0.8%) fall into the $10,000 to $14,999 income bracket, making it the least populous group.
| Income Bracket | # Households | % Households |
| Less than $10,000 | 159 | 1.6% |
| $10,000 to $14,999 | 80 | 0.8% |
| $15,000 to $24,999 | 379 | 3.8% |
| $25,000 to $34,999 | 468 | 4.7% |
| $35,000 to $49,999 | 648 | 6.5% |
| $50,000 to $74,999 | 1,216 | 12.2% |
| $75,000 to $99,999 | 1,485 | 14.9% |
| $100,000 to $149,999 | 2,103 | 21.1% |
| $150,000 to $199,999 | 1,634 | 16.4% |
| $200,000+ | 1,774 | 17.8% |
Household Income by Householder Age in Muskego
The median household income in Muskego is $112,537, with the highest median household income of $148,315 found in the 25 to 44 years age bracket for the primary householder. A total of 2,530 households (25.4%) fall into this category. Meanwhile, the 15 to 24 years age bracket for the primary householder has the lowest median household income of $0, with 30 households (0.3%) in this group.
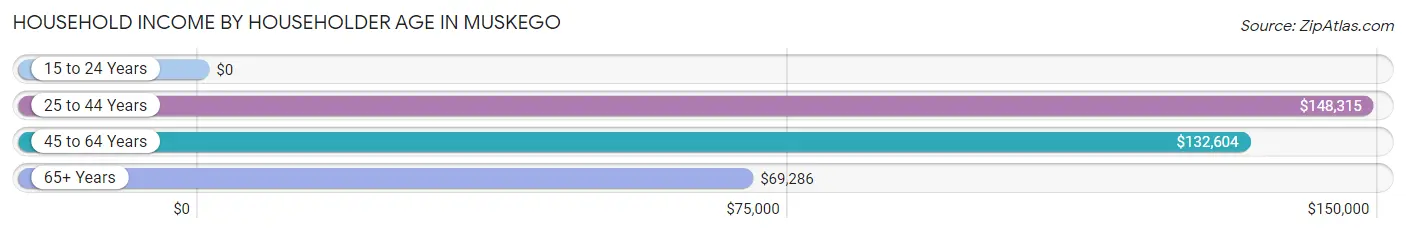
| Income Bracket | # Households | Median Income |
| 15 to 24 Years | 30 (0.3%) | $0 |
| 25 to 44 Years | 2,530 (25.4%) | $148,315 |
| 45 to 64 Years | 4,606 (46.2%) | $132,604 |
| 65+ Years | 2,800 (28.1%) | $69,286 |
| Total | 9,966 (100.0%) | $112,537 |
Poverty in Muskego
Income Below Poverty by Sex and Age in Muskego
With 1.9% poverty level for males and 3.3% for females among the residents of Muskego, 16 and 17 year old males and 15 year old females are the most vulnerable to poverty, with 19 males (3.6%) and 28 females (22.1%) in their respective age groups living below the poverty level.
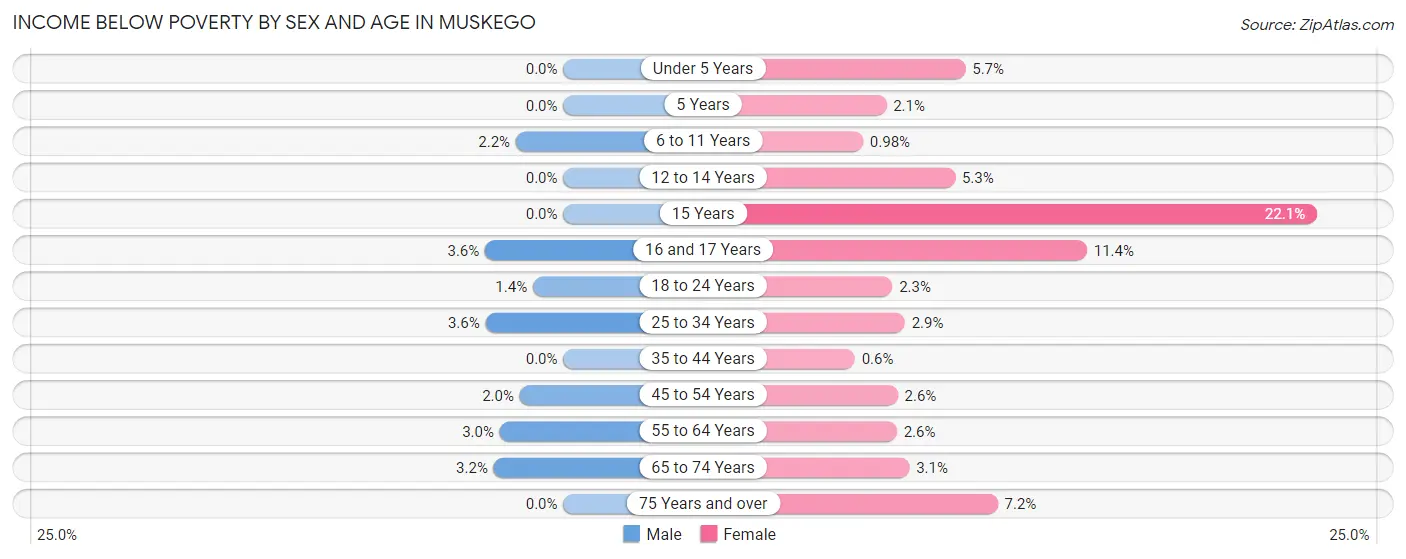
| Age Bracket | Male | Female |
| Under 5 Years | 0 (0.0%) | 27 (5.7%) |
| 5 Years | 0 (0.0%) | 2 (2.1%) |
| 6 to 11 Years | 23 (2.2%) | 8 (1.0%) |
| 12 to 14 Years | 0 (0.0%) | 23 (5.2%) |
| 15 Years | 0 (0.0%) | 28 (22.1%) |
| 16 and 17 Years | 19 (3.6%) | 44 (11.4%) |
| 18 to 24 Years | 13 (1.4%) | 23 (2.3%) |
| 25 to 34 Years | 25 (3.6%) | 24 (2.9%) |
| 35 to 44 Years | 0 (0.0%) | 11 (0.6%) |
| 45 to 54 Years | 39 (2.0%) | 51 (2.6%) |
| 55 to 64 Years | 65 (2.9%) | 49 (2.5%) |
| 65 to 74 Years | 55 (3.2%) | 41 (3.1%) |
| 75 Years and over | 0 (0.0%) | 68 (7.2%) |
| Total | 239 (1.9%) | 399 (3.3%) |
Income Above Poverty by Sex and Age in Muskego
According to the poverty statistics in Muskego, males aged under 5 years and females aged 35 to 44 years are the age groups that are most secure financially, with 100.0% of males and 99.4% of females in these age groups living above the poverty line.
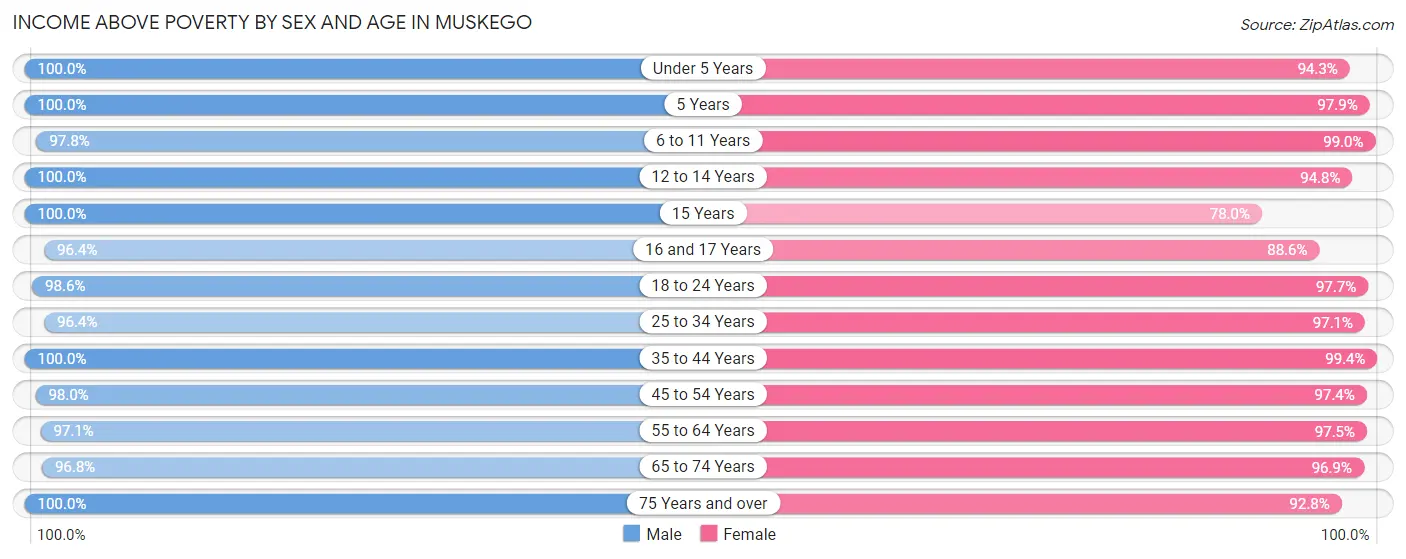
| Age Bracket | Male | Female |
| Under 5 Years | 451 (100.0%) | 444 (94.3%) |
| 5 Years | 133 (100.0%) | 95 (97.9%) |
| 6 to 11 Years | 1,022 (97.8%) | 806 (99.0%) |
| 12 to 14 Years | 532 (100.0%) | 415 (94.8%) |
| 15 Years | 213 (100.0%) | 99 (77.9%) |
| 16 and 17 Years | 505 (96.4%) | 343 (88.6%) |
| 18 to 24 Years | 911 (98.6%) | 958 (97.7%) |
| 25 to 34 Years | 667 (96.4%) | 797 (97.1%) |
| 35 to 44 Years | 1,759 (100.0%) | 1,822 (99.4%) |
| 45 to 54 Years | 1,887 (98.0%) | 1,919 (97.4%) |
| 55 to 64 Years | 2,138 (97.1%) | 1,871 (97.5%) |
| 65 to 74 Years | 1,647 (96.8%) | 1,268 (96.9%) |
| 75 Years and over | 626 (100.0%) | 873 (92.8%) |
| Total | 12,491 (98.1%) | 11,710 (96.7%) |
Income Below Poverty Among Married-Couple Families in Muskego
The poverty statistics for married-couple families in Muskego show that 1.1% or 74 of the total 6,540 families live below the poverty line. Families with 3 or 4 children have the highest poverty rate of 3.9%, comprising of 18 families. On the other hand, families with 1 or 2 children have the lowest poverty rate of 0.7%, which includes 13 families.
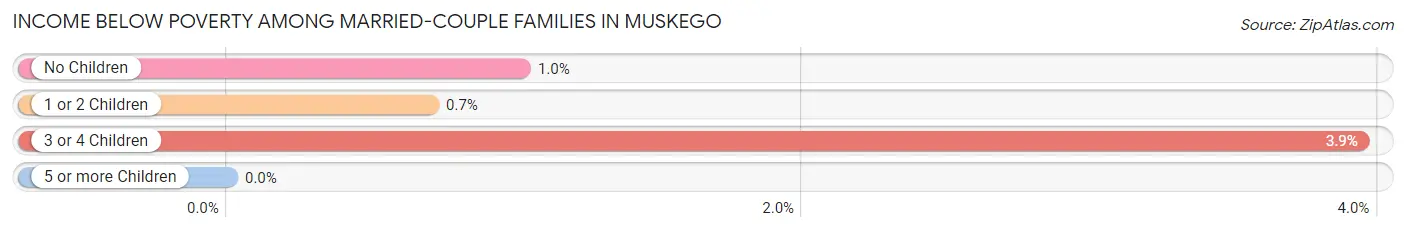
| Children | Above Poverty | Below Poverty |
| No Children | 4,187 (99.0%) | 43 (1.0%) |
| 1 or 2 Children | 1,840 (99.3%) | 13 (0.7%) |
| 3 or 4 Children | 439 (96.1%) | 18 (3.9%) |
| 5 or more Children | 0 (0.0%) | 0 (0.0%) |
| Total | 6,466 (98.9%) | 74 (1.1%) |
Income Below Poverty Among Single-Parent Households in Muskego
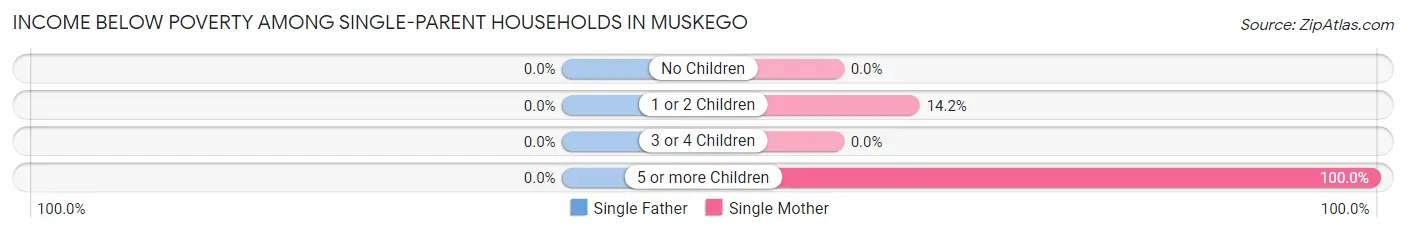
| Children | Single Father | Single Mother |
| No Children | 0 (0.0%) | 0 (0.0%) |
| 1 or 2 Children | 0 (0.0%) | 33 (14.2%) |
| 3 or 4 Children | 0 (0.0%) | 0 (0.0%) |
| 5 or more Children | 0 (0.0%) | 2 (100.0%) |
| Total | 0 (0.0%) | 35 (5.7%) |
Income Below Poverty Among Married-Couple vs Single-Parent Households in Muskego
The poverty data for Muskego shows that 74 of the married-couple family households (1.1%) and 35 of the single-parent households (3.6%) are living below the poverty level. Within the married-couple family households, those with 3 or 4 children have the highest poverty rate, with 18 households (3.9%) falling below the poverty line. Among the single-parent households, those with 5 or more children have the highest poverty rate, with 2 household (22.2%) living below poverty.
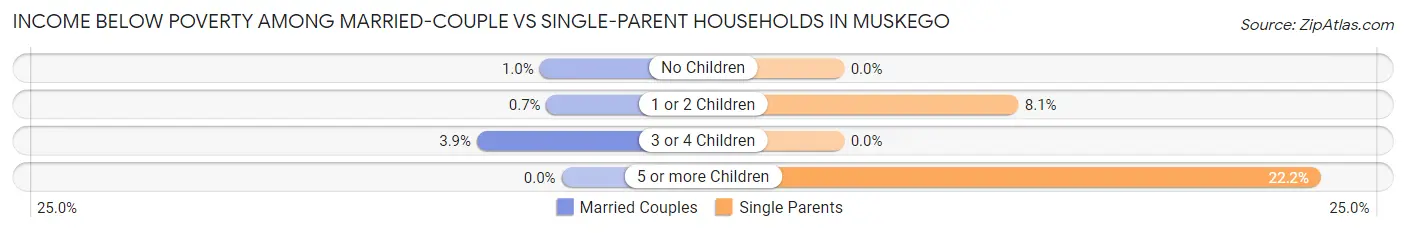
| Children | Married-Couple Families | Single-Parent Households |
| No Children | 43 (1.0%) | 0 (0.0%) |
| 1 or 2 Children | 13 (0.7%) | 33 (8.1%) |
| 3 or 4 Children | 18 (3.9%) | 0 (0.0%) |
| 5 or more Children | 0 (0.0%) | 2 (22.2%) |
| Total | 74 (1.1%) | 35 (3.6%) |
Race in Muskego
The most populous races in Muskego are White / Caucasian (23,731 | 94.7%), Hispanic or Latino (981 | 3.9%), and Two or more Races (668 | 2.7%).
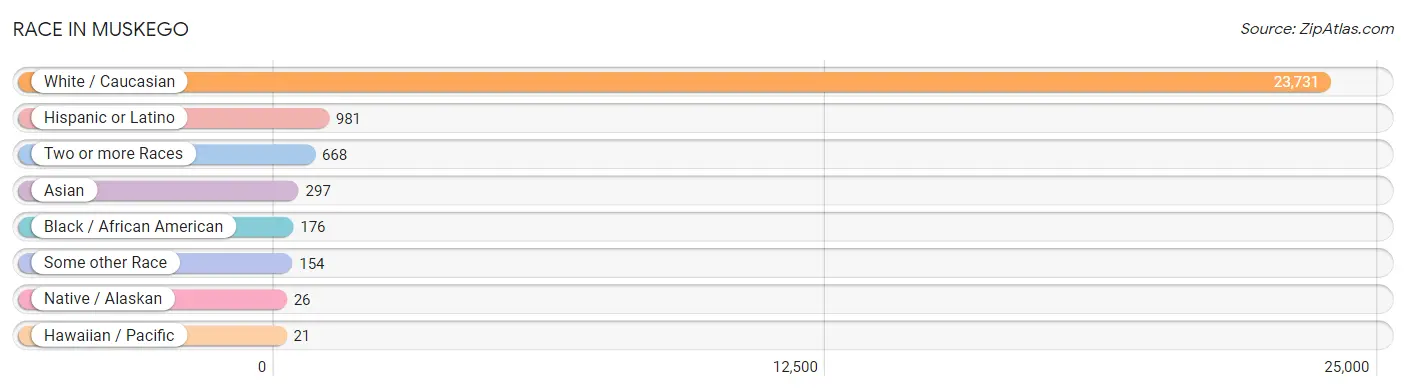
| Race | # Population | % Population |
| Asian | 297 | 1.2% |
| Black / African American | 176 | 0.7% |
| Hawaiian / Pacific | 21 | 0.1% |
| Hispanic or Latino | 981 | 3.9% |
| Native / Alaskan | 26 | 0.1% |
| White / Caucasian | 23,731 | 94.7% |
| Two or more Races | 668 | 2.7% |
| Some other Race | 154 | 0.6% |
| Total | 25,073 | 100.0% |
Ancestry in Muskego
The most populous ancestries reported in Muskego are German (11,681 | 46.6%), Polish (4,259 | 17.0%), Irish (3,640 | 14.5%), Italian (1,304 | 5.2%), and English (1,227 | 4.9%), together accounting for 88.2% of all Muskego residents.
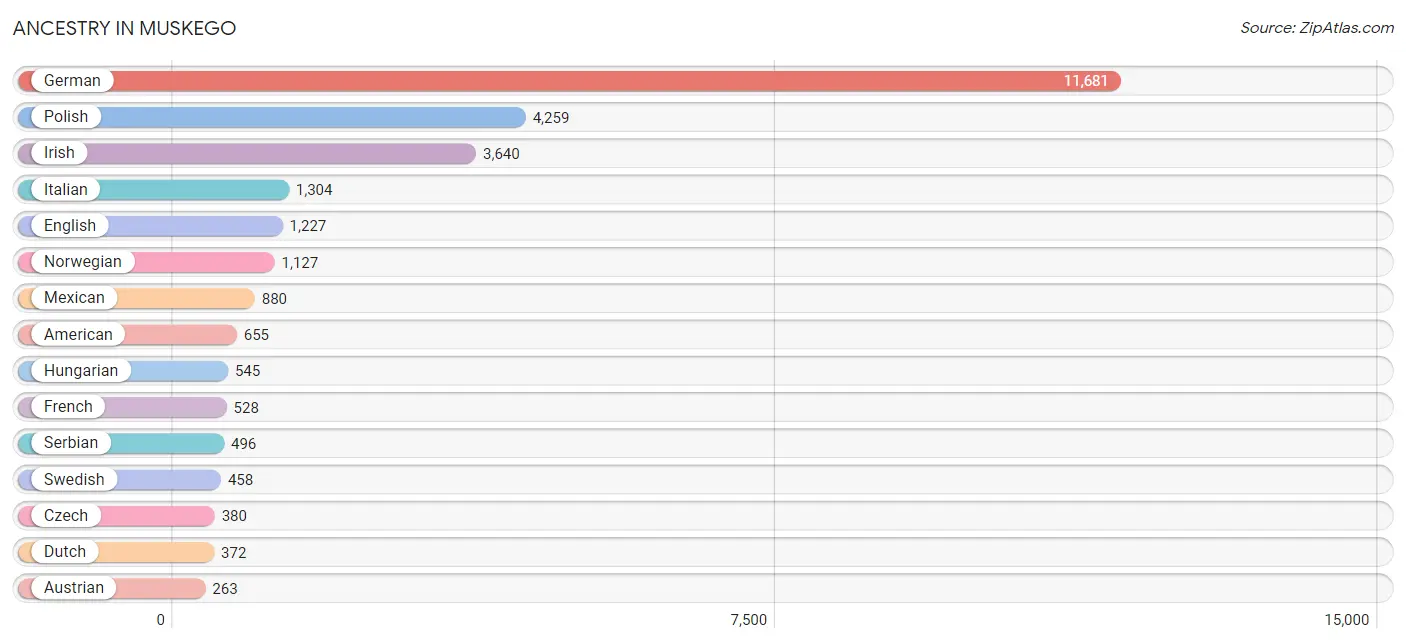
| Ancestry | # Population | % Population |
| American | 655 | 2.6% |
| Arab | 61 | 0.2% |
| Austrian | 263 | 1.1% |
| Bangladeshi | 36 | 0.1% |
| Belgian | 59 | 0.2% |
| Bhutanese | 88 | 0.4% |
| British | 50 | 0.2% |
| Burmese | 121 | 0.5% |
| Central American | 18 | 0.1% |
| Chilean | 14 | 0.1% |
| Chippewa | 4 | 0.0% |
| Croatian | 119 | 0.5% |
| Czech | 380 | 1.5% |
| Czechoslovakian | 52 | 0.2% |
| Danish | 172 | 0.7% |
| Dutch | 372 | 1.5% |
| English | 1,227 | 4.9% |
| European | 263 | 1.1% |
| Finnish | 172 | 0.7% |
| French | 528 | 2.1% |
| French Canadian | 103 | 0.4% |
| German | 11,681 | 46.6% |
| Greek | 191 | 0.8% |
| Guatemalan | 18 | 0.1% |
| Hungarian | 545 | 2.2% |
| Indian (Asian) | 100 | 0.4% |
| Iraqi | 61 | 0.2% |
| Irish | 3,640 | 14.5% |
| Iroquois | 13 | 0.1% |
| Italian | 1,304 | 5.2% |
| Japanese | 68 | 0.3% |
| Korean | 7 | 0.0% |
| Latvian | 10 | 0.0% |
| Lithuanian | 77 | 0.3% |
| Luxembourger | 7 | 0.0% |
| Macedonian | 16 | 0.1% |
| Menominee | 24 | 0.1% |
| Mexican | 880 | 3.5% |
| Mexican American Indian | 68 | 0.3% |
| Native Hawaiian | 41 | 0.2% |
| Northern European | 54 | 0.2% |
| Norwegian | 1,127 | 4.5% |
| Pennsylvania German | 8 | 0.0% |
| Polish | 4,259 | 17.0% |
| Puerto Rican | 46 | 0.2% |
| Russian | 123 | 0.5% |
| Scandinavian | 108 | 0.4% |
| Scotch-Irish | 152 | 0.6% |
| Scottish | 82 | 0.3% |
| Serbian | 496 | 2.0% |
| Slavic | 42 | 0.2% |
| Slovak | 47 | 0.2% |
| Slovene | 257 | 1.0% |
| South American | 14 | 0.1% |
| Sri Lankan | 11 | 0.0% |
| Swedish | 458 | 1.8% |
| Swiss | 186 | 0.7% |
| Thai | 23 | 0.1% |
| Ukrainian | 43 | 0.2% |
| Welsh | 26 | 0.1% |
| Yugoslavian | 91 | 0.4% | View All 61 Rows |
Immigrants in Muskego
The most numerous immigrant groups reported in Muskego came from Europe (407 | 1.6%), Asia (218 | 0.9%), Eastern Europe (213 | 0.9%), Western Europe (151 | 0.6%), and Central America (140 | 0.6%), together accounting for 4.5% of all Muskego residents.
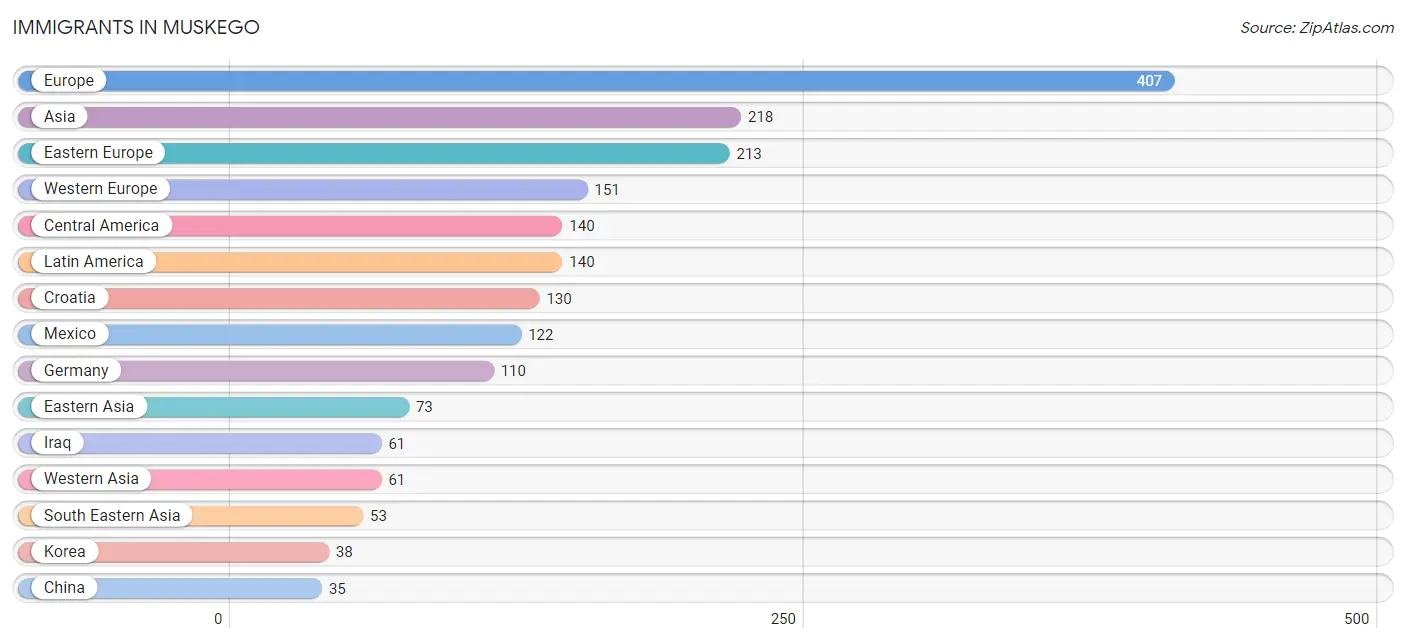
| Immigration Origin | # Population | % Population |
| Asia | 218 | 0.9% |
| Austria | 26 | 0.1% |
| Belarus | 10 | 0.0% |
| Bosnia and Herzegovina | 9 | 0.0% |
| Cambodia | 31 | 0.1% |
| Canada | 26 | 0.1% |
| Central America | 140 | 0.6% |
| China | 35 | 0.1% |
| Croatia | 130 | 0.5% |
| Eastern Asia | 73 | 0.3% |
| Eastern Europe | 213 | 0.9% |
| Europe | 407 | 1.6% |
| Germany | 110 | 0.4% |
| Guatemala | 18 | 0.1% |
| Hong Kong | 7 | 0.0% |
| India | 23 | 0.1% |
| Iraq | 61 | 0.2% |
| Italy | 23 | 0.1% |
| Korea | 38 | 0.2% |
| Latin America | 140 | 0.6% |
| Mexico | 122 | 0.5% |
| Netherlands | 15 | 0.1% |
| Northern Europe | 20 | 0.1% |
| Pakistan | 8 | 0.0% |
| Philippines | 18 | 0.1% |
| Poland | 26 | 0.1% |
| Russia | 13 | 0.1% |
| South Central Asia | 31 | 0.1% |
| South Eastern Asia | 53 | 0.2% |
| Southern Europe | 23 | 0.1% |
| Vietnam | 4 | 0.0% |
| Western Asia | 61 | 0.2% |
| Western Europe | 151 | 0.6% | View All 33 Rows |
Sex and Age in Muskego
Sex and Age in Muskego
The most populous age groups in Muskego are 60 to 64 Years (1,110 | 8.6%) for men and 50 to 54 Years (1,150 | 9.4%) for women.
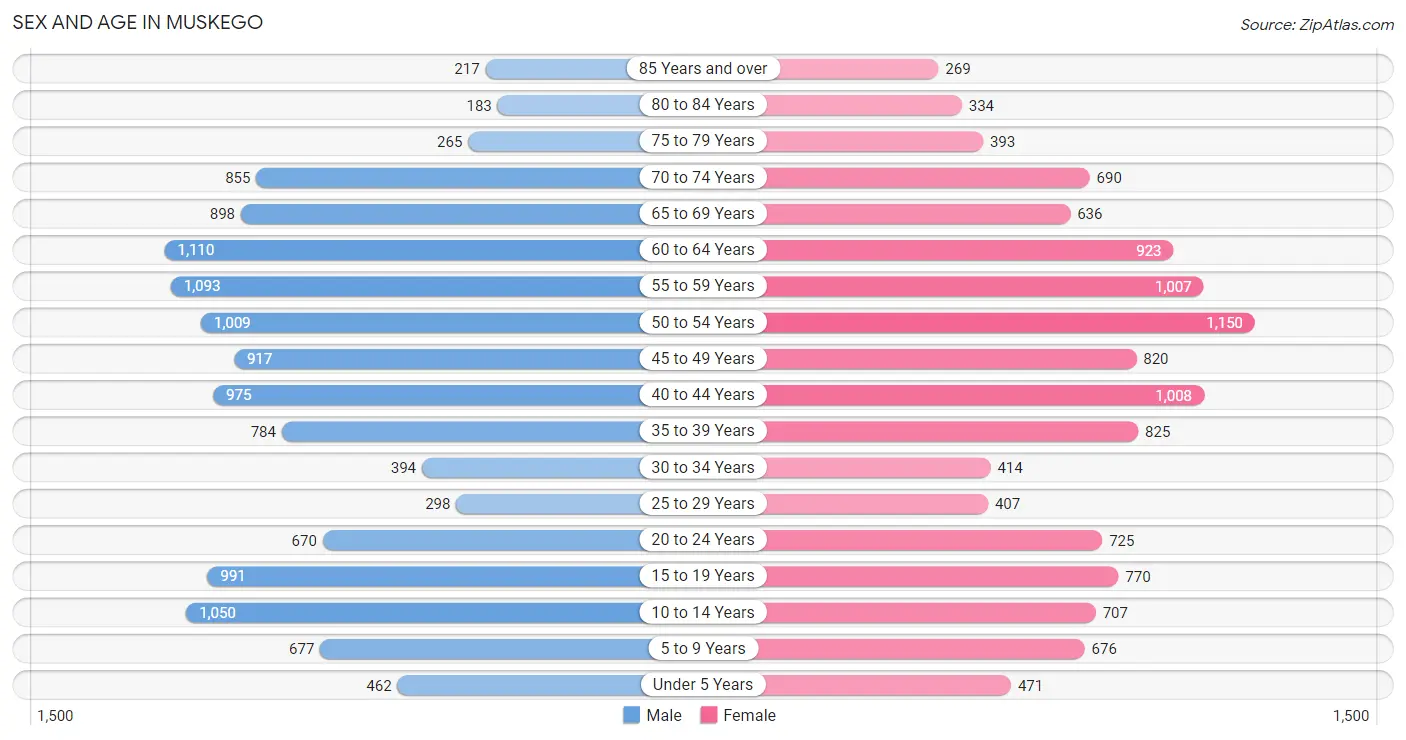
| Age Bracket | Male | Female |
| Under 5 Years | 462 (3.6%) | 471 (3.8%) |
| 5 to 9 Years | 677 (5.3%) | 676 (5.5%) |
| 10 to 14 Years | 1,050 (8.2%) | 707 (5.8%) |
| 15 to 19 Years | 991 (7.7%) | 770 (6.3%) |
| 20 to 24 Years | 670 (5.2%) | 725 (5.9%) |
| 25 to 29 Years | 298 (2.3%) | 407 (3.3%) |
| 30 to 34 Years | 394 (3.1%) | 414 (3.4%) |
| 35 to 39 Years | 784 (6.1%) | 825 (6.8%) |
| 40 to 44 Years | 975 (7.6%) | 1,008 (8.3%) |
| 45 to 49 Years | 917 (7.1%) | 820 (6.7%) |
| 50 to 54 Years | 1,009 (7.9%) | 1,150 (9.4%) |
| 55 to 59 Years | 1,093 (8.5%) | 1,007 (8.2%) |
| 60 to 64 Years | 1,110 (8.6%) | 923 (7.5%) |
| 65 to 69 Years | 898 (7.0%) | 636 (5.2%) |
| 70 to 74 Years | 855 (6.7%) | 690 (5.6%) |
| 75 to 79 Years | 265 (2.1%) | 393 (3.2%) |
| 80 to 84 Years | 183 (1.4%) | 334 (2.7%) |
| 85 Years and over | 217 (1.7%) | 269 (2.2%) |
| Total | 12,848 (100.0%) | 12,225 (100.0%) |
Families and Households in Muskego
Median Family Size in Muskego
The median family size in Muskego is 2.89 persons per family, with married-couple families (6,540 | 86.9%) accounting for the largest median family size of 2.95 persons per family. On the other hand, single female/mother families (615 | 8.2%) represent the smallest median family size with 2.42 persons per family.
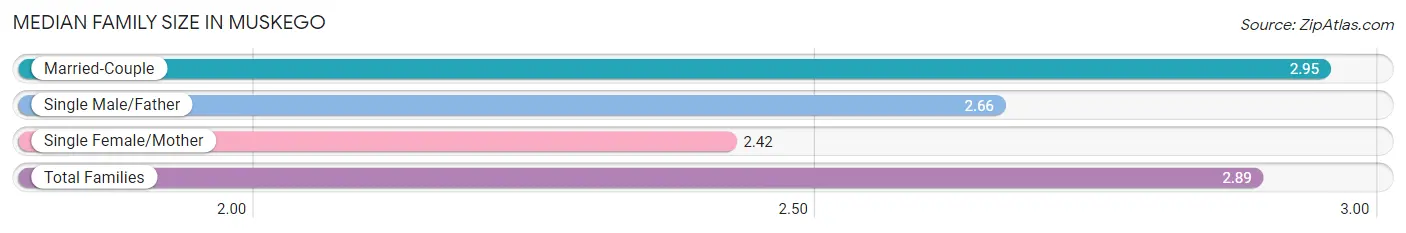
| Family Type | # Families | Family Size |
| Married-Couple | 6,540 (86.9%) | 2.95 |
| Single Male/Father | 367 (4.9%) | 2.66 |
| Single Female/Mother | 615 (8.2%) | 2.42 |
| Total Families | 7,522 (100.0%) | 2.89 |
Median Household Size in Muskego
The median household size in Muskego is 2.50 persons per household, with single male/father households (367 | 3.7%) accounting for the largest median household size of 2.97 persons per household. non-family households (2,444 | 24.5%) represent the smallest median household size with 1.18 persons per household.
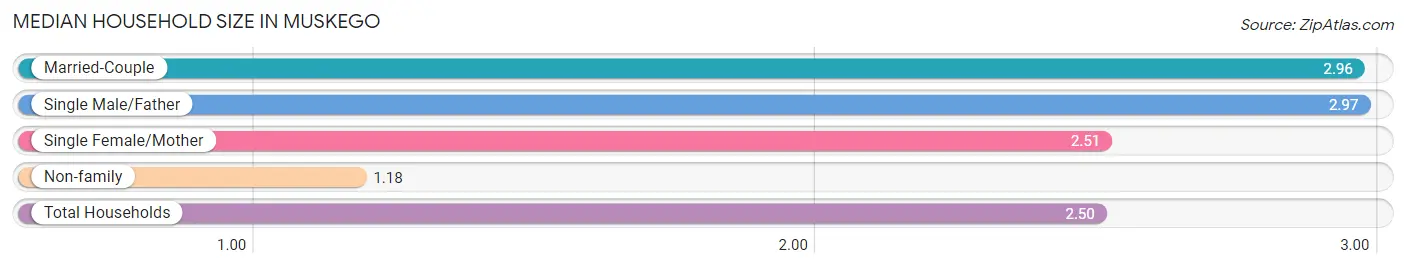
| Household Type | # Households | Household Size |
| Married-Couple | 6,540 (65.6%) | 2.96 |
| Single Male/Father | 367 (3.7%) | 2.97 |
| Single Female/Mother | 615 (6.2%) | 2.51 |
| Non-family | 2,444 (24.5%) | 1.18 |
| Total Households | 9,966 (100.0%) | 2.50 |
Household Size by Marriage Status in Muskego
Out of a total of 9,966 households in Muskego, 7,522 (75.5%) are family households, while 2,444 (24.5%) are nonfamily households. The most numerous type of family households are 2-person households, comprising 4,023, and the most common type of nonfamily households are 1-person households, comprising 2,157.
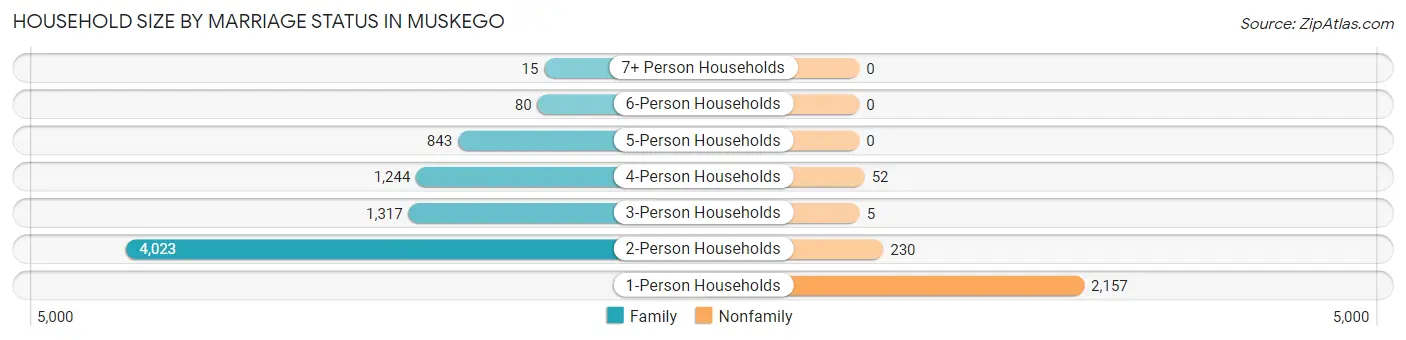
| Household Size | Family Households | Nonfamily Households |
| 1-Person Households | - | 2,157 (21.6%) |
| 2-Person Households | 4,023 (40.4%) | 230 (2.3%) |
| 3-Person Households | 1,317 (13.2%) | 5 (0.1%) |
| 4-Person Households | 1,244 (12.5%) | 52 (0.5%) |
| 5-Person Households | 843 (8.5%) | 0 (0.0%) |
| 6-Person Households | 80 (0.8%) | 0 (0.0%) |
| 7+ Person Households | 15 (0.2%) | 0 (0.0%) |
| Total | 7,522 (75.5%) | 2,444 (24.5%) |
Female Fertility in Muskego
Fertility by Age in Muskego
Average fertility rate in Muskego is 13.0 births per 1,000 women. Women in the age bracket of 20 to 34 years have the highest fertility rate with 45.0 births per 1,000 women. Women in the age bracket of 20 to 34 years acount for 100.0% of all women with births.
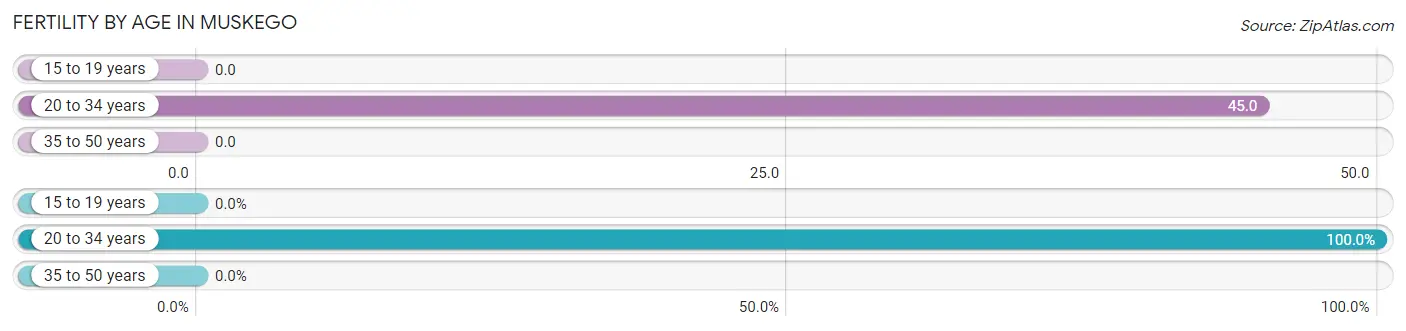
| Age Bracket | Women with Births | Births / 1,000 Women |
| 15 to 19 years | 0 (0.0%) | 0.0 |
| 20 to 34 years | 69 (100.0%) | 45.0 |
| 35 to 50 years | 0 (0.0%) | 0.0 |
| Total | 69 (100.0%) | 13.0 |
Fertility by Age by Marriage Status in Muskego
92.8% of women with births (69) in Muskego are married. The highest percentage of unmarried women with births falls into 20 to 34 years age bracket with 7.2% of them unmarried at the time of birth, while the lowest percentage of unmarried women with births belong to 20 to 34 years age bracket with 7.3% of them unmarried.
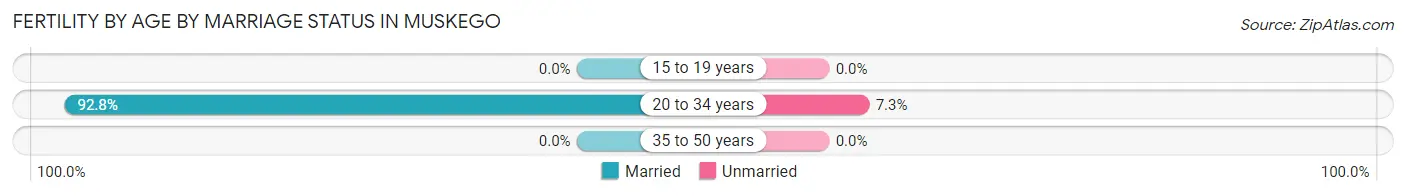
| Age Bracket | Married | Unmarried |
| 15 to 19 years | 0 (0.0%) | 0 (0.0%) |
| 20 to 34 years | 64 (92.7%) | 5 (7.2%) |
| 35 to 50 years | 0 (0.0%) | 0 (0.0%) |
| Total | 64 (92.7%) | 5 (7.2%) |
Fertility by Education in Muskego
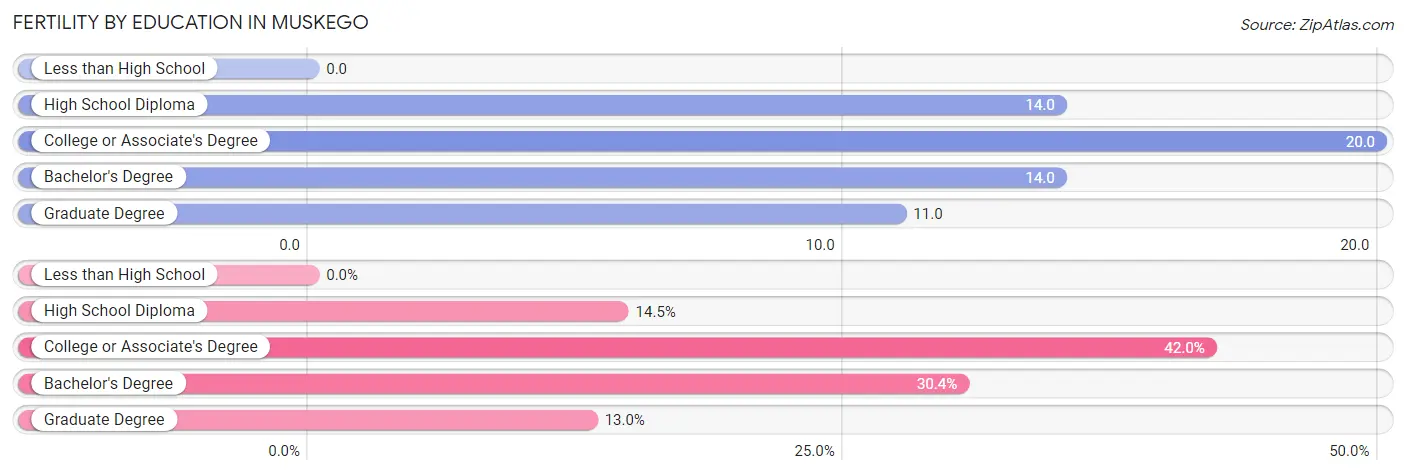
| Educational Attainment | Women with Births | Births / 1,000 Women |
| Less than High School | 0 (0.0%) | 0.0 |
| High School Diploma | 10 (14.5%) | 14.0 |
| College or Associate's Degree | 29 (42.0%) | 20.0 |
| Bachelor's Degree | 21 (30.4%) | 14.0 |
| Graduate Degree | 9 (13.0%) | 11.0 |
| Total | 69 (100.0%) | 13.0 |
Fertility by Education by Marriage Status in Muskego
7.2% of women with births in Muskego are unmarried. Women with the educational attainment of high school diploma are most likely to be married with 100.0% of them married at childbirth, while women with the educational attainment of college or associate's degree are least likely to be married with 17.2% of them unmarried at childbirth.
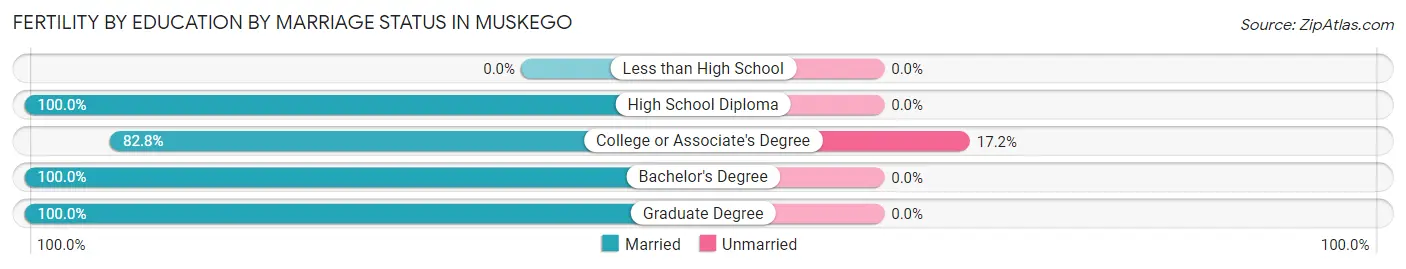
| Educational Attainment | Married | Unmarried |
| Less than High School | 0 (0.0%) | 0 (0.0%) |
| High School Diploma | 10 (100.0%) | 0 (0.0%) |
| College or Associate's Degree | 24 (82.8%) | 5 (17.2%) |
| Bachelor's Degree | 21 (100.0%) | 0 (0.0%) |
| Graduate Degree | 9 (100.0%) | 0 (0.0%) |
| Total | 64 (92.7%) | 5 (7.2%) |
Employment Characteristics in Muskego
Employment by Class of Employer in Muskego
Among the 13,450 employed individuals in Muskego, private company employees (10,003 | 74.4%), not-for-profit organizations (1,213 | 9.0%), and local government employees (768 | 5.7%) make up the most common classes of employment.
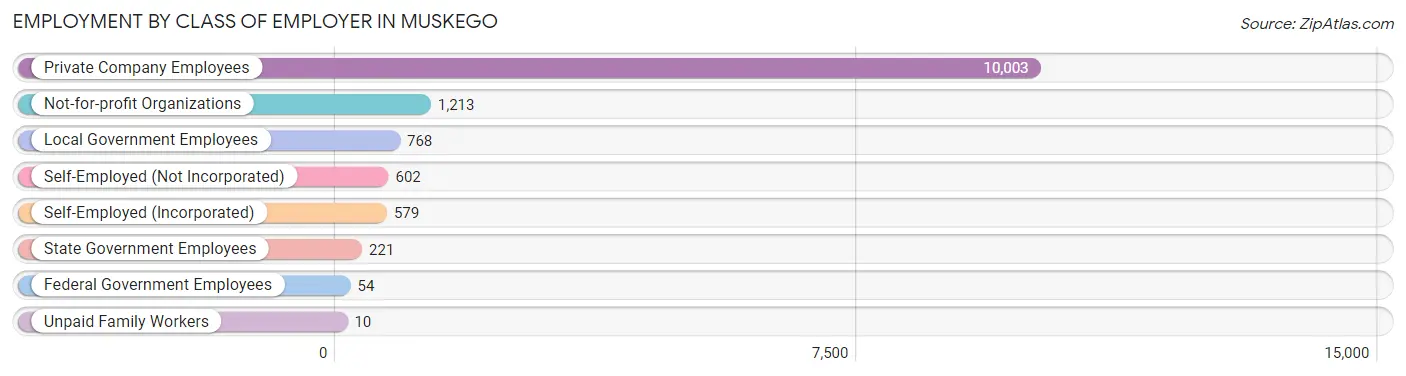
| Employer Class | # Employees | % Employees |
| Private Company Employees | 10,003 | 74.4% |
| Self-Employed (Incorporated) | 579 | 4.3% |
| Self-Employed (Not Incorporated) | 602 | 4.5% |
| Not-for-profit Organizations | 1,213 | 9.0% |
| Local Government Employees | 768 | 5.7% |
| State Government Employees | 221 | 1.6% |
| Federal Government Employees | 54 | 0.4% |
| Unpaid Family Workers | 10 | 0.1% |
| Total | 13,450 | 100.0% |
Employment Status by Age in Muskego
According to the labor force statistics for Muskego, out of the total population over 16 years of age (20,690), 67.8% or 14,028 individuals are in the labor force, with 3.5% or 491 of them unemployed. The age group with the highest labor force participation rate is 35 to 44 years, with 92.2% or 3,312 individuals in the labor force. Within the labor force, the 30 to 34 years age range has the highest percentage of unemployed individuals, with 11.8% or 88 of them being unemployed.
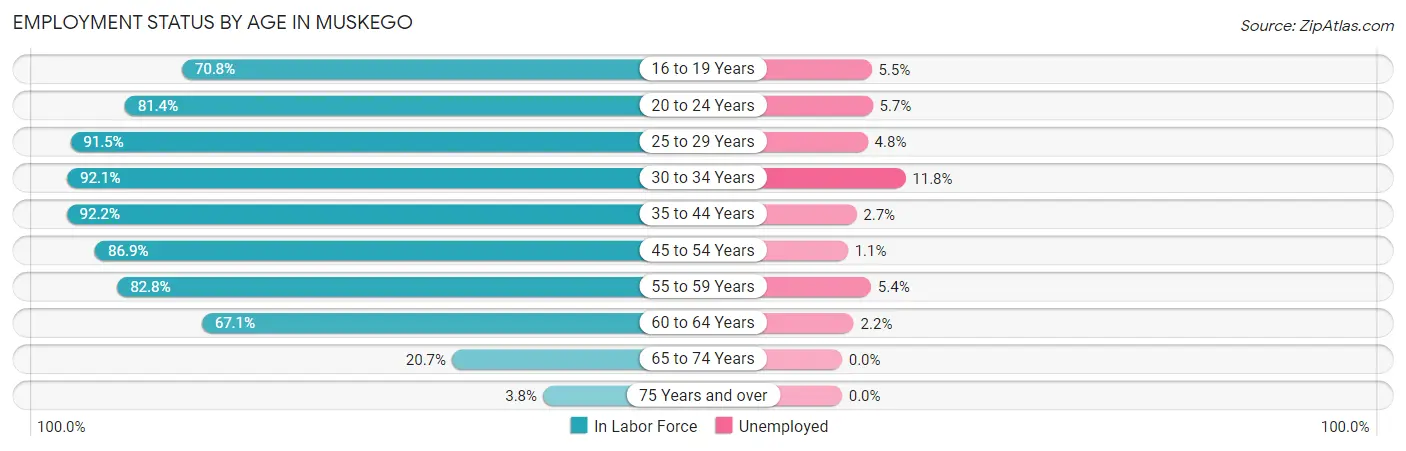
| Age Bracket | In Labor Force | Unemployed |
| 16 to 19 Years | 1,006 (70.8%) | 55 (5.5%) |
| 20 to 24 Years | 1,136 (81.4%) | 65 (5.7%) |
| 25 to 29 Years | 645 (91.5%) | 31 (4.8%) |
| 30 to 34 Years | 744 (92.1%) | 88 (11.8%) |
| 35 to 44 Years | 3,312 (92.2%) | 89 (2.7%) |
| 45 to 54 Years | 3,386 (86.9%) | 37 (1.1%) |
| 55 to 59 Years | 1,739 (82.8%) | 94 (5.4%) |
| 60 to 64 Years | 1,364 (67.1%) | 30 (2.2%) |
| 65 to 74 Years | 637 (20.7%) | 0 (0.0%) |
| 75 Years and over | 63 (3.8%) | 0 (0.0%) |
| Total | 14,028 (67.8%) | 491 (3.5%) |
Employment Status by Educational Attainment in Muskego
According to labor force statistics for Muskego, 85.2% of individuals (11,190) out of the total population between 25 and 64 years of age (13,134) are in the labor force, with 3.3% or 369 of them being unemployed. The group with the highest labor force participation rate are those with the educational attainment of bachelor's degree or higher, with 90.7% or 5,560 individuals in the labor force. Within the labor force, individuals with college / associate degree education have the highest percentage of unemployment, with 5.0% or 169 of them being unemployed.
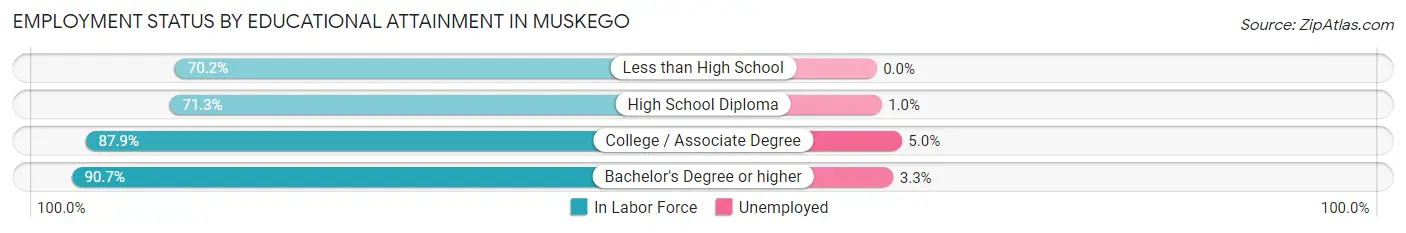
| Educational Attainment | In Labor Force | Unemployed |
| Less than High School | 337 (70.2%) | 0 (0.0%) |
| High School Diploma | 1,905 (71.3%) | 27 (1.0%) |
| College / Associate Degree | 3,386 (87.9%) | 193 (5.0%) |
| Bachelor's Degree or higher | 5,560 (90.7%) | 202 (3.3%) |
| Total | 11,190 (85.2%) | 433 (3.3%) |
Employment Occupations by Sex in Muskego
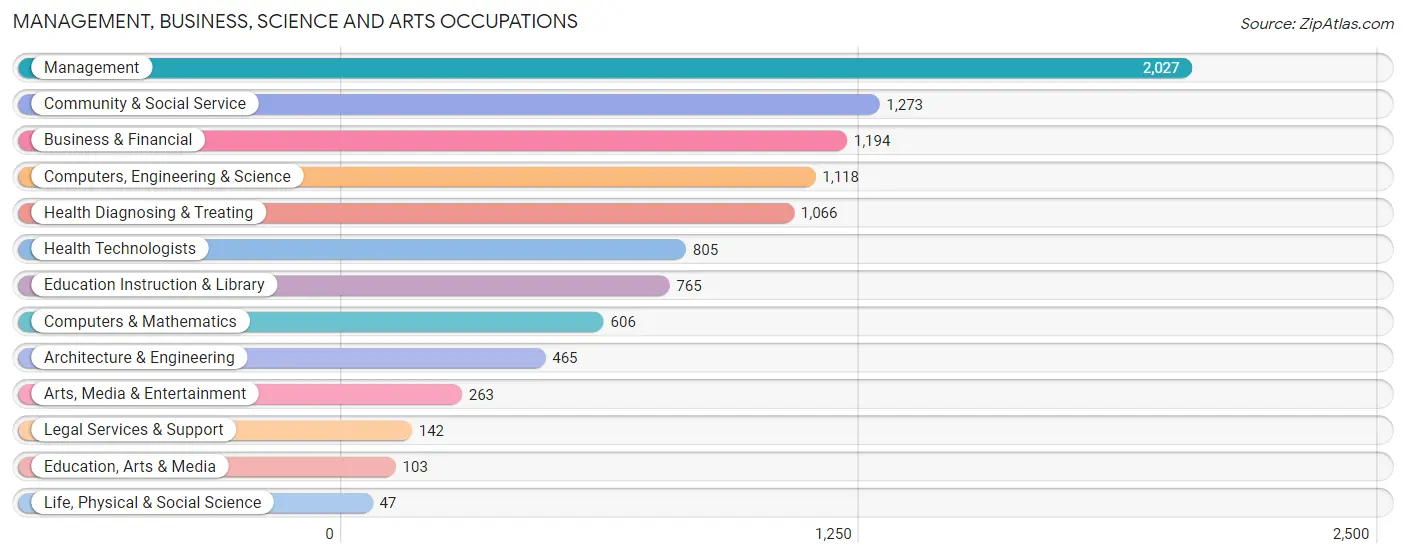
Management, Business, Science and Arts Occupations
The most common Management, Business, Science and Arts occupations in Muskego are Management (2,027 | 15.0%), Community & Social Service (1,273 | 9.4%), Business & Financial (1,194 | 8.8%), Computers, Engineering & Science (1,118 | 8.3%), and Health Diagnosing & Treating (1,066 | 7.9%).
Management, Business, Science and Arts Occupations by Sex
Within the Management, Business, Science and Arts occupations in Muskego, the most male-oriented occupations are Architecture & Engineering (81.1%), Computers & Mathematics (79.7%), and Computers, Engineering & Science (78.2%), while the most female-oriented occupations are Education, Arts & Media (87.4%), Education Instruction & Library (83.3%), and Health Technologists (75.4%).
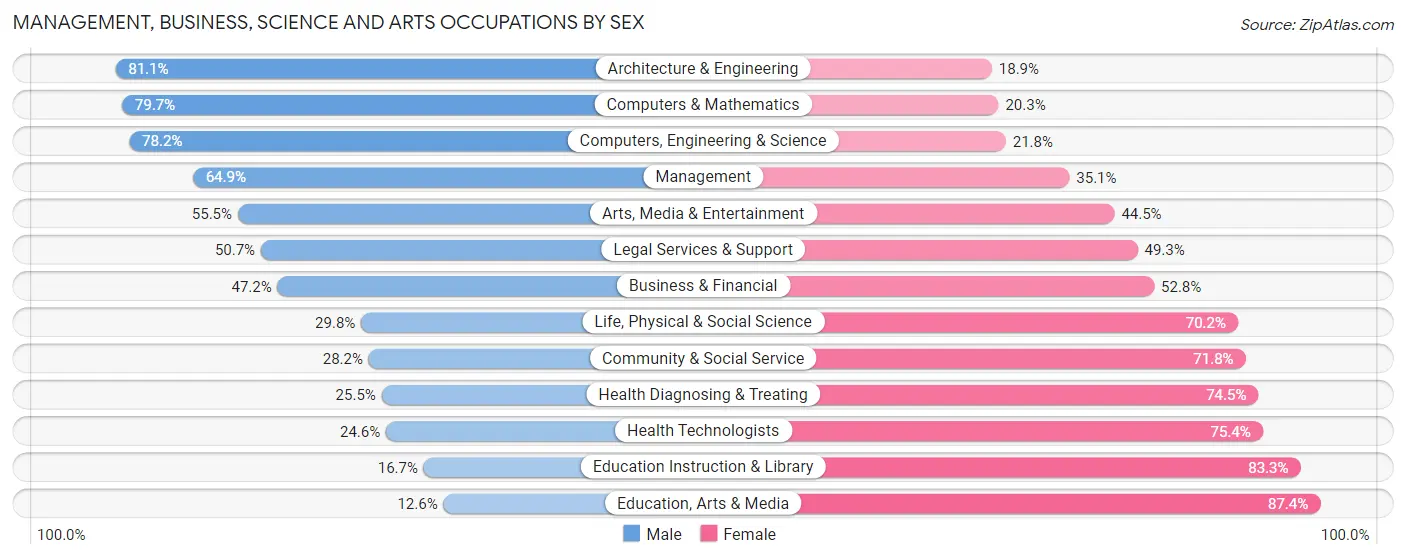
| Occupation | Male | Female |
| Management | 1,316 (64.9%) | 711 (35.1%) |
| Business & Financial | 564 (47.2%) | 630 (52.8%) |
| Computers, Engineering & Science | 874 (78.2%) | 244 (21.8%) |
| Computers & Mathematics | 483 (79.7%) | 123 (20.3%) |
| Architecture & Engineering | 377 (81.1%) | 88 (18.9%) |
| Life, Physical & Social Science | 14 (29.8%) | 33 (70.2%) |
| Community & Social Service | 359 (28.2%) | 914 (71.8%) |
| Education, Arts & Media | 13 (12.6%) | 90 (87.4%) |
| Legal Services & Support | 72 (50.7%) | 70 (49.3%) |
| Education Instruction & Library | 128 (16.7%) | 637 (83.3%) |
| Arts, Media & Entertainment | 146 (55.5%) | 117 (44.5%) |
| Health Diagnosing & Treating | 272 (25.5%) | 794 (74.5%) |
| Health Technologists | 198 (24.6%) | 607 (75.4%) |
| Total (Category) | 3,385 (50.7%) | 3,293 (49.3%) |
| Total (Overall) | 7,113 (52.5%) | 6,431 (47.5%) |
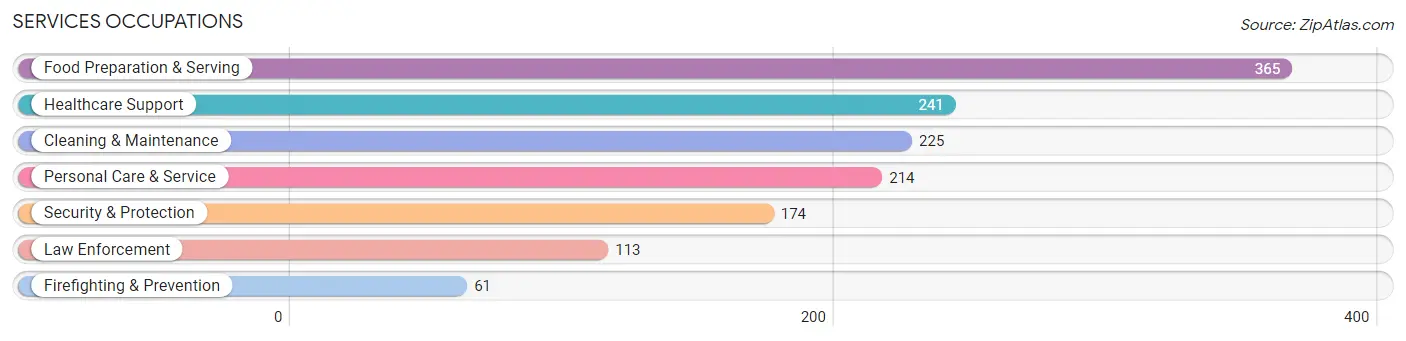
Services Occupations
The most common Services occupations in Muskego are Food Preparation & Serving (365 | 2.7%), Healthcare Support (241 | 1.8%), Cleaning & Maintenance (225 | 1.7%), Personal Care & Service (214 | 1.6%), and Security & Protection (174 | 1.3%).
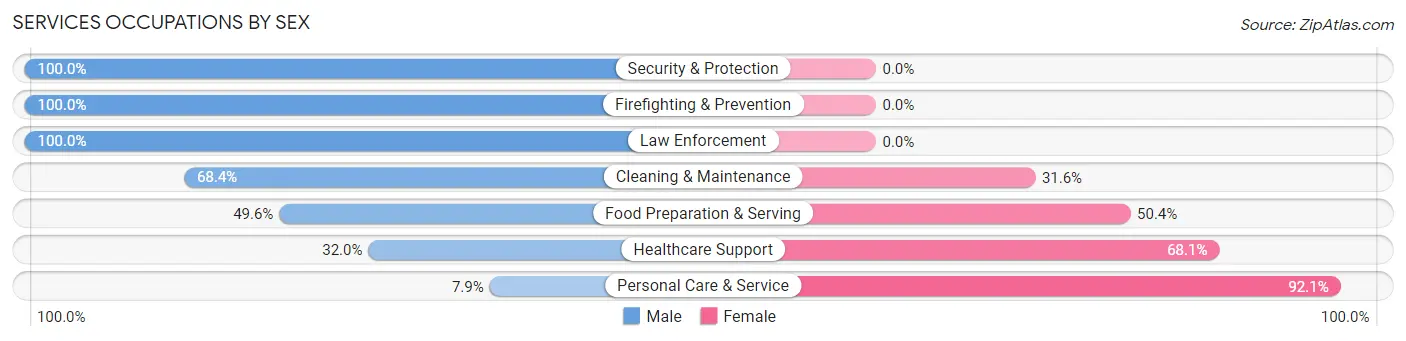
Services Occupations by Sex
Within the Services occupations in Muskego, the most male-oriented occupations are Security & Protection (100.0%), Firefighting & Prevention (100.0%), and Law Enforcement (100.0%), while the most female-oriented occupations are Personal Care & Service (92.1%), Healthcare Support (68.0%), and Food Preparation & Serving (50.4%).
| Occupation | Male | Female |
| Healthcare Support | 77 (32.0%) | 164 (68.0%) |
| Security & Protection | 174 (100.0%) | 0 (0.0%) |
| Firefighting & Prevention | 61 (100.0%) | 0 (0.0%) |
| Law Enforcement | 113 (100.0%) | 0 (0.0%) |
| Food Preparation & Serving | 181 (49.6%) | 184 (50.4%) |
| Cleaning & Maintenance | 154 (68.4%) | 71 (31.6%) |
| Personal Care & Service | 17 (7.9%) | 197 (92.1%) |
| Total (Category) | 603 (49.5%) | 616 (50.5%) |
| Total (Overall) | 7,113 (52.5%) | 6,431 (47.5%) |
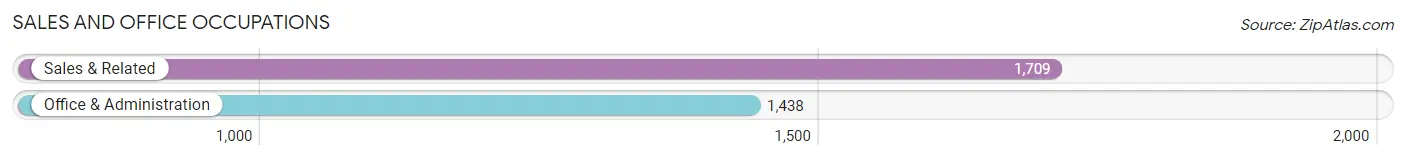
Sales and Office Occupations
The most common Sales and Office occupations in Muskego are Sales & Related (1,709 | 12.6%), and Office & Administration (1,438 | 10.6%).
Sales and Office Occupations by Sex
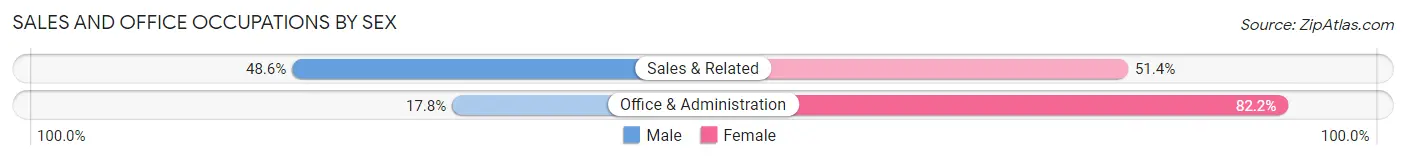
| Occupation | Male | Female |
| Sales & Related | 830 (48.6%) | 879 (51.4%) |
| Office & Administration | 256 (17.8%) | 1,182 (82.2%) |
| Total (Category) | 1,086 (34.5%) | 2,061 (65.5%) |
| Total (Overall) | 7,113 (52.5%) | 6,431 (47.5%) |
Natural Resources, Construction and Maintenance Occupations
The most common Natural Resources, Construction and Maintenance occupations in Muskego are Construction & Extraction (825 | 6.1%), Installation, Maintenance & Repair (329 | 2.4%), and Farming, Fishing & Forestry (38 | 0.3%).
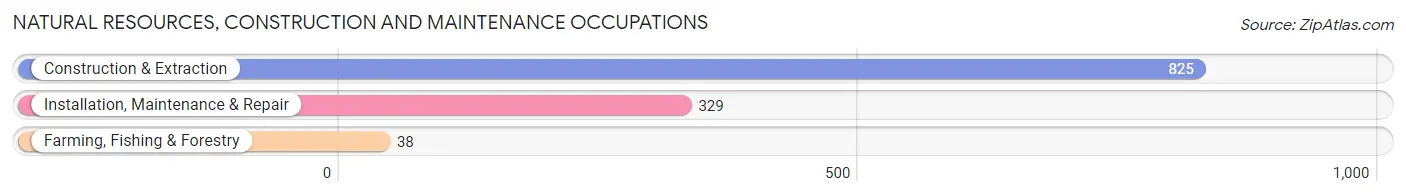
Natural Resources, Construction and Maintenance Occupations by Sex
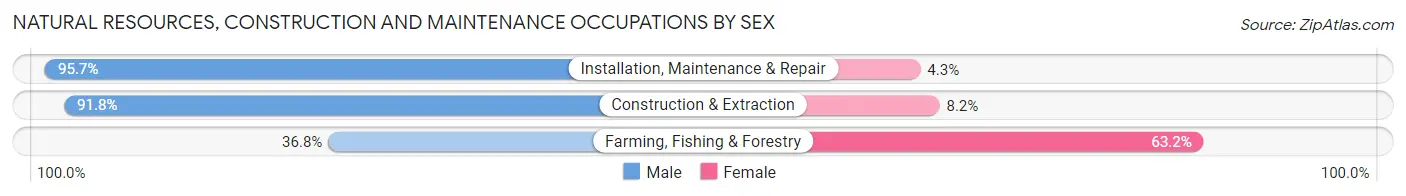
| Occupation | Male | Female |
| Farming, Fishing & Forestry | 14 (36.8%) | 24 (63.2%) |
| Construction & Extraction | 757 (91.8%) | 68 (8.2%) |
| Installation, Maintenance & Repair | 315 (95.7%) | 14 (4.3%) |
| Total (Category) | 1,086 (91.1%) | 106 (8.9%) |
| Total (Overall) | 7,113 (52.5%) | 6,431 (47.5%) |
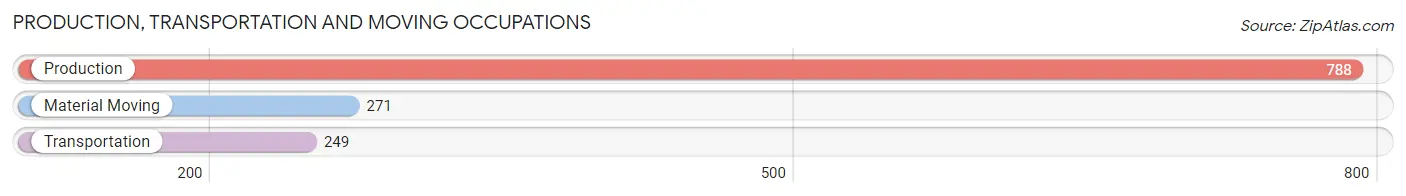
Production, Transportation and Moving Occupations
The most common Production, Transportation and Moving occupations in Muskego are Production (788 | 5.8%), Material Moving (271 | 2.0%), and Transportation (249 | 1.8%).
Production, Transportation and Moving Occupations by Sex
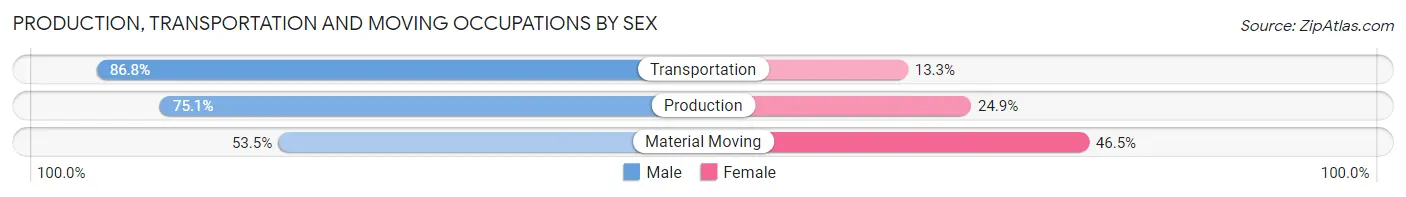
| Occupation | Male | Female |
| Production | 592 (75.1%) | 196 (24.9%) |
| Transportation | 216 (86.8%) | 33 (13.3%) |
| Material Moving | 145 (53.5%) | 126 (46.5%) |
| Total (Category) | 953 (72.9%) | 355 (27.1%) |
| Total (Overall) | 7,113 (52.5%) | 6,431 (47.5%) |
Employment Industries by Sex in Muskego
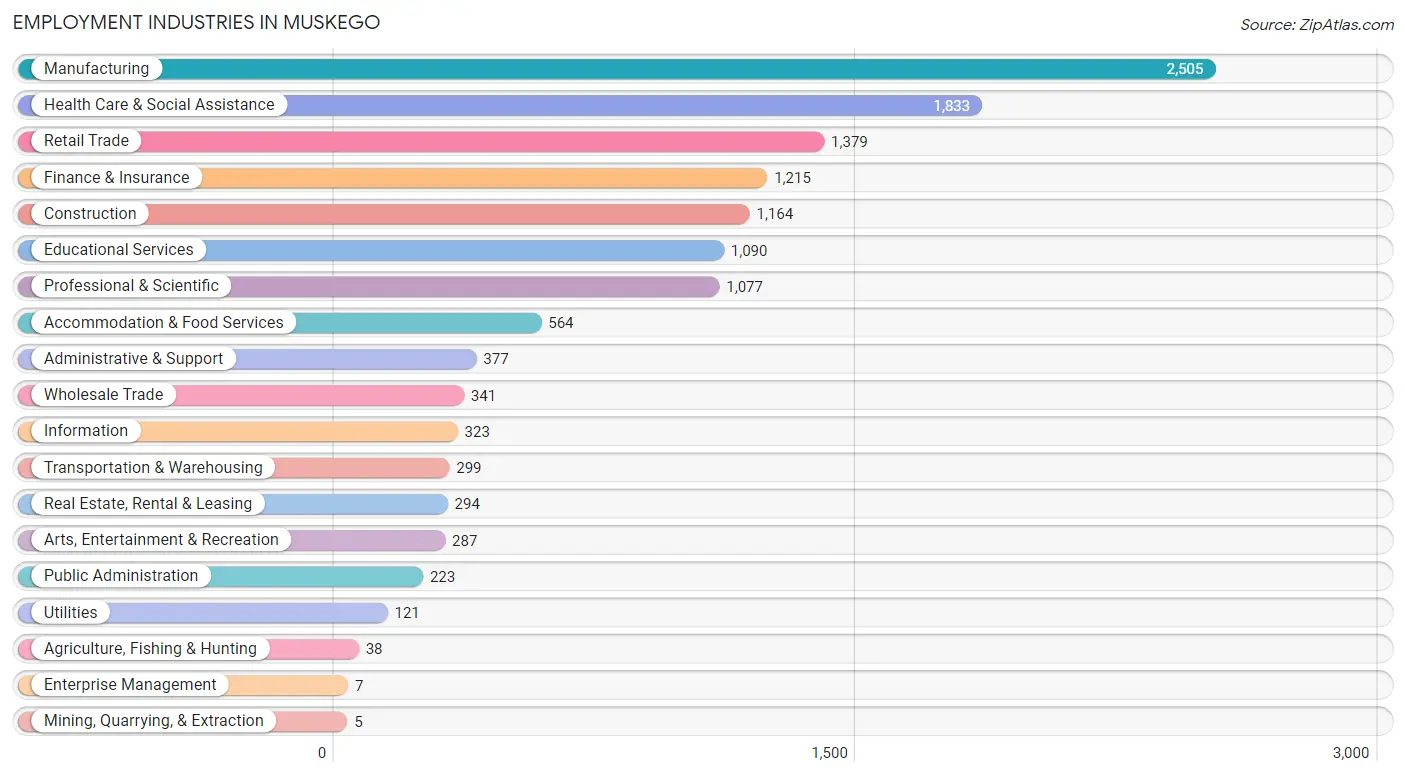
Employment Industries in Muskego
The major employment industries in Muskego include Manufacturing (2,505 | 18.5%), Health Care & Social Assistance (1,833 | 13.5%), Retail Trade (1,379 | 10.2%), Finance & Insurance (1,215 | 9.0%), and Construction (1,164 | 8.6%).
Employment Industries by Sex in Muskego
The Muskego industries that see more men than women are Mining, Quarrying, & Extraction (100.0%), Construction (87.8%), and Utilities (80.2%), whereas the industries that tend to have a higher number of women are Enterprise Management (100.0%), Health Care & Social Assistance (80.4%), and Educational Services (74.7%).
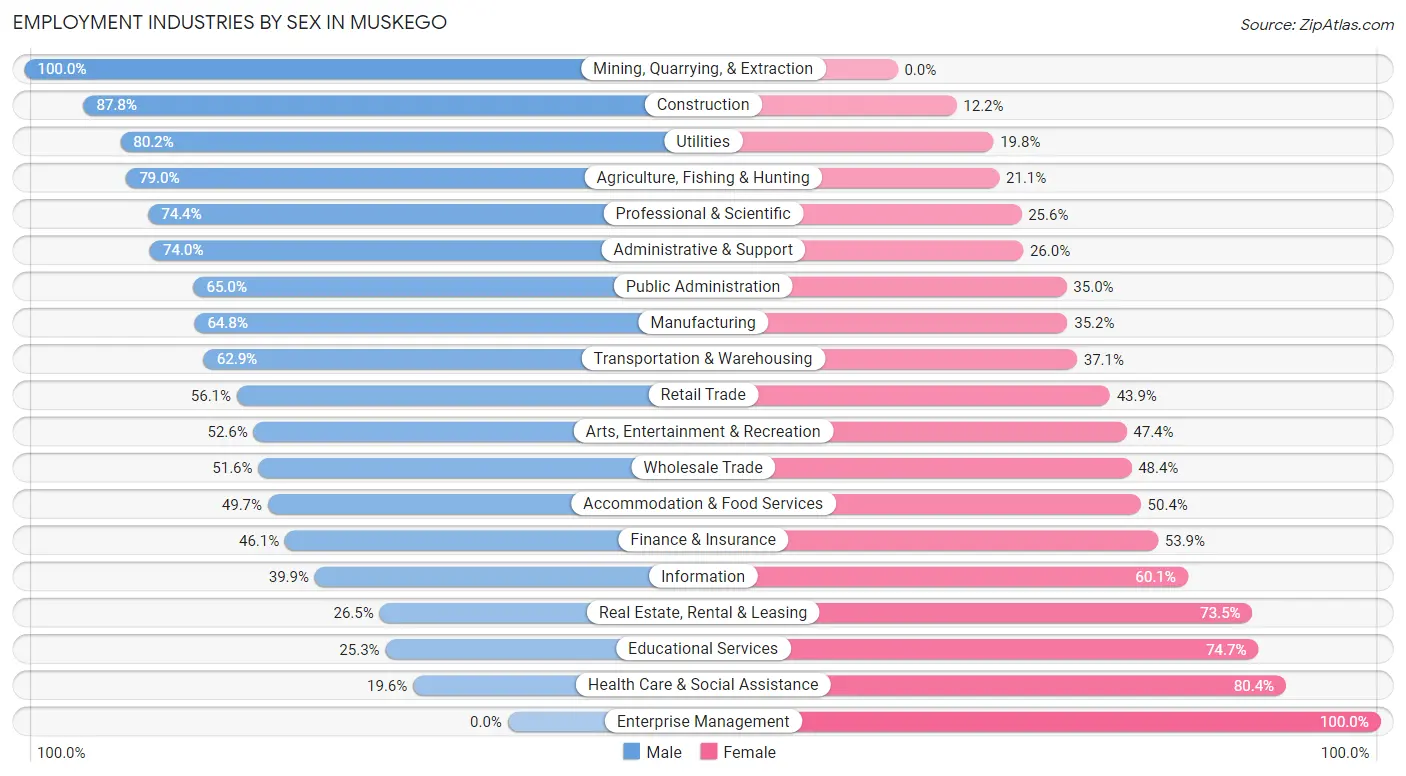
| Industry | Male | Female |
| Agriculture, Fishing & Hunting | 30 (78.9%) | 8 (21.0%) |
| Mining, Quarrying, & Extraction | 5 (100.0%) | 0 (0.0%) |
| Construction | 1,022 (87.8%) | 142 (12.2%) |
| Manufacturing | 1,624 (64.8%) | 881 (35.2%) |
| Wholesale Trade | 176 (51.6%) | 165 (48.4%) |
| Retail Trade | 773 (56.1%) | 606 (43.9%) |
| Transportation & Warehousing | 188 (62.9%) | 111 (37.1%) |
| Utilities | 97 (80.2%) | 24 (19.8%) |
| Information | 129 (39.9%) | 194 (60.1%) |
| Finance & Insurance | 560 (46.1%) | 655 (53.9%) |
| Real Estate, Rental & Leasing | 78 (26.5%) | 216 (73.5%) |
| Professional & Scientific | 801 (74.4%) | 276 (25.6%) |
| Enterprise Management | 0 (0.0%) | 7 (100.0%) |
| Administrative & Support | 279 (74.0%) | 98 (26.0%) |
| Educational Services | 276 (25.3%) | 814 (74.7%) |
| Health Care & Social Assistance | 359 (19.6%) | 1,474 (80.4%) |
| Arts, Entertainment & Recreation | 151 (52.6%) | 136 (47.4%) |
| Accommodation & Food Services | 280 (49.6%) | 284 (50.3%) |
| Public Administration | 145 (65.0%) | 78 (35.0%) |
| Total | 7,113 (52.5%) | 6,431 (47.5%) |
Education in Muskego
School Enrollment in Muskego
The most common levels of schooling among the 6,062 students in Muskego are high school (1,618 | 26.7%), middle school (1,559 | 25.7%), and college / undergraduate (1,043 | 17.2%).

| School Level | # Students | % Students |
| Nursery / Preschool | 321 | 5.3% |
| Kindergarten | 255 | 4.2% |
| Elementary School | 1,030 | 17.0% |
| Middle School | 1,559 | 25.7% |
| High School | 1,618 | 26.7% |
| College / Undergraduate | 1,043 | 17.2% |
| Graduate / Professional | 236 | 3.9% |
| Total | 6,062 | 100.0% |
School Enrollment by Age by Funding Source in Muskego
Out of a total of 6,062 students who are enrolled in schools in Muskego, 1,037 (17.1%) attend a private institution, while the remaining 5,025 (82.9%) are enrolled in public schools. The age group of 25 to 34 year olds has the highest likelihood of being enrolled in private schools, with 102 (60.0% in the age bracket) enrolled. Conversely, the age group of 15 to 17 year olds has the lowest likelihood of being enrolled in a private school, with 1,232 (98.5% in the age bracket) attending a public institution.
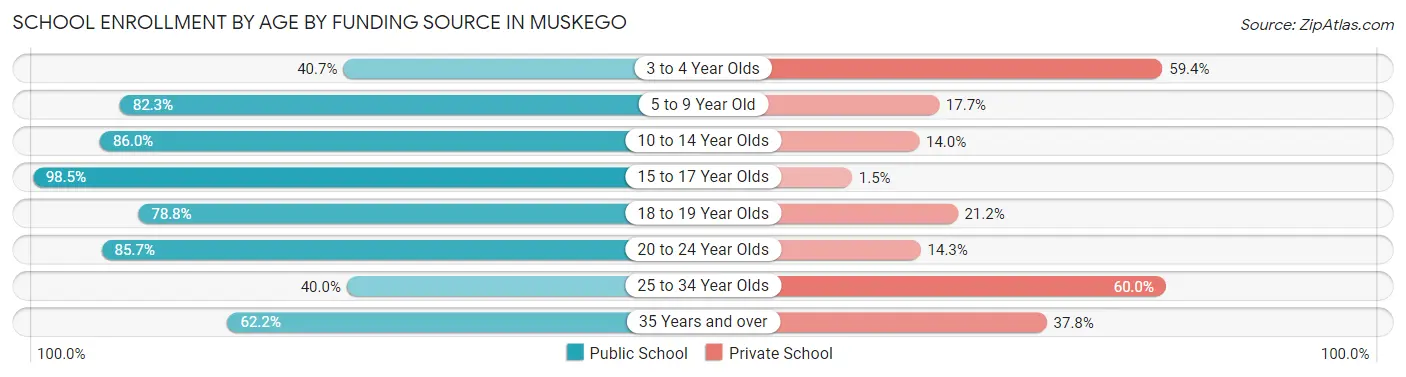
| Age Bracket | Public School | Private School |
| 3 to 4 Year Olds | 87 (40.6%) | 127 (59.4%) |
| 5 to 9 Year Old | 1,113 (82.3%) | 240 (17.7%) |
| 10 to 14 Year Olds | 1,500 (86.0%) | 245 (14.0%) |
| 15 to 17 Year Olds | 1,232 (98.5%) | 19 (1.5%) |
| 18 to 19 Year Olds | 275 (78.8%) | 74 (21.2%) |
| 20 to 24 Year Olds | 520 (85.7%) | 87 (14.3%) |
| 25 to 34 Year Olds | 68 (40.0%) | 102 (60.0%) |
| 35 Years and over | 232 (62.2%) | 141 (37.8%) |
| Total | 5,025 (82.9%) | 1,037 (17.1%) |
Educational Attainment by Field of Study in Muskego
Business (1,887 | 22.6%), education (1,151 | 13.8%), science & technology (1,040 | 12.5%), engineering (766 | 9.2%), and communications (516 | 6.2%) are the most common fields of study among 8,339 individuals in Muskego who have obtained a bachelor's degree or higher.
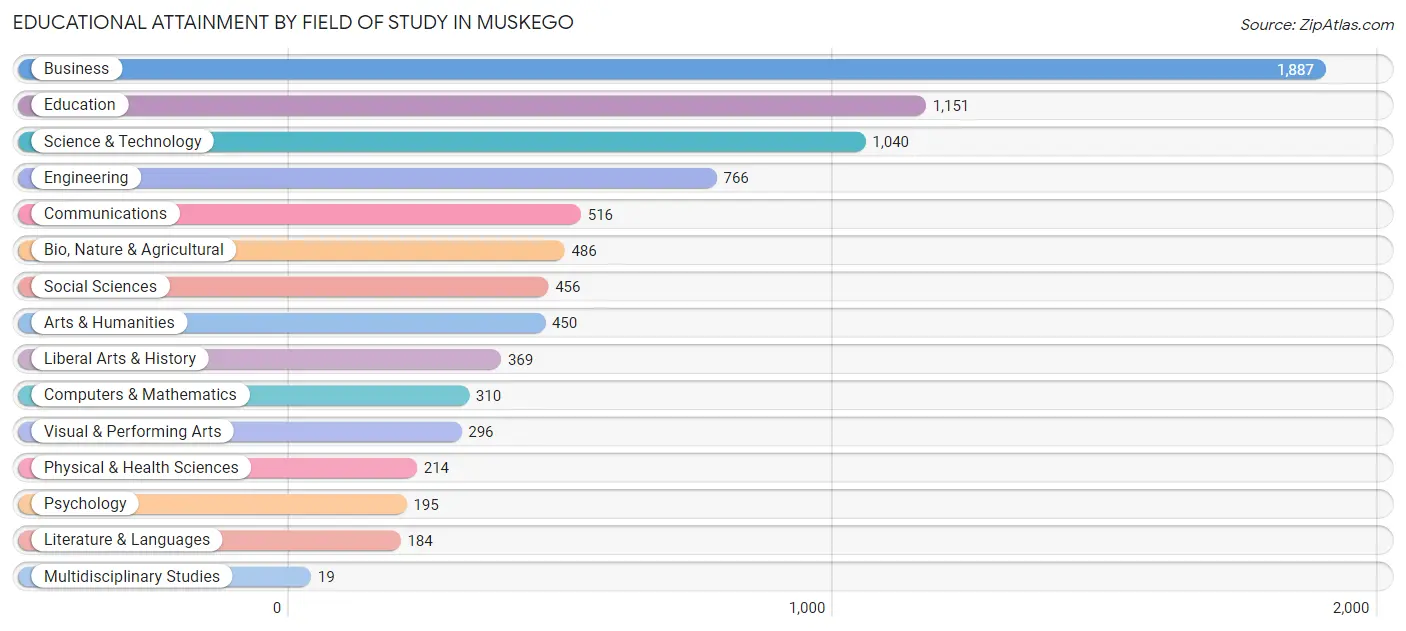
| Field of Study | # Graduates | % Graduates |
| Computers & Mathematics | 310 | 3.7% |
| Bio, Nature & Agricultural | 486 | 5.8% |
| Physical & Health Sciences | 214 | 2.6% |
| Psychology | 195 | 2.3% |
| Social Sciences | 456 | 5.5% |
| Engineering | 766 | 9.2% |
| Multidisciplinary Studies | 19 | 0.2% |
| Science & Technology | 1,040 | 12.5% |
| Business | 1,887 | 22.6% |
| Education | 1,151 | 13.8% |
| Literature & Languages | 184 | 2.2% |
| Liberal Arts & History | 369 | 4.4% |
| Visual & Performing Arts | 296 | 3.5% |
| Communications | 516 | 6.2% |
| Arts & Humanities | 450 | 5.4% |
| Total | 8,339 | 100.0% |
Transportation & Commute in Muskego
Vehicle Availability by Sex in Muskego
The most prevalent vehicle ownership categories in Muskego are males with 3 vehicles (2,839, accounting for 40.0%) and females with 3 vehicles (1,976, making up 44.7%).
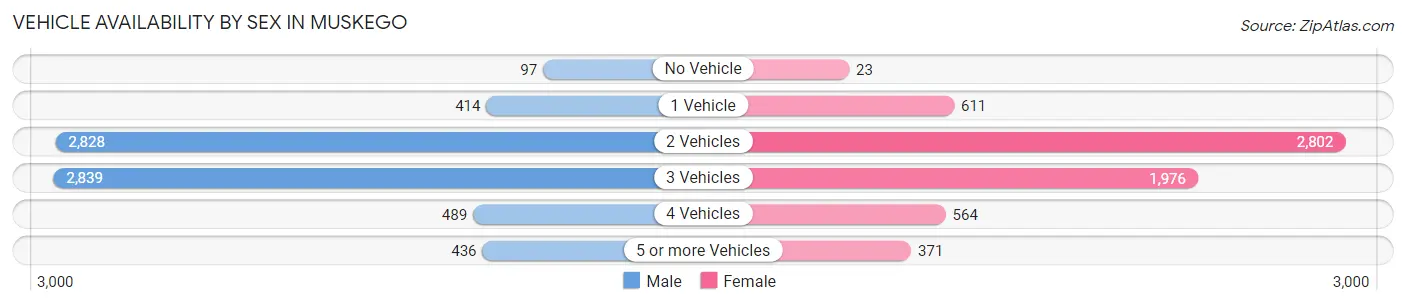
| Vehicles Available | Male | Female |
| No Vehicle | 97 (1.4%) | 23 (0.4%) |
| 1 Vehicle | 414 (5.8%) | 611 (9.6%) |
| 2 Vehicles | 2,828 (39.8%) | 2,802 (44.2%) |
| 3 Vehicles | 2,839 (40.0%) | 1,976 (31.1%) |
| 4 Vehicles | 489 (6.9%) | 564 (8.9%) |
| 5 or more Vehicles | 436 (6.1%) | 371 (5.9%) |
| Total | 7,103 (100.0%) | 6,347 (100.0%) |
Commute Time in Muskego
The most frequently occuring commute durations in Muskego are 30 to 34 minutes (2,240 commuters, 19.5%), 20 to 24 minutes (1,943 commuters, 16.9%), and 15 to 19 minutes (1,493 commuters, 13.0%).
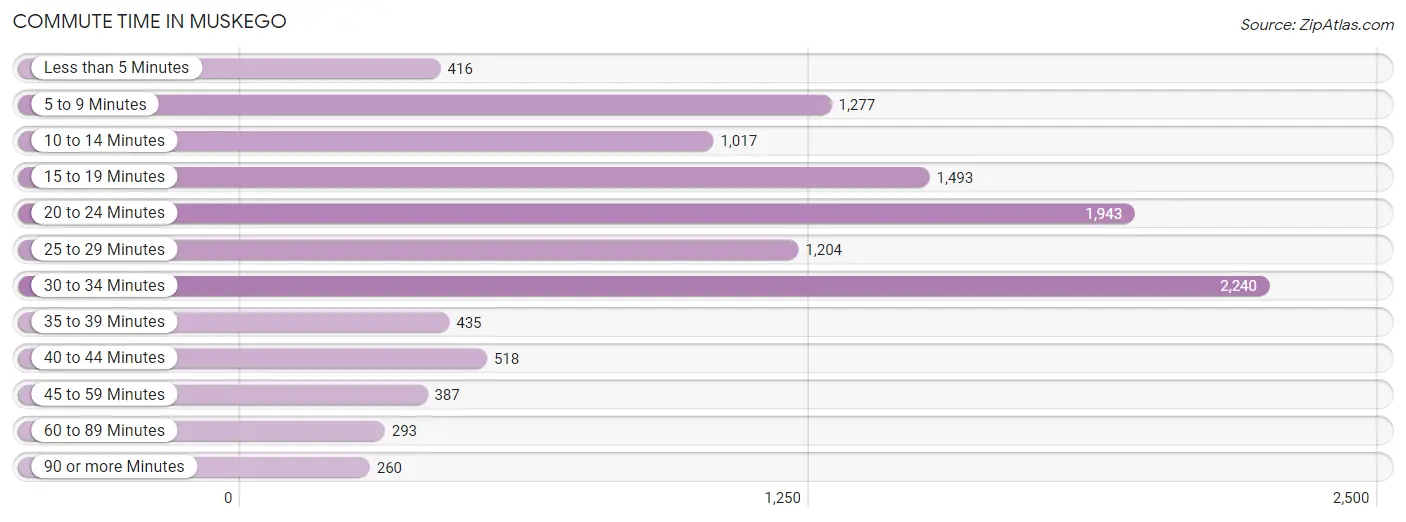
| Commute Time | # Commuters | % Commuters |
| Less than 5 Minutes | 416 | 3.6% |
| 5 to 9 Minutes | 1,277 | 11.1% |
| 10 to 14 Minutes | 1,017 | 8.9% |
| 15 to 19 Minutes | 1,493 | 13.0% |
| 20 to 24 Minutes | 1,943 | 16.9% |
| 25 to 29 Minutes | 1,204 | 10.5% |
| 30 to 34 Minutes | 2,240 | 19.5% |
| 35 to 39 Minutes | 435 | 3.8% |
| 40 to 44 Minutes | 518 | 4.5% |
| 45 to 59 Minutes | 387 | 3.4% |
| 60 to 89 Minutes | 293 | 2.5% |
| 90 or more Minutes | 260 | 2.3% |
Commute Time by Sex in Muskego
The most common commute times in Muskego are 30 to 34 minutes (1,302 commuters, 21.3%) for males and 30 to 34 minutes (938 commuters, 17.4%) for females.
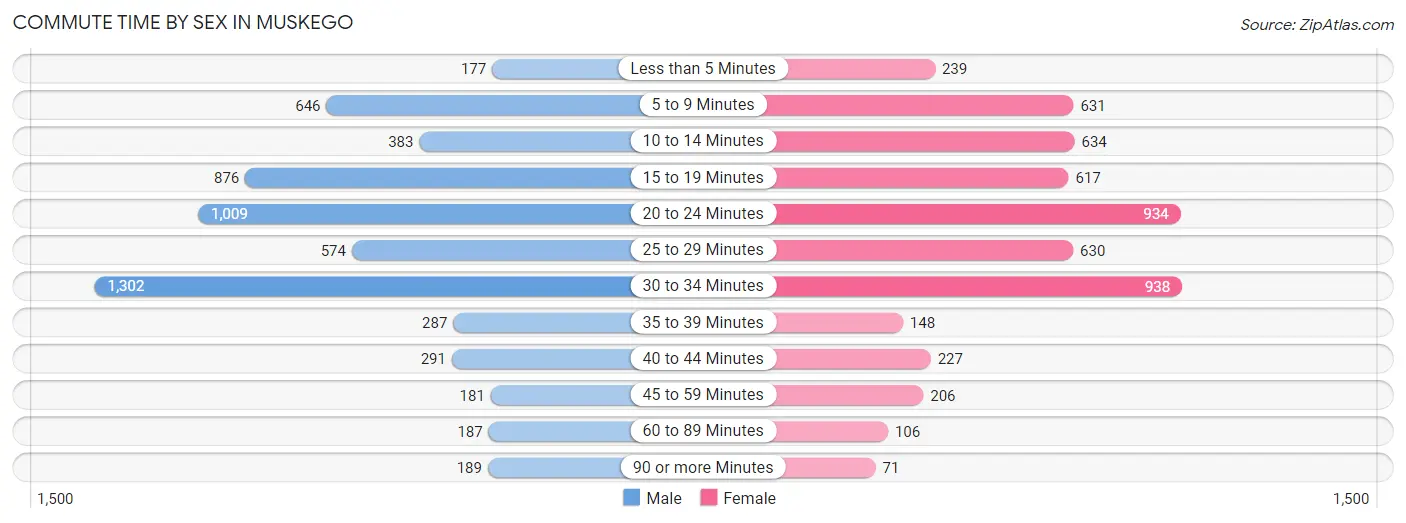
| Commute Time | Male | Female |
| Less than 5 Minutes | 177 (2.9%) | 239 (4.4%) |
| 5 to 9 Minutes | 646 (10.6%) | 631 (11.7%) |
| 10 to 14 Minutes | 383 (6.3%) | 634 (11.8%) |
| 15 to 19 Minutes | 876 (14.4%) | 617 (11.5%) |
| 20 to 24 Minutes | 1,009 (16.5%) | 934 (17.4%) |
| 25 to 29 Minutes | 574 (9.4%) | 630 (11.7%) |
| 30 to 34 Minutes | 1,302 (21.3%) | 938 (17.4%) |
| 35 to 39 Minutes | 287 (4.7%) | 148 (2.8%) |
| 40 to 44 Minutes | 291 (4.8%) | 227 (4.2%) |
| 45 to 59 Minutes | 181 (3.0%) | 206 (3.8%) |
| 60 to 89 Minutes | 187 (3.1%) | 106 (2.0%) |
| 90 or more Minutes | 189 (3.1%) | 71 (1.3%) |
Time of Departure to Work by Sex in Muskego
The most frequent times of departure to work in Muskego are 6:30 AM to 6:59 AM (970, 15.9%) for males and 7:00 AM to 7:29 AM (941, 17.5%) for females.
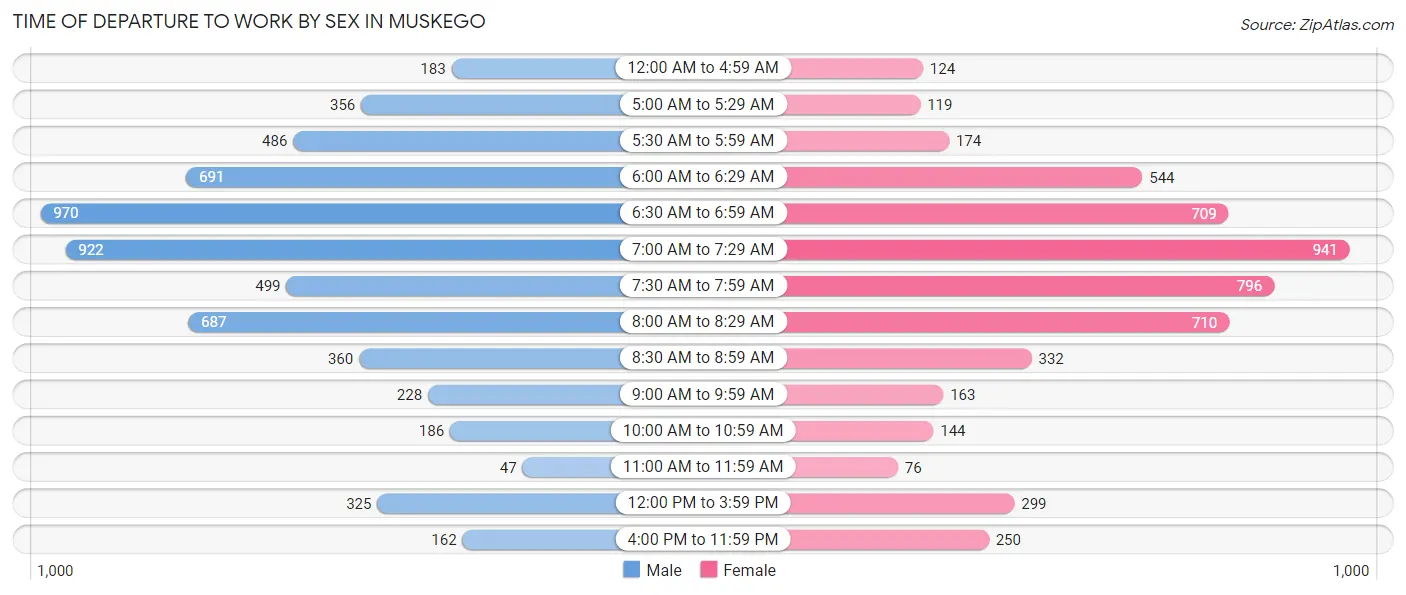
| Time of Departure | Male | Female |
| 12:00 AM to 4:59 AM | 183 (3.0%) | 124 (2.3%) |
| 5:00 AM to 5:29 AM | 356 (5.8%) | 119 (2.2%) |
| 5:30 AM to 5:59 AM | 486 (8.0%) | 174 (3.2%) |
| 6:00 AM to 6:29 AM | 691 (11.3%) | 544 (10.1%) |
| 6:30 AM to 6:59 AM | 970 (15.9%) | 709 (13.2%) |
| 7:00 AM to 7:29 AM | 922 (15.1%) | 941 (17.5%) |
| 7:30 AM to 7:59 AM | 499 (8.2%) | 796 (14.8%) |
| 8:00 AM to 8:29 AM | 687 (11.3%) | 710 (13.2%) |
| 8:30 AM to 8:59 AM | 360 (5.9%) | 332 (6.2%) |
| 9:00 AM to 9:59 AM | 228 (3.7%) | 163 (3.0%) |
| 10:00 AM to 10:59 AM | 186 (3.0%) | 144 (2.7%) |
| 11:00 AM to 11:59 AM | 47 (0.8%) | 76 (1.4%) |
| 12:00 PM to 3:59 PM | 325 (5.3%) | 299 (5.6%) |
| 4:00 PM to 11:59 PM | 162 (2.6%) | 250 (4.6%) |
| Total | 6,102 (100.0%) | 5,381 (100.0%) |
Housing Occupancy in Muskego
Occupancy by Ownership in Muskego
Of the total 9,966 dwellings in Muskego, owner-occupied units account for 8,838 (88.7%), while renter-occupied units make up 1,128 (11.3%).
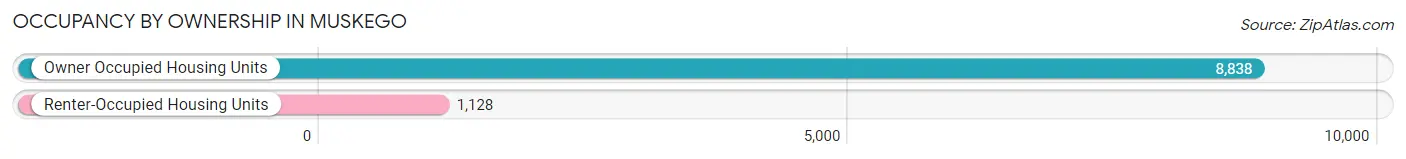
| Occupancy | # Housing Units | % Housing Units |
| Owner Occupied Housing Units | 8,838 | 88.7% |
| Renter-Occupied Housing Units | 1,128 | 11.3% |
| Total Occupied Housing Units | 9,966 | 100.0% |
Occupancy by Household Size in Muskego
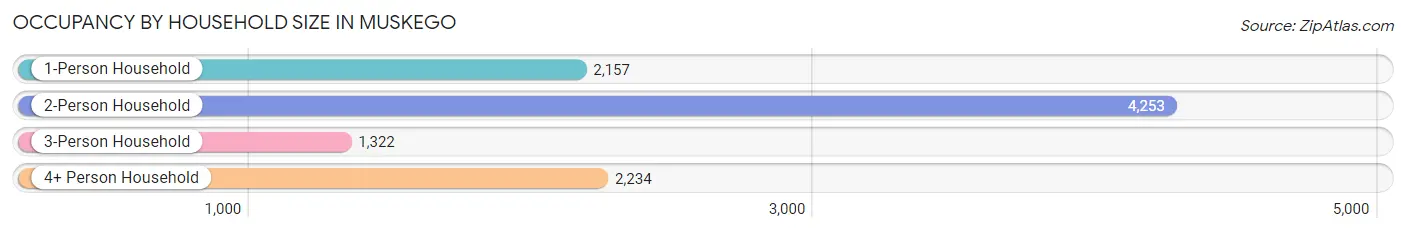
| Household Size | # Housing Units | % Housing Units |
| 1-Person Household | 2,157 | 21.6% |
| 2-Person Household | 4,253 | 42.7% |
| 3-Person Household | 1,322 | 13.3% |
| 4+ Person Household | 2,234 | 22.4% |
| Total Housing Units | 9,966 | 100.0% |
Occupancy by Ownership by Household Size in Muskego
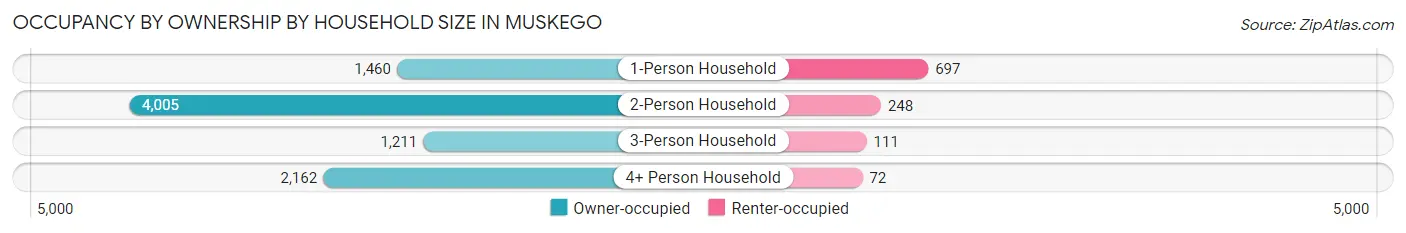
| Household Size | Owner-occupied | Renter-occupied |
| 1-Person Household | 1,460 (67.7%) | 697 (32.3%) |
| 2-Person Household | 4,005 (94.2%) | 248 (5.8%) |
| 3-Person Household | 1,211 (91.6%) | 111 (8.4%) |
| 4+ Person Household | 2,162 (96.8%) | 72 (3.2%) |
| Total Housing Units | 8,838 (88.7%) | 1,128 (11.3%) |
Occupancy by Educational Attainment in Muskego
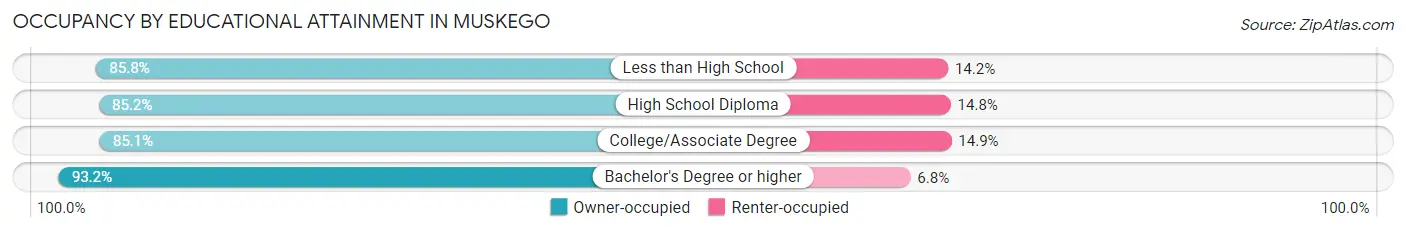
| Household Size | Owner-occupied | Renter-occupied |
| Less than High School | 289 (85.8%) | 48 (14.2%) |
| High School Diploma | 1,783 (85.2%) | 309 (14.8%) |
| College/Associate Degree | 2,715 (85.1%) | 476 (14.9%) |
| Bachelor's Degree or higher | 4,051 (93.2%) | 295 (6.8%) |
Occupancy by Age of Householder in Muskego
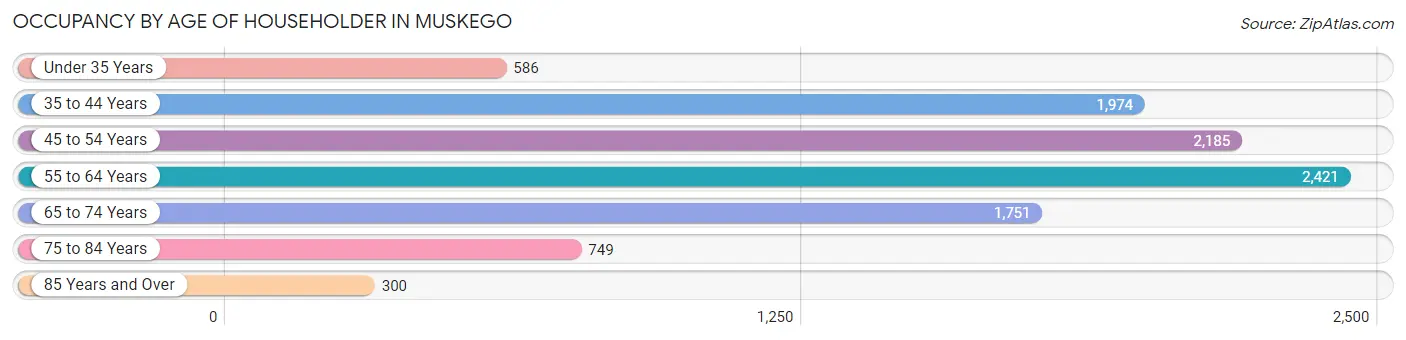
| Age Bracket | # Households | % Households |
| Under 35 Years | 586 | 5.9% |
| 35 to 44 Years | 1,974 | 19.8% |
| 45 to 54 Years | 2,185 | 21.9% |
| 55 to 64 Years | 2,421 | 24.3% |
| 65 to 74 Years | 1,751 | 17.6% |
| 75 to 84 Years | 749 | 7.5% |
| 85 Years and Over | 300 | 3.0% |
| Total | 9,966 | 100.0% |
Housing Finances in Muskego
Median Income by Occupancy in Muskego
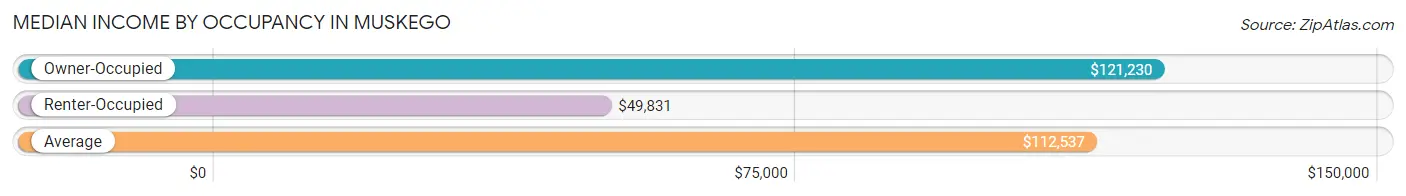
| Occupancy Type | # Households | Median Income |
| Owner-Occupied | 8,838 (88.7%) | $121,230 |
| Renter-Occupied | 1,128 (11.3%) | $49,831 |
| Average | 9,966 (100.0%) | $112,537 |
Occupancy by Householder Income Bracket in Muskego
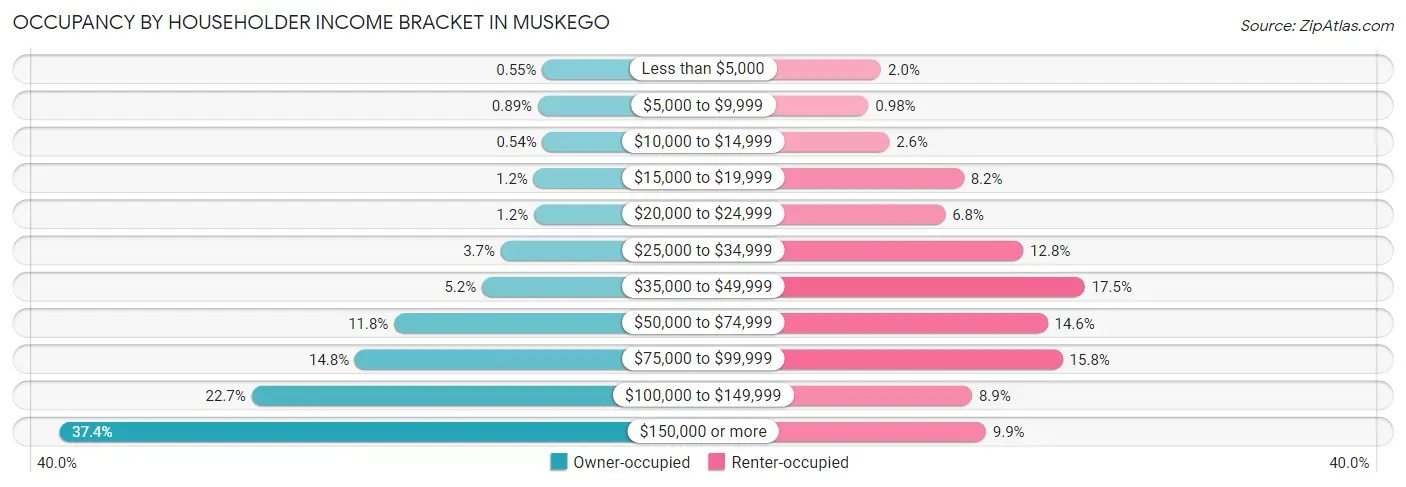
| Income Bracket | Owner-occupied | Renter-occupied |
| Less than $5,000 | 49 (0.5%) | 22 (1.9%) |
| $5,000 to $9,999 | 79 (0.9%) | 11 (1.0%) |
| $10,000 to $14,999 | 48 (0.5%) | 29 (2.6%) |
| $15,000 to $19,999 | 107 (1.2%) | 93 (8.2%) |
| $20,000 to $24,999 | 105 (1.2%) | 77 (6.8%) |
| $25,000 to $34,999 | 329 (3.7%) | 144 (12.8%) |
| $35,000 to $49,999 | 455 (5.1%) | 197 (17.5%) |
| $50,000 to $74,999 | 1,046 (11.8%) | 165 (14.6%) |
| $75,000 to $99,999 | 1,310 (14.8%) | 178 (15.8%) |
| $100,000 to $149,999 | 2,007 (22.7%) | 100 (8.9%) |
| $150,000 or more | 3,303 (37.4%) | 112 (9.9%) |
| Total | 8,838 (100.0%) | 1,128 (100.0%) |
Monthly Housing Cost Tiers in Muskego
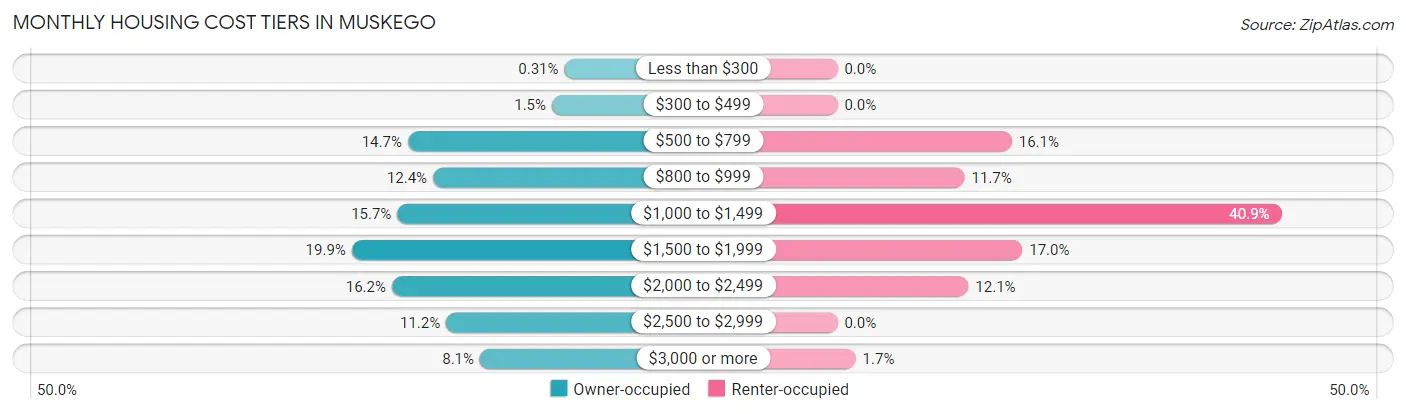
| Monthly Cost | Owner-occupied | Renter-occupied |
| Less than $300 | 27 (0.3%) | 0 (0.0%) |
| $300 to $499 | 129 (1.5%) | 0 (0.0%) |
| $500 to $799 | 1,302 (14.7%) | 181 (16.1%) |
| $800 to $999 | 1,097 (12.4%) | 132 (11.7%) |
| $1,000 to $1,499 | 1,388 (15.7%) | 461 (40.9%) |
| $1,500 to $1,999 | 1,758 (19.9%) | 192 (17.0%) |
| $2,000 to $2,499 | 1,432 (16.2%) | 136 (12.1%) |
| $2,500 to $2,999 | 990 (11.2%) | 0 (0.0%) |
| $3,000 or more | 715 (8.1%) | 19 (1.7%) |
| Total | 8,838 (100.0%) | 1,128 (100.0%) |
Physical Housing Characteristics in Muskego
Housing Structures in Muskego
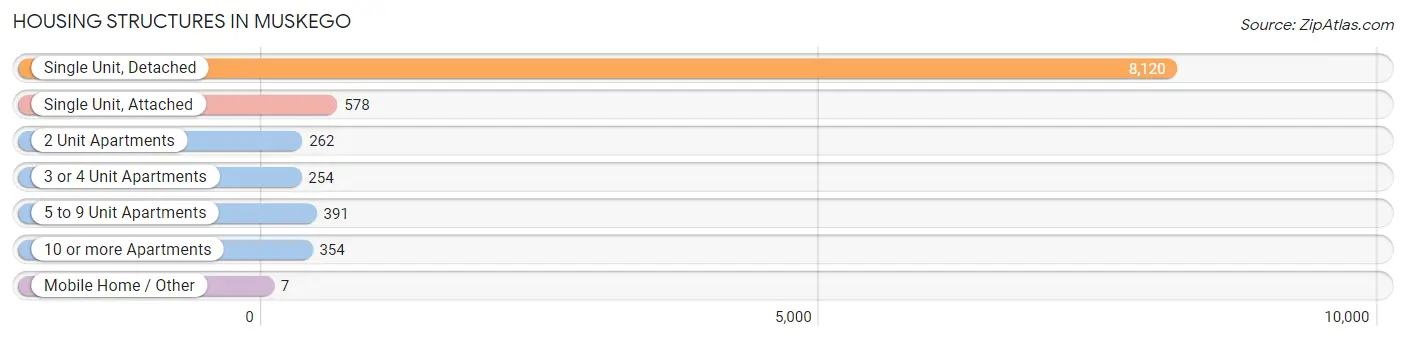
| Structure Type | # Housing Units | % Housing Units |
| Single Unit, Detached | 8,120 | 81.5% |
| Single Unit, Attached | 578 | 5.8% |
| 2 Unit Apartments | 262 | 2.6% |
| 3 or 4 Unit Apartments | 254 | 2.5% |
| 5 to 9 Unit Apartments | 391 | 3.9% |
| 10 or more Apartments | 354 | 3.5% |
| Mobile Home / Other | 7 | 0.1% |
| Total | 9,966 | 100.0% |
Housing Structures by Occupancy in Muskego
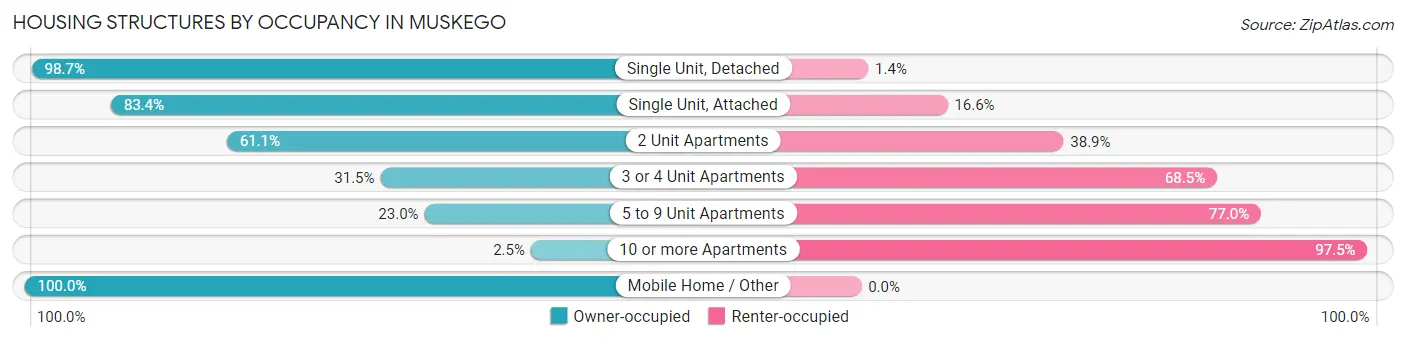
| Structure Type | Owner-occupied | Renter-occupied |
| Single Unit, Detached | 8,010 (98.7%) | 110 (1.3%) |
| Single Unit, Attached | 482 (83.4%) | 96 (16.6%) |
| 2 Unit Apartments | 160 (61.1%) | 102 (38.9%) |
| 3 or 4 Unit Apartments | 80 (31.5%) | 174 (68.5%) |
| 5 to 9 Unit Apartments | 90 (23.0%) | 301 (77.0%) |
| 10 or more Apartments | 9 (2.5%) | 345 (97.5%) |
| Mobile Home / Other | 7 (100.0%) | 0 (0.0%) |
| Total | 8,838 (88.7%) | 1,128 (11.3%) |
Housing Structures by Number of Rooms in Muskego
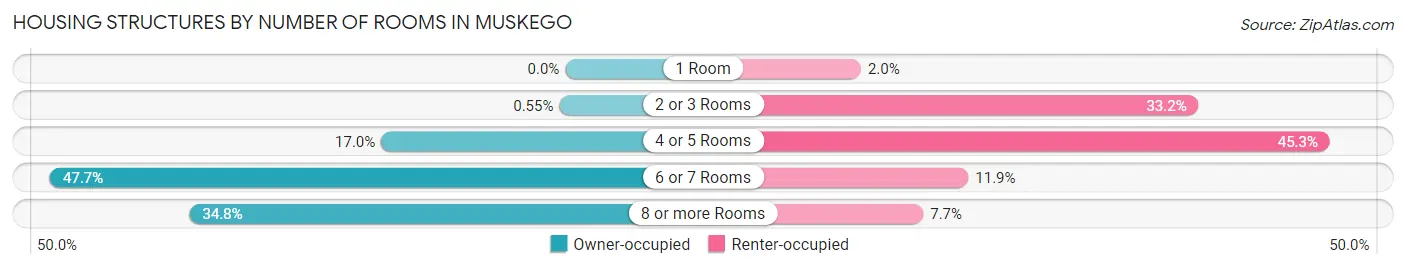
| Number of Rooms | Owner-occupied | Renter-occupied |
| 1 Room | 0 (0.0%) | 22 (1.9%) |
| 2 or 3 Rooms | 49 (0.5%) | 374 (33.2%) |
| 4 or 5 Rooms | 1,505 (17.0%) | 511 (45.3%) |
| 6 or 7 Rooms | 4,212 (47.7%) | 134 (11.9%) |
| 8 or more Rooms | 3,072 (34.8%) | 87 (7.7%) |
| Total | 8,838 (100.0%) | 1,128 (100.0%) |
Housing Structure by Heating Type in Muskego
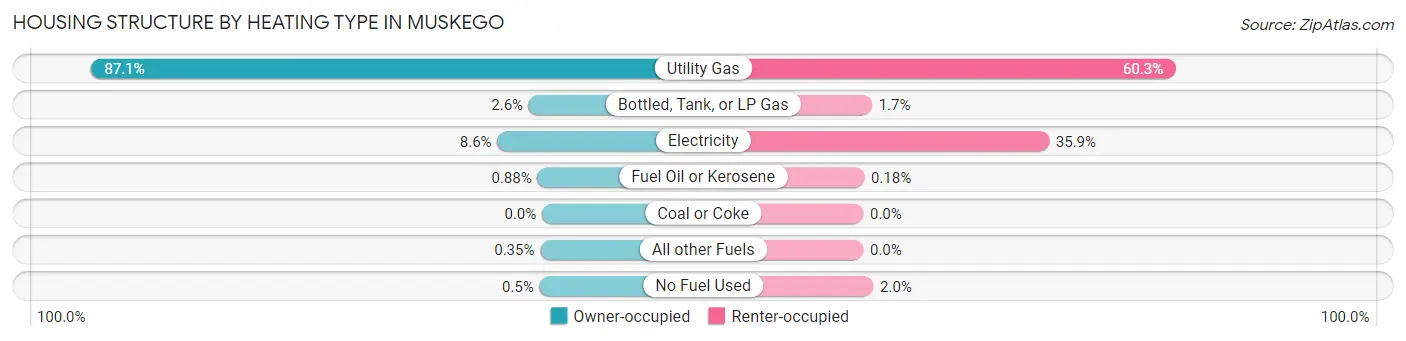
| Heating Type | Owner-occupied | Renter-occupied |
| Utility Gas | 7,697 (87.1%) | 680 (60.3%) |
| Bottled, Tank, or LP Gas | 225 (2.5%) | 19 (1.7%) |
| Electricity | 763 (8.6%) | 405 (35.9%) |
| Fuel Oil or Kerosene | 78 (0.9%) | 2 (0.2%) |
| Coal or Coke | 0 (0.0%) | 0 (0.0%) |
| All other Fuels | 31 (0.4%) | 0 (0.0%) |
| No Fuel Used | 44 (0.5%) | 22 (1.9%) |
| Total | 8,838 (100.0%) | 1,128 (100.0%) |
Household Vehicle Usage in Muskego
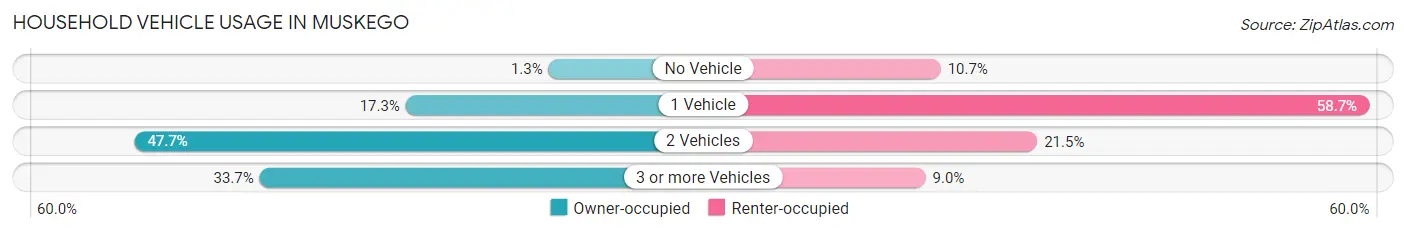
| Vehicles per Household | Owner-occupied | Renter-occupied |
| No Vehicle | 116 (1.3%) | 121 (10.7%) |
| 1 Vehicle | 1,530 (17.3%) | 662 (58.7%) |
| 2 Vehicles | 4,215 (47.7%) | 243 (21.5%) |
| 3 or more Vehicles | 2,977 (33.7%) | 102 (9.0%) |
| Total | 8,838 (100.0%) | 1,128 (100.0%) |
Real Estate & Mortgages in Muskego
Real Estate and Mortgage Overview in Muskego
| Characteristic | Without Mortgage | With Mortgage |
| Housing Units | 2,782 | 6,056 |
| Median Property Value | $350,700 | $381,900 |
| Median Household Income | $97,578 | $2,596 |
| Monthly Housing Costs | $814 | $715 |
| Real Estate Taxes | $4,531 | $21 |
Property Value by Mortgage Status in Muskego
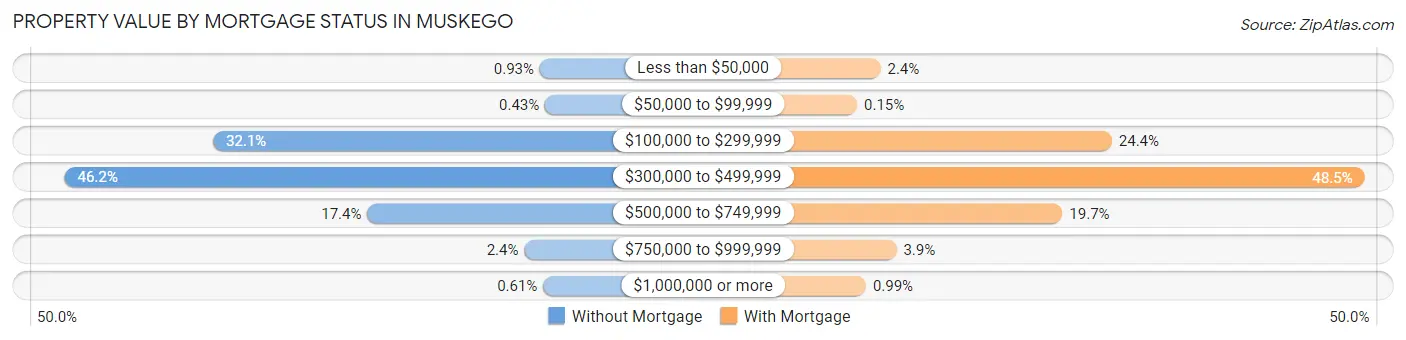
| Property Value | Without Mortgage | With Mortgage |
| Less than $50,000 | 26 (0.9%) | 144 (2.4%) |
| $50,000 to $99,999 | 12 (0.4%) | 9 (0.2%) |
| $100,000 to $299,999 | 892 (32.1%) | 1,478 (24.4%) |
| $300,000 to $499,999 | 1,285 (46.2%) | 2,936 (48.5%) |
| $500,000 to $749,999 | 483 (17.4%) | 1,193 (19.7%) |
| $750,000 to $999,999 | 67 (2.4%) | 236 (3.9%) |
| $1,000,000 or more | 17 (0.6%) | 60 (1.0%) |
| Total | 2,782 (100.0%) | 6,056 (100.0%) |
Household Income by Mortgage Status in Muskego
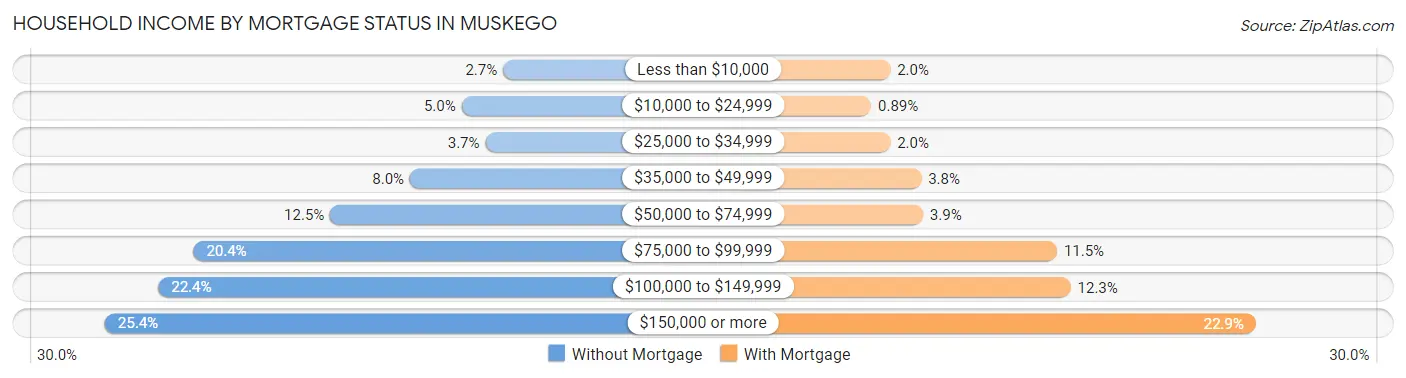
| Household Income | Without Mortgage | With Mortgage |
| Less than $10,000 | 74 (2.7%) | 120 (2.0%) |
| $10,000 to $24,999 | 140 (5.0%) | 54 (0.9%) |
| $25,000 to $34,999 | 102 (3.7%) | 120 (2.0%) |
| $35,000 to $49,999 | 222 (8.0%) | 227 (3.7%) |
| $50,000 to $74,999 | 349 (12.5%) | 233 (3.8%) |
| $75,000 to $99,999 | 566 (20.3%) | 697 (11.5%) |
| $100,000 to $149,999 | 622 (22.4%) | 744 (12.3%) |
| $150,000 or more | 707 (25.4%) | 1,385 (22.9%) |
| Total | 2,782 (100.0%) | 6,056 (100.0%) |
Property Value to Household Income Ratio in Muskego
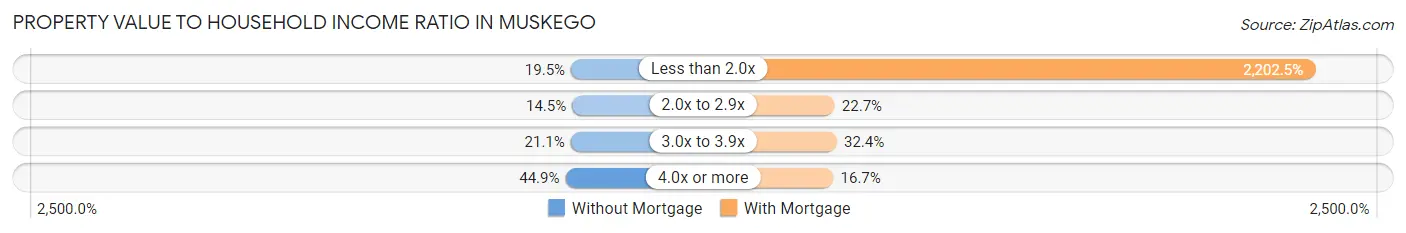
| Value-to-Income Ratio | Without Mortgage | With Mortgage |
| Less than 2.0x | 543 (19.5%) | 133,385 (2,202.5%) |
| 2.0x to 2.9x | 403 (14.5%) | 1,375 (22.7%) |
| 3.0x to 3.9x | 587 (21.1%) | 1,960 (32.4%) |
| 4.0x or more | 1,249 (44.9%) | 1,013 (16.7%) |
| Total | 2,782 (100.0%) | 6,056 (100.0%) |
Real Estate Taxes by Mortgage Status in Muskego
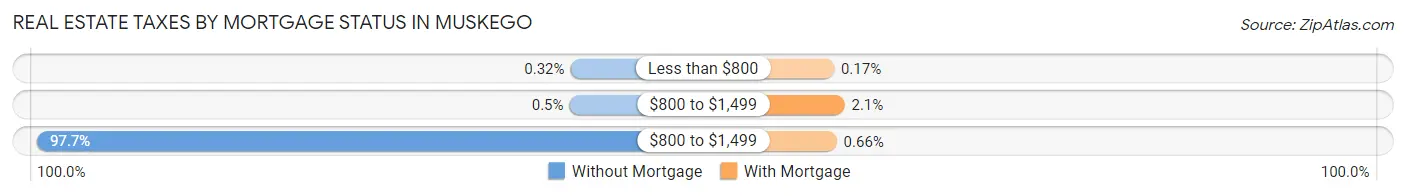
| Property Taxes | Without Mortgage | With Mortgage |
| Less than $800 | 9 (0.3%) | 10 (0.2%) |
| $800 to $1,499 | 14 (0.5%) | 127 (2.1%) |
| $800 to $1,499 | 2,719 (97.7%) | 40 (0.7%) |
| Total | 2,782 (100.0%) | 6,056 (100.0%) |
Health & Disability in Muskego
Health Insurance Coverage by Age in Muskego
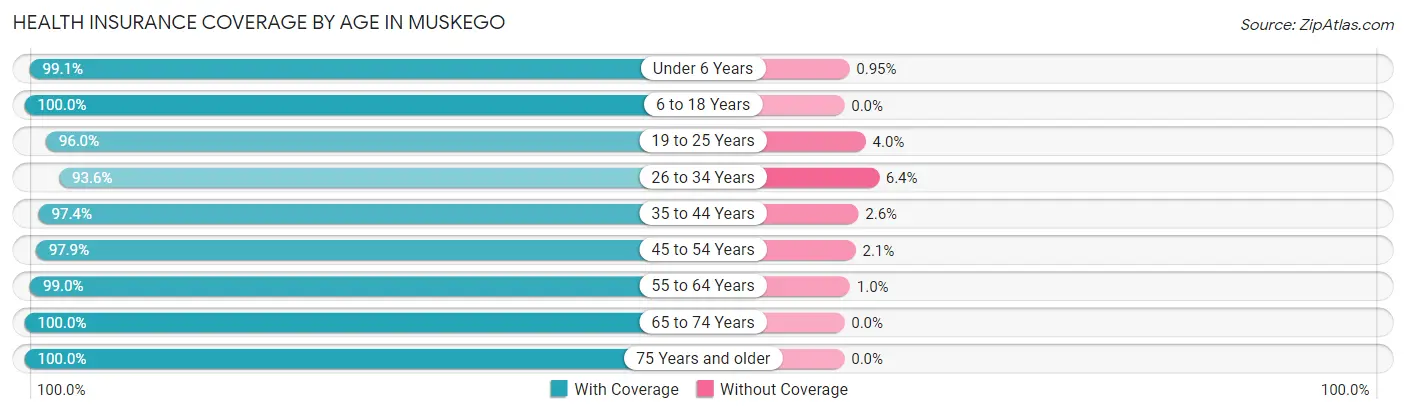
| Age Bracket | With Coverage | Without Coverage |
| Under 6 Years | 1,152 (99.1%) | 11 (0.9%) |
| 6 to 18 Years | 4,441 (100.0%) | 0 (0.0%) |
| 19 to 25 Years | 1,716 (96.0%) | 71 (4.0%) |
| 26 to 34 Years | 1,236 (93.6%) | 85 (6.4%) |
| 35 to 44 Years | 3,498 (97.4%) | 94 (2.6%) |
| 45 to 54 Years | 3,814 (97.9%) | 82 (2.1%) |
| 55 to 64 Years | 4,080 (99.0%) | 43 (1.0%) |
| 65 to 74 Years | 3,011 (100.0%) | 0 (0.0%) |
| 75 Years and older | 1,567 (100.0%) | 0 (0.0%) |
| Total | 24,515 (98.5%) | 386 (1.5%) |
Health Insurance Coverage by Citizenship Status in Muskego
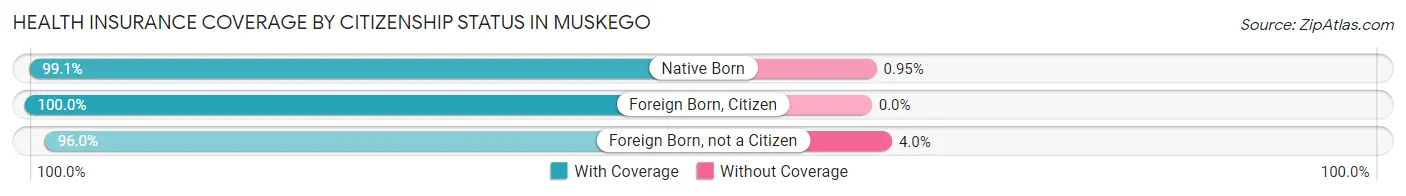
| Citizenship Status | With Coverage | Without Coverage |
| Native Born | 1,152 (99.1%) | 11 (0.9%) |
| Foreign Born, Citizen | 4,441 (100.0%) | 0 (0.0%) |
| Foreign Born, not a Citizen | 1,716 (96.0%) | 71 (4.0%) |
Health Insurance Coverage by Household Income in Muskego
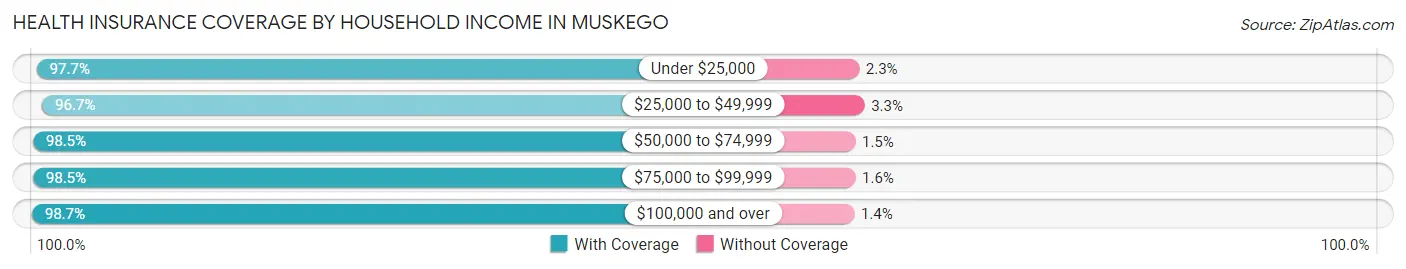
| Household Income | With Coverage | Without Coverage |
| Under $25,000 | 908 (97.7%) | 21 (2.3%) |
| $25,000 to $49,999 | 1,477 (96.7%) | 50 (3.3%) |
| $50,000 to $74,999 | 2,488 (98.5%) | 39 (1.5%) |
| $75,000 to $99,999 | 3,239 (98.5%) | 51 (1.5%) |
| $100,000 and over | 16,401 (98.7%) | 225 (1.3%) |
Public vs Private Health Insurance Coverage by Age in Muskego
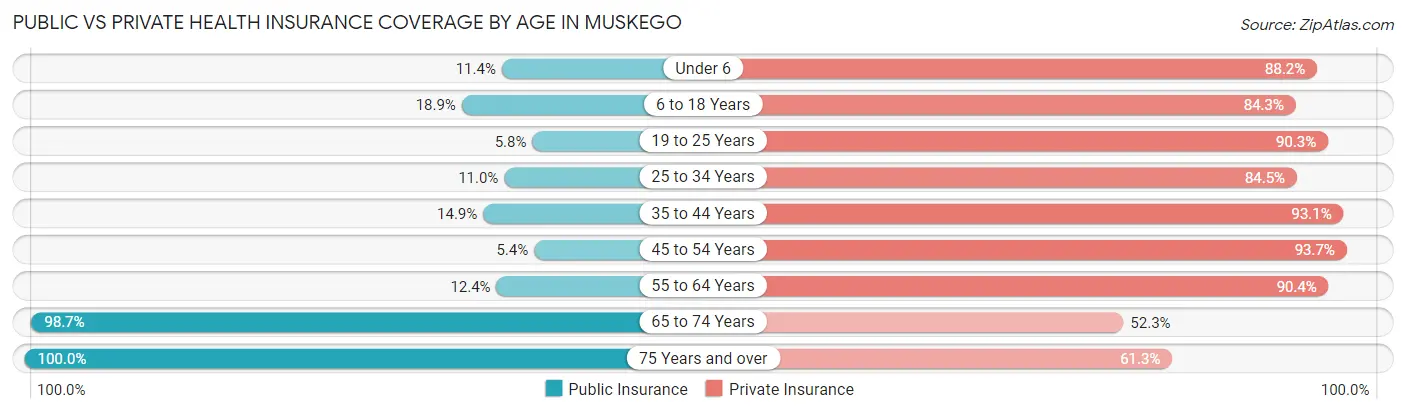
| Age Bracket | Public Insurance | Private Insurance |
| Under 6 | 133 (11.4%) | 1,026 (88.2%) |
| 6 to 18 Years | 838 (18.9%) | 3,742 (84.3%) |
| 19 to 25 Years | 103 (5.8%) | 1,613 (90.3%) |
| 25 to 34 Years | 145 (11.0%) | 1,116 (84.5%) |
| 35 to 44 Years | 535 (14.9%) | 3,345 (93.1%) |
| 45 to 54 Years | 212 (5.4%) | 3,651 (93.7%) |
| 55 to 64 Years | 512 (12.4%) | 3,726 (90.4%) |
| 65 to 74 Years | 2,973 (98.7%) | 1,574 (52.3%) |
| 75 Years and over | 1,567 (100.0%) | 961 (61.3%) |
| Total | 7,018 (28.2%) | 20,754 (83.4%) |
Disability Status by Sex by Age in Muskego
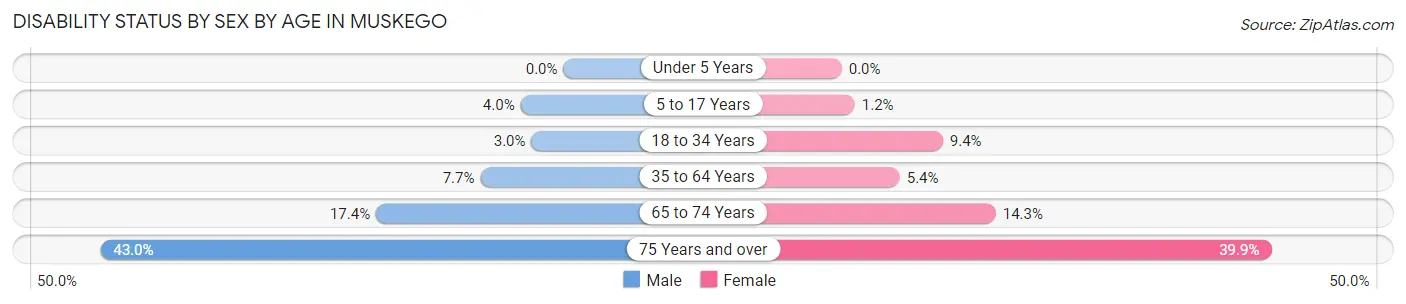
| Age Bracket | Male | Female |
| Under 5 Years | 0 (0.0%) | 0 (0.0%) |
| 5 to 17 Years | 98 (4.0%) | 23 (1.2%) |
| 18 to 34 Years | 48 (3.0%) | 169 (9.4%) |
| 35 to 64 Years | 454 (7.7%) | 308 (5.4%) |
| 65 to 74 Years | 296 (17.4%) | 187 (14.3%) |
| 75 Years and over | 269 (43.0%) | 375 (39.9%) |
Disability Class by Sex by Age in Muskego
Disability Class: Hearing Difficulty
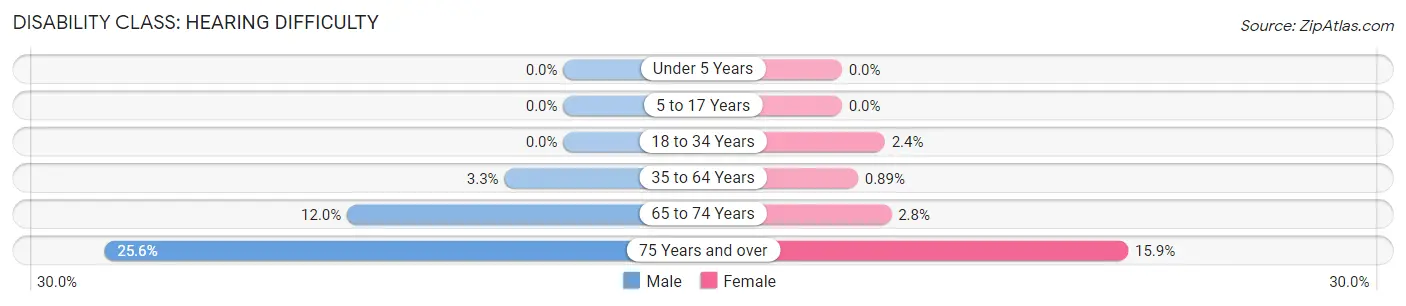
| Age Bracket | Male | Female |
| Under 5 Years | 0 (0.0%) | 0 (0.0%) |
| 5 to 17 Years | 0 (0.0%) | 0 (0.0%) |
| 18 to 34 Years | 0 (0.0%) | 43 (2.4%) |
| 35 to 64 Years | 193 (3.3%) | 51 (0.9%) |
| 65 to 74 Years | 205 (12.0%) | 36 (2.8%) |
| 75 Years and over | 160 (25.6%) | 150 (15.9%) |
Disability Class: Vision Difficulty
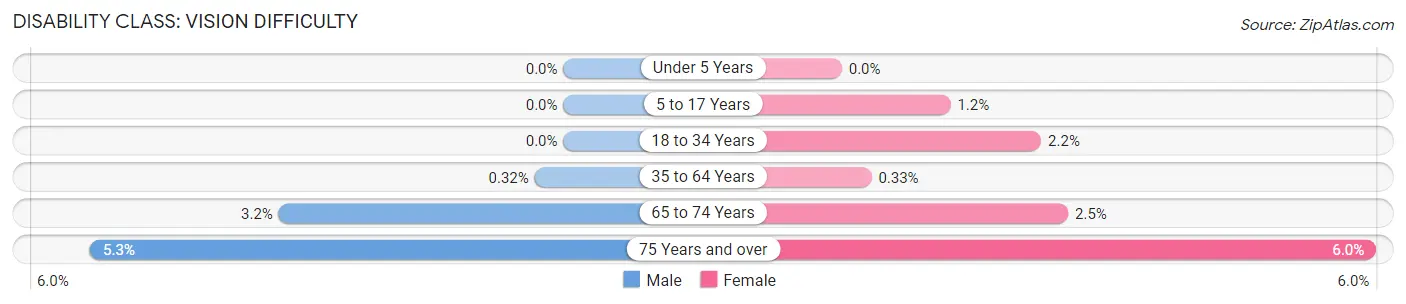
| Age Bracket | Male | Female |
| Under 5 Years | 0 (0.0%) | 0 (0.0%) |
| 5 to 17 Years | 0 (0.0%) | 23 (1.2%) |
| 18 to 34 Years | 0 (0.0%) | 40 (2.2%) |
| 35 to 64 Years | 19 (0.3%) | 19 (0.3%) |
| 65 to 74 Years | 54 (3.2%) | 33 (2.5%) |
| 75 Years and over | 33 (5.3%) | 56 (5.9%) |
Disability Class: Cognitive Difficulty
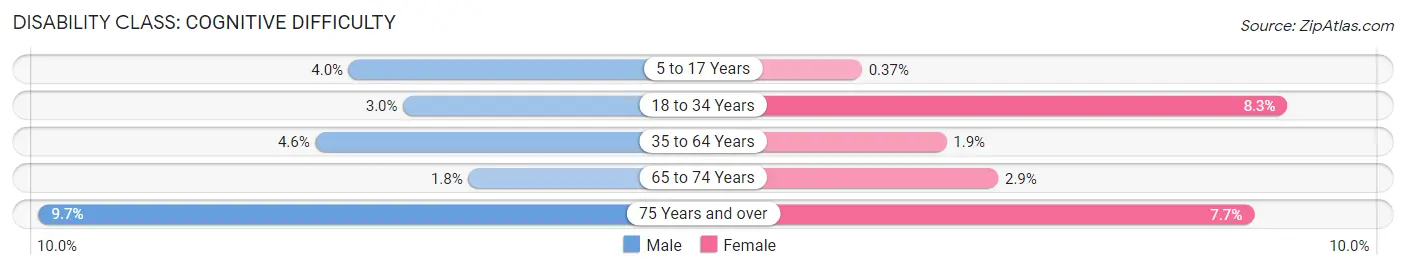
| Age Bracket | Male | Female |
| 5 to 17 Years | 98 (4.0%) | 7 (0.4%) |
| 18 to 34 Years | 48 (3.0%) | 149 (8.3%) |
| 35 to 64 Years | 271 (4.6%) | 111 (1.9%) |
| 65 to 74 Years | 30 (1.8%) | 38 (2.9%) |
| 75 Years and over | 61 (9.7%) | 72 (7.6%) |
Disability Class: Ambulatory Difficulty
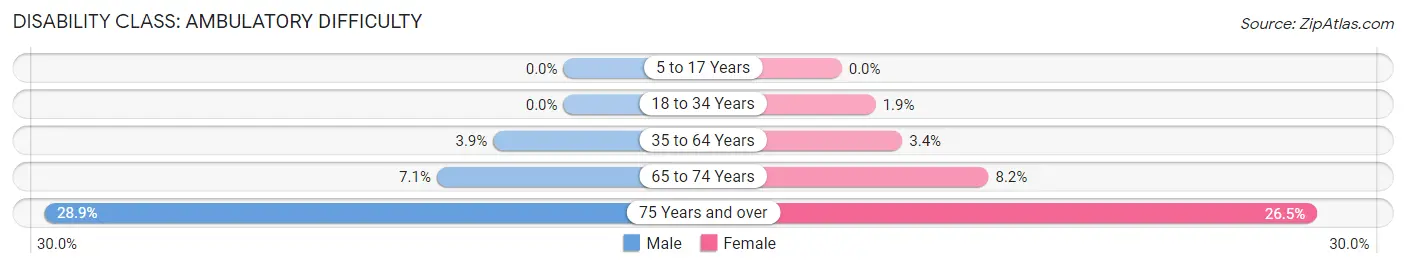
| Age Bracket | Male | Female |
| 5 to 17 Years | 0 (0.0%) | 0 (0.0%) |
| 18 to 34 Years | 0 (0.0%) | 34 (1.9%) |
| 35 to 64 Years | 230 (3.9%) | 193 (3.4%) |
| 65 to 74 Years | 120 (7.0%) | 107 (8.2%) |
| 75 Years and over | 181 (28.9%) | 249 (26.5%) |
Disability Class: Self-Care Difficulty
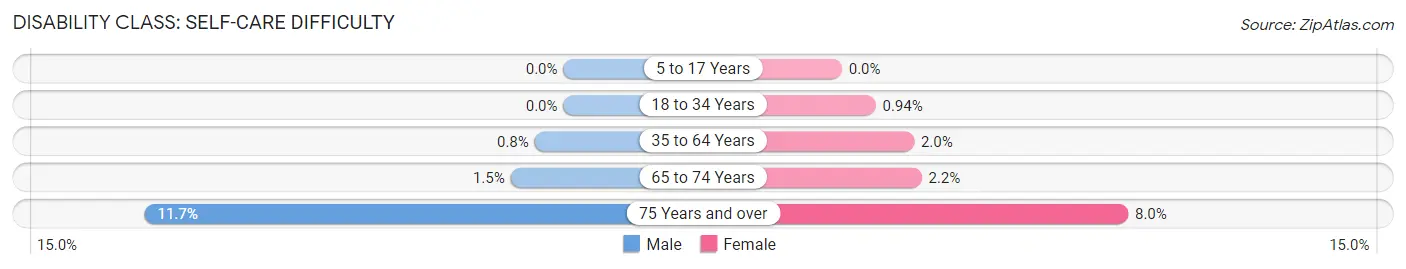
| Age Bracket | Male | Female |
| 5 to 17 Years | 0 (0.0%) | 0 (0.0%) |
| 18 to 34 Years | 0 (0.0%) | 17 (0.9%) |
| 35 to 64 Years | 47 (0.8%) | 115 (2.0%) |
| 65 to 74 Years | 25 (1.5%) | 29 (2.2%) |
| 75 Years and over | 73 (11.7%) | 75 (8.0%) |
Technology Access in Muskego
Computing Device Access in Muskego
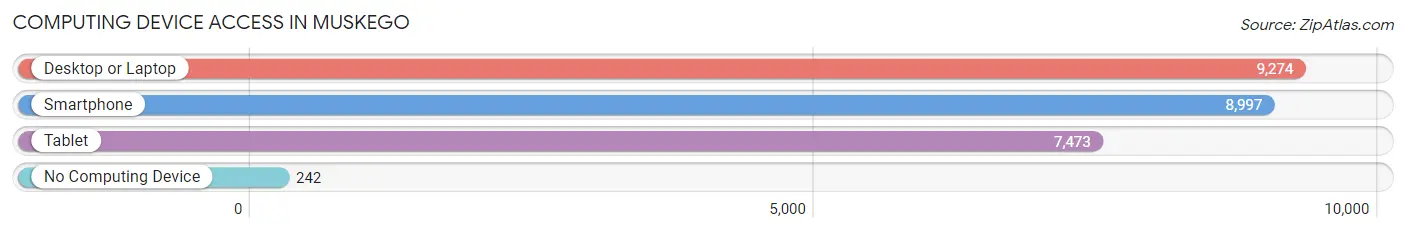
| Device Type | # Households | % Households |
| Desktop or Laptop | 9,274 | 93.1% |
| Smartphone | 8,997 | 90.3% |
| Tablet | 7,473 | 75.0% |
| No Computing Device | 242 | 2.4% |
| Total | 9,966 | 100.0% |
Internet Access in Muskego
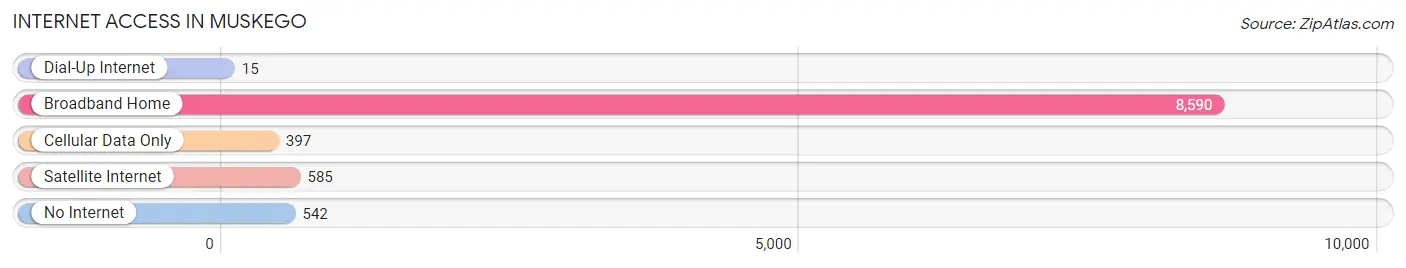
| Internet Type | # Households | % Households |
| Dial-Up Internet | 15 | 0.2% |
| Broadband Home | 8,590 | 86.2% |
| Cellular Data Only | 397 | 4.0% |
| Satellite Internet | 585 | 5.9% |
| No Internet | 542 | 5.4% |
| Total | 9,966 | 100.0% |
Muskego Summary
Muskego, Wisconsin is a city located in Waukesha County, Wisconsin, United States. The population was 24,135 at the 2010 census. Muskego is the second largest city in Waukesha County, behind the city of Waukesha.
History
The area that is now Muskego was first settled in the early 1800s by German and Irish immigrants. The first settlers were mostly farmers, and the area was known as Muskego Prairie. The name Muskego is derived from the Potawatomi word for “sunfish”.
In 1839, the first post office was established in Muskego. The first school was built in 1845, and the first church was built in 1848.
In 1846, Muskego was officially incorporated as a village. The village was named after the Muskego Prairie, which was named after the Potawatomi word for “sunfish”.
In 1856, Muskego was officially incorporated as a city. The city was named after the Muskego Prairie, which was named after the Potawatomi word for “sunfish”.
In 1871, the first railroad line was built in Muskego. This allowed for the transportation of goods and people to and from the city.
In 1873, the first telephone line was built in Muskego. This allowed for the communication between people in the city.
In 1875, the first fire station was built in Muskego. This allowed for the protection of the city from fires.
In 1876, the first waterworks was built in Muskego. This allowed for the supply of clean water to the city.
In 1877, the first electric light plant was built in Muskego. This allowed for the lighting of the city.
In 1878, the first public library was built in Muskego. This allowed for the education of the citizens of Muskego.
In 1879, the first hospital was built in Muskego. This allowed for the medical care of the citizens of Muskego.
In 1881, the first bank was built in Muskego. This allowed for the financial security of the citizens of Muskego.
In 1882, the first newspaper was published in Muskego. This allowed for the communication of news to the citizens of Muskego.
In 1883, the first public park was built in Muskego. This allowed for the recreation of the citizens of Muskego.
In 1884, the first fire department was established in Muskego. This allowed for the protection of the city from fires.
In 1885, the first police department was established in Muskego. This allowed for the protection of the citizens of Muskego.
In 1886, the first sewer system was built in Muskego. This allowed for the disposal of waste in the city.
In 1887, the first street car line was built in Muskego. This allowed for the transportation of people to and from the city.
In 1888, the first public school was built in Muskego. This allowed for the education of the citizens of Muskego.
In 1889, the first telephone exchange was built in Muskego. This allowed for the communication between people in the city.
In 1890, the first electric power plant was built in Muskego. This allowed for the lighting of the city.
In 1891, the first public library was built in Muskego. This allowed for the education of the citizens of Muskego.
In 1892, the first public park was built in Muskego. This allowed for the recreation of the citizens of Muskego.
In 1893, the first public swimming pool was built in Muskego. This allowed for the recreation of the citizens of Muskego.
In 1895, the first public golf course was built in Muskego. This allowed for the recreation of the citizens of Muskego.
In 1896, the first public library was built in Muskego. This allowed for the education of the citizens of Muskego.
In 1897, the first public park was built in Muskego. This allowed for the recreation of the citizens of Muskego.
In 1898, the first public swimming pool was built in Muskego. This allowed for the recreation of the citizens of Muskego.
In 1899, the first public golf course was built in Muskego. This allowed for the recreation of the citizens of Muskego.
Geography
Muskego is located at 43°02′N 88°09′W (43.037, -88.150). According to the United States Census Bureau, the city has a total area of 24.2 square miles (62.6 km2), of which, 23.9 square miles (61.8 km2) is land and 0.3 square miles (0.8 km2) is water.
Economy
The economy of Muskego is largely based on manufacturing and retail. The city is home to several large manufacturing companies, including Briggs & Stratton, which produces small engines, and Johnson Controls, which produces automotive parts. The city is also home to several large retail stores, including Walmart, Target, and Kohl’s.
Demographics
As of the census of 2010, there were 24,135 people, 8,945 households, and 6,541 families residing in the city. The population density was 1,006.3 people per square mile (388.7/km2). There were 9,345 housing units at an average density of 393.3 per square mile (151.7/km2). The racial makeup of the city was 94.2% White, 1.2% African American, 0.3% Native American, 1.9% Asian, 0.7% from other races, and 1.7% from two or more races. Hispanic or Latino of any race were 3.2% of the population.
There were 8,945 households, out of which 34.2% had children under the age of 18 living with them, 58.2% were married couples living together, 9.2% had a female householder with no husband present, and 28.7% were non-families. 22.7% of all households were made up of individuals, and 8.2% had someone living alone who was 65 years of age or older. The average household size was 2.67 and the average family size was 3.17.
In the city, the population was spread out, with 25.9% under the age of 18, 7.2% from 18 to 24, 29.2% from 25 to 44, 25.2% from 45 to 64, and 12.5% who were 65 years of age or older. The median age was 38 years. For every 100 females, there were 97.2 males. For every 100 females age 18 and over, there were 94.2 males.
The median income for a household in the city was $62,917, and the median income for a family was $72,917. Males had a median income of $50,000 versus $35,000 for females. The per capita income for the city was $27,917. About 3.2% of families and 4.7% of the population were below the poverty line, including 5.3% of those under age 18 and 4.2% of those age 65 or over.
Common Questions
What is Per Capita Income in Muskego?
Per Capita income in Muskego is $53,731.
What is the Median Family Income in Muskego?
Median Family Income in Muskego is $129,842.
What is the Median Household income in Muskego?
Median Household Income in Muskego is $112,537.
What is Income or Wage Gap in Muskego?
Income or Wage Gap in Muskego is 25.9%.
Women in Muskego earn 74.1 cents for every dollar earned by a man.
What is Family Income Deficit in Muskego?
Family Income Deficit in Muskego is $7,906.
Families that are below poverty line in Muskego earn $7,906 less on average than the poverty threshold level.
What is Inequality or Gini Index in Muskego?
Inequality or Gini Index in Muskego is 0.38.
What is the Total Population of Muskego?
Total Population of Muskego is 25,073.
What is the Total Male Population of Muskego?
Total Male Population of Muskego is 12,848.
What is the Total Female Population of Muskego?
Total Female Population of Muskego is 12,225.
What is the Ratio of Males per 100 Females in Muskego?
There are 105.10 Males per 100 Females in Muskego.
What is the Ratio of Females per 100 Males in Muskego?
There are 95.15 Females per 100 Males in Muskego.
What is the Median Population Age in Muskego?
Median Population Age in Muskego is 46.1 Years.
What is the Average Family Size in Muskego
Average Family Size in Muskego is 2.9 People.
What is the Average Household Size in Muskego
Average Household Size in Muskego is 2.5 People.
How Large is the Labor Force in Muskego?
There are 14,028 People in the Labor Forcein in Muskego.
What is the Percentage of People in the Labor Force in Muskego?
67.8% of People are in the Labor Force in Muskego.
What is the Unemployment Rate in Muskego?
Unemployment Rate in Muskego is 3.5%.