Woodford, WI Map & Demographics
Woodford Map
Woodford Overview
$38,294
PER CAPITA INCOME
$135,568
AVG FAMILY INCOME
0.43
INEQUALITY / GINI INDEX
99
TOTAL POPULATION
65
MALE POPULATION
34
FEMALE POPULATION
191.18
MALES / 100 FEMALES
52.31
FEMALES / 100 MALES
41.8
MEDIAN AGE
2.9
AVG FAMILY SIZE
1.8
AVG HOUSEHOLD SIZE
58
LABOR FORCE [ PEOPLE ]
61.1%
PERCENT IN LABOR FORCE
Woodford Zip Codes
Woodford Area Codes
Income in Woodford
Income Overview in Woodford
| Characteristic | Number | Measure |
| Per Capita Income | 99 | $38,294 |
| Median Family Income | 17 | $135,568 |
| Mean Family Income | 17 | $111,659 |
| Median Household Income | 56 | $0 |
| Mean Household Income | 56 | $69,221 |
| Income Deficit | 17 | $0 |
| Wage / Income Gap (%) | 99 | 0.00% |
| Wage / Income Gap ($) | 99 | 100.00¢ per $1 |
| Gini / Inequality Index | 99 | 0.43 |
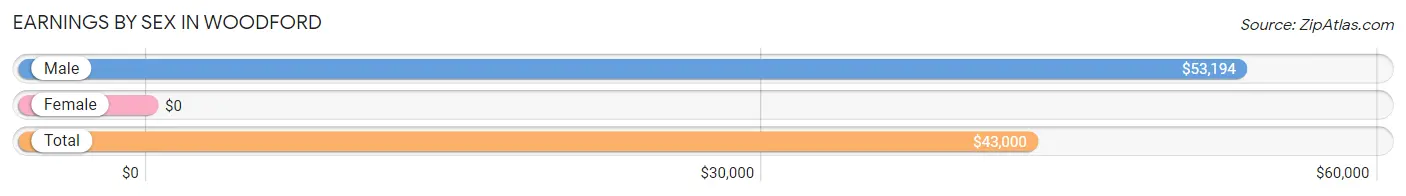
Earnings by Sex in Woodford
| Sex | Number | Average Earnings |
| Male | 35 (60.3%) | $53,194 |
| Female | 23 (39.7%) | $0 |
| Total | 58 (100.0%) | $43,000 |
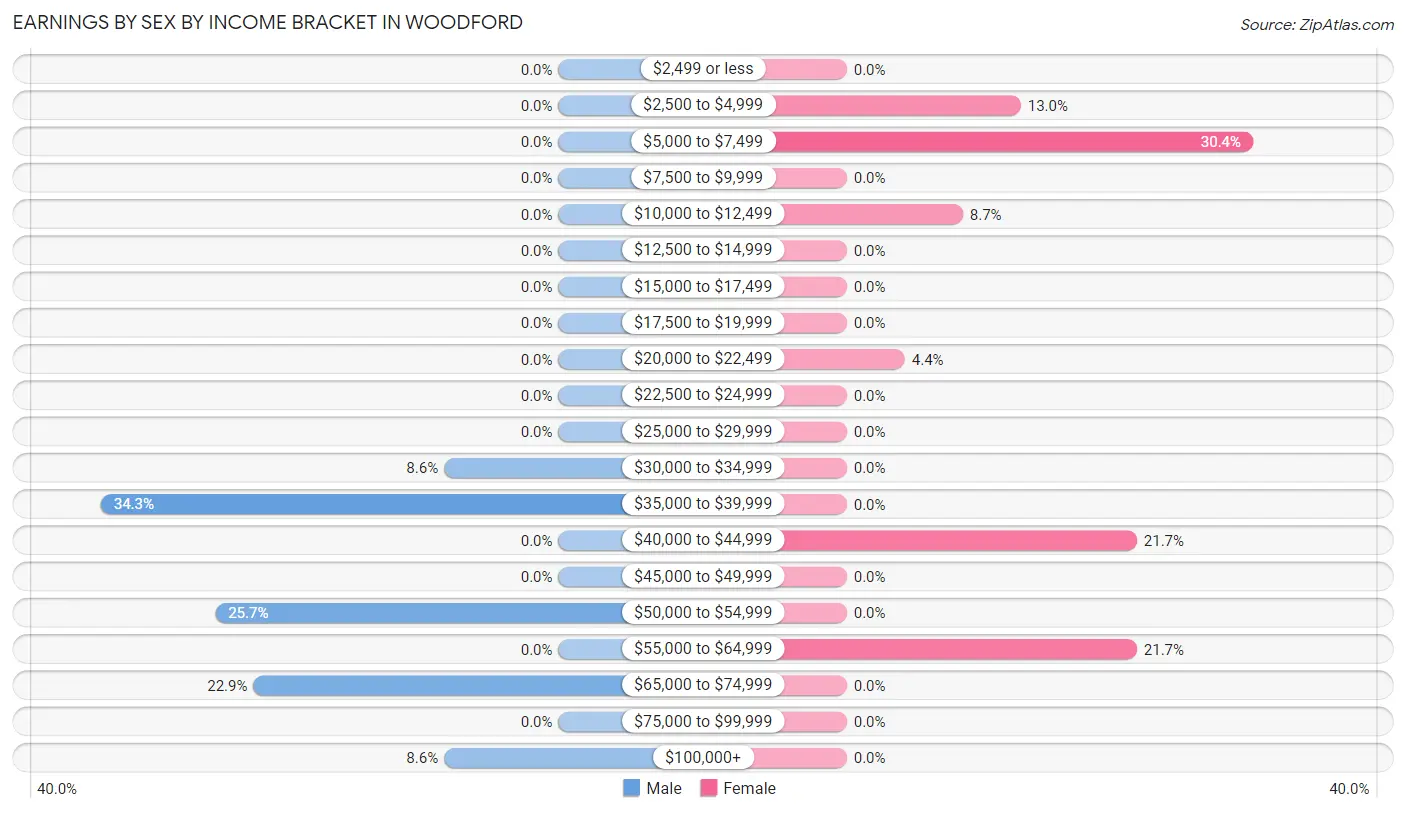
Earnings by Sex by Income Bracket in Woodford
The most common earnings brackets in Woodford are $35,000 to $39,999 for men (12 | 34.3%) and $5,000 to $7,499 for women (7 | 30.4%).
| Income | Male | Female |
| $2,499 or less | 0 (0.0%) | 0 (0.0%) |
| $2,500 to $4,999 | 0 (0.0%) | 3 (13.0%) |
| $5,000 to $7,499 | 0 (0.0%) | 7 (30.4%) |
| $7,500 to $9,999 | 0 (0.0%) | 0 (0.0%) |
| $10,000 to $12,499 | 0 (0.0%) | 2 (8.7%) |
| $12,500 to $14,999 | 0 (0.0%) | 0 (0.0%) |
| $15,000 to $17,499 | 0 (0.0%) | 0 (0.0%) |
| $17,500 to $19,999 | 0 (0.0%) | 0 (0.0%) |
| $20,000 to $22,499 | 0 (0.0%) | 1 (4.3%) |
| $22,500 to $24,999 | 0 (0.0%) | 0 (0.0%) |
| $25,000 to $29,999 | 0 (0.0%) | 0 (0.0%) |
| $30,000 to $34,999 | 3 (8.6%) | 0 (0.0%) |
| $35,000 to $39,999 | 12 (34.3%) | 0 (0.0%) |
| $40,000 to $44,999 | 0 (0.0%) | 5 (21.7%) |
| $45,000 to $49,999 | 0 (0.0%) | 0 (0.0%) |
| $50,000 to $54,999 | 9 (25.7%) | 0 (0.0%) |
| $55,000 to $64,999 | 0 (0.0%) | 5 (21.7%) |
| $65,000 to $74,999 | 8 (22.9%) | 0 (0.0%) |
| $75,000 to $99,999 | 0 (0.0%) | 0 (0.0%) |
| $100,000+ | 3 (8.6%) | 0 (0.0%) |
| Total | 35 (100.0%) | 23 (100.0%) |
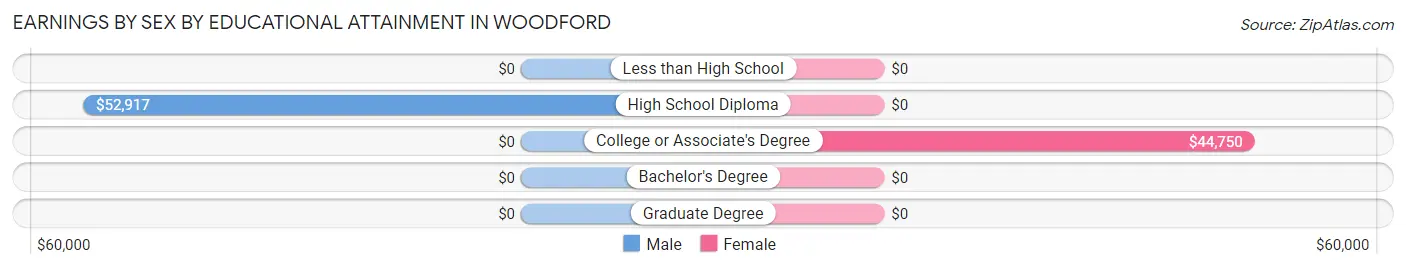
Earnings by Sex by Educational Attainment in Woodford
Average earnings in Woodford are $54,028 for men and $43,500 for women, a difference of 19.5%. Men with an educational attainment of high school diploma enjoy the highest average annual earnings of $52,917, while those with high school diploma education earn the least with $52,917. Women with an educational attainment of college or associate's degree earn the most with the average annual earnings of $44,750, while those with college or associate's degree education have the smallest earnings of $44,750.
| Educational Attainment | Male Income | Female Income |
| Less than High School | - | - |
| High School Diploma | $52,917 | $0 |
| College or Associate's Degree | - | - |
| Bachelor's Degree | - | - |
| Graduate Degree | - | - |
| Total | $54,028 | $43,500 |
Family Income in Woodford
Family Income Brackets in Woodford
According to the Woodford family income data, there are 11 families falling into the $100,000 to $149,999 income range, which is the most common income bracket and makes up 64.7% of all families.
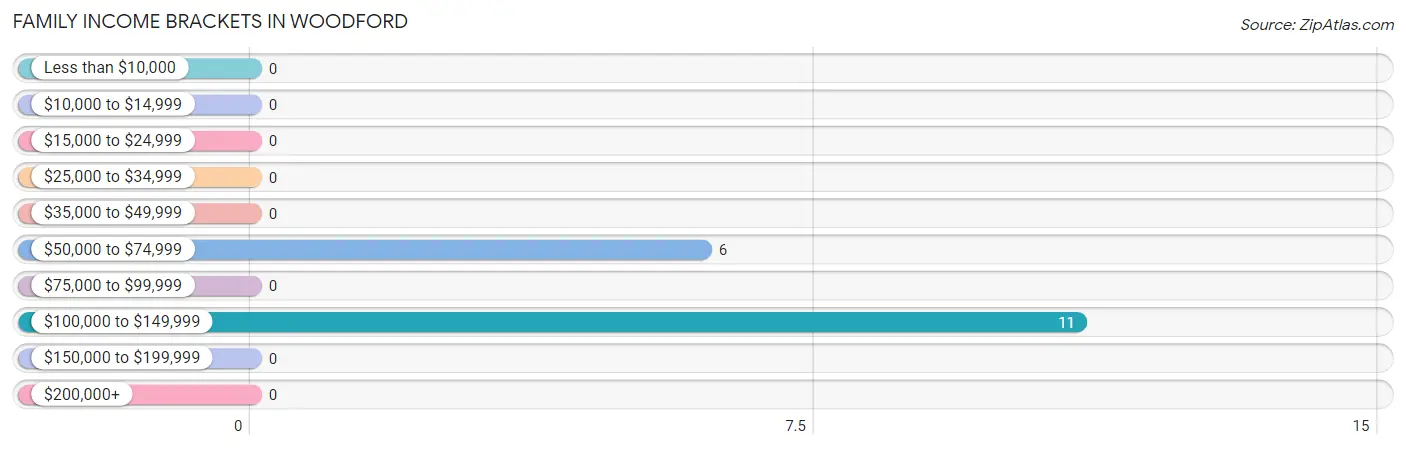
| Income Bracket | # Families | % Families |
| Less than $10,000 | 0 | 0.0% |
| $10,000 to $14,999 | 0 | 0.0% |
| $15,000 to $24,999 | 0 | 0.0% |
| $25,000 to $34,999 | 0 | 0.0% |
| $35,000 to $49,999 | 0 | 0.0% |
| $50,000 to $74,999 | 6 | 35.3% |
| $75,000 to $99,999 | 0 | 0.0% |
| $100,000 to $149,999 | 11 | 64.7% |
| $150,000 to $199,999 | 0 | 0.0% |
| $200,000+ | 0 | 0.0% |
Family Income by Famaliy Size in Woodford
2-person families (8 | 47.1%) account for the highest median family income in Woodford with $135,500 per family, while 2-person families (8 | 47.1%) have the highest median income of $67,750 per family member.
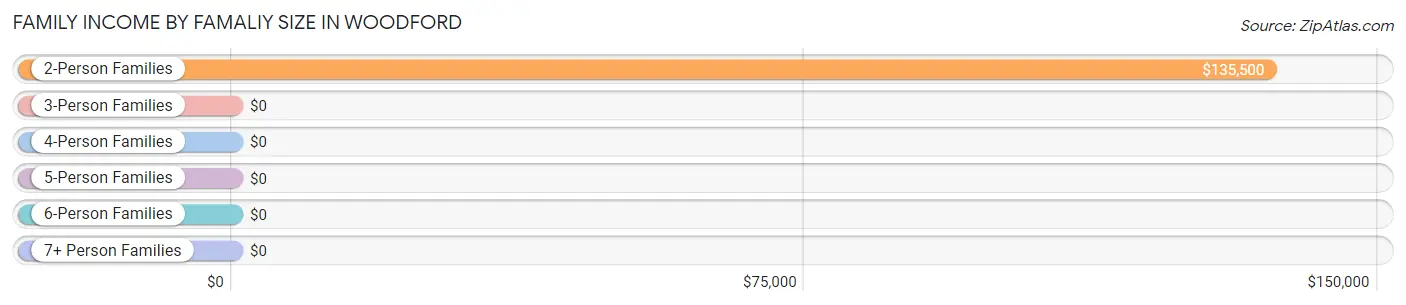
| Income Bracket | # Families | Median Income |
| 2-Person Families | 8 (47.1%) | $135,500 |
| 3-Person Families | 0 (0.0%) | $0 |
| 4-Person Families | 9 (52.9%) | $0 |
| 5-Person Families | 0 (0.0%) | $0 |
| 6-Person Families | 0 (0.0%) | $0 |
| 7+ Person Families | 0 (0.0%) | $0 |
| Total | 17 (100.0%) | $135,568 |
Family Income by Number of Earners in Woodford
| Number of Earners | # Families | Median Income |
| No Earners | 0 (0.0%) | $0 |
| 1 Earner | 3 (17.6%) | $0 |
| 2 Earners | 8 (47.1%) | $0 |
| 3+ Earners | 6 (35.3%) | $0 |
| Total | 17 (100.0%) | $135,568 |
Household Income in Woodford
Household Income Brackets in Woodford
With 24 households falling in the category, the $25,000 to $34,999 income range is the most frequent in Woodford, accounting for 42.9% of all households.
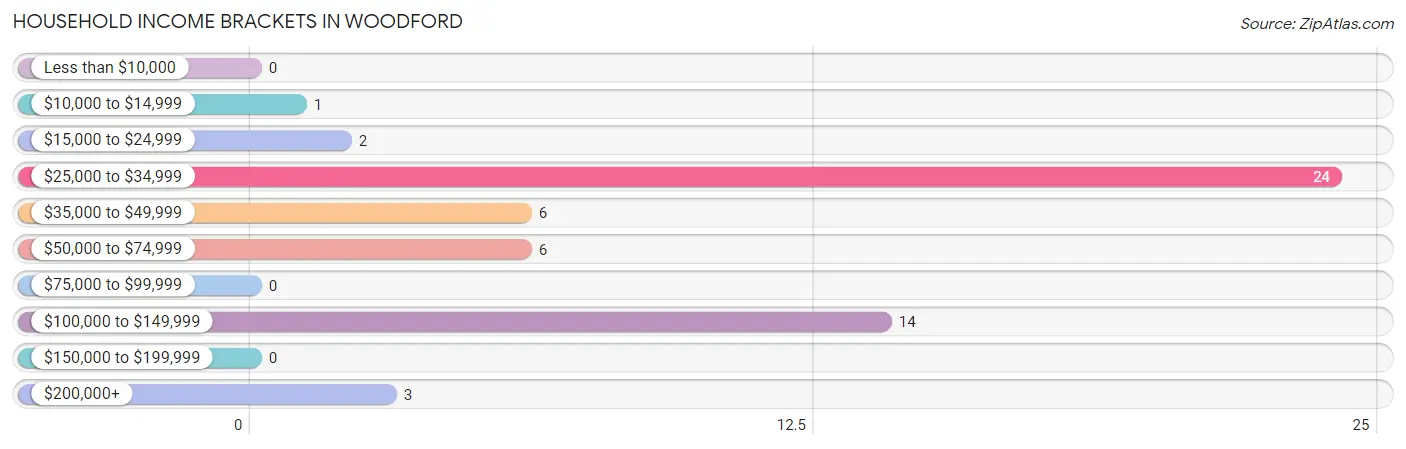
| Income Bracket | # Households | % Households |
| Less than $10,000 | 0 | 0.0% |
| $10,000 to $14,999 | 1 | 1.8% |
| $15,000 to $24,999 | 2 | 3.6% |
| $25,000 to $34,999 | 24 | 42.9% |
| $35,000 to $49,999 | 6 | 10.7% |
| $50,000 to $74,999 | 6 | 10.7% |
| $75,000 to $99,999 | 0 | 0.0% |
| $100,000 to $149,999 | 14 | 25.0% |
| $150,000 to $199,999 | 0 | 0.0% |
| $200,000+ | 3 | 5.4% |
Household Income by Householder Age in Woodford
The median household income in Woodford is $0, with the highest median household income of $135,625 found in the 45 to 64 years age bracket for the primary householder. A total of 15 households (26.8%) fall into this category. Meanwhile, the 15 to 24 years age bracket for the primary householder has the lowest median household income of $0, with 3 households (5.4%) in this group.
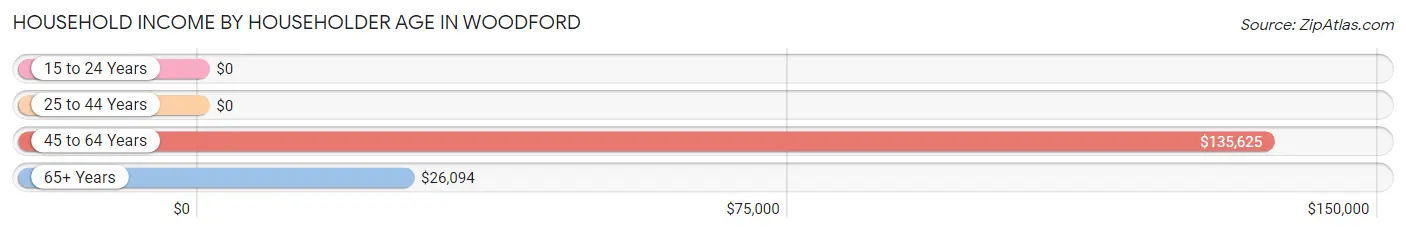
| Income Bracket | # Households | Median Income |
| 15 to 24 Years | 3 (5.4%) | $0 |
| 25 to 44 Years | 11 (19.6%) | $0 |
| 45 to 64 Years | 15 (26.8%) | $135,625 |
| 65+ Years | 27 (48.2%) | $26,094 |
| Total | 56 (100.0%) | $0 |
Poverty in Woodford
Income Below Poverty by Sex and Age in Woodford
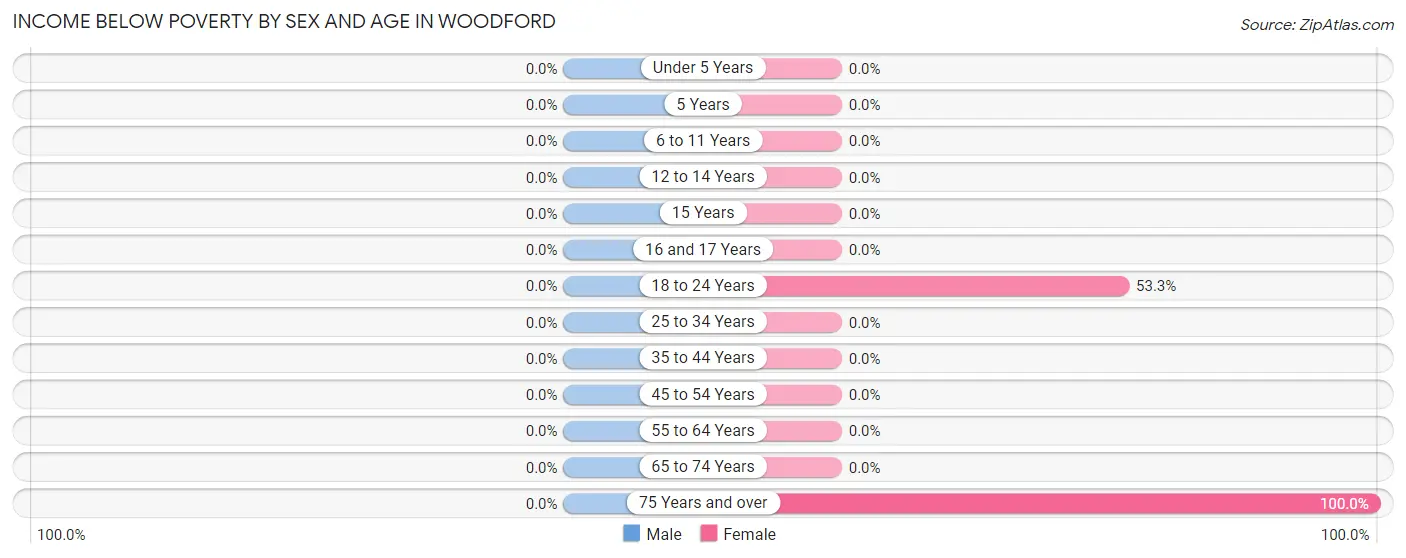
| Age Bracket | Male | Female |
| Under 5 Years | 0 (0.0%) | 0 (0.0%) |
| 5 Years | 0 (0.0%) | 0 (0.0%) |
| 6 to 11 Years | 0 (0.0%) | 0 (0.0%) |
| 12 to 14 Years | 0 (0.0%) | 0 (0.0%) |
| 15 Years | 0 (0.0%) | 0 (0.0%) |
| 16 and 17 Years | 0 (0.0%) | 0 (0.0%) |
| 18 to 24 Years | 0 (0.0%) | 8 (53.3%) |
| 25 to 34 Years | 0 (0.0%) | 0 (0.0%) |
| 35 to 44 Years | 0 (0.0%) | 0 (0.0%) |
| 45 to 54 Years | 0 (0.0%) | 0 (0.0%) |
| 55 to 64 Years | 0 (0.0%) | 0 (0.0%) |
| 65 to 74 Years | 0 (0.0%) | 0 (0.0%) |
| 75 Years and over | 0 (0.0%) | 1 (100.0%) |
| Total | 0 (0.0%) | 9 (26.5%) |
Income Above Poverty by Sex and Age in Woodford
According to the poverty statistics in Woodford, males aged 6 to 11 years and females aged 12 to 14 years are the age groups that are most secure financially, with 100.0% of males and 100.0% of females in these age groups living above the poverty line.
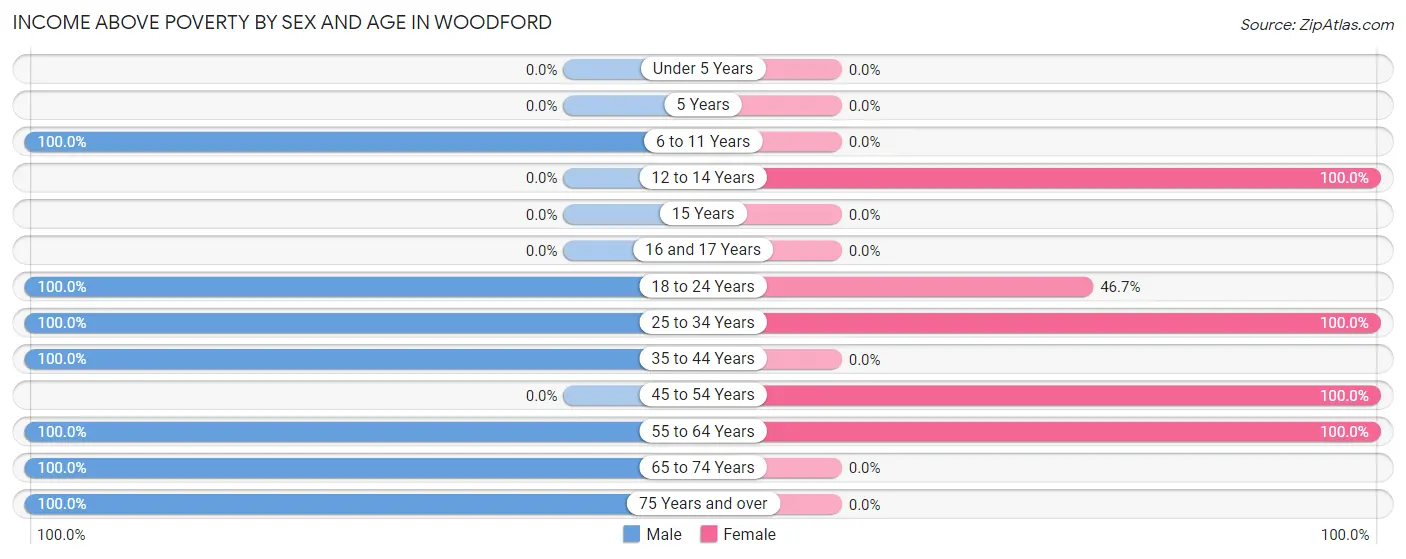
| Age Bracket | Male | Female |
| Under 5 Years | 0 (0.0%) | 0 (0.0%) |
| 5 Years | 0 (0.0%) | 0 (0.0%) |
| 6 to 11 Years | 2 (100.0%) | 0 (0.0%) |
| 12 to 14 Years | 0 (0.0%) | 2 (100.0%) |
| 15 Years | 0 (0.0%) | 0 (0.0%) |
| 16 and 17 Years | 0 (0.0%) | 0 (0.0%) |
| 18 to 24 Years | 12 (100.0%) | 7 (46.7%) |
| 25 to 34 Years | 11 (100.0%) | 5 (100.0%) |
| 35 to 44 Years | 3 (100.0%) | 0 (0.0%) |
| 45 to 54 Years | 0 (0.0%) | 8 (100.0%) |
| 55 to 64 Years | 10 (100.0%) | 3 (100.0%) |
| 65 to 74 Years | 25 (100.0%) | 0 (0.0%) |
| 75 Years and over | 2 (100.0%) | 0 (0.0%) |
| Total | 65 (100.0%) | 25 (73.5%) |
Income Below Poverty Among Married-Couple Families in Woodford
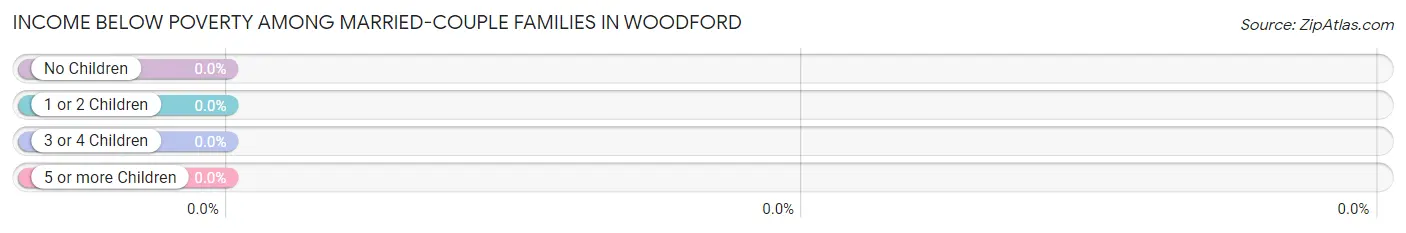
| Children | Above Poverty | Below Poverty |
| No Children | 14 (100.0%) | 0 (0.0%) |
| 1 or 2 Children | 3 (100.0%) | 0 (0.0%) |
| 3 or 4 Children | 0 (0.0%) | 0 (0.0%) |
| 5 or more Children | 0 (0.0%) | 0 (0.0%) |
| Total | 17 (100.0%) | 0 (0.0%) |
Income Below Poverty Among Single-Parent Households in Woodford
| Children | Single Father | Single Mother |
| No Children | 0 (0.0%) | 0 (0.0%) |
| 1 or 2 Children | 0 (0.0%) | 0 (0.0%) |
| 3 or 4 Children | 0 (0.0%) | 0 (0.0%) |
| 5 or more Children | 0 (0.0%) | 0 (0.0%) |
| Total | 0 (0.0%) | 0 (0.0%) |
Income Below Poverty Among Married-Couple vs Single-Parent Households in Woodford
| Children | Married-Couple Families | Single-Parent Households |
| No Children | 0 (0.0%) | 0 (0.0%) |
| 1 or 2 Children | 0 (0.0%) | 0 (0.0%) |
| 3 or 4 Children | 0 (0.0%) | 0 (0.0%) |
| 5 or more Children | 0 (0.0%) | 0 (0.0%) |
| Total | 0 (0.0%) | 0 (0.0%) |
Race in Woodford
The most populous races in Woodford are White / Caucasian (85 | 85.9%), Hispanic or Latino (20 | 20.2%), and Some other Race (14 | 14.1%).
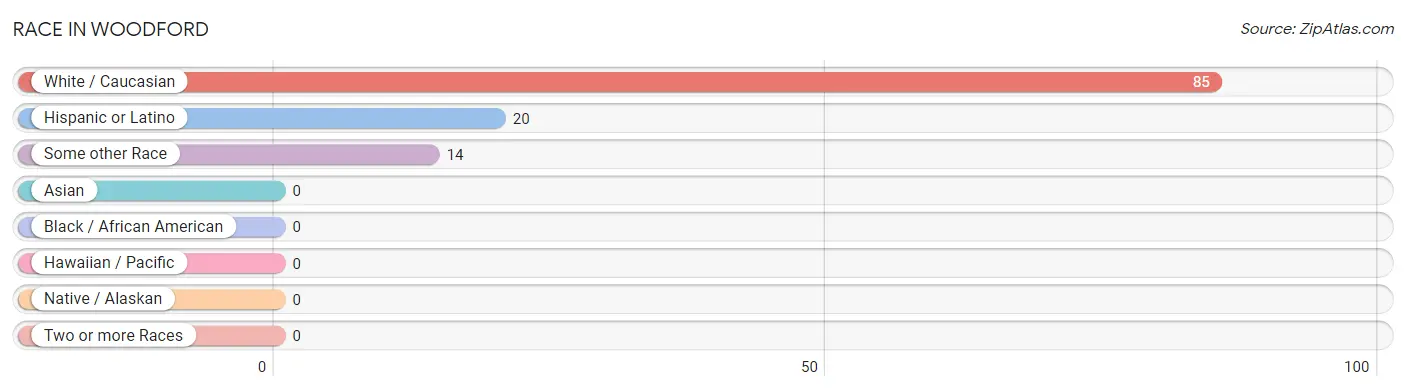
| Race | # Population | % Population |
| Asian | 0 | 0.0% |
| Black / African American | 0 | 0.0% |
| Hawaiian / Pacific | 0 | 0.0% |
| Hispanic or Latino | 20 | 20.2% |
| Native / Alaskan | 0 | 0.0% |
| White / Caucasian | 85 | 85.9% |
| Two or more Races | 0 | 0.0% |
| Some other Race | 14 | 14.1% |
| Total | 99 | 100.0% |
Ancestry in Woodford
The most populous ancestries reported in Woodford are English (29 | 29.3%), Mexican (20 | 20.2%), German (8 | 8.1%), Italian (5 | 5.1%), and Swiss (4 | 4.0%), together accounting for 66.7% of all Woodford residents.
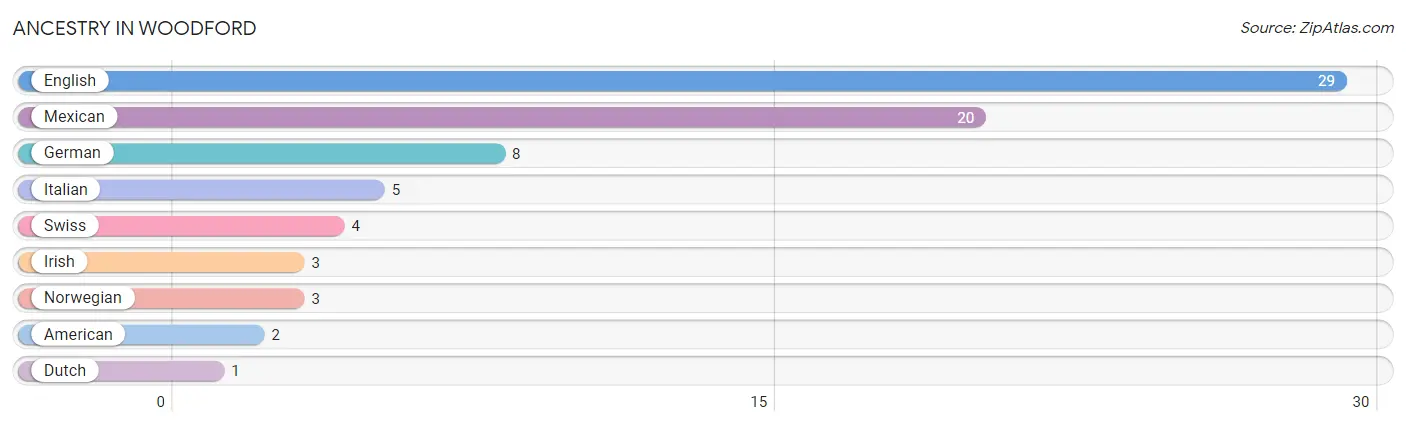
| Ancestry | # Population | % Population |
| American | 2 | 2.0% |
| Dutch | 1 | 1.0% |
| English | 29 | 29.3% |
| German | 8 | 8.1% |
| Irish | 3 | 3.0% |
| Italian | 5 | 5.1% |
| Mexican | 20 | 20.2% |
| Norwegian | 3 | 3.0% |
| Swiss | 4 | 4.0% | View All 9 Rows |
Immigrants in Woodford
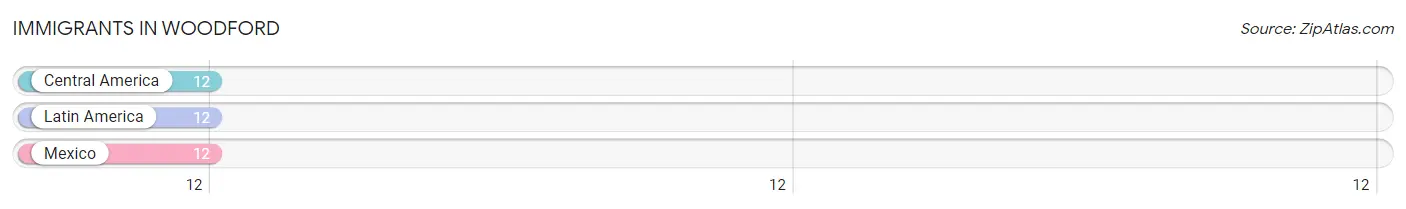
The most numerous immigrant groups reported in Woodford came from Central America (12 | 12.1%), Latin America (12 | 12.1%), and Mexico (12 | 12.1%), together accounting for 36.4% of all Woodford residents.
| Immigration Origin | # Population | % Population |
| Central America | 12 | 12.1% |
| Latin America | 12 | 12.1% |
| Mexico | 12 | 12.1% | View All 3 Rows |
Sex and Age in Woodford
Sex and Age in Woodford
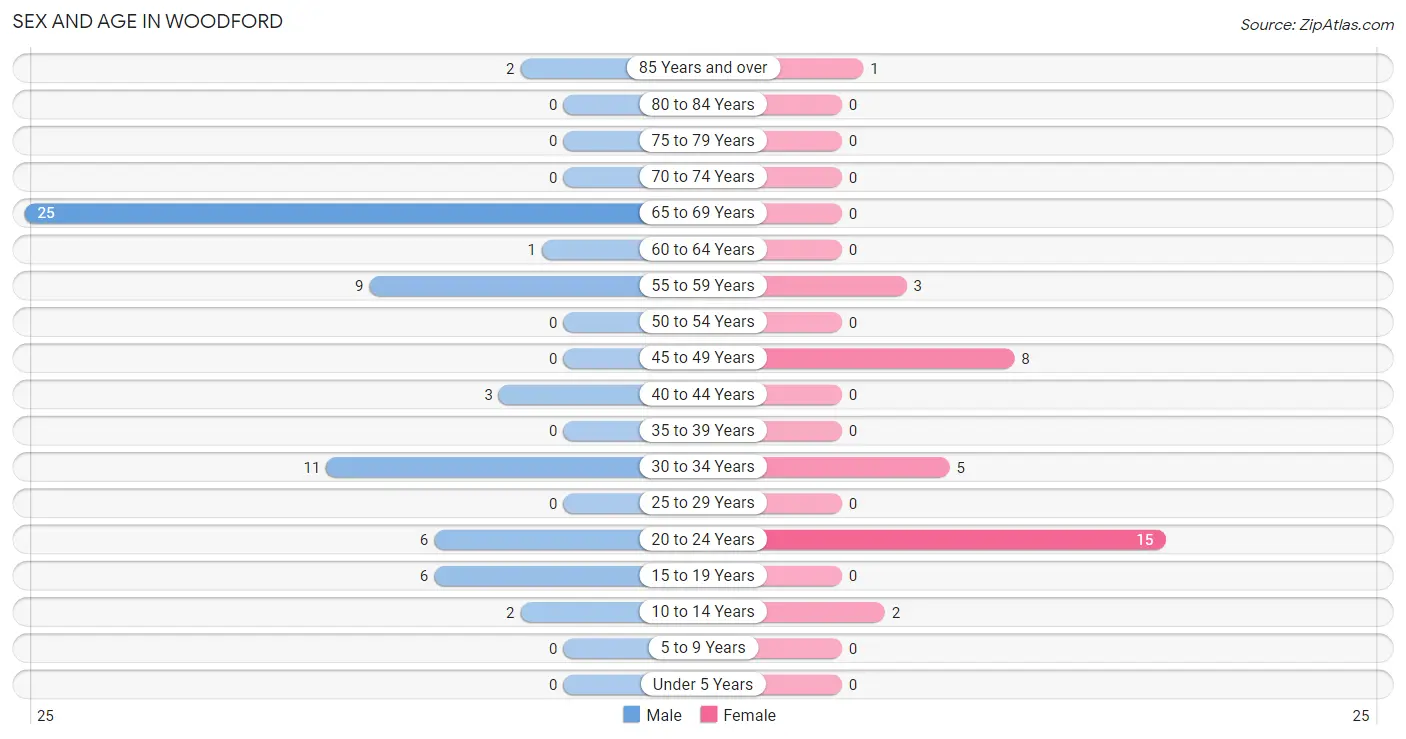
The most populous age groups in Woodford are 65 to 69 Years (25 | 38.5%) for men and 20 to 24 Years (15 | 44.1%) for women.
| Age Bracket | Male | Female |
| Under 5 Years | 0 (0.0%) | 0 (0.0%) |
| 5 to 9 Years | 0 (0.0%) | 0 (0.0%) |
| 10 to 14 Years | 2 (3.1%) | 2 (5.9%) |
| 15 to 19 Years | 6 (9.2%) | 0 (0.0%) |
| 20 to 24 Years | 6 (9.2%) | 15 (44.1%) |
| 25 to 29 Years | 0 (0.0%) | 0 (0.0%) |
| 30 to 34 Years | 11 (16.9%) | 5 (14.7%) |
| 35 to 39 Years | 0 (0.0%) | 0 (0.0%) |
| 40 to 44 Years | 3 (4.6%) | 0 (0.0%) |
| 45 to 49 Years | 0 (0.0%) | 8 (23.5%) |
| 50 to 54 Years | 0 (0.0%) | 0 (0.0%) |
| 55 to 59 Years | 9 (13.9%) | 3 (8.8%) |
| 60 to 64 Years | 1 (1.5%) | 0 (0.0%) |
| 65 to 69 Years | 25 (38.5%) | 0 (0.0%) |
| 70 to 74 Years | 0 (0.0%) | 0 (0.0%) |
| 75 to 79 Years | 0 (0.0%) | 0 (0.0%) |
| 80 to 84 Years | 0 (0.0%) | 0 (0.0%) |
| 85 Years and over | 2 (3.1%) | 1 (2.9%) |
| Total | 65 (100.0%) | 34 (100.0%) |
Families and Households in Woodford
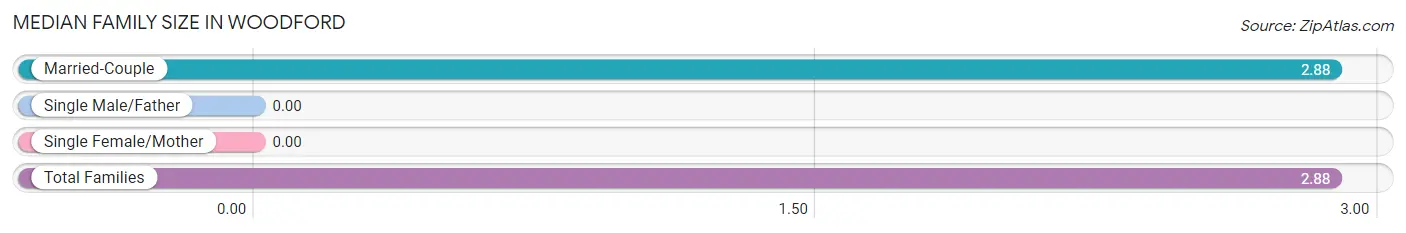
Median Family Size in Woodford
| Family Type | # Families | Family Size |
| Married-Couple | 17 (100.0%) | 2.88 |
| Single Male/Father | 0 (0.0%) | - |
| Single Female/Mother | 0 (0.0%) | - |
| Total Families | 17 (100.0%) | 2.88 |
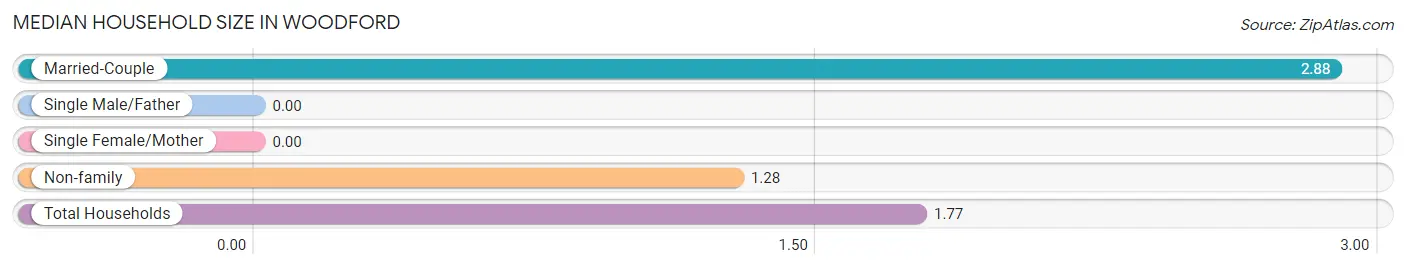
Median Household Size in Woodford
| Household Type | # Households | Household Size |
| Married-Couple | 17 (30.4%) | 2.88 |
| Single Male/Father | 0 (0.0%) | - |
| Single Female/Mother | 0 (0.0%) | - |
| Non-family | 39 (69.6%) | 1.28 |
| Total Households | 56 (100.0%) | 1.77 |
Household Size by Marriage Status in Woodford
Out of a total of 56 households in Woodford, 17 (30.4%) are family households, while 39 (69.6%) are nonfamily households. The most numerous type of family households are 4-person households, comprising 9, and the most common type of nonfamily households are 1-person households, comprising 30.
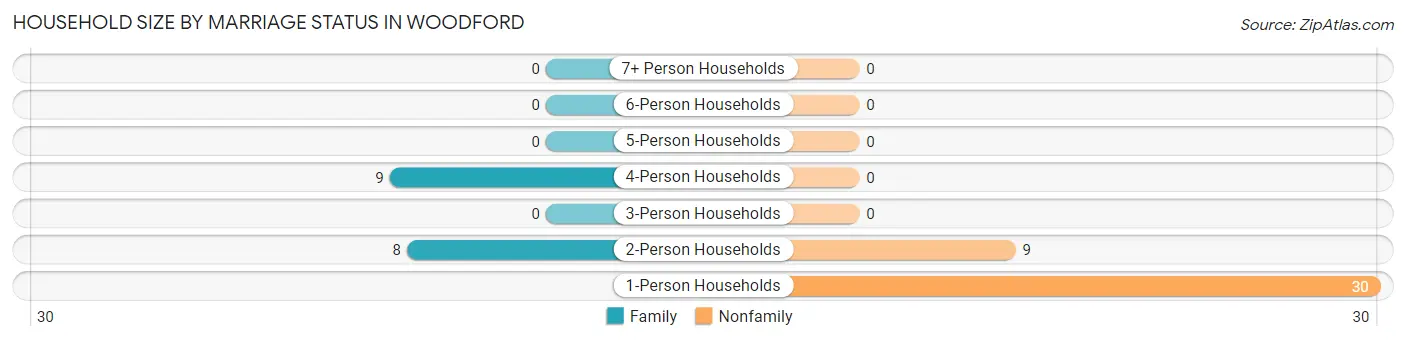
| Household Size | Family Households | Nonfamily Households |
| 1-Person Households | - | 30 (53.6%) |
| 2-Person Households | 8 (14.3%) | 9 (16.1%) |
| 3-Person Households | 0 (0.0%) | 0 (0.0%) |
| 4-Person Households | 9 (16.1%) | 0 (0.0%) |
| 5-Person Households | 0 (0.0%) | 0 (0.0%) |
| 6-Person Households | 0 (0.0%) | 0 (0.0%) |
| 7+ Person Households | 0 (0.0%) | 0 (0.0%) |
| Total | 17 (30.4%) | 39 (69.6%) |
Female Fertility in Woodford
Fertility by Age in Woodford
| Age Bracket | Women with Births | Births / 1,000 Women |
| 15 to 19 years | 0 (0.0%) | 0.0 |
| 20 to 34 years | 0 (0.0%) | 0.0 |
| 35 to 50 years | 0 (0.0%) | 0.0 |
| Total | 0 (0.0%) | 0.0 |
Fertility by Age by Marriage Status in Woodford
| Age Bracket | Married | Unmarried |
| 15 to 19 years | 0 (0.0%) | 0 (0.0%) |
| 20 to 34 years | 0 (0.0%) | 0 (0.0%) |
| 35 to 50 years | 0 (0.0%) | 0 (0.0%) |
| Total | 0 (0.0%) | 0 (0.0%) |
Fertility by Education in Woodford
| Educational Attainment | Women with Births | Births / 1,000 Women |
| Less than High School | 0 (0.0%) | 0.0 |
| High School Diploma | 0 (0.0%) | 0.0 |
| College or Associate's Degree | 0 (0.0%) | 0.0 |
| Bachelor's Degree | 0 (0.0%) | 0.0 |
| Graduate Degree | 0 (0.0%) | 0.0 |
| Total | 0 (0.0%) | 0.0 |
Fertility by Education by Marriage Status in Woodford
| Educational Attainment | Married | Unmarried |
| Less than High School | 0 (0.0%) | 0 (0.0%) |
| High School Diploma | 0 (0.0%) | 0 (0.0%) |
| College or Associate's Degree | 0 (0.0%) | 0 (0.0%) |
| Bachelor's Degree | 0 (0.0%) | 0 (0.0%) |
| Graduate Degree | 0 (0.0%) | 0 (0.0%) |
| Total | 0 (0.0%) | 0 (0.0%) |
Employment Characteristics in Woodford
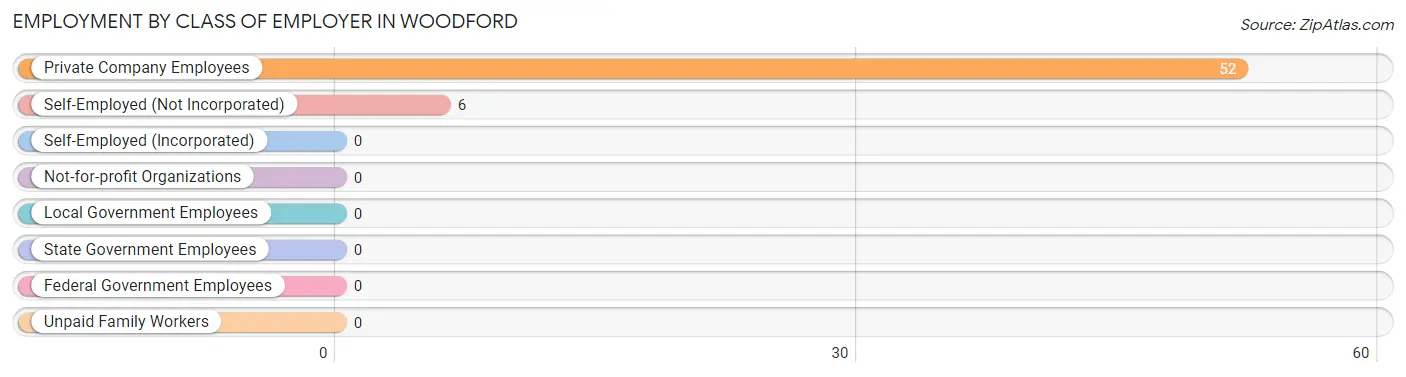
Employment by Class of Employer in Woodford
Among the 58 employed individuals in Woodford, private company employees (52 | 89.7%), and self-employed (not incorporated) (6 | 10.3%) make up the most common classes of employment.
| Employer Class | # Employees | % Employees |
| Private Company Employees | 52 | 89.7% |
| Self-Employed (Incorporated) | 0 | 0.0% |
| Self-Employed (Not Incorporated) | 6 | 10.3% |
| Not-for-profit Organizations | 0 | 0.0% |
| Local Government Employees | 0 | 0.0% |
| State Government Employees | 0 | 0.0% |
| Federal Government Employees | 0 | 0.0% |
| Unpaid Family Workers | 0 | 0.0% |
| Total | 58 | 100.0% |
Employment Status by Age in Woodford
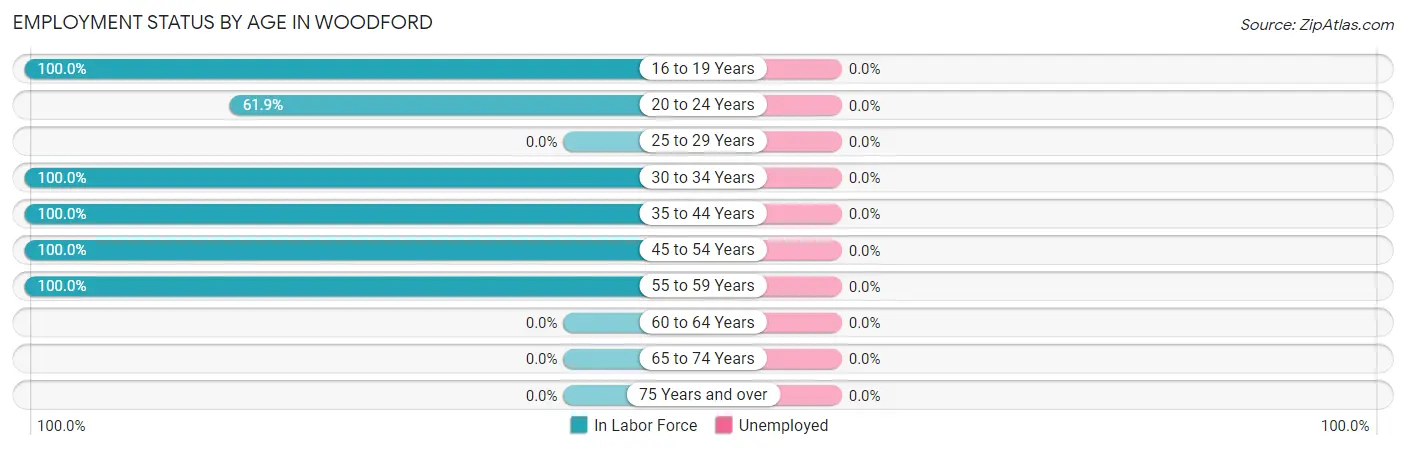
| Age Bracket | In Labor Force | Unemployed |
| 16 to 19 Years | 6 (100.0%) | 0 (0.0%) |
| 20 to 24 Years | 13 (61.9%) | 0 (0.0%) |
| 25 to 29 Years | 0 (0.0%) | 0 (0.0%) |
| 30 to 34 Years | 16 (100.0%) | 0 (0.0%) |
| 35 to 44 Years | 3 (100.0%) | 0 (0.0%) |
| 45 to 54 Years | 8 (100.0%) | 0 (0.0%) |
| 55 to 59 Years | 12 (100.0%) | 0 (0.0%) |
| 60 to 64 Years | 0 (0.0%) | 0 (0.0%) |
| 65 to 74 Years | 0 (0.0%) | 0 (0.0%) |
| 75 Years and over | 0 (0.0%) | 0 (0.0%) |
| Total | 58 (61.1%) | 0 (0.0%) |
Employment Status by Educational Attainment in Woodford
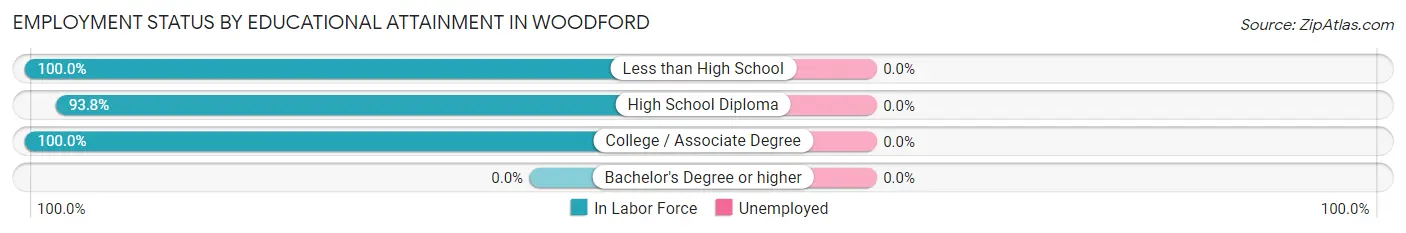
| Educational Attainment | In Labor Force | Unemployed |
| Less than High School | 5 (100.0%) | 0 (0.0%) |
| High School Diploma | 15 (93.8%) | 0 (0.0%) |
| College / Associate Degree | 19 (100.0%) | 0 (0.0%) |
| Bachelor's Degree or higher | 0 (0.0%) | 0 (0.0%) |
| Total | 39 (97.5%) | 0 (0.0%) |
Employment Occupations by Sex in Woodford
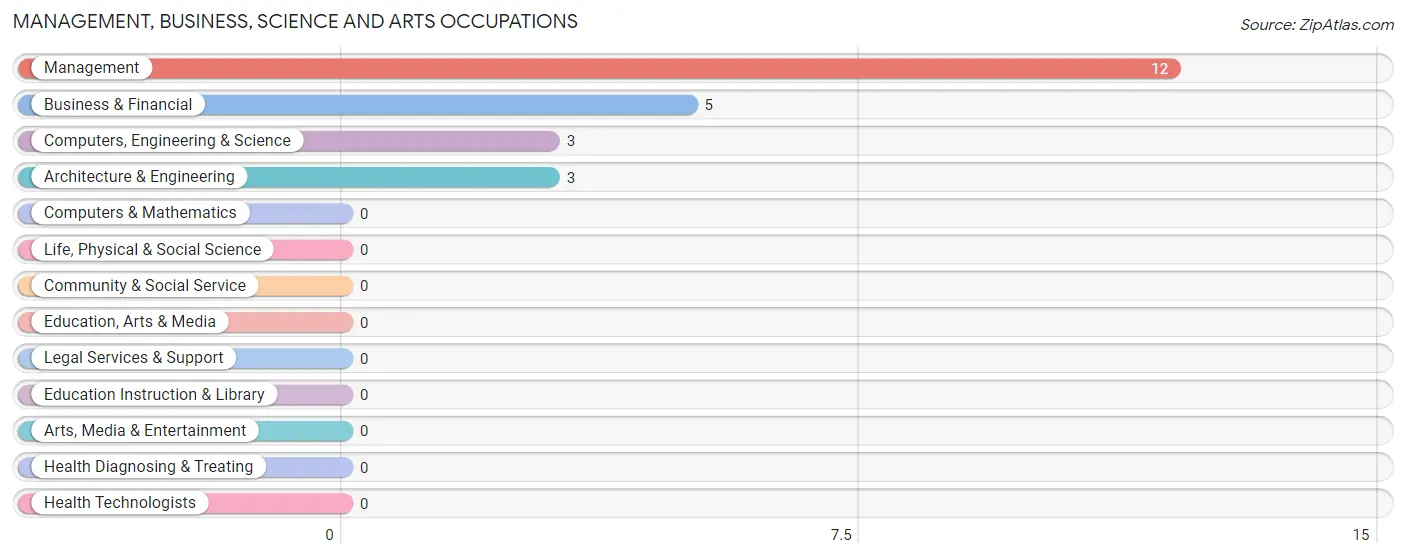
Management, Business, Science and Arts Occupations
The most common Management, Business, Science and Arts occupations in Woodford are Management (12 | 20.7%), Business & Financial (5 | 8.6%), Computers, Engineering & Science (3 | 5.2%), and Architecture & Engineering (3 | 5.2%).
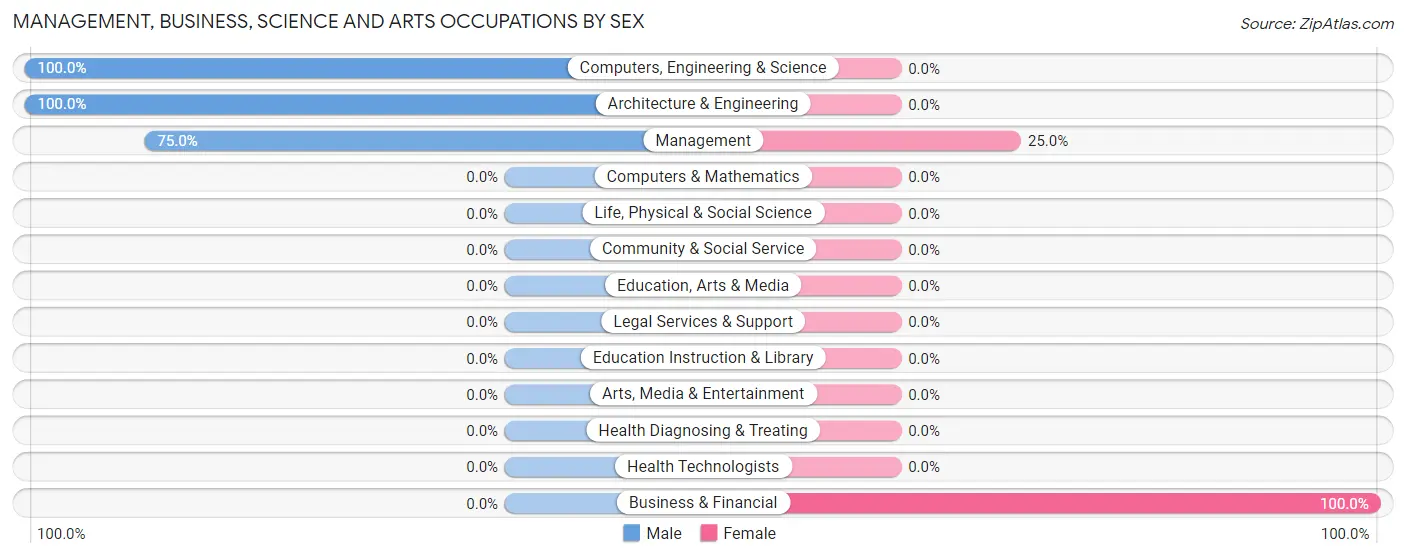
Management, Business, Science and Arts Occupations by Sex
Within the Management, Business, Science and Arts occupations in Woodford, the most male-oriented occupations are Computers, Engineering & Science (100.0%), Architecture & Engineering (100.0%), and Management (75.0%), while the most female-oriented occupations are Business & Financial (100.0%), and Management (25.0%).
| Occupation | Male | Female |
| Management | 9 (75.0%) | 3 (25.0%) |
| Business & Financial | 0 (0.0%) | 5 (100.0%) |
| Computers, Engineering & Science | 3 (100.0%) | 0 (0.0%) |
| Computers & Mathematics | 0 (0.0%) | 0 (0.0%) |
| Architecture & Engineering | 3 (100.0%) | 0 (0.0%) |
| Life, Physical & Social Science | 0 (0.0%) | 0 (0.0%) |
| Community & Social Service | 0 (0.0%) | 0 (0.0%) |
| Education, Arts & Media | 0 (0.0%) | 0 (0.0%) |
| Legal Services & Support | 0 (0.0%) | 0 (0.0%) |
| Education Instruction & Library | 0 (0.0%) | 0 (0.0%) |
| Arts, Media & Entertainment | 0 (0.0%) | 0 (0.0%) |
| Health Diagnosing & Treating | 0 (0.0%) | 0 (0.0%) |
| Health Technologists | 0 (0.0%) | 0 (0.0%) |
| Total (Category) | 12 (60.0%) | 8 (40.0%) |
| Total (Overall) | 35 (60.3%) | 23 (39.7%) |
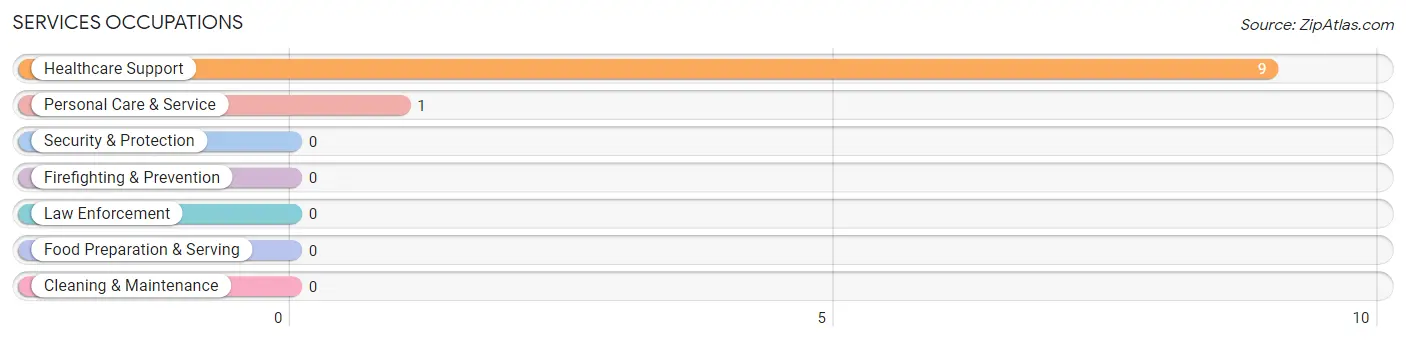
Services Occupations
The most common Services occupations in Woodford are Healthcare Support (9 | 15.5%), and Personal Care & Service (1 | 1.7%).
Services Occupations by Sex
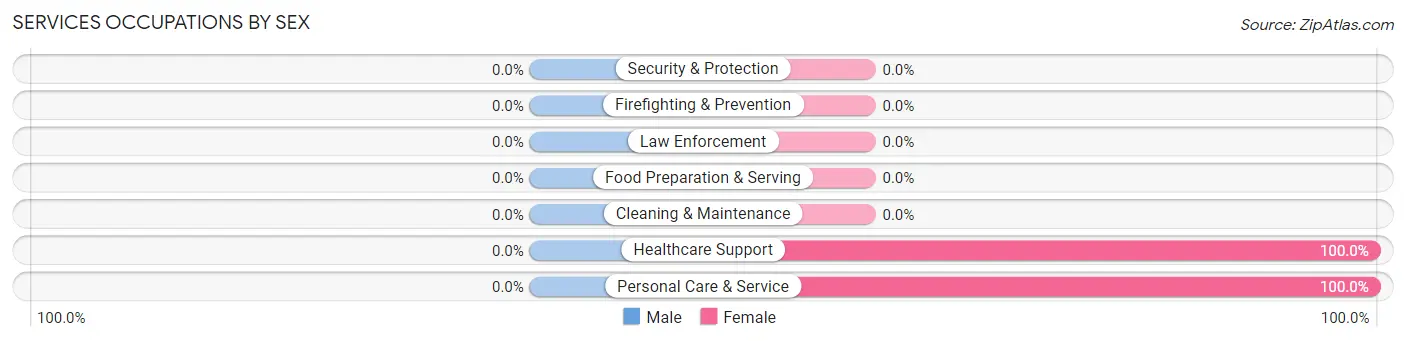
| Occupation | Male | Female |
| Healthcare Support | 0 (0.0%) | 9 (100.0%) |
| Security & Protection | 0 (0.0%) | 0 (0.0%) |
| Firefighting & Prevention | 0 (0.0%) | 0 (0.0%) |
| Law Enforcement | 0 (0.0%) | 0 (0.0%) |
| Food Preparation & Serving | 0 (0.0%) | 0 (0.0%) |
| Cleaning & Maintenance | 0 (0.0%) | 0 (0.0%) |
| Personal Care & Service | 0 (0.0%) | 1 (100.0%) |
| Total (Category) | 0 (0.0%) | 10 (100.0%) |
| Total (Overall) | 35 (60.3%) | 23 (39.7%) |
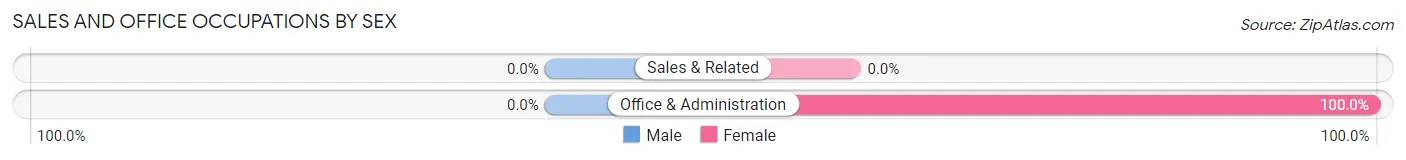
Sales and Office Occupations
The most common Sales and Office occupations in Woodford are , and Office & Administration (5 | 8.6%).
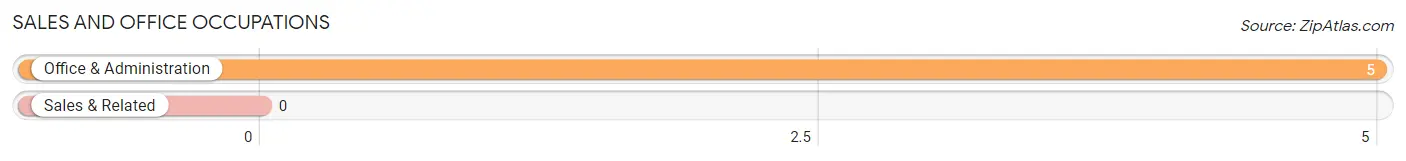
Sales and Office Occupations by Sex
| Occupation | Male | Female |
| Sales & Related | 0 (0.0%) | 0 (0.0%) |
| Office & Administration | 0 (0.0%) | 5 (100.0%) |
| Total (Category) | 0 (0.0%) | 5 (100.0%) |
| Total (Overall) | 35 (60.3%) | 23 (39.7%) |
Natural Resources, Construction and Maintenance Occupations
The most common Natural Resources, Construction and Maintenance occupations in Woodford are Installation, Maintenance & Repair (12 | 20.7%), and Farming, Fishing & Forestry (6 | 10.3%).
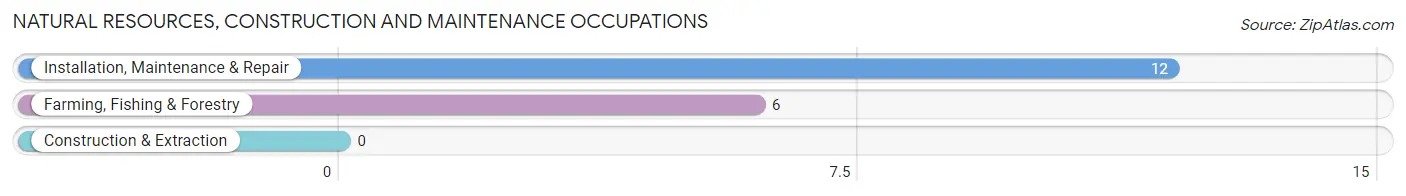
Natural Resources, Construction and Maintenance Occupations by Sex
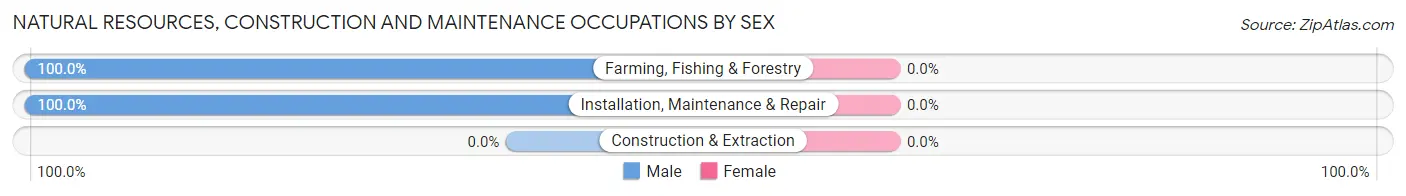
| Occupation | Male | Female |
| Farming, Fishing & Forestry | 6 (100.0%) | 0 (0.0%) |
| Construction & Extraction | 0 (0.0%) | 0 (0.0%) |
| Installation, Maintenance & Repair | 12 (100.0%) | 0 (0.0%) |
| Total (Category) | 18 (100.0%) | 0 (0.0%) |
| Total (Overall) | 35 (60.3%) | 23 (39.7%) |
Production, Transportation and Moving Occupations
The most common Production, Transportation and Moving occupations in Woodford are , and Production (5 | 8.6%).
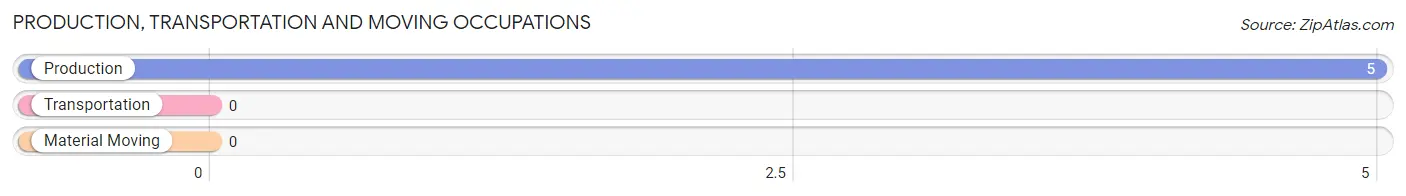
Production, Transportation and Moving Occupations by Sex
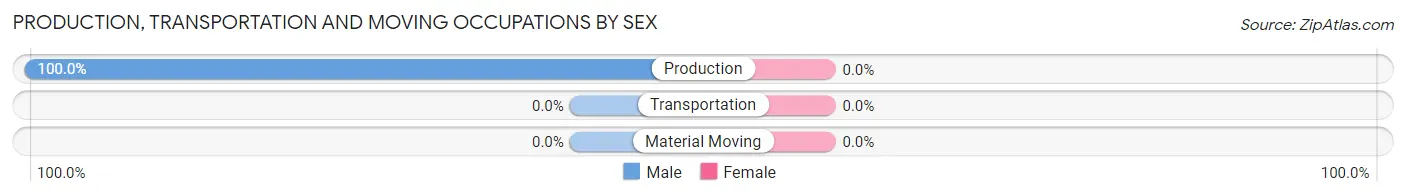
| Occupation | Male | Female |
| Production | 5 (100.0%) | 0 (0.0%) |
| Transportation | 0 (0.0%) | 0 (0.0%) |
| Material Moving | 0 (0.0%) | 0 (0.0%) |
| Total (Category) | 5 (100.0%) | 0 (0.0%) |
| Total (Overall) | 35 (60.3%) | 23 (39.7%) |
Employment Industries by Sex in Woodford
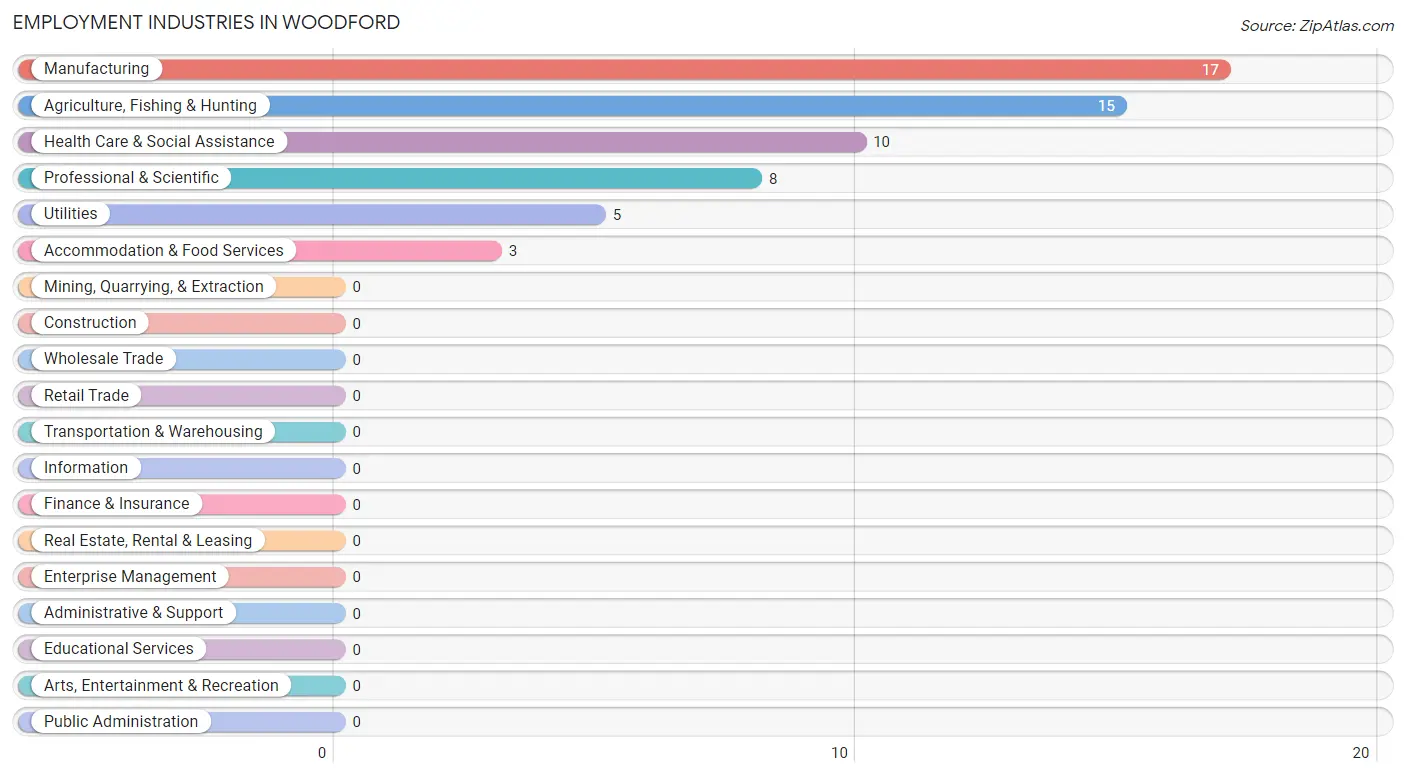
Employment Industries in Woodford
The major employment industries in Woodford include Manufacturing (17 | 29.3%), Agriculture, Fishing & Hunting (15 | 25.9%), Health Care & Social Assistance (10 | 17.2%), Professional & Scientific (8 | 13.8%), and Utilities (5 | 8.6%).
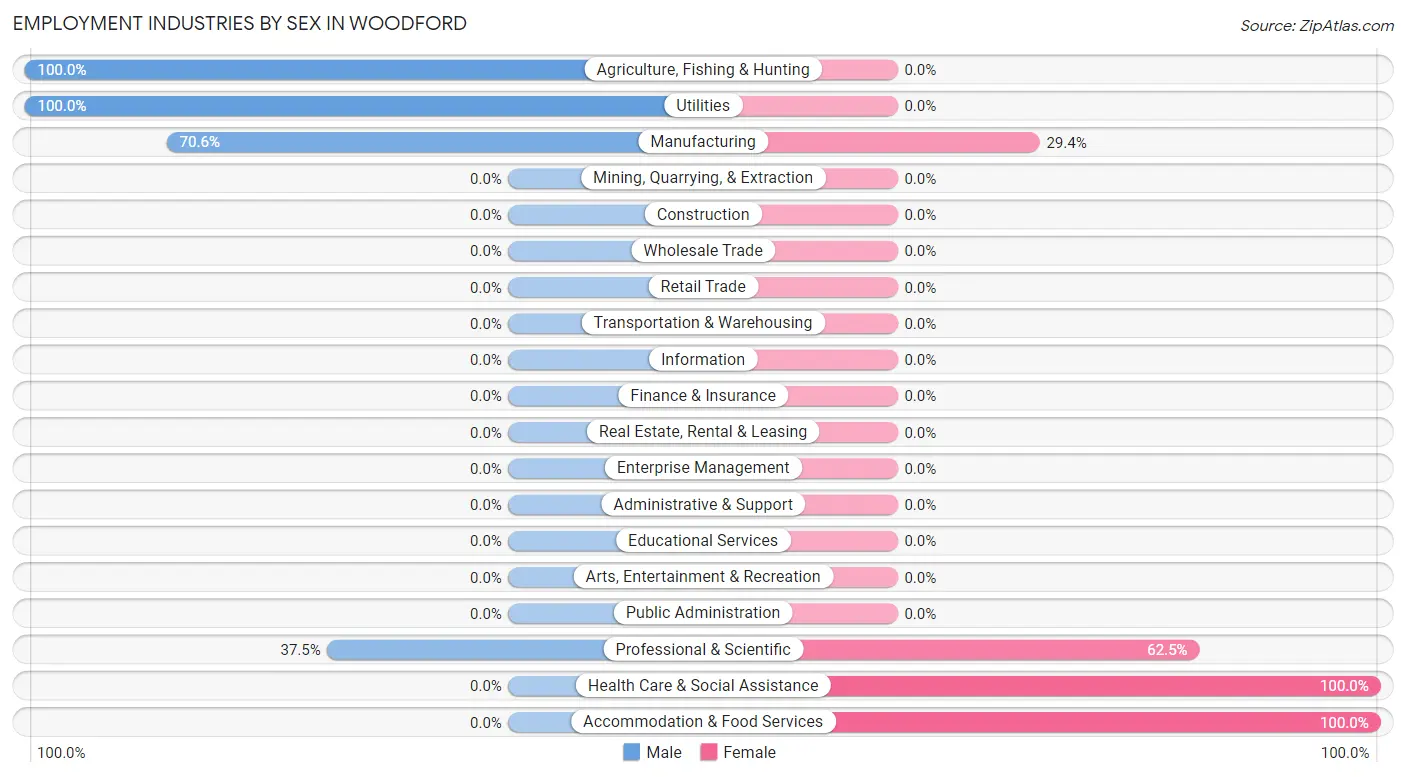
Employment Industries by Sex in Woodford
The Woodford industries that see more men than women are Agriculture, Fishing & Hunting (100.0%), Utilities (100.0%), and Manufacturing (70.6%), whereas the industries that tend to have a higher number of women are Health Care & Social Assistance (100.0%), Accommodation & Food Services (100.0%), and Professional & Scientific (62.5%).
| Industry | Male | Female |
| Agriculture, Fishing & Hunting | 15 (100.0%) | 0 (0.0%) |
| Mining, Quarrying, & Extraction | 0 (0.0%) | 0 (0.0%) |
| Construction | 0 (0.0%) | 0 (0.0%) |
| Manufacturing | 12 (70.6%) | 5 (29.4%) |
| Wholesale Trade | 0 (0.0%) | 0 (0.0%) |
| Retail Trade | 0 (0.0%) | 0 (0.0%) |
| Transportation & Warehousing | 0 (0.0%) | 0 (0.0%) |
| Utilities | 5 (100.0%) | 0 (0.0%) |
| Information | 0 (0.0%) | 0 (0.0%) |
| Finance & Insurance | 0 (0.0%) | 0 (0.0%) |
| Real Estate, Rental & Leasing | 0 (0.0%) | 0 (0.0%) |
| Professional & Scientific | 3 (37.5%) | 5 (62.5%) |
| Enterprise Management | 0 (0.0%) | 0 (0.0%) |
| Administrative & Support | 0 (0.0%) | 0 (0.0%) |
| Educational Services | 0 (0.0%) | 0 (0.0%) |
| Health Care & Social Assistance | 0 (0.0%) | 10 (100.0%) |
| Arts, Entertainment & Recreation | 0 (0.0%) | 0 (0.0%) |
| Accommodation & Food Services | 0 (0.0%) | 3 (100.0%) |
| Public Administration | 0 (0.0%) | 0 (0.0%) |
| Total | 35 (60.3%) | 23 (39.7%) |
Education in Woodford
School Enrollment in Woodford
The most common levels of schooling among the 20 students in Woodford are college / undergraduate (16 | 80.0%), and middle school (4 | 20.0%).
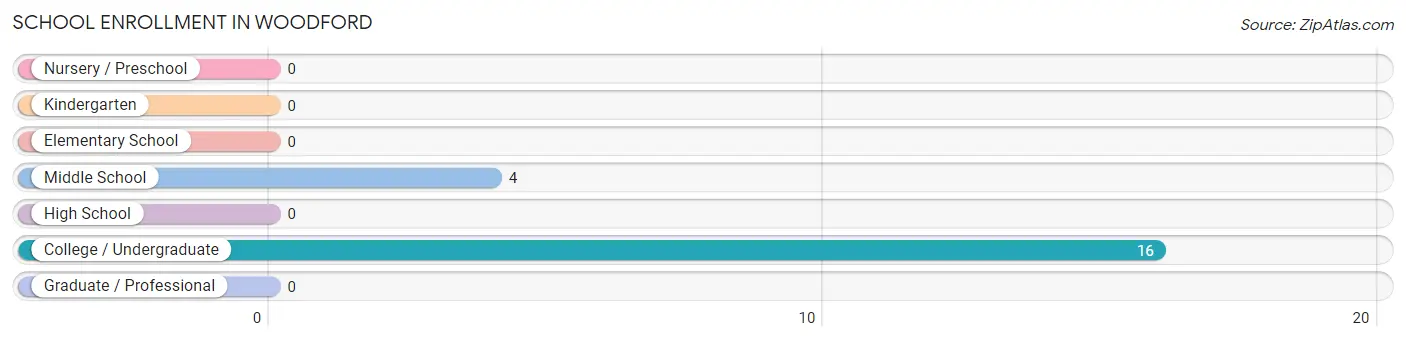
| School Level | # Students | % Students |
| Nursery / Preschool | 0 | 0.0% |
| Kindergarten | 0 | 0.0% |
| Elementary School | 0 | 0.0% |
| Middle School | 4 | 20.0% |
| High School | 0 | 0.0% |
| College / Undergraduate | 16 | 80.0% |
| Graduate / Professional | 0 | 0.0% |
| Total | 20 | 100.0% |
School Enrollment by Age by Funding Source in Woodford
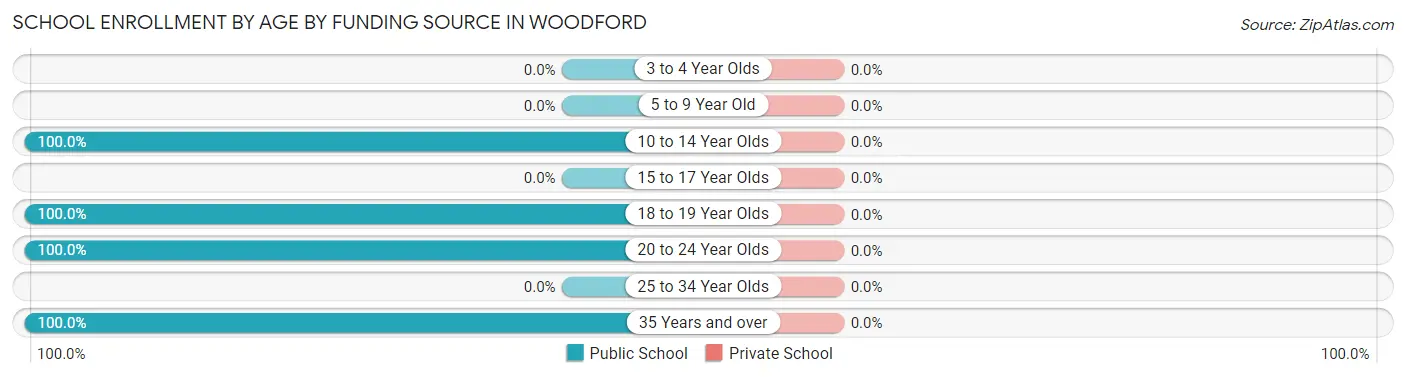
| Age Bracket | Public School | Private School |
| 3 to 4 Year Olds | 0 (0.0%) | 0 (0.0%) |
| 5 to 9 Year Old | 0 (0.0%) | 0 (0.0%) |
| 10 to 14 Year Olds | 4 (100.0%) | 0 (0.0%) |
| 15 to 17 Year Olds | 0 (0.0%) | 0 (0.0%) |
| 18 to 19 Year Olds | 6 (100.0%) | 0 (0.0%) |
| 20 to 24 Year Olds | 7 (100.0%) | 0 (0.0%) |
| 25 to 34 Year Olds | 0 (0.0%) | 0 (0.0%) |
| 35 Years and over | 3 (100.0%) | 0 (0.0%) |
| Total | 20 (100.0%) | 0 (0.0%) |
Educational Attainment by Field of Study in Woodford
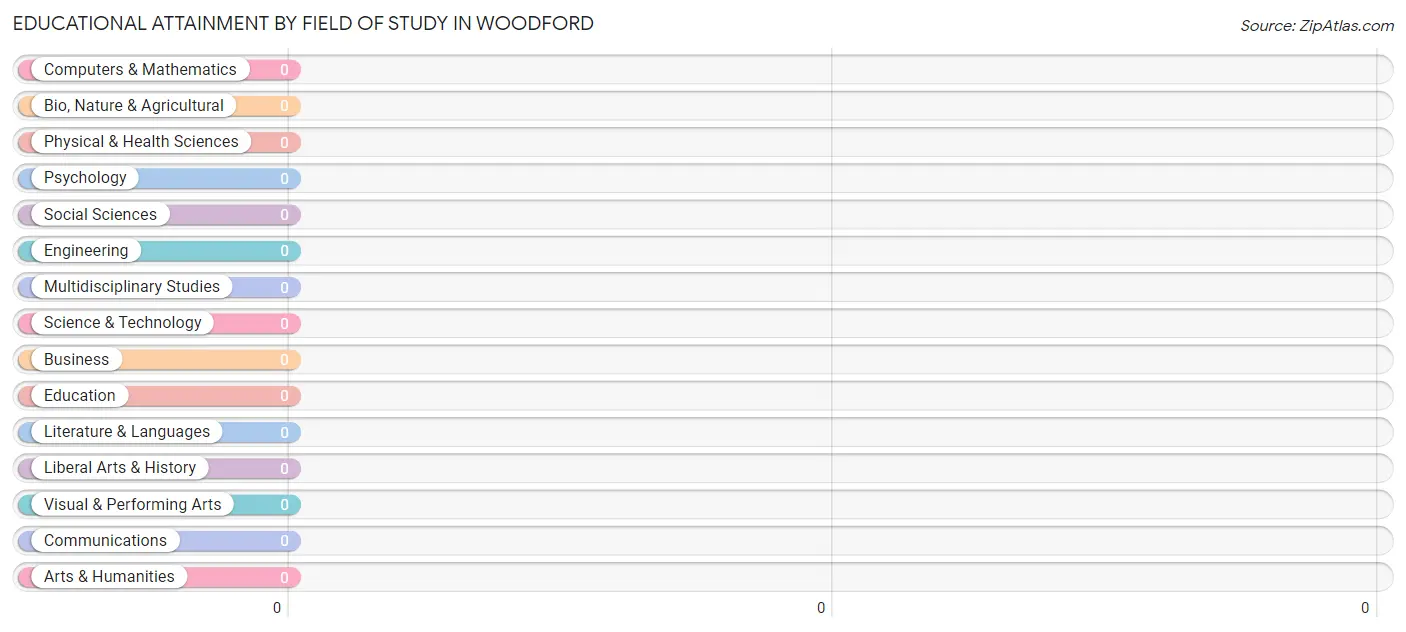
| Field of Study | # Graduates | % Graduates |
| Computers & Mathematics | 0 | 0.0% |
| Bio, Nature & Agricultural | 0 | 0.0% |
| Physical & Health Sciences | 0 | 0.0% |
| Psychology | 0 | 0.0% |
| Social Sciences | 0 | 0.0% |
| Engineering | 0 | 0.0% |
| Multidisciplinary Studies | 0 | 0.0% |
| Science & Technology | 0 | 0.0% |
| Business | 0 | 0.0% |
| Education | 0 | 0.0% |
| Literature & Languages | 0 | 0.0% |
| Liberal Arts & History | 0 | 0.0% |
| Visual & Performing Arts | 0 | 0.0% |
| Communications | 0 | 0.0% |
| Arts & Humanities | 0 | 0.0% |
| Total | 0 | 0.0% |
Transportation & Commute in Woodford
Vehicle Availability by Sex in Woodford
The most prevalent vehicle ownership categories in Woodford are males with 2 vehicles (15, accounting for 42.9%) and females with 2 vehicles (1, making up 65.2%).
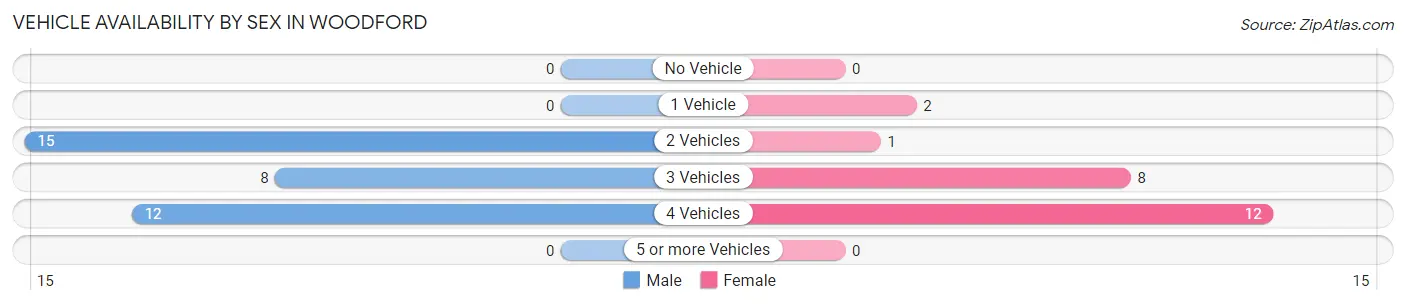
| Vehicles Available | Male | Female |
| No Vehicle | 0 (0.0%) | 0 (0.0%) |
| 1 Vehicle | 0 (0.0%) | 2 (8.7%) |
| 2 Vehicles | 15 (42.9%) | 1 (4.3%) |
| 3 Vehicles | 8 (22.9%) | 8 (34.8%) |
| 4 Vehicles | 12 (34.3%) | 12 (52.2%) |
| 5 or more Vehicles | 0 (0.0%) | 0 (0.0%) |
| Total | 35 (100.0%) | 23 (100.0%) |
Commute Time in Woodford
The most frequently occuring commute durations in Woodford are 10 to 14 minutes (17 commuters, 29.8%), 20 to 24 minutes (14 commuters, 24.6%), and 15 to 19 minutes (12 commuters, 21.0%).
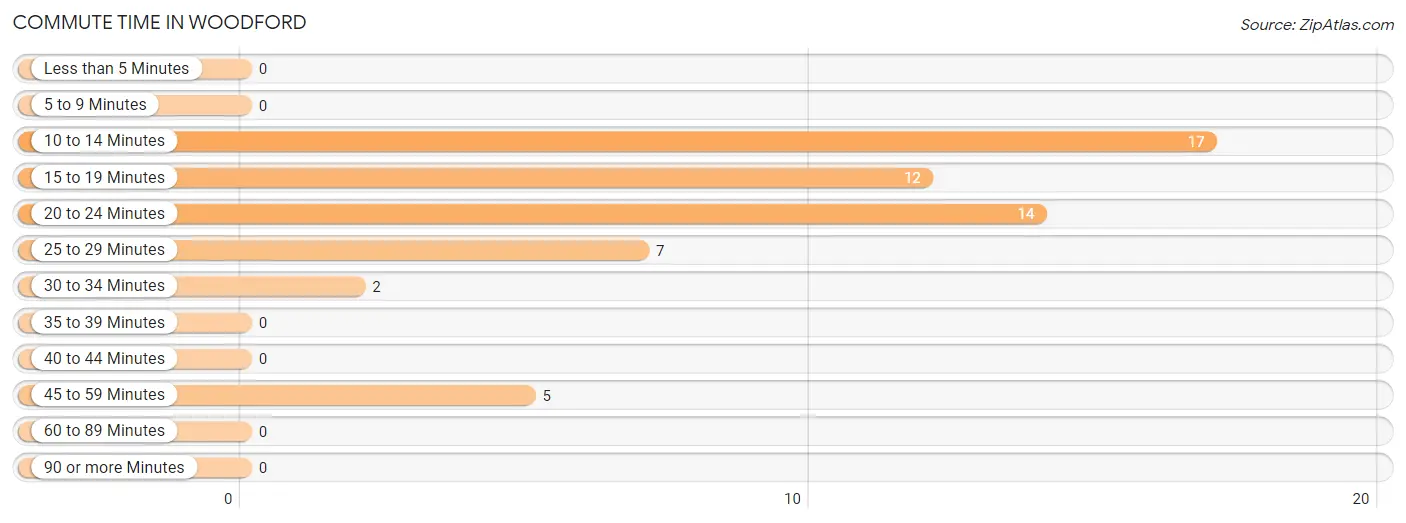
| Commute Time | # Commuters | % Commuters |
| Less than 5 Minutes | 0 | 0.0% |
| 5 to 9 Minutes | 0 | 0.0% |
| 10 to 14 Minutes | 17 | 29.8% |
| 15 to 19 Minutes | 12 | 21.0% |
| 20 to 24 Minutes | 14 | 24.6% |
| 25 to 29 Minutes | 7 | 12.3% |
| 30 to 34 Minutes | 2 | 3.5% |
| 35 to 39 Minutes | 0 | 0.0% |
| 40 to 44 Minutes | 0 | 0.0% |
| 45 to 59 Minutes | 5 | 8.8% |
| 60 to 89 Minutes | 0 | 0.0% |
| 90 or more Minutes | 0 | 0.0% |
Commute Time by Sex in Woodford
The most common commute times in Woodford are 20 to 24 minutes (14 commuters, 40.0%) for males and 25 to 29 minutes (7 commuters, 31.8%) for females.
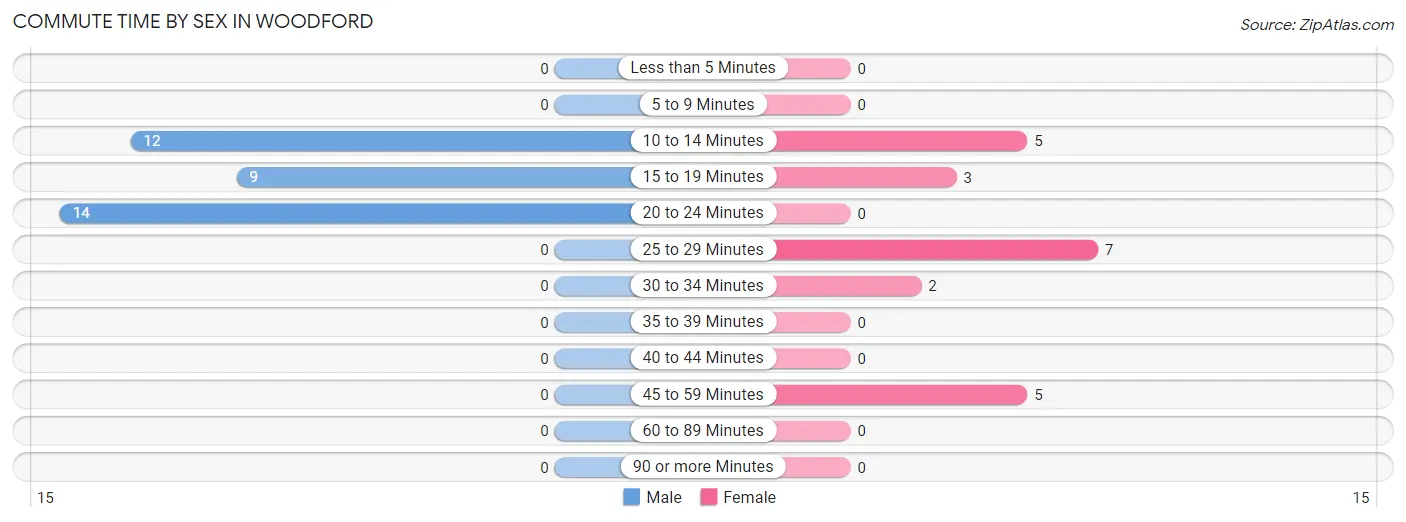
| Commute Time | Male | Female |
| Less than 5 Minutes | 0 (0.0%) | 0 (0.0%) |
| 5 to 9 Minutes | 0 (0.0%) | 0 (0.0%) |
| 10 to 14 Minutes | 12 (34.3%) | 5 (22.7%) |
| 15 to 19 Minutes | 9 (25.7%) | 3 (13.6%) |
| 20 to 24 Minutes | 14 (40.0%) | 0 (0.0%) |
| 25 to 29 Minutes | 0 (0.0%) | 7 (31.8%) |
| 30 to 34 Minutes | 0 (0.0%) | 2 (9.1%) |
| 35 to 39 Minutes | 0 (0.0%) | 0 (0.0%) |
| 40 to 44 Minutes | 0 (0.0%) | 0 (0.0%) |
| 45 to 59 Minutes | 0 (0.0%) | 5 (22.7%) |
| 60 to 89 Minutes | 0 (0.0%) | 0 (0.0%) |
| 90 or more Minutes | 0 (0.0%) | 0 (0.0%) |
Time of Departure to Work by Sex in Woodford
The most frequent times of departure to work in Woodford are 7:00 AM to 7:29 AM (17, 48.6%) for males and 9:00 AM to 9:59 AM (12, 54.5%) for females.
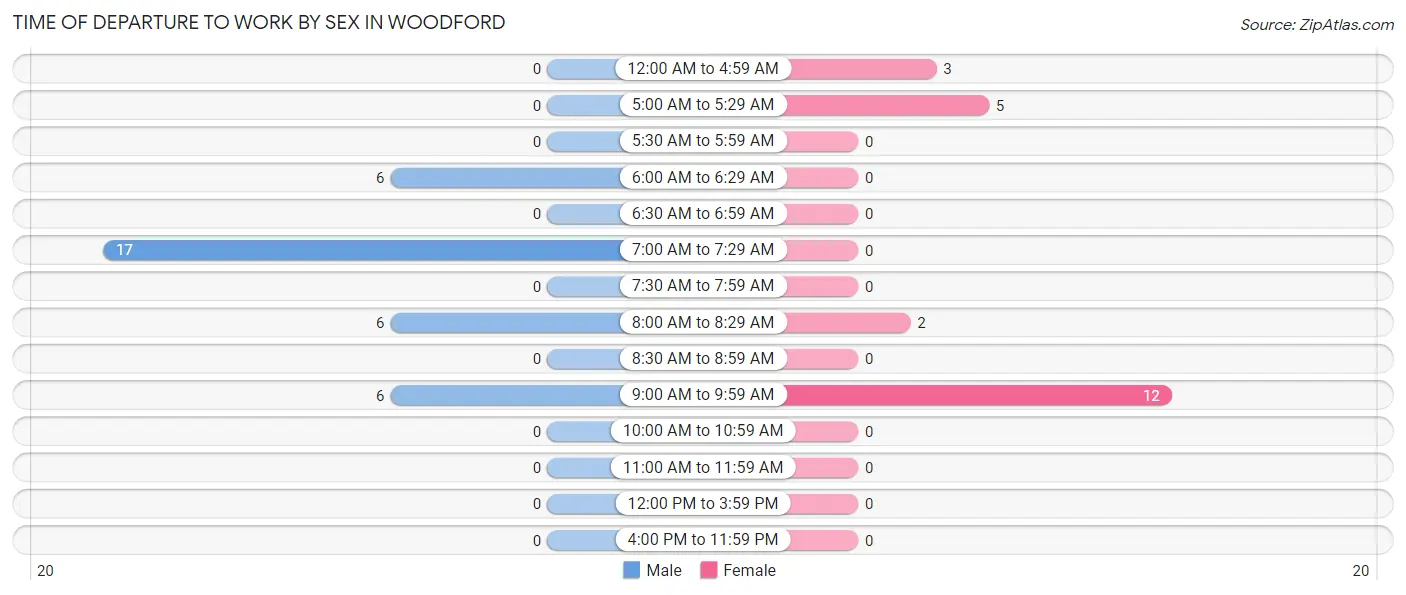
| Time of Departure | Male | Female |
| 12:00 AM to 4:59 AM | 0 (0.0%) | 3 (13.6%) |
| 5:00 AM to 5:29 AM | 0 (0.0%) | 5 (22.7%) |
| 5:30 AM to 5:59 AM | 0 (0.0%) | 0 (0.0%) |
| 6:00 AM to 6:29 AM | 6 (17.1%) | 0 (0.0%) |
| 6:30 AM to 6:59 AM | 0 (0.0%) | 0 (0.0%) |
| 7:00 AM to 7:29 AM | 17 (48.6%) | 0 (0.0%) |
| 7:30 AM to 7:59 AM | 0 (0.0%) | 0 (0.0%) |
| 8:00 AM to 8:29 AM | 6 (17.1%) | 2 (9.1%) |
| 8:30 AM to 8:59 AM | 0 (0.0%) | 0 (0.0%) |
| 9:00 AM to 9:59 AM | 6 (17.1%) | 12 (54.5%) |
| 10:00 AM to 10:59 AM | 0 (0.0%) | 0 (0.0%) |
| 11:00 AM to 11:59 AM | 0 (0.0%) | 0 (0.0%) |
| 12:00 PM to 3:59 PM | 0 (0.0%) | 0 (0.0%) |
| 4:00 PM to 11:59 PM | 0 (0.0%) | 0 (0.0%) |
| Total | 35 (100.0%) | 22 (100.0%) |
Housing Occupancy in Woodford
Occupancy by Ownership in Woodford
Of the total 56 dwellings in Woodford, owner-occupied units account for 47 (83.9%), while renter-occupied units make up 9 (16.1%).
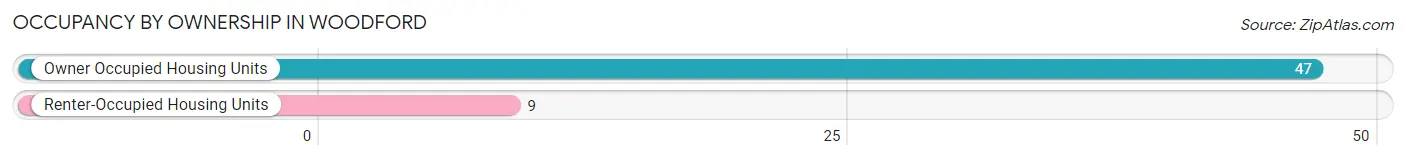
| Occupancy | # Housing Units | % Housing Units |
| Owner Occupied Housing Units | 47 | 83.9% |
| Renter-Occupied Housing Units | 9 | 16.1% |
| Total Occupied Housing Units | 56 | 100.0% |
Occupancy by Household Size in Woodford
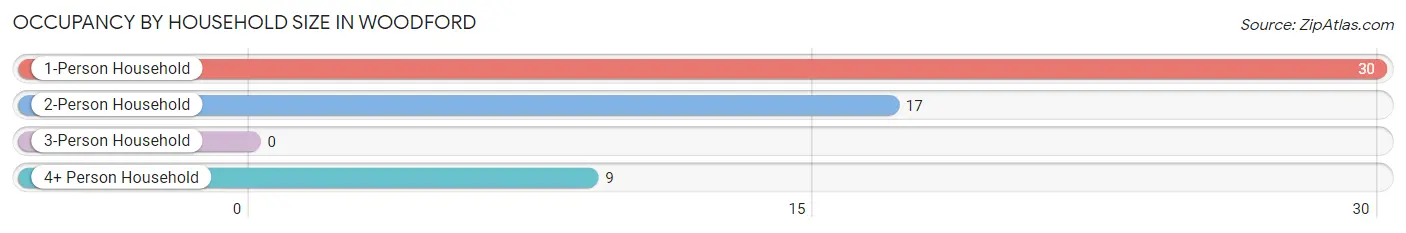
| Household Size | # Housing Units | % Housing Units |
| 1-Person Household | 30 | 53.6% |
| 2-Person Household | 17 | 30.4% |
| 3-Person Household | 0 | 0.0% |
| 4+ Person Household | 9 | 16.1% |
| Total Housing Units | 56 | 100.0% |
Occupancy by Ownership by Household Size in Woodford
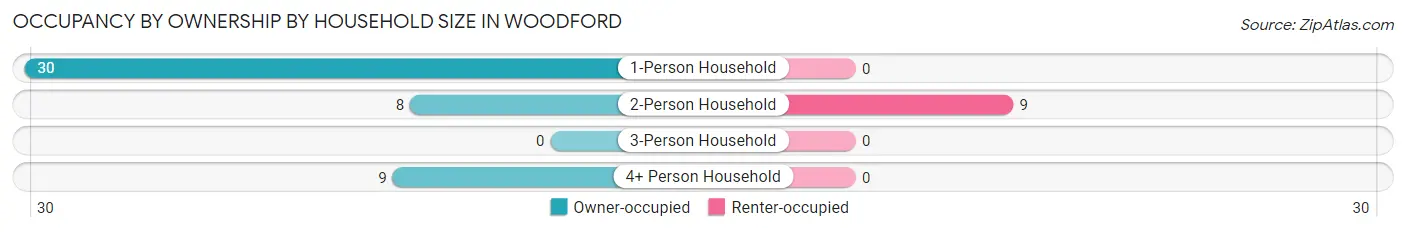
| Household Size | Owner-occupied | Renter-occupied |
| 1-Person Household | 30 (100.0%) | 0 (0.0%) |
| 2-Person Household | 8 (47.1%) | 9 (52.9%) |
| 3-Person Household | 0 (0.0%) | 0 (0.0%) |
| 4+ Person Household | 9 (100.0%) | 0 (0.0%) |
| Total Housing Units | 47 (83.9%) | 9 (16.1%) |
Occupancy by Educational Attainment in Woodford
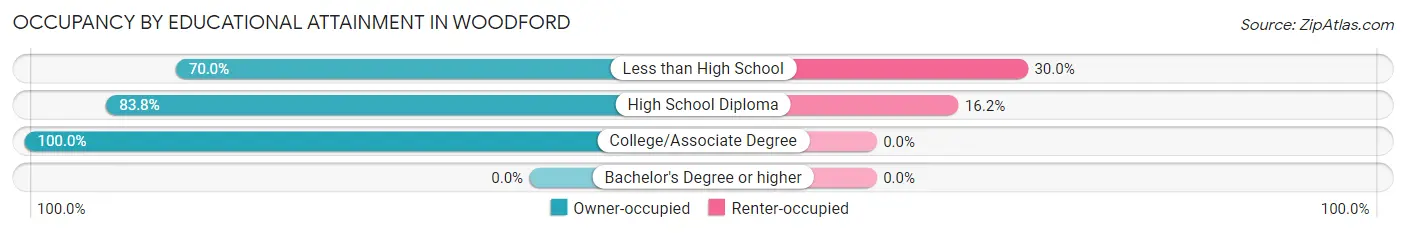
| Household Size | Owner-occupied | Renter-occupied |
| Less than High School | 7 (70.0%) | 3 (30.0%) |
| High School Diploma | 31 (83.8%) | 6 (16.2%) |
| College/Associate Degree | 9 (100.0%) | 0 (0.0%) |
| Bachelor's Degree or higher | 0 (0.0%) | 0 (0.0%) |
Occupancy by Age of Householder in Woodford
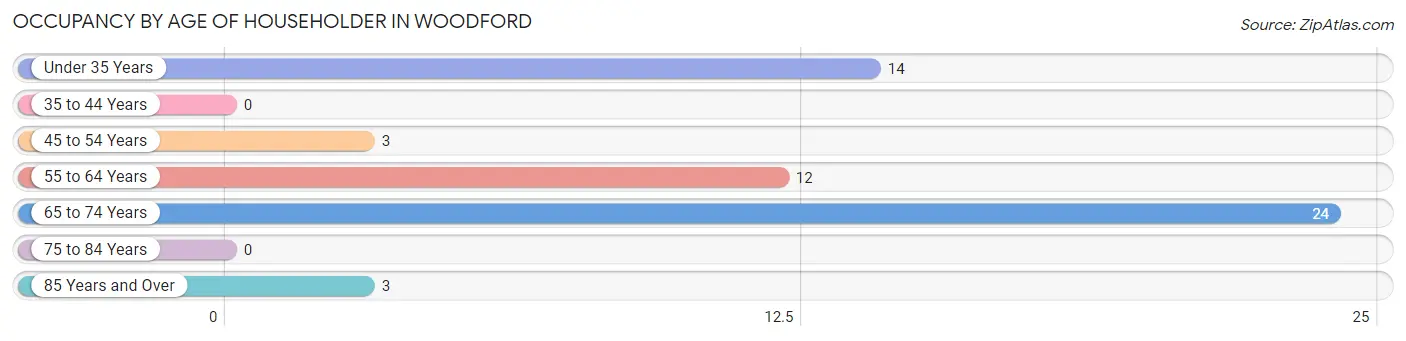
| Age Bracket | # Households | % Households |
| Under 35 Years | 14 | 25.0% |
| 35 to 44 Years | 0 | 0.0% |
| 45 to 54 Years | 3 | 5.4% |
| 55 to 64 Years | 12 | 21.4% |
| 65 to 74 Years | 24 | 42.9% |
| 75 to 84 Years | 0 | 0.0% |
| 85 Years and Over | 3 | 5.4% |
| Total | 56 | 100.0% |
Housing Finances in Woodford
Median Income by Occupancy in Woodford
| Occupancy Type | # Households | Median Income |
| Owner-Occupied | 47 (83.9%) | $0 |
| Renter-Occupied | 9 (16.1%) | $0 |
| Average | 56 (100.0%) | $0 |
Occupancy by Householder Income Bracket in Woodford
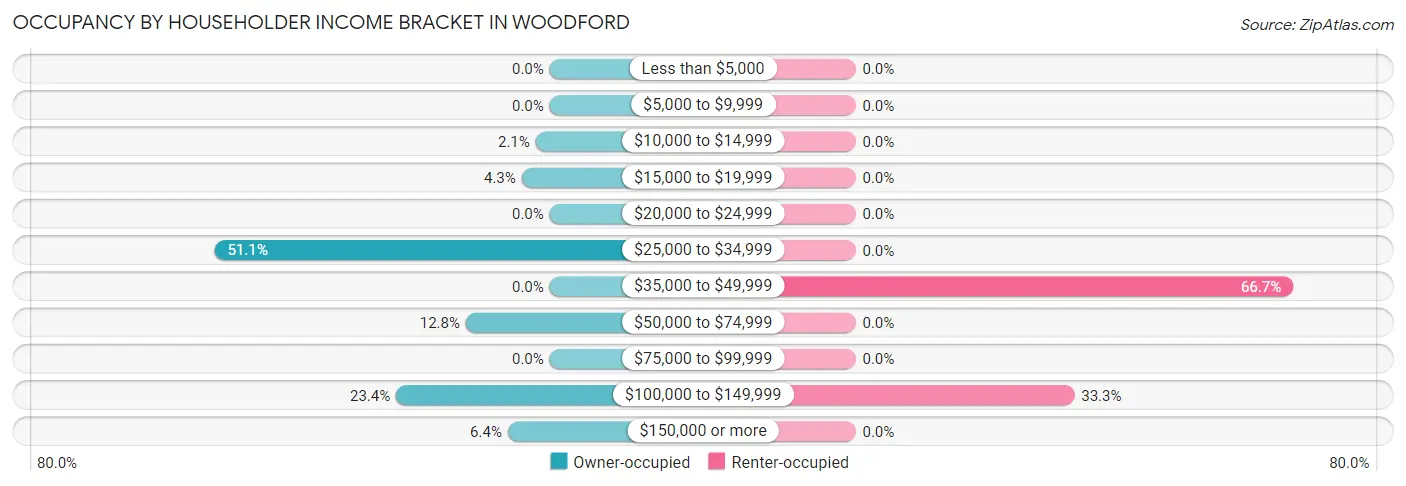
| Income Bracket | Owner-occupied | Renter-occupied |
| Less than $5,000 | 0 (0.0%) | 0 (0.0%) |
| $5,000 to $9,999 | 0 (0.0%) | 0 (0.0%) |
| $10,000 to $14,999 | 1 (2.1%) | 0 (0.0%) |
| $15,000 to $19,999 | 2 (4.3%) | 0 (0.0%) |
| $20,000 to $24,999 | 0 (0.0%) | 0 (0.0%) |
| $25,000 to $34,999 | 24 (51.1%) | 0 (0.0%) |
| $35,000 to $49,999 | 0 (0.0%) | 6 (66.7%) |
| $50,000 to $74,999 | 6 (12.8%) | 0 (0.0%) |
| $75,000 to $99,999 | 0 (0.0%) | 0 (0.0%) |
| $100,000 to $149,999 | 11 (23.4%) | 3 (33.3%) |
| $150,000 or more | 3 (6.4%) | 0 (0.0%) |
| Total | 47 (100.0%) | 9 (100.0%) |
Monthly Housing Cost Tiers in Woodford
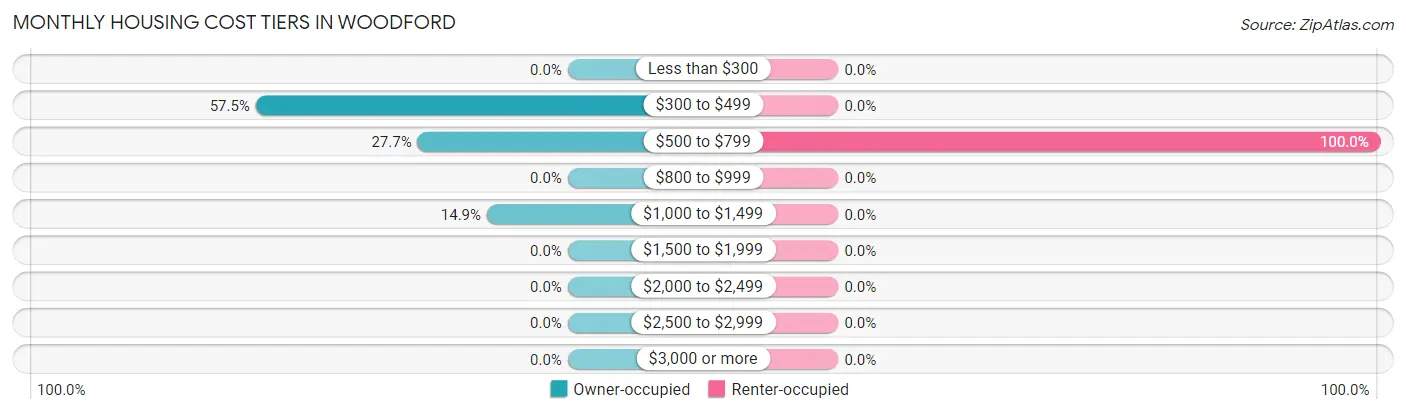
| Monthly Cost | Owner-occupied | Renter-occupied |
| Less than $300 | 0 (0.0%) | 0 (0.0%) |
| $300 to $499 | 27 (57.5%) | 0 (0.0%) |
| $500 to $799 | 13 (27.7%) | 9 (100.0%) |
| $800 to $999 | 0 (0.0%) | 0 (0.0%) |
| $1,000 to $1,499 | 7 (14.9%) | 0 (0.0%) |
| $1,500 to $1,999 | 0 (0.0%) | 0 (0.0%) |
| $2,000 to $2,499 | 0 (0.0%) | 0 (0.0%) |
| $2,500 to $2,999 | 0 (0.0%) | 0 (0.0%) |
| $3,000 or more | 0 (0.0%) | 0 (0.0%) |
| Total | 47 (100.0%) | 9 (100.0%) |
Physical Housing Characteristics in Woodford
Housing Structures in Woodford
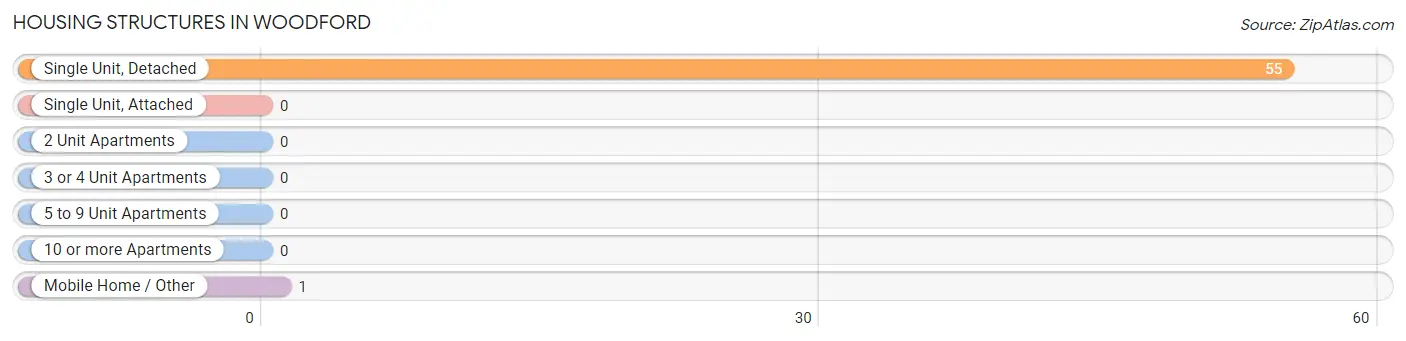
| Structure Type | # Housing Units | % Housing Units |
| Single Unit, Detached | 55 | 98.2% |
| Single Unit, Attached | 0 | 0.0% |
| 2 Unit Apartments | 0 | 0.0% |
| 3 or 4 Unit Apartments | 0 | 0.0% |
| 5 to 9 Unit Apartments | 0 | 0.0% |
| 10 or more Apartments | 0 | 0.0% |
| Mobile Home / Other | 1 | 1.8% |
| Total | 56 | 100.0% |
Housing Structures by Occupancy in Woodford
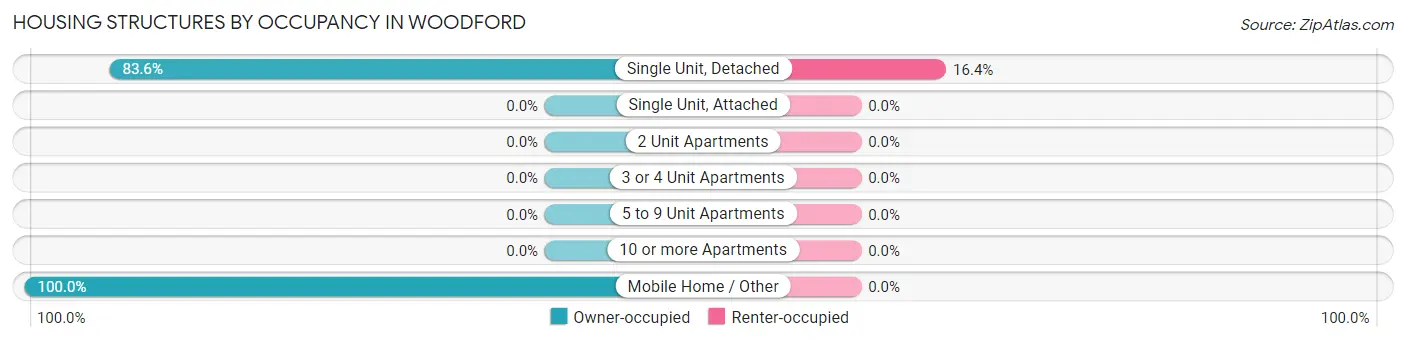
| Structure Type | Owner-occupied | Renter-occupied |
| Single Unit, Detached | 46 (83.6%) | 9 (16.4%) |
| Single Unit, Attached | 0 (0.0%) | 0 (0.0%) |
| 2 Unit Apartments | 0 (0.0%) | 0 (0.0%) |
| 3 or 4 Unit Apartments | 0 (0.0%) | 0 (0.0%) |
| 5 to 9 Unit Apartments | 0 (0.0%) | 0 (0.0%) |
| 10 or more Apartments | 0 (0.0%) | 0 (0.0%) |
| Mobile Home / Other | 1 (100.0%) | 0 (0.0%) |
| Total | 47 (83.9%) | 9 (16.1%) |
Housing Structures by Number of Rooms in Woodford
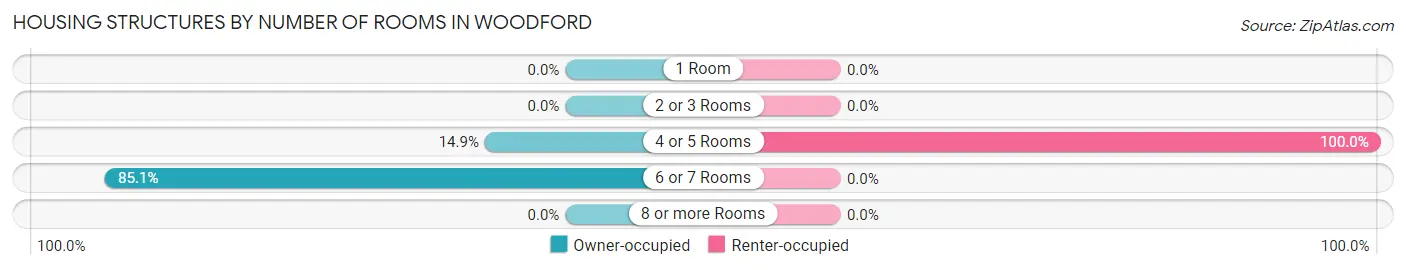
| Number of Rooms | Owner-occupied | Renter-occupied |
| 1 Room | 0 (0.0%) | 0 (0.0%) |
| 2 or 3 Rooms | 0 (0.0%) | 0 (0.0%) |
| 4 or 5 Rooms | 7 (14.9%) | 9 (100.0%) |
| 6 or 7 Rooms | 40 (85.1%) | 0 (0.0%) |
| 8 or more Rooms | 0 (0.0%) | 0 (0.0%) |
| Total | 47 (100.0%) | 9 (100.0%) |
Housing Structure by Heating Type in Woodford
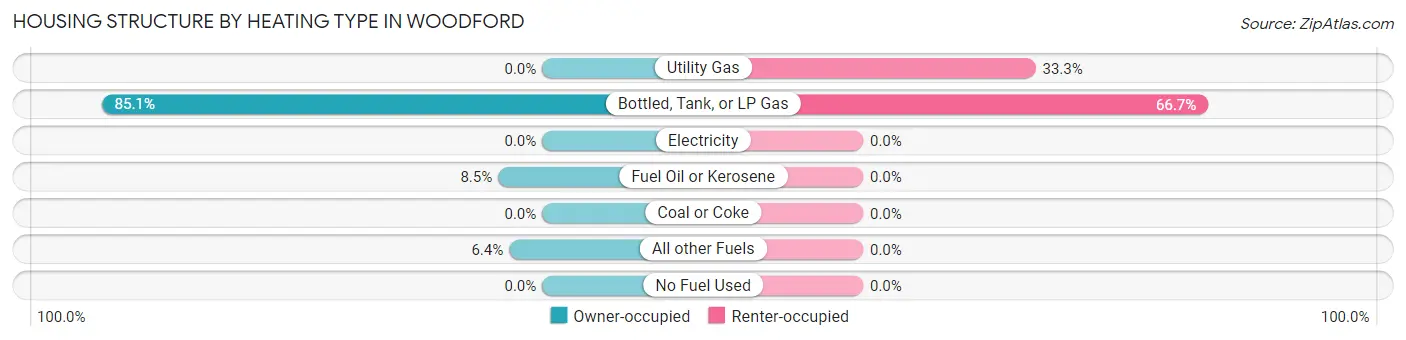
| Heating Type | Owner-occupied | Renter-occupied |
| Utility Gas | 0 (0.0%) | 3 (33.3%) |
| Bottled, Tank, or LP Gas | 40 (85.1%) | 6 (66.7%) |
| Electricity | 0 (0.0%) | 0 (0.0%) |
| Fuel Oil or Kerosene | 4 (8.5%) | 0 (0.0%) |
| Coal or Coke | 0 (0.0%) | 0 (0.0%) |
| All other Fuels | 3 (6.4%) | 0 (0.0%) |
| No Fuel Used | 0 (0.0%) | 0 (0.0%) |
| Total | 47 (100.0%) | 9 (100.0%) |
Household Vehicle Usage in Woodford
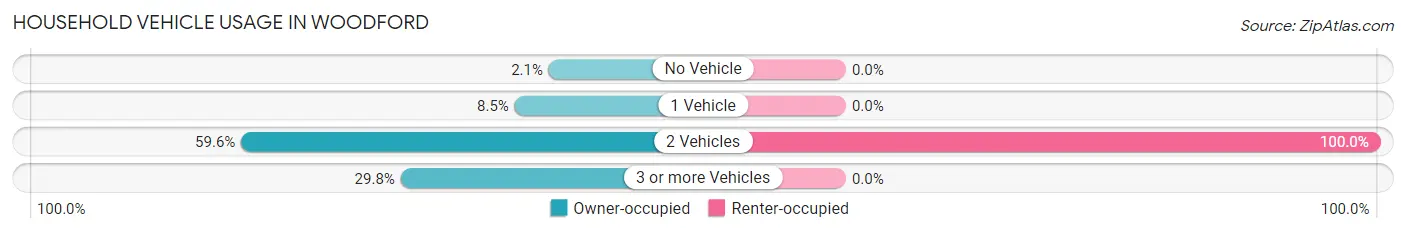
| Vehicles per Household | Owner-occupied | Renter-occupied |
| No Vehicle | 1 (2.1%) | 0 (0.0%) |
| 1 Vehicle | 4 (8.5%) | 0 (0.0%) |
| 2 Vehicles | 28 (59.6%) | 9 (100.0%) |
| 3 or more Vehicles | 14 (29.8%) | 0 (0.0%) |
| Total | 47 (100.0%) | 9 (100.0%) |
Real Estate & Mortgages in Woodford
Real Estate and Mortgage Overview in Woodford
| Characteristic | Without Mortgage | With Mortgage |
| Housing Units | 36 | 11 |
| Median Property Value | $86,300 | $147,500 |
| Median Household Income | $26,563 | $0 |
| Monthly Housing Costs | $463 | $0 |
| Real Estate Taxes | $1,360 | $2 |
Property Value by Mortgage Status in Woodford
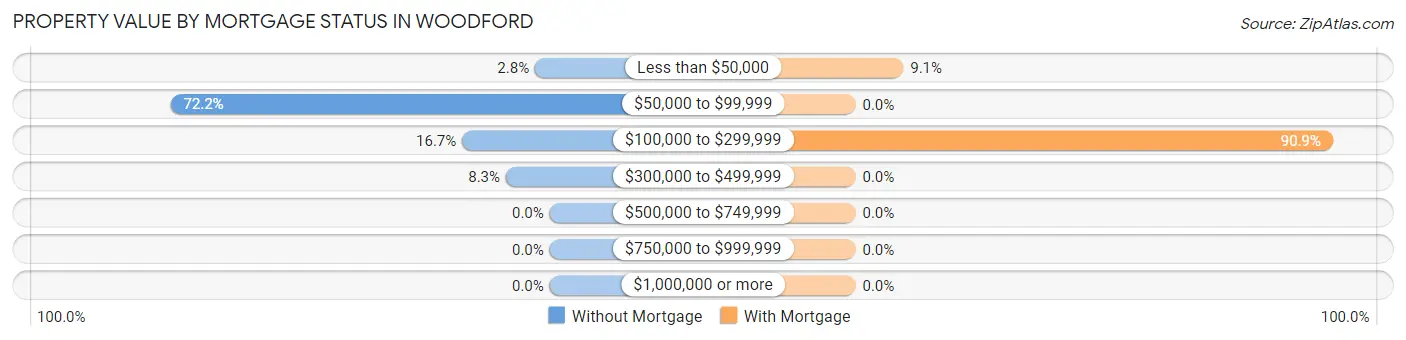
| Property Value | Without Mortgage | With Mortgage |
| Less than $50,000 | 1 (2.8%) | 1 (9.1%) |
| $50,000 to $99,999 | 26 (72.2%) | 0 (0.0%) |
| $100,000 to $299,999 | 6 (16.7%) | 10 (90.9%) |
| $300,000 to $499,999 | 3 (8.3%) | 0 (0.0%) |
| $500,000 to $749,999 | 0 (0.0%) | 0 (0.0%) |
| $750,000 to $999,999 | 0 (0.0%) | 0 (0.0%) |
| $1,000,000 or more | 0 (0.0%) | 0 (0.0%) |
| Total | 36 (100.0%) | 11 (100.0%) |
Household Income by Mortgage Status in Woodford
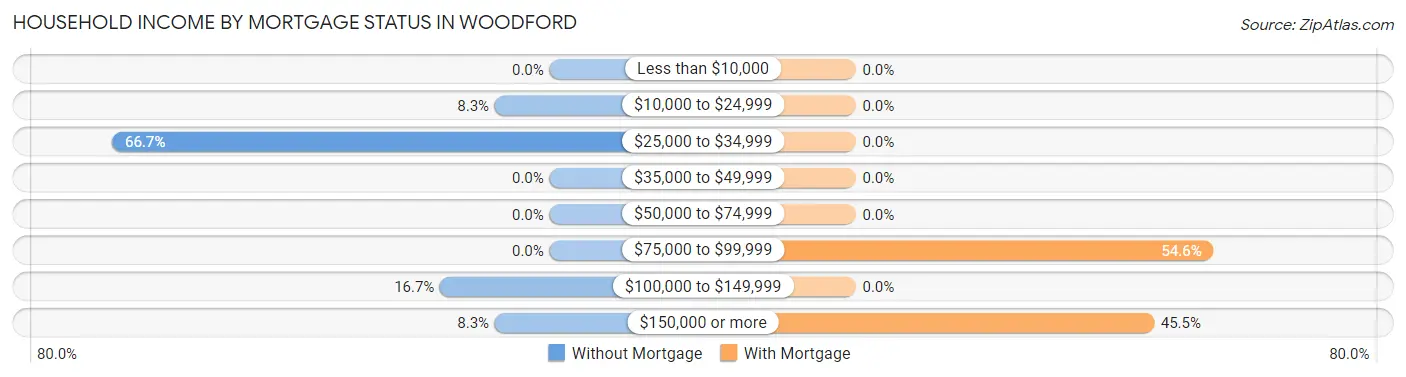
| Household Income | Without Mortgage | With Mortgage |
| Less than $10,000 | 0 (0.0%) | 0 (0.0%) |
| $10,000 to $24,999 | 3 (8.3%) | 0 (0.0%) |
| $25,000 to $34,999 | 24 (66.7%) | 0 (0.0%) |
| $35,000 to $49,999 | 0 (0.0%) | 0 (0.0%) |
| $50,000 to $74,999 | 0 (0.0%) | 0 (0.0%) |
| $75,000 to $99,999 | 0 (0.0%) | 6 (54.5%) |
| $100,000 to $149,999 | 6 (16.7%) | 0 (0.0%) |
| $150,000 or more | 3 (8.3%) | 5 (45.5%) |
| Total | 36 (100.0%) | 11 (100.0%) |
Property Value to Household Income Ratio in Woodford
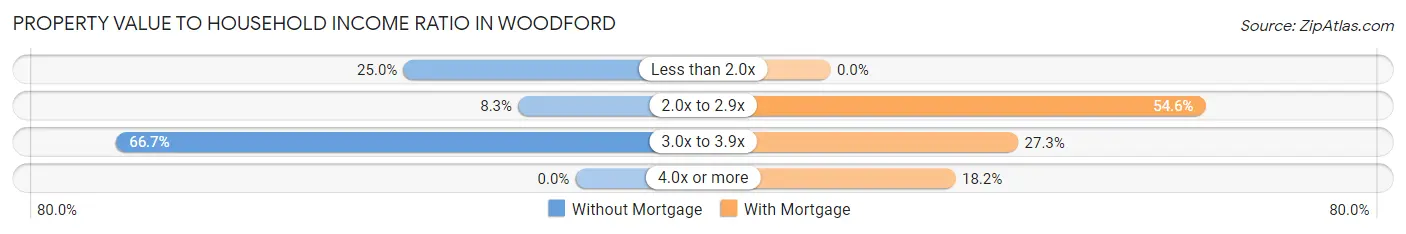
| Value-to-Income Ratio | Without Mortgage | With Mortgage |
| Less than 2.0x | 9 (25.0%) | 0 (0.0%) |
| 2.0x to 2.9x | 3 (8.3%) | 6 (54.5%) |
| 3.0x to 3.9x | 24 (66.7%) | 3 (27.3%) |
| 4.0x or more | 0 (0.0%) | 2 (18.2%) |
| Total | 36 (100.0%) | 11 (100.0%) |
Real Estate Taxes by Mortgage Status in Woodford
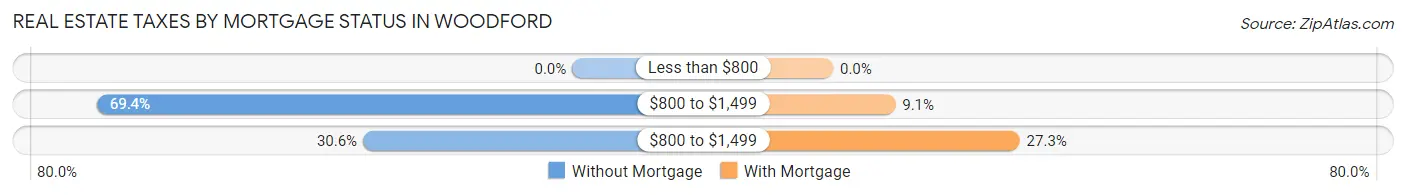
| Property Taxes | Without Mortgage | With Mortgage |
| Less than $800 | 0 (0.0%) | 0 (0.0%) |
| $800 to $1,499 | 25 (69.4%) | 1 (9.1%) |
| $800 to $1,499 | 11 (30.6%) | 3 (27.3%) |
| Total | 36 (100.0%) | 11 (100.0%) |
Health & Disability in Woodford
Health Insurance Coverage by Age in Woodford
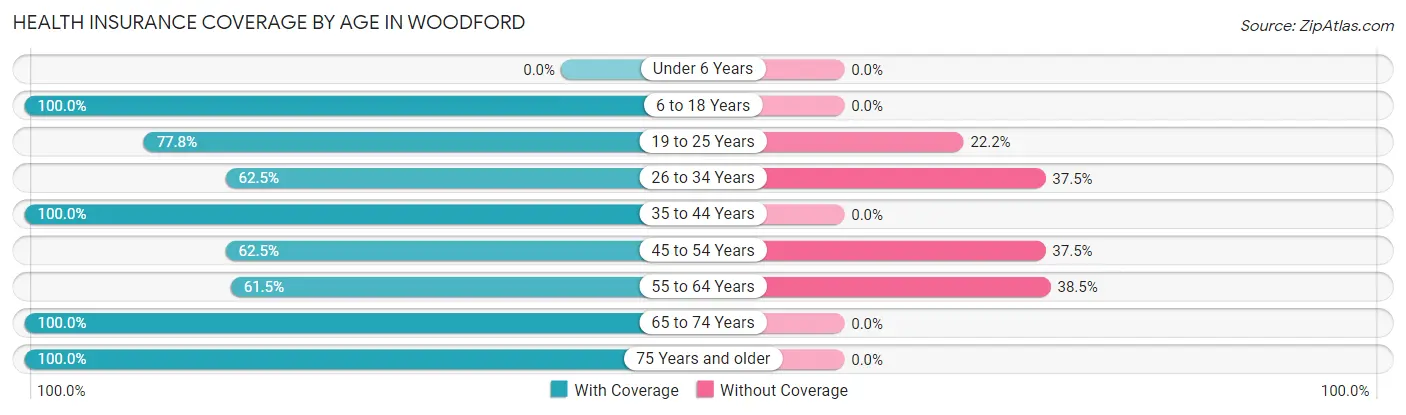
| Age Bracket | With Coverage | Without Coverage |
| Under 6 Years | 0 (0.0%) | 0 (0.0%) |
| 6 to 18 Years | 4 (100.0%) | 0 (0.0%) |
| 19 to 25 Years | 21 (77.8%) | 6 (22.2%) |
| 26 to 34 Years | 10 (62.5%) | 6 (37.5%) |
| 35 to 44 Years | 3 (100.0%) | 0 (0.0%) |
| 45 to 54 Years | 5 (62.5%) | 3 (37.5%) |
| 55 to 64 Years | 8 (61.5%) | 5 (38.5%) |
| 65 to 74 Years | 25 (100.0%) | 0 (0.0%) |
| 75 Years and older | 3 (100.0%) | 0 (0.0%) |
| Total | 79 (79.8%) | 20 (20.2%) |
Health Insurance Coverage by Citizenship Status in Woodford
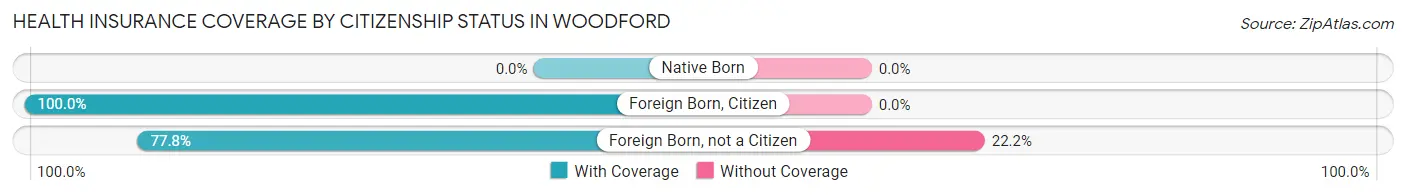
| Citizenship Status | With Coverage | Without Coverage |
| Native Born | 0 (0.0%) | 0 (0.0%) |
| Foreign Born, Citizen | 4 (100.0%) | 0 (0.0%) |
| Foreign Born, not a Citizen | 21 (77.8%) | 6 (22.2%) |
Health Insurance Coverage by Household Income in Woodford
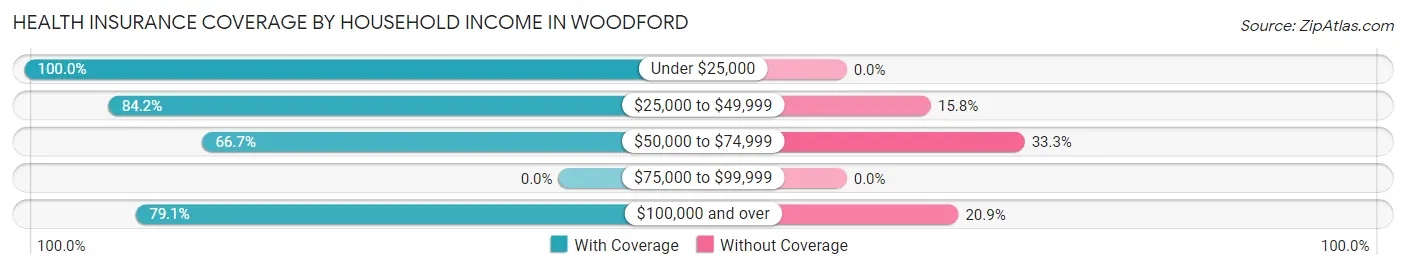
| Household Income | With Coverage | Without Coverage |
| Under $25,000 | 3 (100.0%) | 0 (0.0%) |
| $25,000 to $49,999 | 32 (84.2%) | 6 (15.8%) |
| $50,000 to $74,999 | 10 (66.7%) | 5 (33.3%) |
| $75,000 to $99,999 | 0 (0.0%) | 0 (0.0%) |
| $100,000 and over | 34 (79.1%) | 9 (20.9%) |
Public vs Private Health Insurance Coverage by Age in Woodford
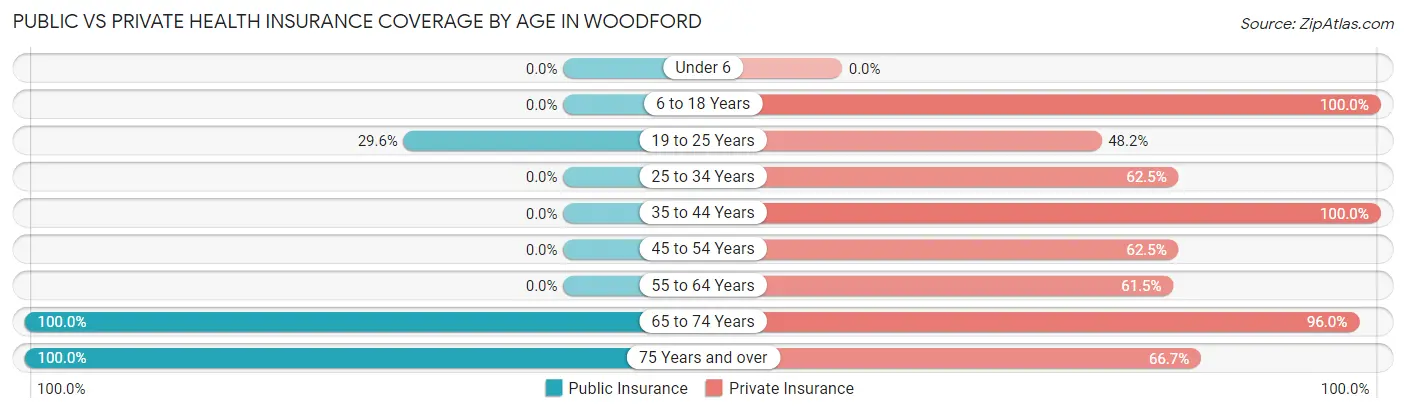
| Age Bracket | Public Insurance | Private Insurance |
| Under 6 | 0 (0.0%) | 0 (0.0%) |
| 6 to 18 Years | 0 (0.0%) | 4 (100.0%) |
| 19 to 25 Years | 8 (29.6%) | 13 (48.1%) |
| 25 to 34 Years | 0 (0.0%) | 10 (62.5%) |
| 35 to 44 Years | 0 (0.0%) | 3 (100.0%) |
| 45 to 54 Years | 0 (0.0%) | 5 (62.5%) |
| 55 to 64 Years | 0 (0.0%) | 8 (61.5%) |
| 65 to 74 Years | 25 (100.0%) | 24 (96.0%) |
| 75 Years and over | 3 (100.0%) | 2 (66.7%) |
| Total | 36 (36.4%) | 69 (69.7%) |
Disability Status by Sex by Age in Woodford
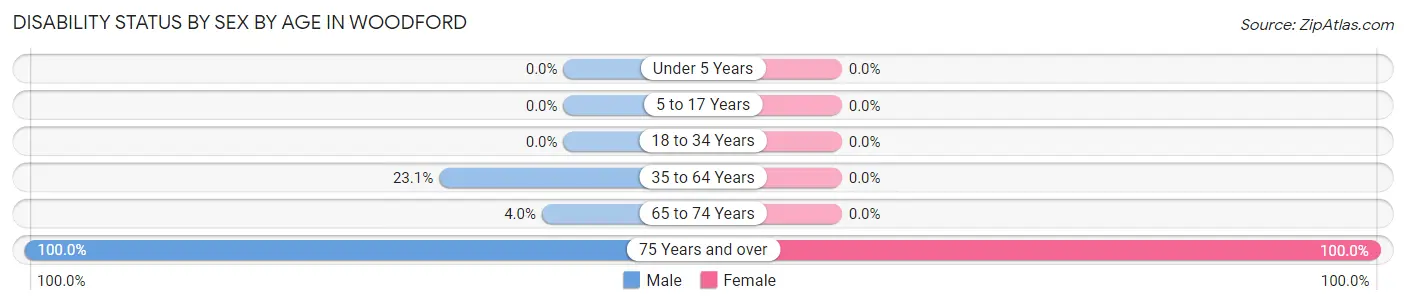
| Age Bracket | Male | Female |
| Under 5 Years | 0 (0.0%) | 0 (0.0%) |
| 5 to 17 Years | 0 (0.0%) | 0 (0.0%) |
| 18 to 34 Years | 0 (0.0%) | 0 (0.0%) |
| 35 to 64 Years | 3 (23.1%) | 0 (0.0%) |
| 65 to 74 Years | 1 (4.0%) | 0 (0.0%) |
| 75 Years and over | 2 (100.0%) | 1 (100.0%) |
Disability Class by Sex by Age in Woodford
Disability Class: Hearing Difficulty
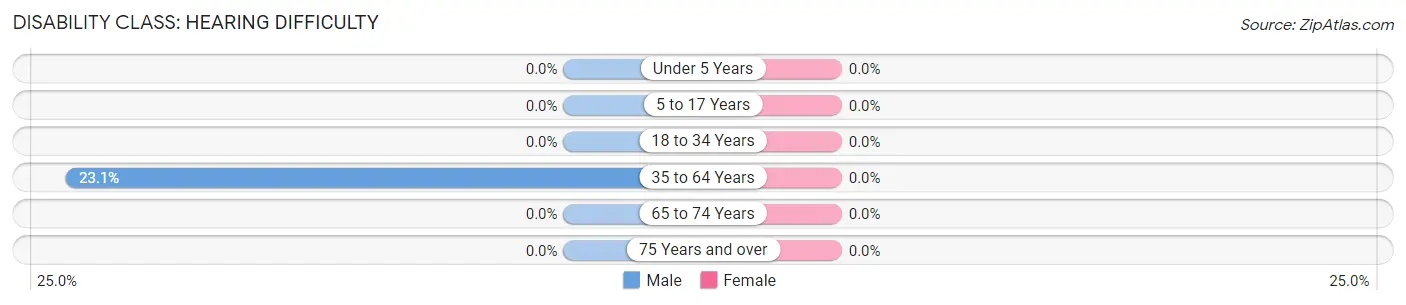
| Age Bracket | Male | Female |
| Under 5 Years | 0 (0.0%) | 0 (0.0%) |
| 5 to 17 Years | 0 (0.0%) | 0 (0.0%) |
| 18 to 34 Years | 0 (0.0%) | 0 (0.0%) |
| 35 to 64 Years | 3 (23.1%) | 0 (0.0%) |
| 65 to 74 Years | 0 (0.0%) | 0 (0.0%) |
| 75 Years and over | 0 (0.0%) | 0 (0.0%) |
Disability Class: Vision Difficulty
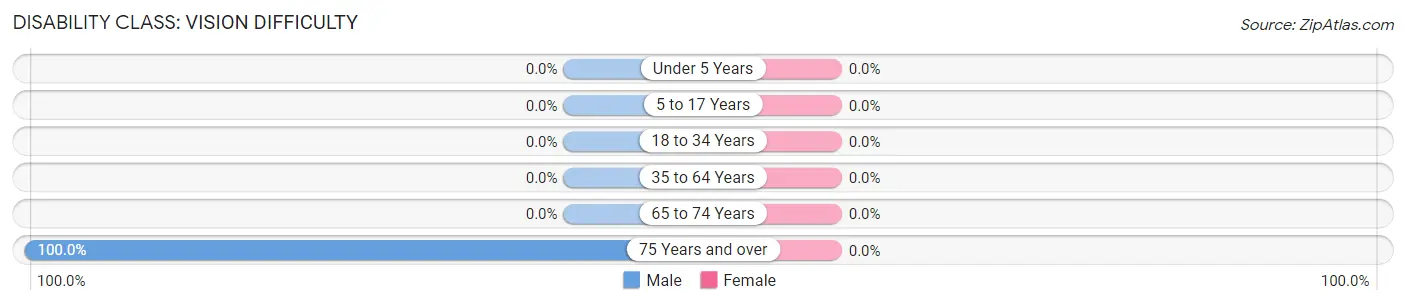
| Age Bracket | Male | Female |
| Under 5 Years | 0 (0.0%) | 0 (0.0%) |
| 5 to 17 Years | 0 (0.0%) | 0 (0.0%) |
| 18 to 34 Years | 0 (0.0%) | 0 (0.0%) |
| 35 to 64 Years | 0 (0.0%) | 0 (0.0%) |
| 65 to 74 Years | 0 (0.0%) | 0 (0.0%) |
| 75 Years and over | 2 (100.0%) | 0 (0.0%) |
Disability Class: Cognitive Difficulty
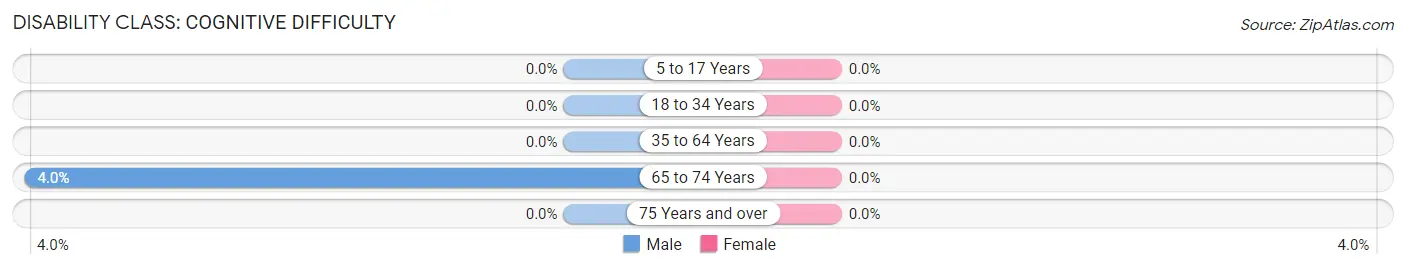
| Age Bracket | Male | Female |
| 5 to 17 Years | 0 (0.0%) | 0 (0.0%) |
| 18 to 34 Years | 0 (0.0%) | 0 (0.0%) |
| 35 to 64 Years | 0 (0.0%) | 0 (0.0%) |
| 65 to 74 Years | 1 (4.0%) | 0 (0.0%) |
| 75 Years and over | 0 (0.0%) | 0 (0.0%) |
Disability Class: Ambulatory Difficulty
| Age Bracket | Male | Female |
| 5 to 17 Years | 0 (0.0%) | 0 (0.0%) |
| 18 to 34 Years | 0 (0.0%) | 0 (0.0%) |
| 35 to 64 Years | 0 (0.0%) | 0 (0.0%) |
| 65 to 74 Years | 0 (0.0%) | 0 (0.0%) |
| 75 Years and over | 0 (0.0%) | 0 (0.0%) |
Disability Class: Self-Care Difficulty
| Age Bracket | Male | Female |
| 5 to 17 Years | 0 (0.0%) | 0 (0.0%) |
| 18 to 34 Years | 0 (0.0%) | 0 (0.0%) |
| 35 to 64 Years | 0 (0.0%) | 0 (0.0%) |
| 65 to 74 Years | 0 (0.0%) | 0 (0.0%) |
| 75 Years and over | 0 (0.0%) | 0 (0.0%) |
Technology Access in Woodford
Computing Device Access in Woodford
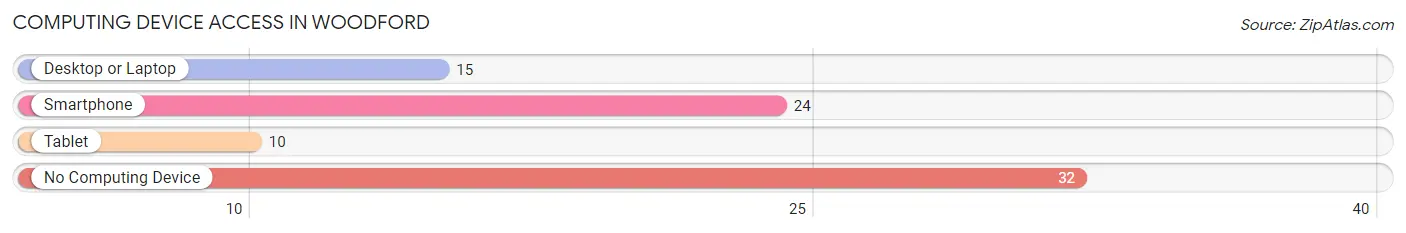
| Device Type | # Households | % Households |
| Desktop or Laptop | 15 | 26.8% |
| Smartphone | 24 | 42.9% |
| Tablet | 10 | 17.9% |
| No Computing Device | 32 | 57.1% |
| Total | 56 | 100.0% |
Internet Access in Woodford
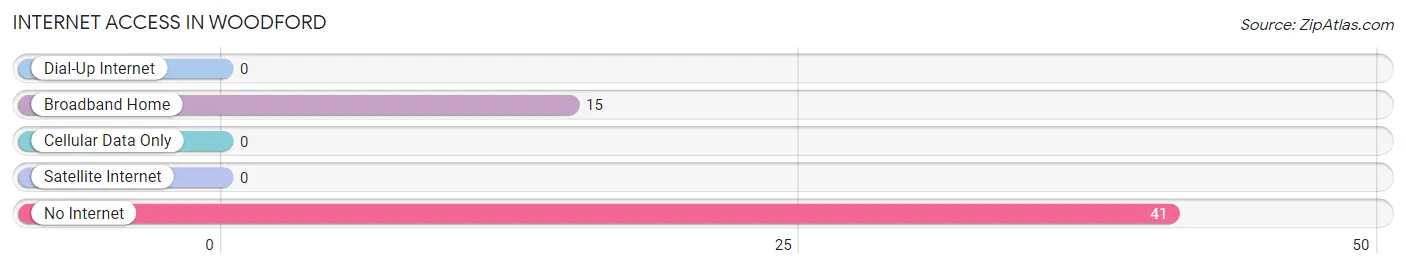
| Internet Type | # Households | % Households |
| Dial-Up Internet | 0 | 0.0% |
| Broadband Home | 15 | 26.8% |
| Cellular Data Only | 0 | 0.0% |
| Satellite Internet | 0 | 0.0% |
| No Internet | 41 | 73.2% |
| Total | 56 | 100.0% |
Woodford Summary
Woodford, Wisconsin is a small town located in the southwestern corner of the state, in Vernon County. It is situated on the banks of the Mississippi River, and is bordered by the towns of Genoa, Stoddard, and Coon Valley. The population of Woodford was estimated to be 1,072 in 2019.
History
Woodford was first settled in 1851 by a group of settlers from New York. The town was named after the Woodford family, who were among the first settlers. The town was officially incorporated in 1856.
In the late 19th century, Woodford was a thriving agricultural community. The town was home to several sawmills, a grist mill, and a cheese factory. The town also had a hotel, a general store, and a post office.
In the early 20th century, the town began to decline as the population shifted to larger cities. The sawmills and grist mill closed, and the cheese factory moved to a larger town. The hotel and general store also closed.
Geography
Woodford is located in the southwestern corner of Wisconsin, in Vernon County. It is situated on the banks of the Mississippi River, and is bordered by the towns of Genoa, Stoddard, and Coon Valley. The town is located in the Driftless Area, a region of Wisconsin that was not glaciated during the last ice age.
The town is located in a hilly region, with elevations ranging from 600 to 800 feet above sea level. The town is located in a temperate climate, with average temperatures ranging from the low 30s in the winter to the mid-80s in the summer.
Economy
Woodford is a small, rural town with a limited economy. The town is home to several small businesses, including a grocery store, a hardware store, and a restaurant. The town also has a few small manufacturing businesses.
The town is also home to several farms, which produce a variety of crops, including corn, soybeans, and hay. The town is also home to several wineries, which produce a variety of wines.
Demographics
As of 2019, the population of Woodford was estimated to be 1,072. The town is predominantly white, with 95.3% of the population identifying as white. The town also has a small Hispanic population, with 4.7% of the population identifying as Hispanic or Latino.
The median household income in Woodford is $45,938, and the median home value is $128,400. The town has a poverty rate of 11.2%, which is slightly higher than the state average of 10.7%.
Conclusion
Woodford, Wisconsin is a small town located in the southwestern corner of the state, in Vernon County. It is situated on the banks of the Mississippi River, and is bordered by the towns of Genoa, Stoddard, and Coon Valley. The population of Woodford was estimated to be 1,072 in 2019. The town is predominantly white, with 95.3% of the population identifying as white. The town has a limited economy, with several small businesses, farms, and wineries. The median household income in Woodford is $45,938, and the median home value is $128,400. The town has a poverty rate of 11.2%, which is slightly higher than the state average of 10.7%.
Common Questions
What is Per Capita Income in Woodford?
Per Capita income in Woodford is $38,294.
What is the Median Family Income in Woodford?
Median Family Income in Woodford is $135,568.
What is Inequality or Gini Index in Woodford?
Inequality or Gini Index in Woodford is 0.43.
What is the Total Population of Woodford?
Total Population of Woodford is 99.
What is the Total Male Population of Woodford?
Total Male Population of Woodford is 65.
What is the Total Female Population of Woodford?
Total Female Population of Woodford is 34.
What is the Ratio of Males per 100 Females in Woodford?
There are 191.18 Males per 100 Females in Woodford.
What is the Ratio of Females per 100 Males in Woodford?
There are 52.31 Females per 100 Males in Woodford.
What is the Median Population Age in Woodford?
Median Population Age in Woodford is 41.8 Years.
What is the Average Family Size in Woodford
Average Family Size in Woodford is 2.9 People.
What is the Average Household Size in Woodford
Average Household Size in Woodford is 1.8 People.
How Large is the Labor Force in Woodford?
There are 58 People in the Labor Forcein in Woodford.
What is the Percentage of People in the Labor Force in Woodford?
61.1% of People are in the Labor Force in Woodford.