Lake Camelot, WI Map & Demographics
Lake Camelot Map
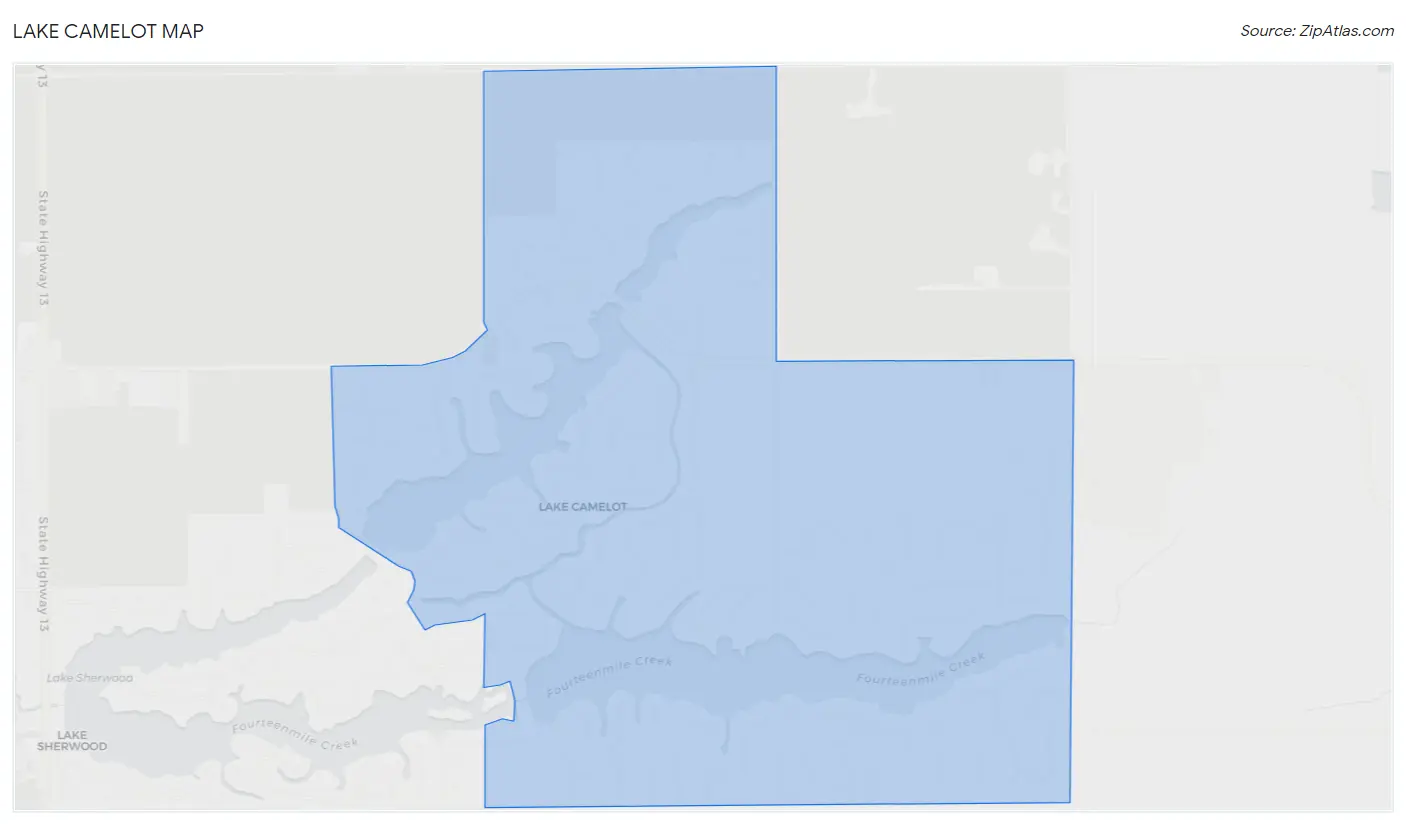
Lake Camelot Overview
$49,437
PER CAPITA INCOME
$106,071
AVG FAMILY INCOME
$92,463
AVG HOUSEHOLD INCOME
2.1%
WAGE / INCOME GAP [ % ]
97.9¢/ $1
WAGE / INCOME GAP [ $ ]
0.33
INEQUALITY / GINI INDEX
1,148
TOTAL POPULATION
553
MALE POPULATION
595
FEMALE POPULATION
92.94
MALES / 100 FEMALES
107.59
FEMALES / 100 MALES
63.9
MEDIAN AGE
2.2
AVG FAMILY SIZE
1.9
AVG HOUSEHOLD SIZE
378
LABOR FORCE [ PEOPLE ]
35.9%
PERCENT IN LABOR FORCE
Income in Lake Camelot
Income Overview in Lake Camelot
Per Capita Income in Lake Camelot is $49,437, while median incomes of families and households are $106,071 and $92,463 respectively.
| Characteristic | Number | Measure |
| Per Capita Income | 1,148 | $49,437 |
| Median Family Income | 444 | $106,071 |
| Mean Family Income | 444 | $106,820 |
| Median Household Income | 597 | $92,463 |
| Mean Household Income | 597 | $95,819 |
| Income Deficit | 444 | $0 |
| Wage / Income Gap (%) | 1,148 | 2.06% |
| Wage / Income Gap ($) | 1,148 | 97.94¢ per $1 |
| Gini / Inequality Index | 1,148 | 0.33 |
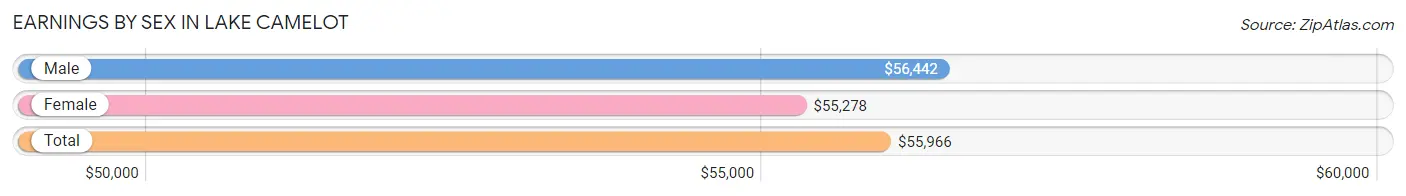
Earnings by Sex in Lake Camelot
Average Earnings in Lake Camelot are $55,966, $56,442 for men and $55,278 for women, a difference of 2.1%.
| Sex | Number | Average Earnings |
| Male | 201 (46.4%) | $56,442 |
| Female | 232 (53.6%) | $55,278 |
| Total | 433 (100.0%) | $55,966 |
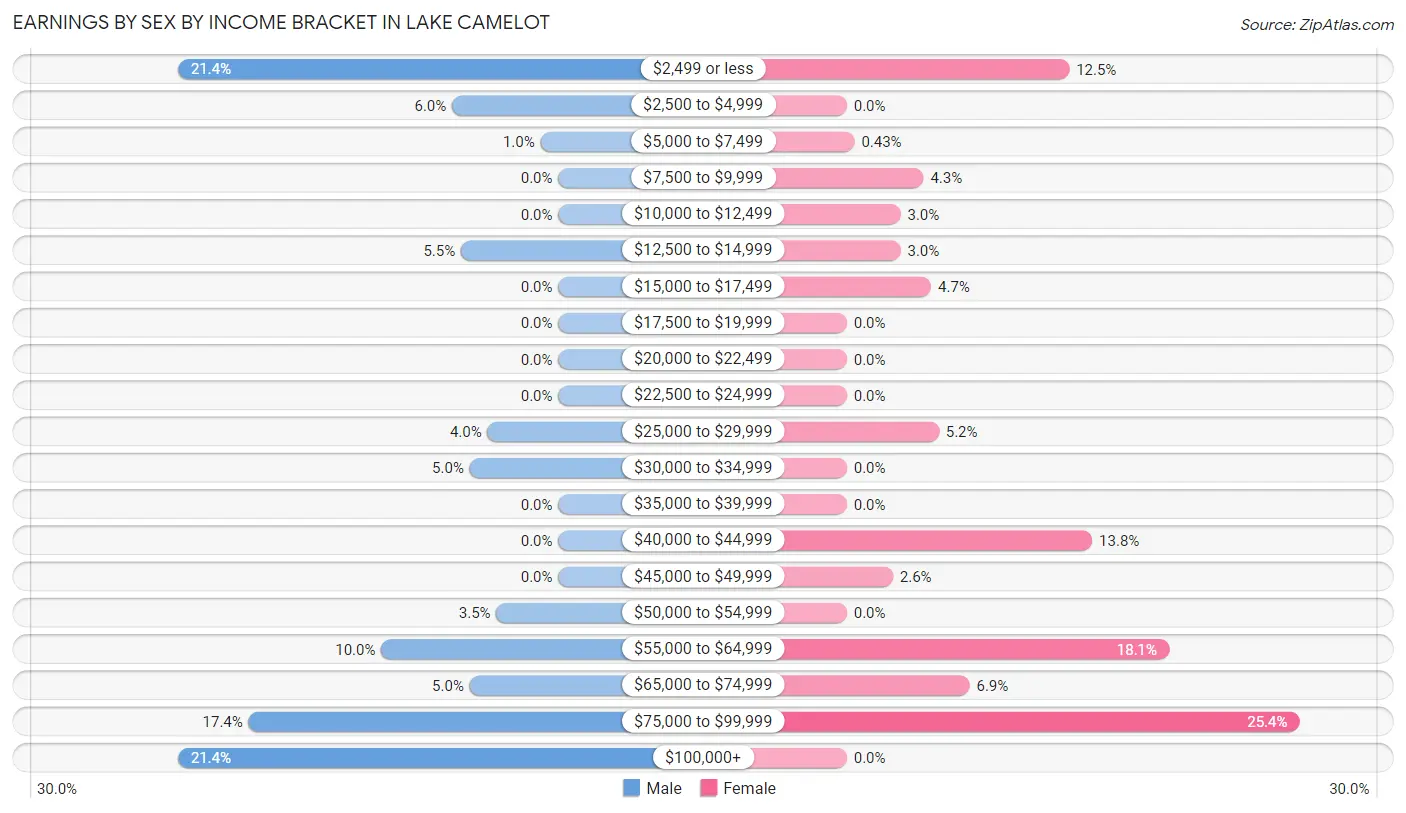
Earnings by Sex by Income Bracket in Lake Camelot
The most common earnings brackets in Lake Camelot are $2,499 or less for men (43 | 21.4%) and $75,000 to $99,999 for women (59 | 25.4%).
| Income | Male | Female |
| $2,499 or less | 43 (21.4%) | 29 (12.5%) |
| $2,500 to $4,999 | 12 (6.0%) | 0 (0.0%) |
| $5,000 to $7,499 | 2 (1.0%) | 1 (0.4%) |
| $7,500 to $9,999 | 0 (0.0%) | 10 (4.3%) |
| $10,000 to $12,499 | 0 (0.0%) | 7 (3.0%) |
| $12,500 to $14,999 | 11 (5.5%) | 7 (3.0%) |
| $15,000 to $17,499 | 0 (0.0%) | 11 (4.7%) |
| $17,500 to $19,999 | 0 (0.0%) | 0 (0.0%) |
| $20,000 to $22,499 | 0 (0.0%) | 0 (0.0%) |
| $22,500 to $24,999 | 0 (0.0%) | 0 (0.0%) |
| $25,000 to $29,999 | 8 (4.0%) | 12 (5.2%) |
| $30,000 to $34,999 | 10 (5.0%) | 0 (0.0%) |
| $35,000 to $39,999 | 0 (0.0%) | 0 (0.0%) |
| $40,000 to $44,999 | 0 (0.0%) | 32 (13.8%) |
| $45,000 to $49,999 | 0 (0.0%) | 6 (2.6%) |
| $50,000 to $54,999 | 7 (3.5%) | 0 (0.0%) |
| $55,000 to $64,999 | 20 (10.0%) | 42 (18.1%) |
| $65,000 to $74,999 | 10 (5.0%) | 16 (6.9%) |
| $75,000 to $99,999 | 35 (17.4%) | 59 (25.4%) |
| $100,000+ | 43 (21.4%) | 0 (0.0%) |
| Total | 201 (100.0%) | 232 (100.0%) |
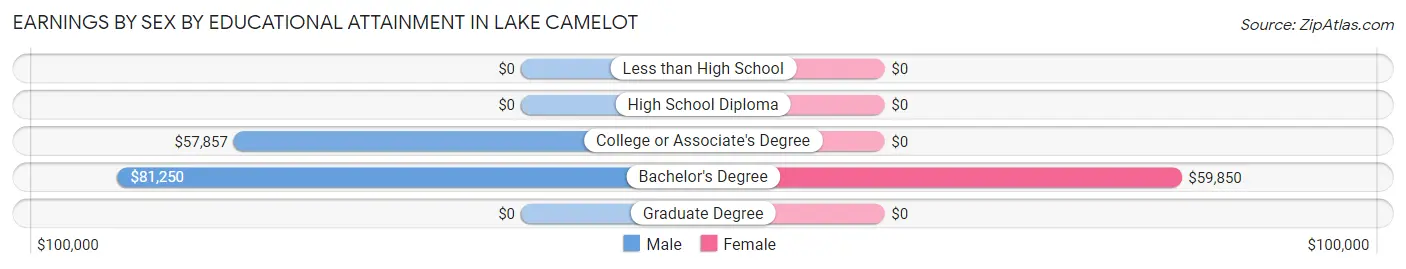
Earnings by Sex by Educational Attainment in Lake Camelot
Average earnings in Lake Camelot are $71,500 for men and $56,944 for women, a difference of 20.4%. Men with an educational attainment of bachelor's degree enjoy the highest average annual earnings of $81,250, while those with college or associate's degree education earn the least with $57,857. Women with an educational attainment of bachelor's degree earn the most with the average annual earnings of $59,850, while those with bachelor's degree education have the smallest earnings of $59,850.
| Educational Attainment | Male Income | Female Income |
| Less than High School | - | - |
| High School Diploma | - | - |
| College or Associate's Degree | $57,857 | $0 |
| Bachelor's Degree | $81,250 | $59,850 |
| Graduate Degree | - | - |
| Total | $71,500 | $56,944 |
Family Income in Lake Camelot
Family Income Brackets in Lake Camelot
According to the Lake Camelot family income data, there are 161 families falling into the $100,000 to $149,999 income range, which is the most common income bracket and makes up 36.3% of all families.
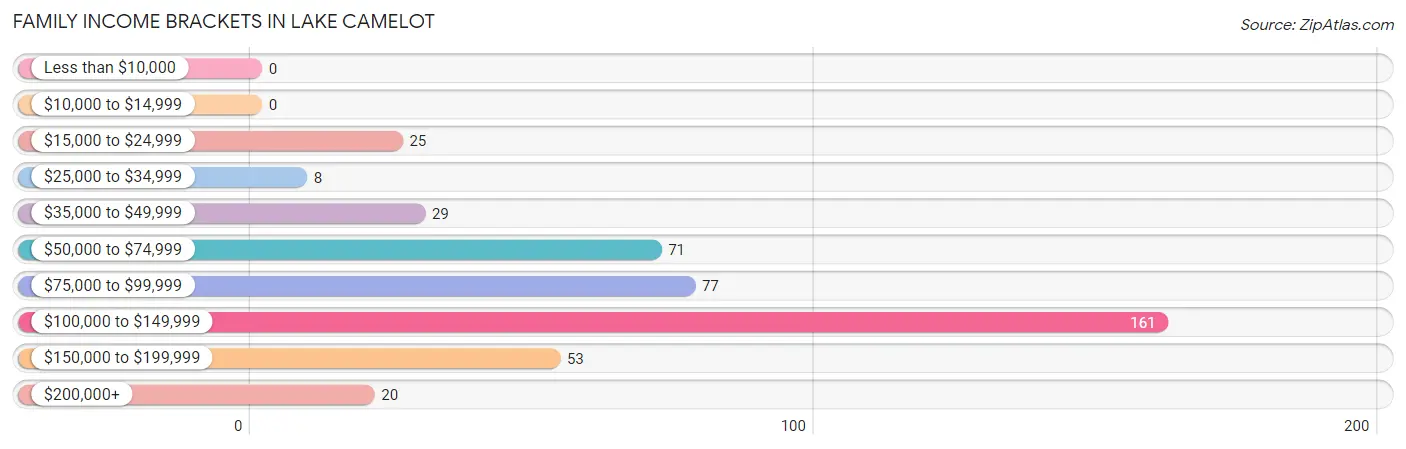
| Income Bracket | # Families | % Families |
| Less than $10,000 | 0 | 0.0% |
| $10,000 to $14,999 | 0 | 0.0% |
| $15,000 to $24,999 | 25 | 5.6% |
| $25,000 to $34,999 | 8 | 1.8% |
| $35,000 to $49,999 | 29 | 6.5% |
| $50,000 to $74,999 | 71 | 16.0% |
| $75,000 to $99,999 | 77 | 17.3% |
| $100,000 to $149,999 | 161 | 36.3% |
| $150,000 to $199,999 | 53 | 11.9% |
| $200,000+ | 20 | 4.5% |
Family Income by Famaliy Size in Lake Camelot
4-person families (24 | 5.4%) account for the highest median family income in Lake Camelot with $169,063 per family, while 2-person families (404 | 91.0%) have the highest median income of $51,806 per family member.
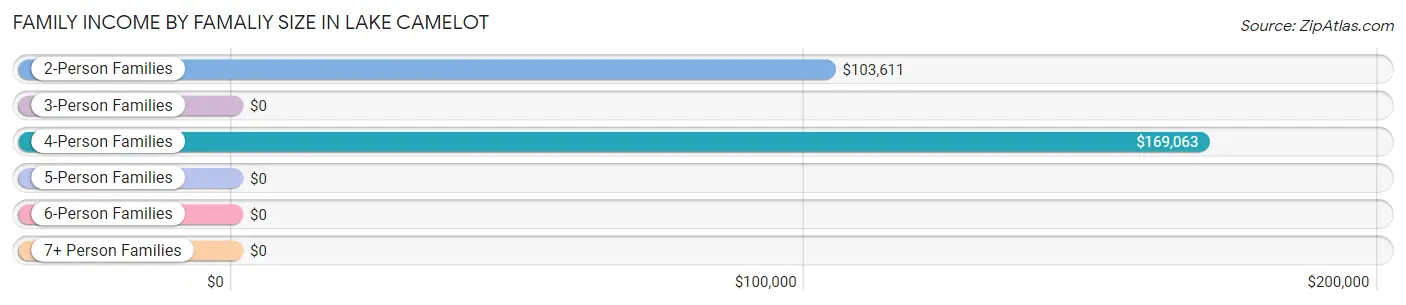
| Income Bracket | # Families | Median Income |
| 2-Person Families | 404 (91.0%) | $103,611 |
| 3-Person Families | 12 (2.7%) | $0 |
| 4-Person Families | 24 (5.4%) | $169,063 |
| 5-Person Families | 0 (0.0%) | $0 |
| 6-Person Families | 4 (0.9%) | $0 |
| 7+ Person Families | 0 (0.0%) | $0 |
| Total | 444 (100.0%) | $106,071 |
Family Income by Number of Earners in Lake Camelot
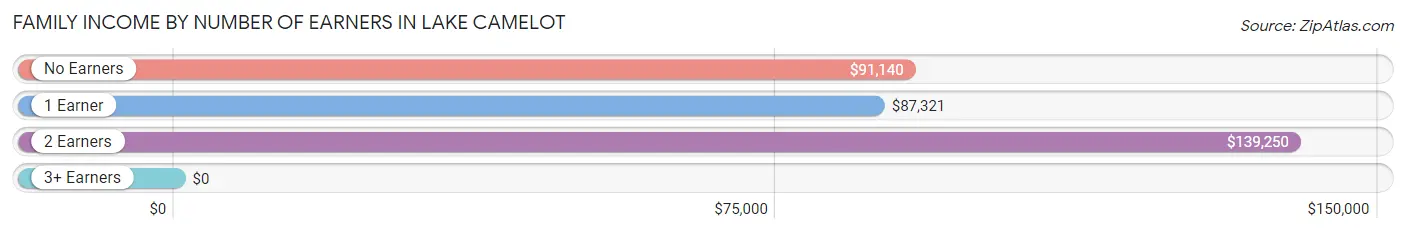
| Number of Earners | # Families | Median Income |
| No Earners | 235 (52.9%) | $91,140 |
| 1 Earner | 101 (22.8%) | $87,321 |
| 2 Earners | 95 (21.4%) | $139,250 |
| 3+ Earners | 13 (2.9%) | $0 |
| Total | 444 (100.0%) | $106,071 |
Household Income in Lake Camelot
Household Income Brackets in Lake Camelot
With 211 households falling in the category, the $100,000 to $149,999 income range is the most frequent in Lake Camelot, accounting for 35.3% of all households. In contrast, only 9 households (1.5%) fall into the less than $10,000 income bracket, making it the least populous group.
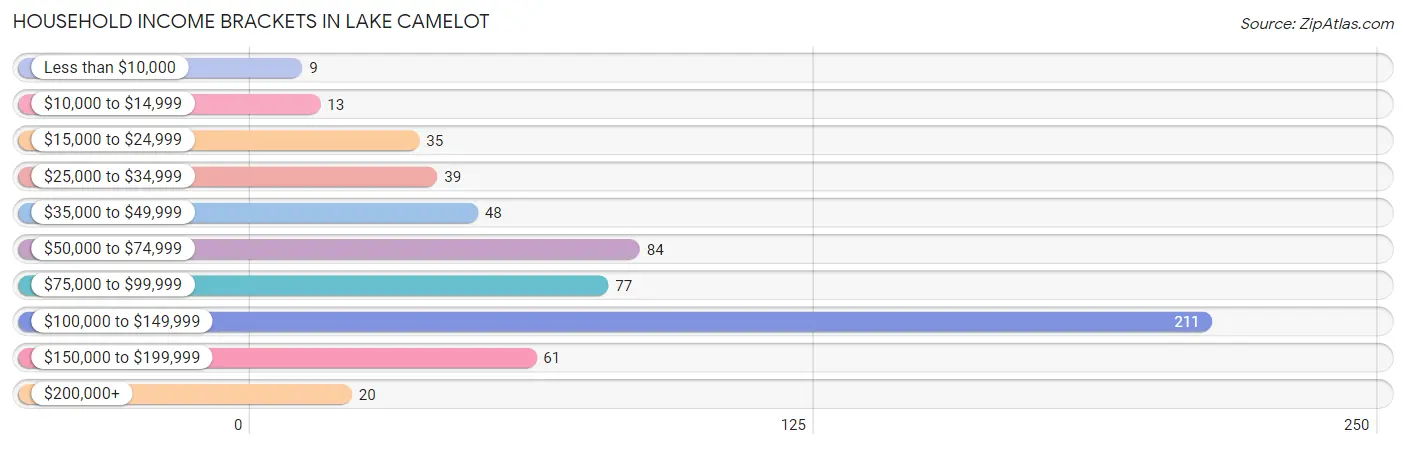
| Income Bracket | # Households | % Households |
| Less than $10,000 | 9 | 1.5% |
| $10,000 to $14,999 | 13 | 2.2% |
| $15,000 to $24,999 | 35 | 5.9% |
| $25,000 to $34,999 | 39 | 6.5% |
| $35,000 to $49,999 | 48 | 8.0% |
| $50,000 to $74,999 | 84 | 14.1% |
| $75,000 to $99,999 | 77 | 12.9% |
| $100,000 to $149,999 | 211 | 35.3% |
| $150,000 to $199,999 | 61 | 10.2% |
| $200,000+ | 20 | 3.4% |
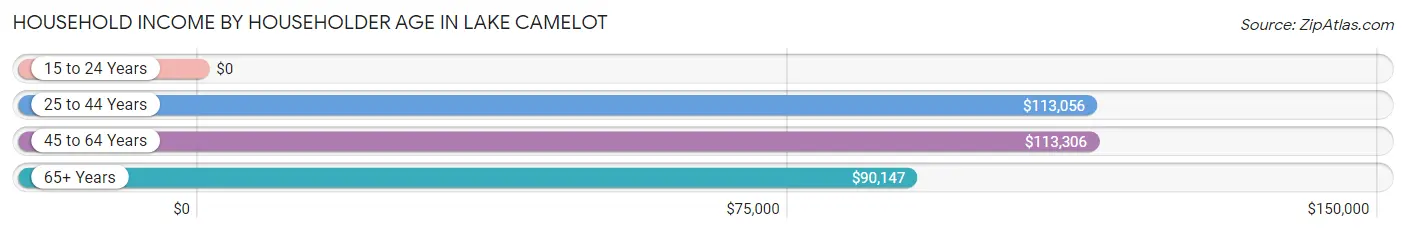
Household Income by Householder Age in Lake Camelot
The median household income in Lake Camelot is $92,463, with the highest median household income of $113,306 found in the 45 to 64 years age bracket for the primary householder. A total of 178 households (29.8%) fall into this category. Meanwhile, the 15 to 24 years age bracket for the primary householder has the lowest median household income of $0, with 25 households (4.2%) in this group.
| Income Bracket | # Households | Median Income |
| 15 to 24 Years | 25 (4.2%) | $0 |
| 25 to 44 Years | 46 (7.7%) | $113,056 |
| 45 to 64 Years | 178 (29.8%) | $113,306 |
| 65+ Years | 348 (58.3%) | $90,147 |
| Total | 597 (100.0%) | $92,463 |
Poverty in Lake Camelot
Income Below Poverty by Sex and Age in Lake Camelot
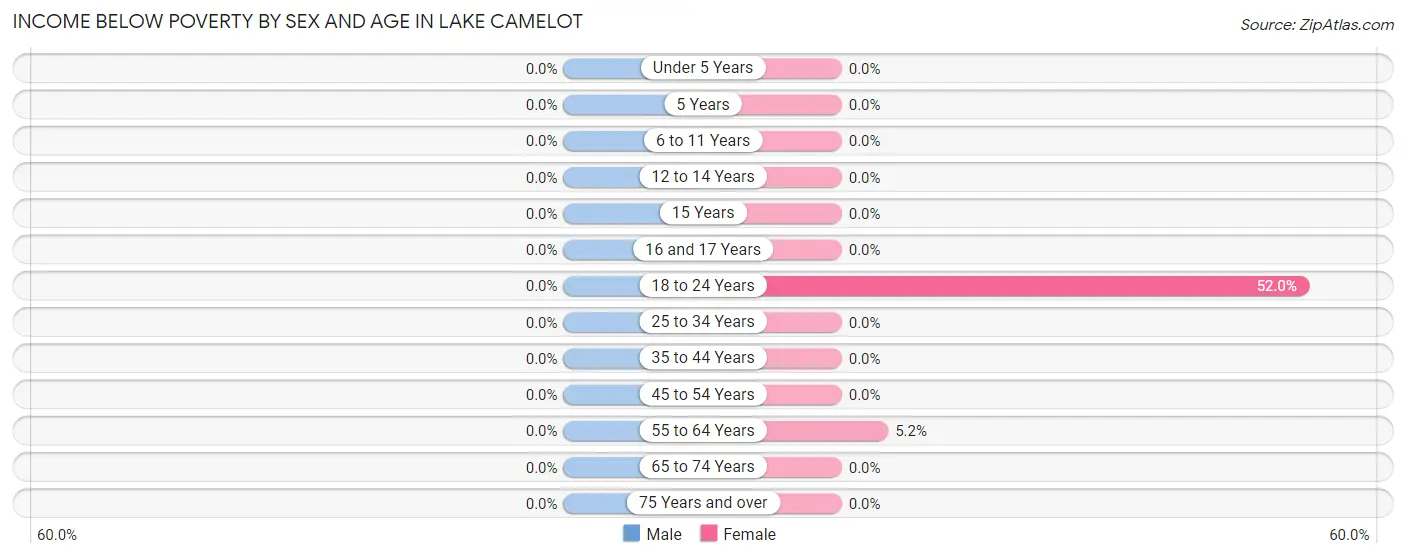
| Age Bracket | Male | Female |
| Under 5 Years | 0 (0.0%) | 0 (0.0%) |
| 5 Years | 0 (0.0%) | 0 (0.0%) |
| 6 to 11 Years | 0 (0.0%) | 0 (0.0%) |
| 12 to 14 Years | 0 (0.0%) | 0 (0.0%) |
| 15 Years | 0 (0.0%) | 0 (0.0%) |
| 16 and 17 Years | 0 (0.0%) | 0 (0.0%) |
| 18 to 24 Years | 0 (0.0%) | 13 (52.0%) |
| 25 to 34 Years | 0 (0.0%) | 0 (0.0%) |
| 35 to 44 Years | 0 (0.0%) | 0 (0.0%) |
| 45 to 54 Years | 0 (0.0%) | 0 (0.0%) |
| 55 to 64 Years | 0 (0.0%) | 9 (5.2%) |
| 65 to 74 Years | 0 (0.0%) | 0 (0.0%) |
| 75 Years and over | 0 (0.0%) | 0 (0.0%) |
| Total | 0 (0.0%) | 22 (3.7%) |
Income Above Poverty by Sex and Age in Lake Camelot
According to the poverty statistics in Lake Camelot, males aged under 5 years and females aged under 5 years are the age groups that are most secure financially, with 100.0% of males and 100.0% of females in these age groups living above the poverty line.
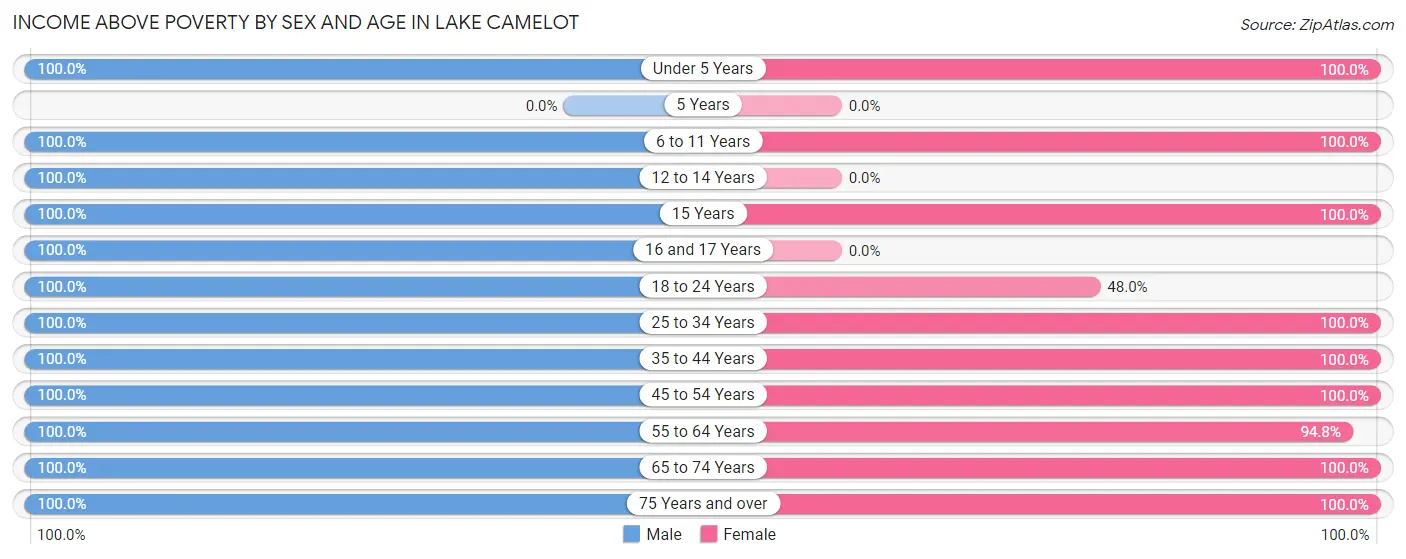
| Age Bracket | Male | Female |
| Under 5 Years | 9 (100.0%) | 9 (100.0%) |
| 5 Years | 0 (0.0%) | 0 (0.0%) |
| 6 to 11 Years | 12 (100.0%) | 38 (100.0%) |
| 12 to 14 Years | 4 (100.0%) | 0 (0.0%) |
| 15 Years | 11 (100.0%) | 4 (100.0%) |
| 16 and 17 Years | 5 (100.0%) | 0 (0.0%) |
| 18 to 24 Years | 56 (100.0%) | 12 (48.0%) |
| 25 to 34 Years | 23 (100.0%) | 12 (100.0%) |
| 35 to 44 Years | 26 (100.0%) | 28 (100.0%) |
| 45 to 54 Years | 40 (100.0%) | 66 (100.0%) |
| 55 to 64 Years | 118 (100.0%) | 165 (94.8%) |
| 65 to 74 Years | 162 (100.0%) | 175 (100.0%) |
| 75 Years and over | 87 (100.0%) | 55 (100.0%) |
| Total | 553 (100.0%) | 564 (96.3%) |
Income Below Poverty Among Married-Couple Families in Lake Camelot
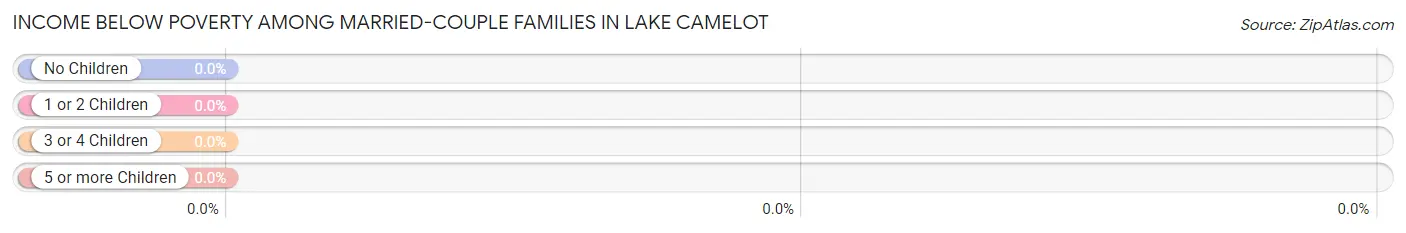
| Children | Above Poverty | Below Poverty |
| No Children | 394 (100.0%) | 0 (0.0%) |
| 1 or 2 Children | 21 (100.0%) | 0 (0.0%) |
| 3 or 4 Children | 4 (100.0%) | 0 (0.0%) |
| 5 or more Children | 0 (0.0%) | 0 (0.0%) |
| Total | 419 (100.0%) | 0 (0.0%) |
Income Below Poverty Among Single-Parent Households in Lake Camelot
| Children | Single Father | Single Mother |
| No Children | 0 (0.0%) | 0 (0.0%) |
| 1 or 2 Children | 0 (0.0%) | 0 (0.0%) |
| 3 or 4 Children | 0 (0.0%) | 0 (0.0%) |
| 5 or more Children | 0 (0.0%) | 0 (0.0%) |
| Total | 0 (0.0%) | 0 (0.0%) |
Income Below Poverty Among Married-Couple vs Single-Parent Households in Lake Camelot
| Children | Married-Couple Families | Single-Parent Households |
| No Children | 0 (0.0%) | 0 (0.0%) |
| 1 or 2 Children | 0 (0.0%) | 0 (0.0%) |
| 3 or 4 Children | 0 (0.0%) | 0 (0.0%) |
| 5 or more Children | 0 (0.0%) | 0 (0.0%) |
| Total | 0 (0.0%) | 0 (0.0%) |
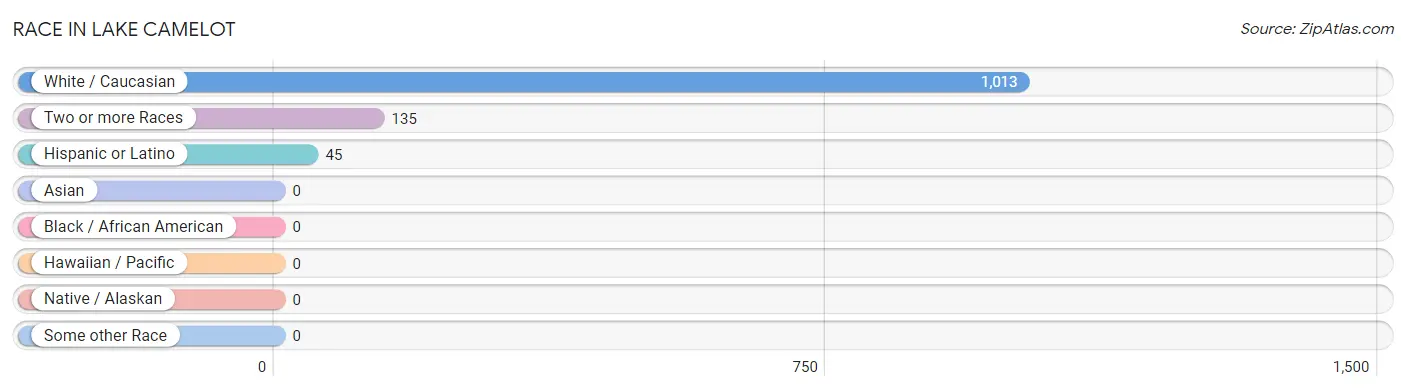
Race in Lake Camelot
The most populous races in Lake Camelot are White / Caucasian (1,013 | 88.2%), Two or more Races (135 | 11.8%), and Hispanic or Latino (45 | 3.9%).
| Race | # Population | % Population |
| Asian | 0 | 0.0% |
| Black / African American | 0 | 0.0% |
| Hawaiian / Pacific | 0 | 0.0% |
| Hispanic or Latino | 45 | 3.9% |
| Native / Alaskan | 0 | 0.0% |
| White / Caucasian | 1,013 | 88.2% |
| Two or more Races | 135 | 11.8% |
| Some other Race | 0 | 0.0% |
| Total | 1,148 | 100.0% |
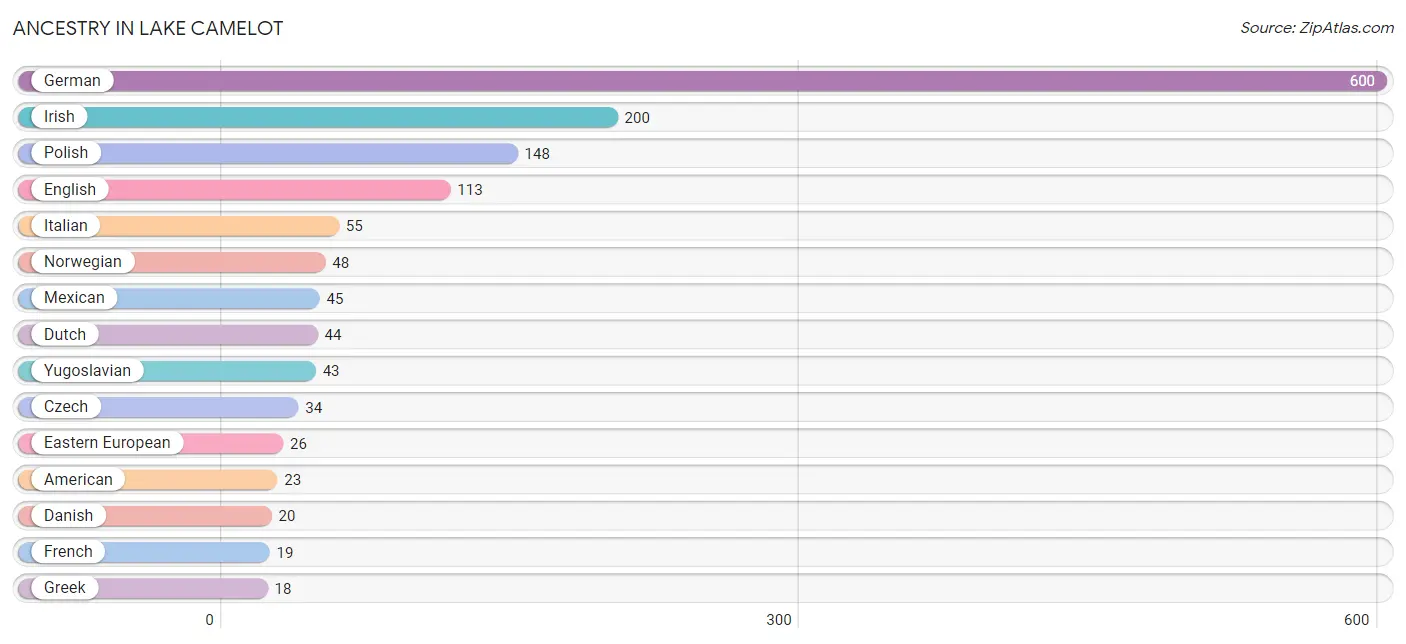
Ancestry in Lake Camelot
The most populous ancestries reported in Lake Camelot are German (600 | 52.3%), Irish (200 | 17.4%), Polish (148 | 12.9%), English (113 | 9.8%), and Italian (55 | 4.8%), together accounting for 97.2% of all Lake Camelot residents.
| Ancestry | # Population | % Population |
| American | 23 | 2.0% |
| Czech | 34 | 3.0% |
| Danish | 20 | 1.7% |
| Dutch | 44 | 3.8% |
| Eastern European | 26 | 2.3% |
| English | 113 | 9.8% |
| French | 19 | 1.7% |
| German | 600 | 52.3% |
| Greek | 18 | 1.6% |
| Irish | 200 | 17.4% |
| Italian | 55 | 4.8% |
| Mexican | 45 | 3.9% |
| Norwegian | 48 | 4.2% |
| Polish | 148 | 12.9% |
| Russian | 7 | 0.6% |
| Scandinavian | 10 | 0.9% |
| Scotch-Irish | 11 | 1.0% |
| Sri Lankan | 15 | 1.3% |
| Swedish | 17 | 1.5% |
| Yugoslavian | 43 | 3.7% | View All 20 Rows |
Immigrants in Lake Camelot
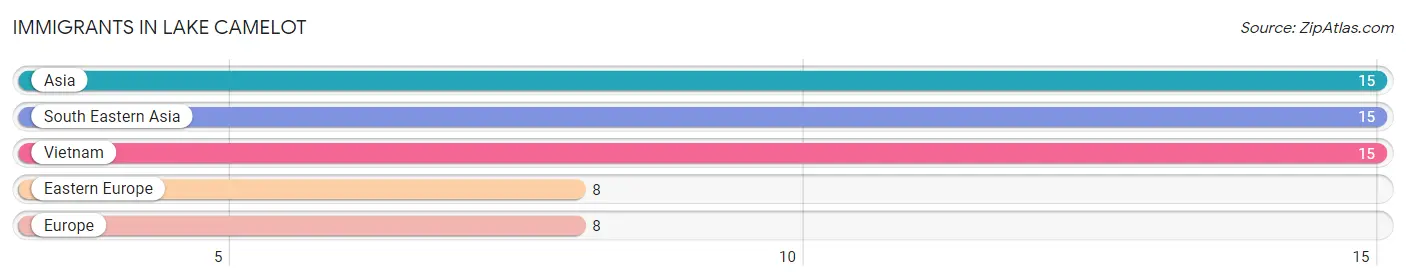
The most numerous immigrant groups reported in Lake Camelot came from Asia (15 | 1.3%), South Eastern Asia (15 | 1.3%), Vietnam (15 | 1.3%), Eastern Europe (8 | 0.7%), and Europe (8 | 0.7%), together accounting for 5.3% of all Lake Camelot residents.
| Immigration Origin | # Population | % Population |
| Asia | 15 | 1.3% |
| Eastern Europe | 8 | 0.7% |
| Europe | 8 | 0.7% |
| South Eastern Asia | 15 | 1.3% |
| Vietnam | 15 | 1.3% | View All 5 Rows |
Sex and Age in Lake Camelot
Sex and Age in Lake Camelot
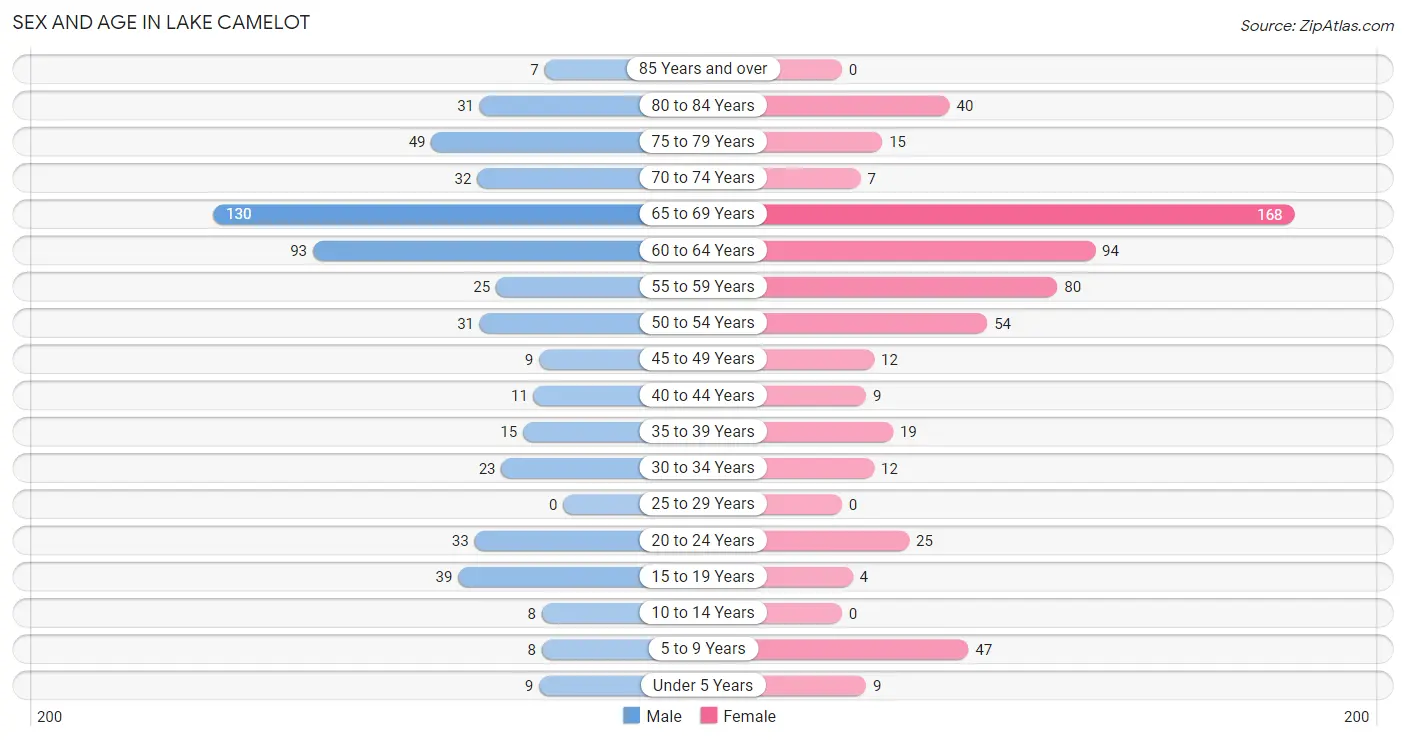
The most populous age groups in Lake Camelot are 65 to 69 Years (130 | 23.5%) for men and 65 to 69 Years (168 | 28.2%) for women.
| Age Bracket | Male | Female |
| Under 5 Years | 9 (1.6%) | 9 (1.5%) |
| 5 to 9 Years | 8 (1.5%) | 47 (7.9%) |
| 10 to 14 Years | 8 (1.5%) | 0 (0.0%) |
| 15 to 19 Years | 39 (7.0%) | 4 (0.7%) |
| 20 to 24 Years | 33 (6.0%) | 25 (4.2%) |
| 25 to 29 Years | 0 (0.0%) | 0 (0.0%) |
| 30 to 34 Years | 23 (4.2%) | 12 (2.0%) |
| 35 to 39 Years | 15 (2.7%) | 19 (3.2%) |
| 40 to 44 Years | 11 (2.0%) | 9 (1.5%) |
| 45 to 49 Years | 9 (1.6%) | 12 (2.0%) |
| 50 to 54 Years | 31 (5.6%) | 54 (9.1%) |
| 55 to 59 Years | 25 (4.5%) | 80 (13.5%) |
| 60 to 64 Years | 93 (16.8%) | 94 (15.8%) |
| 65 to 69 Years | 130 (23.5%) | 168 (28.2%) |
| 70 to 74 Years | 32 (5.8%) | 7 (1.2%) |
| 75 to 79 Years | 49 (8.9%) | 15 (2.5%) |
| 80 to 84 Years | 31 (5.6%) | 40 (6.7%) |
| 85 Years and over | 7 (1.3%) | 0 (0.0%) |
| Total | 553 (100.0%) | 595 (100.0%) |
Families and Households in Lake Camelot
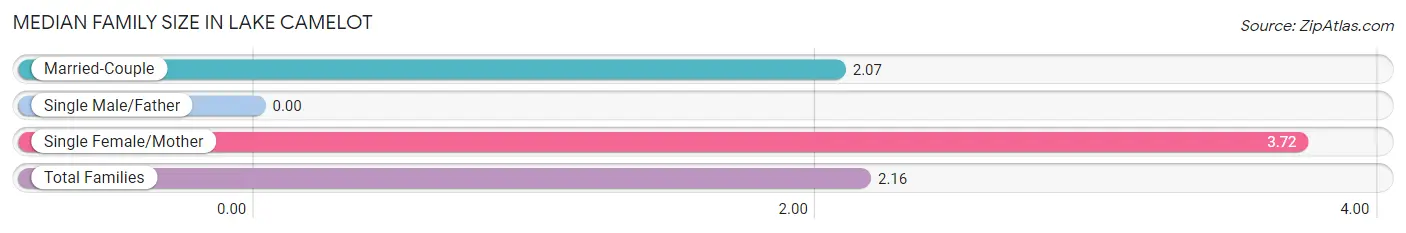
Median Family Size in Lake Camelot
| Family Type | # Families | Family Size |
| Married-Couple | 419 (94.4%) | 2.07 |
| Single Male/Father | 0 (0.0%) | - |
| Single Female/Mother | 25 (5.6%) | 3.72 |
| Total Families | 444 (100.0%) | 2.16 |
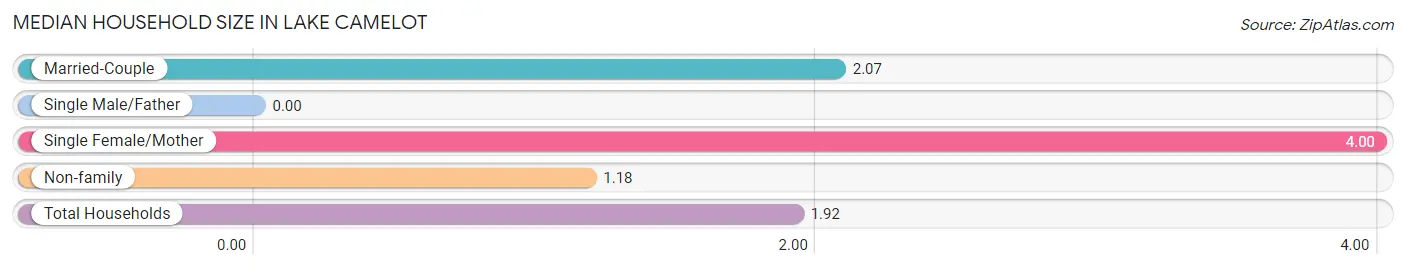
Median Household Size in Lake Camelot
| Household Type | # Households | Household Size |
| Married-Couple | 419 (70.2%) | 2.07 |
| Single Male/Father | 0 (0.0%) | - |
| Single Female/Mother | 25 (4.2%) | 4.00 |
| Non-family | 153 (25.6%) | 1.18 |
| Total Households | 597 (100.0%) | 1.92 |
Household Size by Marriage Status in Lake Camelot
Out of a total of 597 households in Lake Camelot, 444 (74.4%) are family households, while 153 (25.6%) are nonfamily households. The most numerous type of family households are 2-person households, comprising 395, and the most common type of nonfamily households are 1-person households, comprising 122.
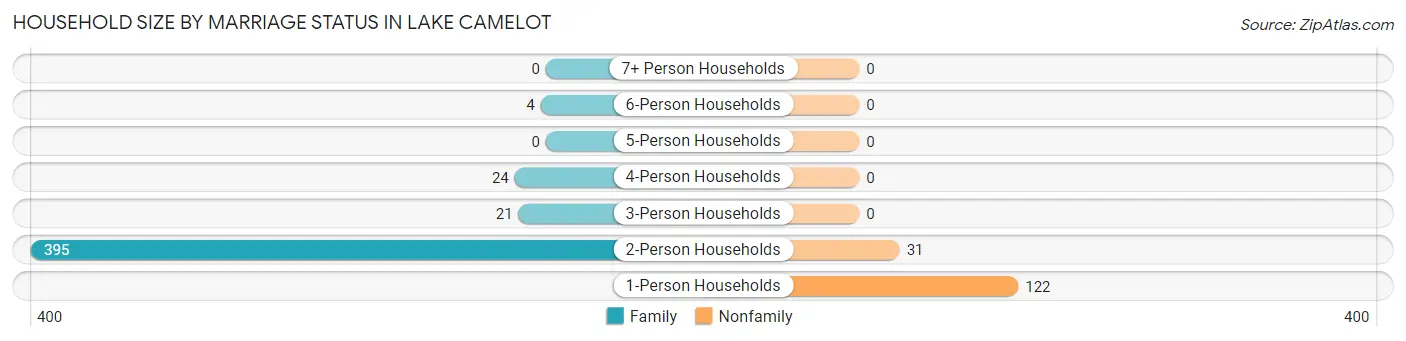
| Household Size | Family Households | Nonfamily Households |
| 1-Person Households | - | 122 (20.4%) |
| 2-Person Households | 395 (66.2%) | 31 (5.2%) |
| 3-Person Households | 21 (3.5%) | 0 (0.0%) |
| 4-Person Households | 24 (4.0%) | 0 (0.0%) |
| 5-Person Households | 0 (0.0%) | 0 (0.0%) |
| 6-Person Households | 4 (0.7%) | 0 (0.0%) |
| 7+ Person Households | 0 (0.0%) | 0 (0.0%) |
| Total | 444 (74.4%) | 153 (25.6%) |
Female Fertility in Lake Camelot
Fertility by Age in Lake Camelot
| Age Bracket | Women with Births | Births / 1,000 Women |
| 15 to 19 years | 0 (0.0%) | 0.0 |
| 20 to 34 years | 0 (0.0%) | 0.0 |
| 35 to 50 years | 0 (0.0%) | 0.0 |
| Total | 0 (0.0%) | 0.0 |
Fertility by Age by Marriage Status in Lake Camelot
| Age Bracket | Married | Unmarried |
| 15 to 19 years | 0 (0.0%) | 0 (0.0%) |
| 20 to 34 years | 0 (0.0%) | 0 (0.0%) |
| 35 to 50 years | 0 (0.0%) | 0 (0.0%) |
| Total | 0 (0.0%) | 0 (0.0%) |
Fertility by Education in Lake Camelot
| Educational Attainment | Women with Births | Births / 1,000 Women |
| Less than High School | 0 (0.0%) | 0.0 |
| High School Diploma | 0 (0.0%) | 0.0 |
| College or Associate's Degree | 0 (0.0%) | 0.0 |
| Bachelor's Degree | 0 (0.0%) | 0.0 |
| Graduate Degree | 0 (0.0%) | 0.0 |
| Total | 0 (0.0%) | 0.0 |
Fertility by Education by Marriage Status in Lake Camelot
| Educational Attainment | Married | Unmarried |
| Less than High School | 0 (0.0%) | 0 (0.0%) |
| High School Diploma | 0 (0.0%) | 0 (0.0%) |
| College or Associate's Degree | 0 (0.0%) | 0 (0.0%) |
| Bachelor's Degree | 0 (0.0%) | 0 (0.0%) |
| Graduate Degree | 0 (0.0%) | 0 (0.0%) |
| Total | 0 (0.0%) | 0 (0.0%) |
Employment Characteristics in Lake Camelot
Employment by Class of Employer in Lake Camelot
Among the 378 employed individuals in Lake Camelot, private company employees (234 | 61.9%), local government employees (46 | 12.2%), and not-for-profit organizations (37 | 9.8%) make up the most common classes of employment.
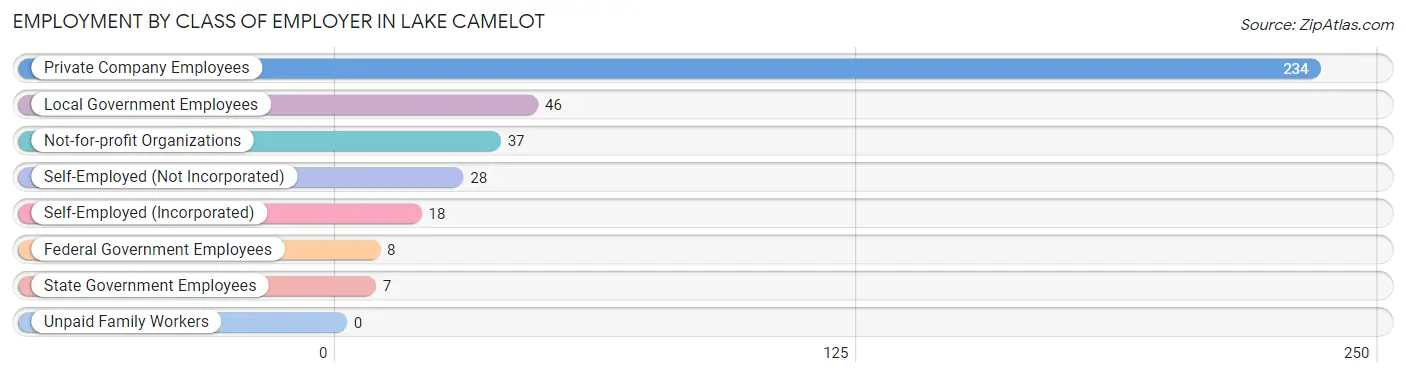
| Employer Class | # Employees | % Employees |
| Private Company Employees | 234 | 61.9% |
| Self-Employed (Incorporated) | 18 | 4.8% |
| Self-Employed (Not Incorporated) | 28 | 7.4% |
| Not-for-profit Organizations | 37 | 9.8% |
| Local Government Employees | 46 | 12.2% |
| State Government Employees | 7 | 1.8% |
| Federal Government Employees | 8 | 2.1% |
| Unpaid Family Workers | 0 | 0.0% |
| Total | 378 | 100.0% |
Employment Status by Age in Lake Camelot
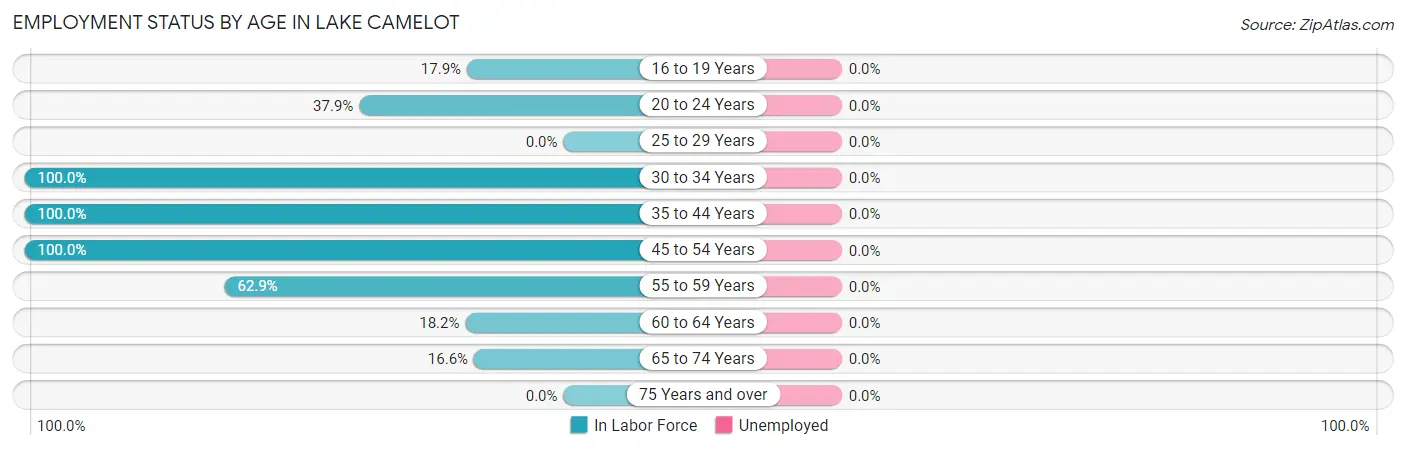
| Age Bracket | In Labor Force | Unemployed |
| 16 to 19 Years | 5 (17.9%) | 0 (0.0%) |
| 20 to 24 Years | 22 (37.9%) | 0 (0.0%) |
| 25 to 29 Years | 0 (0.0%) | 0 (0.0%) |
| 30 to 34 Years | 35 (100.0%) | 0 (0.0%) |
| 35 to 44 Years | 54 (100.0%) | 0 (0.0%) |
| 45 to 54 Years | 106 (100.0%) | 0 (0.0%) |
| 55 to 59 Years | 66 (62.9%) | 0 (0.0%) |
| 60 to 64 Years | 34 (18.2%) | 0 (0.0%) |
| 65 to 74 Years | 56 (16.6%) | 0 (0.0%) |
| 75 Years and over | 0 (0.0%) | 0 (0.0%) |
| Total | 378 (35.9%) | 0 (0.0%) |
Employment Status by Educational Attainment in Lake Camelot
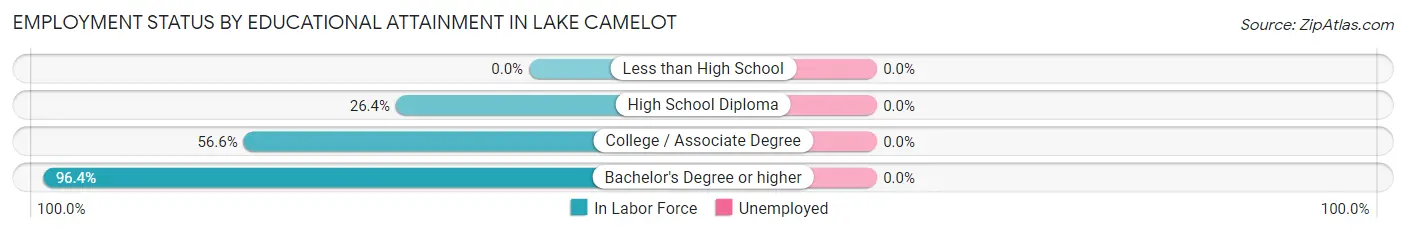
| Educational Attainment | In Labor Force | Unemployed |
| Less than High School | 0 (0.0%) | 0 (0.0%) |
| High School Diploma | 29 (26.4%) | 0 (0.0%) |
| College / Associate Degree | 103 (56.6%) | 0 (0.0%) |
| Bachelor's Degree or higher | 163 (96.4%) | 0 (0.0%) |
| Total | 295 (60.6%) | 0 (0.0%) |
Employment Occupations by Sex in Lake Camelot
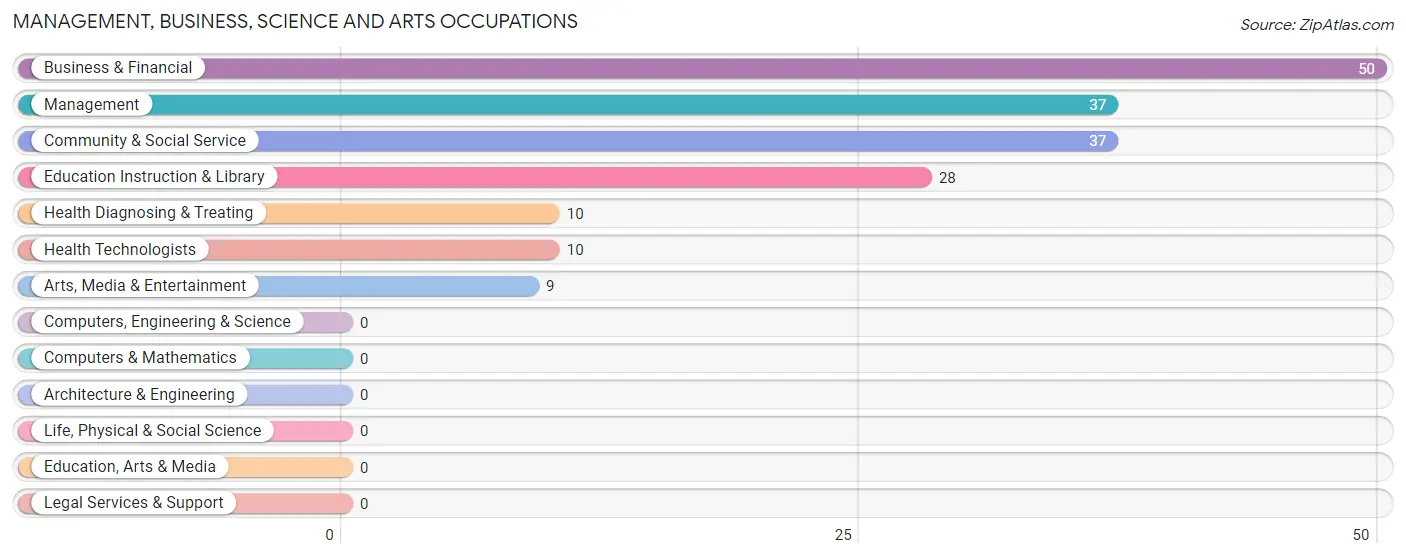
Management, Business, Science and Arts Occupations
The most common Management, Business, Science and Arts occupations in Lake Camelot are Business & Financial (50 | 13.2%), Management (37 | 9.8%), Community & Social Service (37 | 9.8%), Education Instruction & Library (28 | 7.4%), and Health Diagnosing & Treating (10 | 2.6%).
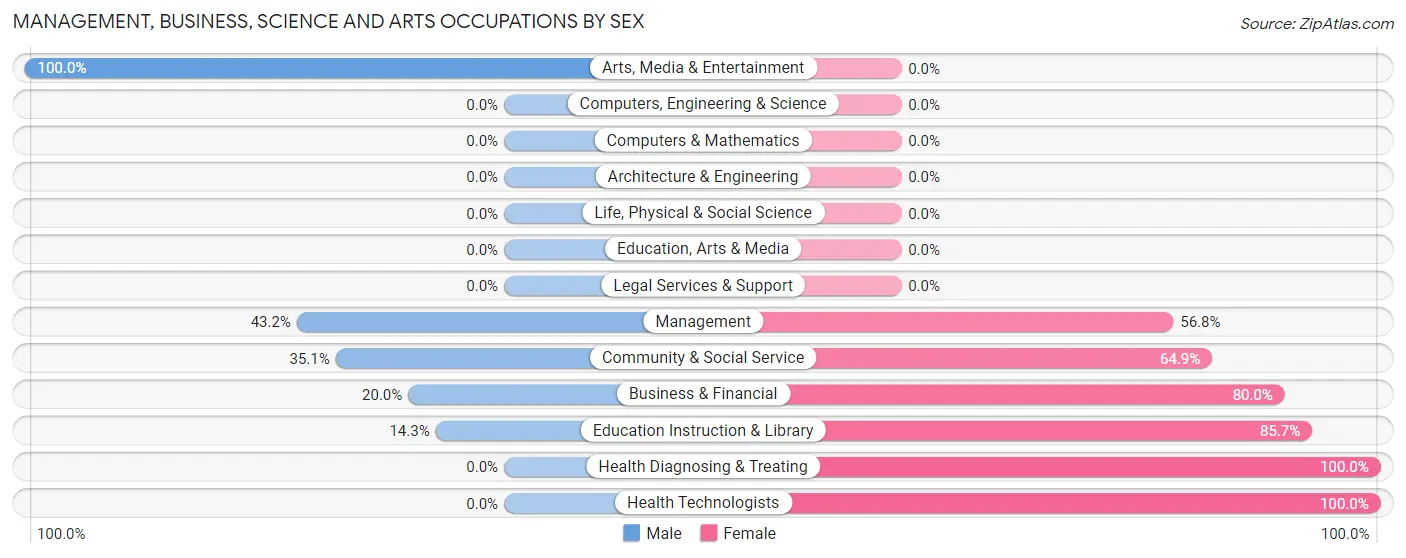
Management, Business, Science and Arts Occupations by Sex
Within the Management, Business, Science and Arts occupations in Lake Camelot, the most male-oriented occupations are Arts, Media & Entertainment (100.0%), Management (43.2%), and Community & Social Service (35.1%), while the most female-oriented occupations are Health Diagnosing & Treating (100.0%), Health Technologists (100.0%), and Education Instruction & Library (85.7%).
| Occupation | Male | Female |
| Management | 16 (43.2%) | 21 (56.8%) |
| Business & Financial | 10 (20.0%) | 40 (80.0%) |
| Computers, Engineering & Science | 0 (0.0%) | 0 (0.0%) |
| Computers & Mathematics | 0 (0.0%) | 0 (0.0%) |
| Architecture & Engineering | 0 (0.0%) | 0 (0.0%) |
| Life, Physical & Social Science | 0 (0.0%) | 0 (0.0%) |
| Community & Social Service | 13 (35.1%) | 24 (64.9%) |
| Education, Arts & Media | 0 (0.0%) | 0 (0.0%) |
| Legal Services & Support | 0 (0.0%) | 0 (0.0%) |
| Education Instruction & Library | 4 (14.3%) | 24 (85.7%) |
| Arts, Media & Entertainment | 9 (100.0%) | 0 (0.0%) |
| Health Diagnosing & Treating | 0 (0.0%) | 10 (100.0%) |
| Health Technologists | 0 (0.0%) | 10 (100.0%) |
| Total (Category) | 39 (29.1%) | 95 (70.9%) |
| Total (Overall) | 157 (41.5%) | 221 (58.5%) |
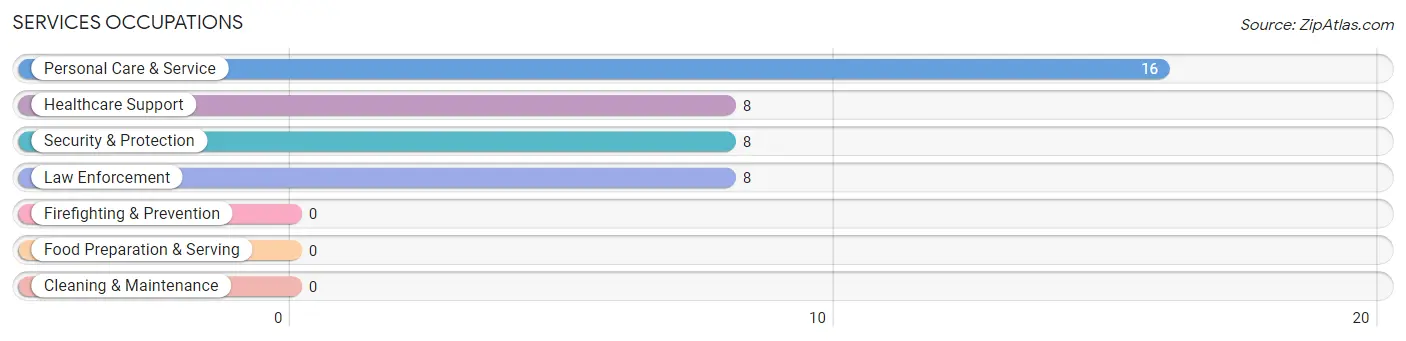
Services Occupations
The most common Services occupations in Lake Camelot are Personal Care & Service (16 | 4.2%), Healthcare Support (8 | 2.1%), Security & Protection (8 | 2.1%), and Law Enforcement (8 | 2.1%).
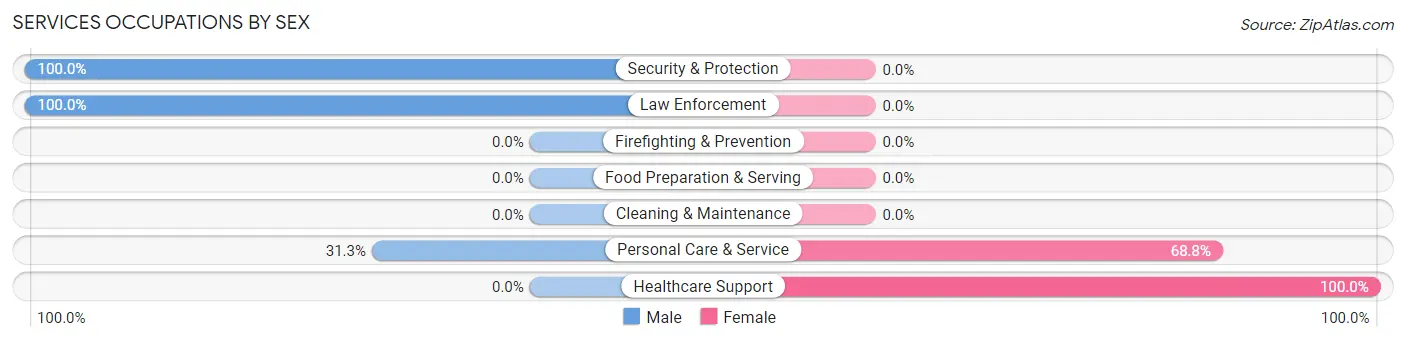
Services Occupations by Sex
Within the Services occupations in Lake Camelot, the most male-oriented occupations are Security & Protection (100.0%), Law Enforcement (100.0%), and Personal Care & Service (31.2%), while the most female-oriented occupations are Healthcare Support (100.0%), and Personal Care & Service (68.8%).
| Occupation | Male | Female |
| Healthcare Support | 0 (0.0%) | 8 (100.0%) |
| Security & Protection | 8 (100.0%) | 0 (0.0%) |
| Firefighting & Prevention | 0 (0.0%) | 0 (0.0%) |
| Law Enforcement | 8 (100.0%) | 0 (0.0%) |
| Food Preparation & Serving | 0 (0.0%) | 0 (0.0%) |
| Cleaning & Maintenance | 0 (0.0%) | 0 (0.0%) |
| Personal Care & Service | 5 (31.2%) | 11 (68.8%) |
| Total (Category) | 13 (40.6%) | 19 (59.4%) |
| Total (Overall) | 157 (41.5%) | 221 (58.5%) |
Sales and Office Occupations
The most common Sales and Office occupations in Lake Camelot are Sales & Related (118 | 31.2%), and Office & Administration (32 | 8.5%).
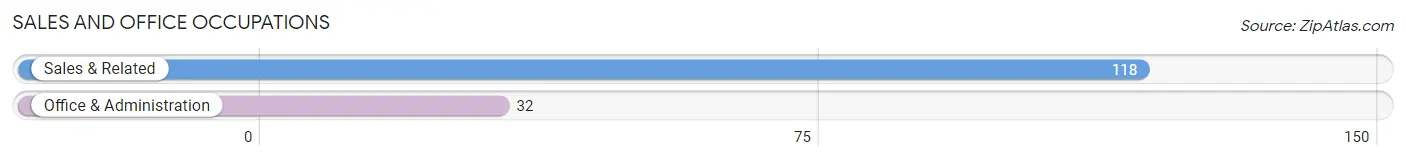
Sales and Office Occupations by Sex
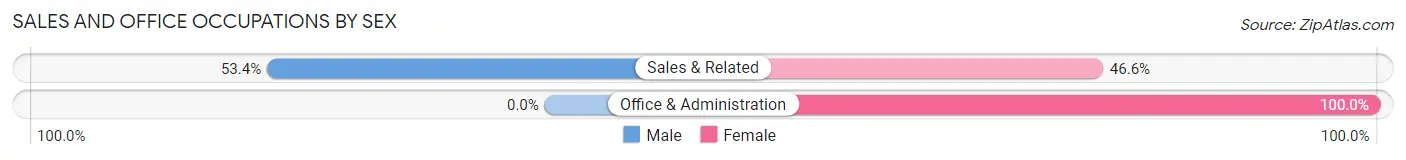
| Occupation | Male | Female |
| Sales & Related | 63 (53.4%) | 55 (46.6%) |
| Office & Administration | 0 (0.0%) | 32 (100.0%) |
| Total (Category) | 63 (42.0%) | 87 (58.0%) |
| Total (Overall) | 157 (41.5%) | 221 (58.5%) |
Natural Resources, Construction and Maintenance Occupations
The most common Natural Resources, Construction and Maintenance occupations in Lake Camelot are , and Construction & Extraction (17 | 4.5%).
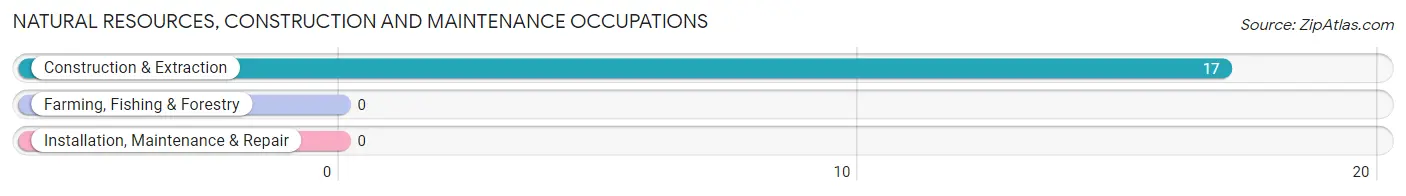
Natural Resources, Construction and Maintenance Occupations by Sex
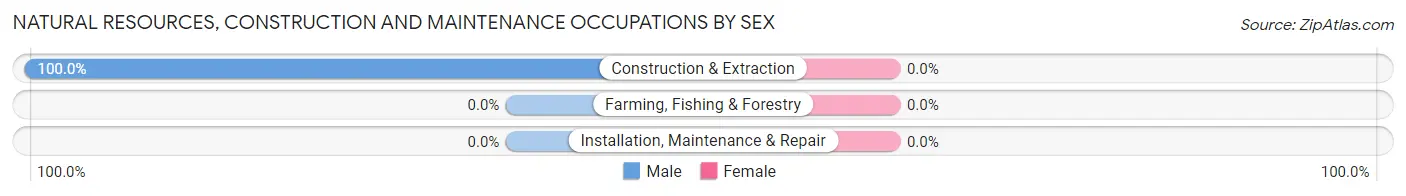
| Occupation | Male | Female |
| Farming, Fishing & Forestry | 0 (0.0%) | 0 (0.0%) |
| Construction & Extraction | 17 (100.0%) | 0 (0.0%) |
| Installation, Maintenance & Repair | 0 (0.0%) | 0 (0.0%) |
| Total (Category) | 17 (100.0%) | 0 (0.0%) |
| Total (Overall) | 157 (41.5%) | 221 (58.5%) |
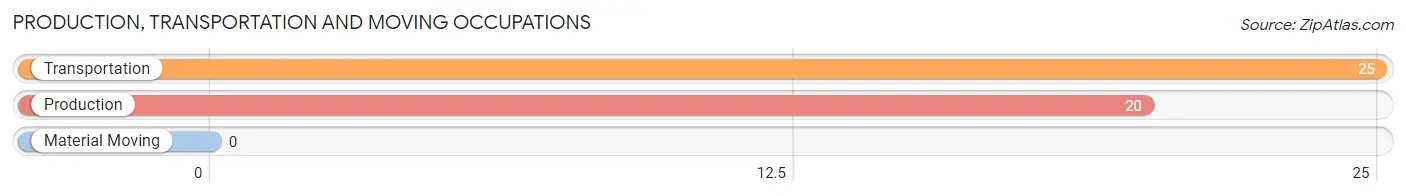
Production, Transportation and Moving Occupations
The most common Production, Transportation and Moving occupations in Lake Camelot are Transportation (25 | 6.6%), and Production (20 | 5.3%).
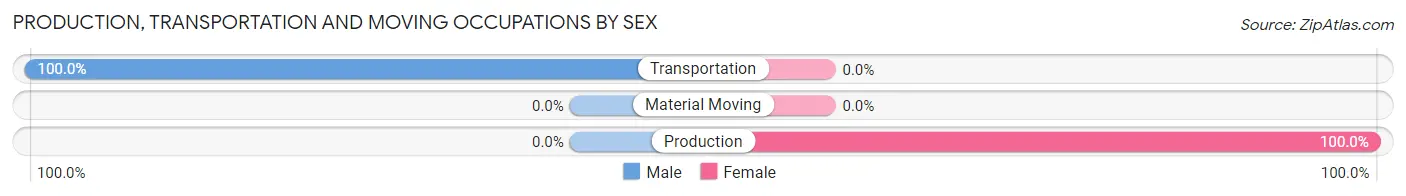
Production, Transportation and Moving Occupations by Sex
| Occupation | Male | Female |
| Production | 0 (0.0%) | 20 (100.0%) |
| Transportation | 25 (100.0%) | 0 (0.0%) |
| Material Moving | 0 (0.0%) | 0 (0.0%) |
| Total (Category) | 25 (55.6%) | 20 (44.4%) |
| Total (Overall) | 157 (41.5%) | 221 (58.5%) |
Employment Industries by Sex in Lake Camelot
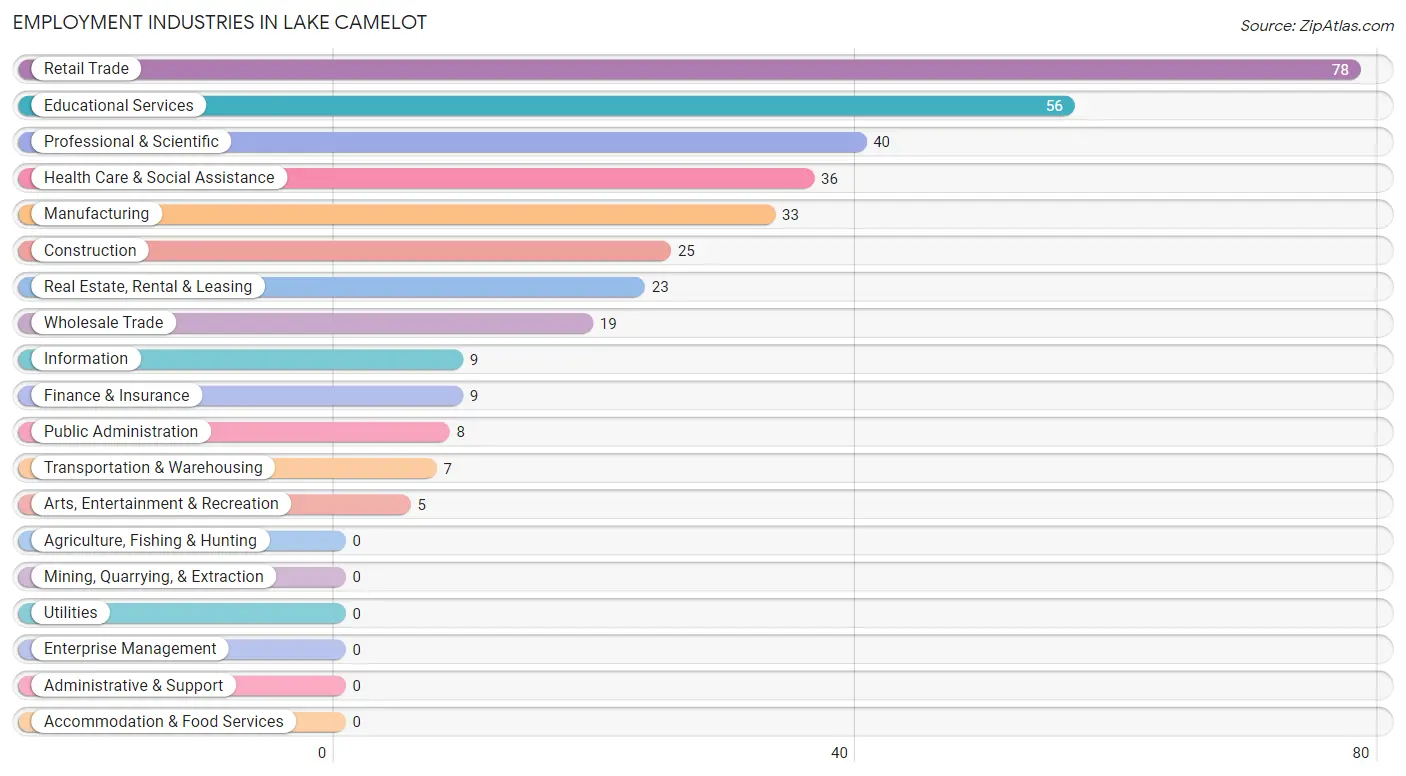
Employment Industries in Lake Camelot
The major employment industries in Lake Camelot include Retail Trade (78 | 20.6%), Educational Services (56 | 14.8%), Professional & Scientific (40 | 10.6%), Health Care & Social Assistance (36 | 9.5%), and Manufacturing (33 | 8.7%).
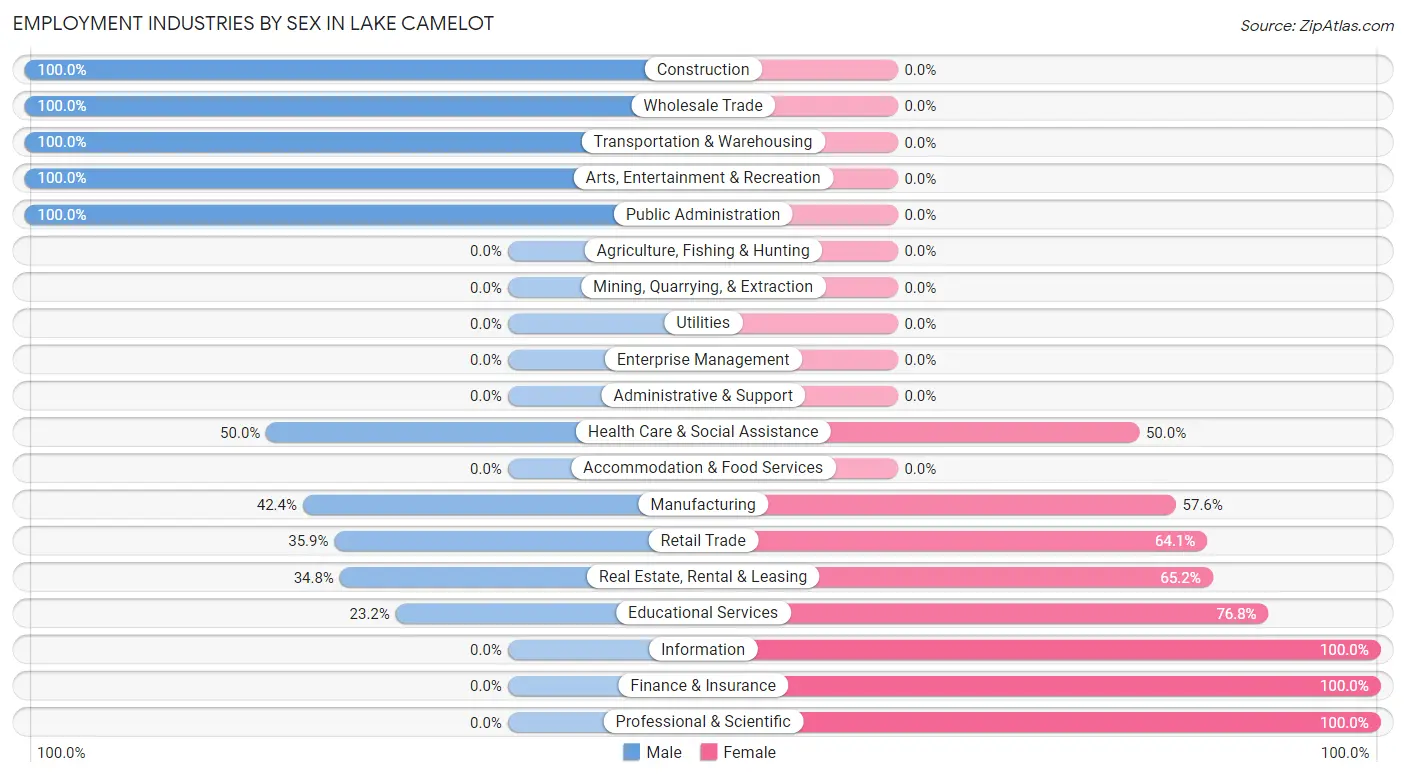
Employment Industries by Sex in Lake Camelot
The Lake Camelot industries that see more men than women are Construction (100.0%), Wholesale Trade (100.0%), and Transportation & Warehousing (100.0%), whereas the industries that tend to have a higher number of women are Information (100.0%), Finance & Insurance (100.0%), and Professional & Scientific (100.0%).
| Industry | Male | Female |
| Agriculture, Fishing & Hunting | 0 (0.0%) | 0 (0.0%) |
| Mining, Quarrying, & Extraction | 0 (0.0%) | 0 (0.0%) |
| Construction | 25 (100.0%) | 0 (0.0%) |
| Manufacturing | 14 (42.4%) | 19 (57.6%) |
| Wholesale Trade | 19 (100.0%) | 0 (0.0%) |
| Retail Trade | 28 (35.9%) | 50 (64.1%) |
| Transportation & Warehousing | 7 (100.0%) | 0 (0.0%) |
| Utilities | 0 (0.0%) | 0 (0.0%) |
| Information | 0 (0.0%) | 9 (100.0%) |
| Finance & Insurance | 0 (0.0%) | 9 (100.0%) |
| Real Estate, Rental & Leasing | 8 (34.8%) | 15 (65.2%) |
| Professional & Scientific | 0 (0.0%) | 40 (100.0%) |
| Enterprise Management | 0 (0.0%) | 0 (0.0%) |
| Administrative & Support | 0 (0.0%) | 0 (0.0%) |
| Educational Services | 13 (23.2%) | 43 (76.8%) |
| Health Care & Social Assistance | 18 (50.0%) | 18 (50.0%) |
| Arts, Entertainment & Recreation | 5 (100.0%) | 0 (0.0%) |
| Accommodation & Food Services | 0 (0.0%) | 0 (0.0%) |
| Public Administration | 8 (100.0%) | 0 (0.0%) |
| Total | 157 (41.5%) | 221 (58.5%) |
Education in Lake Camelot
School Enrollment in Lake Camelot
The most common levels of schooling among the 127 students in Lake Camelot are elementary school (50 | 39.4%), high school (31 | 24.4%), and nursery / preschool (18 | 14.2%).
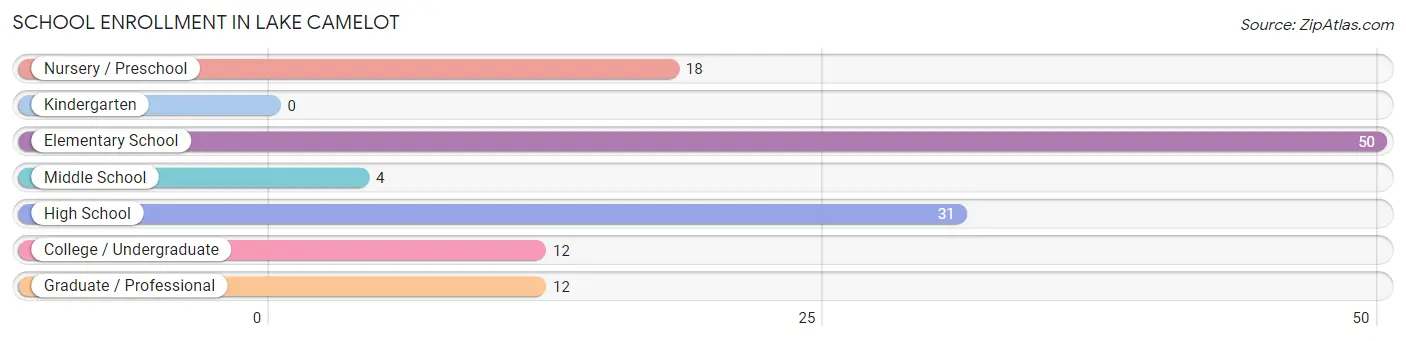
| School Level | # Students | % Students |
| Nursery / Preschool | 18 | 14.2% |
| Kindergarten | 0 | 0.0% |
| Elementary School | 50 | 39.4% |
| Middle School | 4 | 3.2% |
| High School | 31 | 24.4% |
| College / Undergraduate | 12 | 9.5% |
| Graduate / Professional | 12 | 9.5% |
| Total | 127 | 100.0% |
School Enrollment by Age by Funding Source in Lake Camelot
Out of a total of 127 students who are enrolled in schools in Lake Camelot, 8 (6.3%) attend a private institution, while the remaining 119 (93.7%) are enrolled in public schools. The age group of 10 to 14 year olds has the highest likelihood of being enrolled in private schools, with 8 (100.0% in the age bracket) enrolled. Conversely, the age group of 3 to 4 year olds has the lowest likelihood of being enrolled in a private school, with 18 (100.0% in the age bracket) attending a public institution.
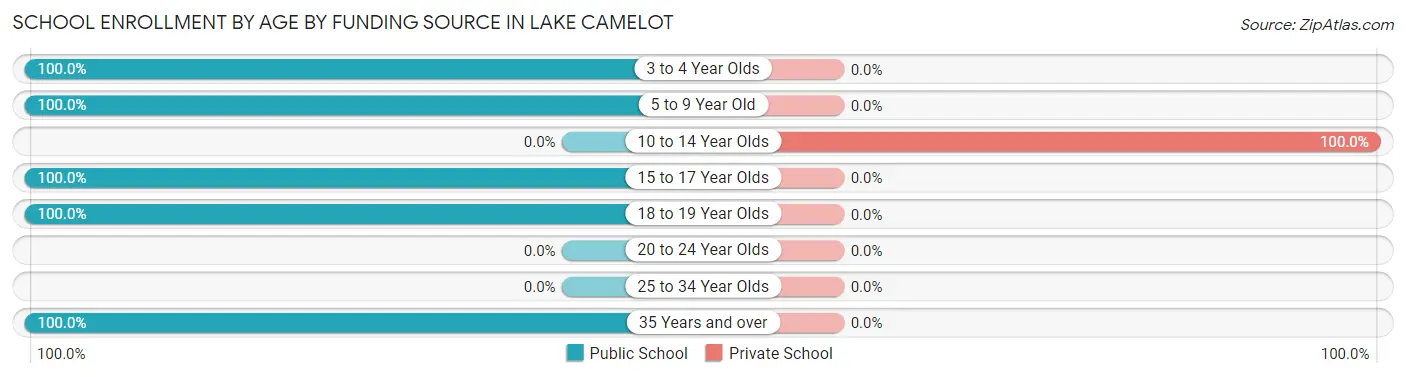
| Age Bracket | Public School | Private School |
| 3 to 4 Year Olds | 18 (100.0%) | 0 (0.0%) |
| 5 to 9 Year Old | 46 (100.0%) | 0 (0.0%) |
| 10 to 14 Year Olds | 0 (0.0%) | 8 (100.0%) |
| 15 to 17 Year Olds | 20 (100.0%) | 0 (0.0%) |
| 18 to 19 Year Olds | 23 (100.0%) | 0 (0.0%) |
| 20 to 24 Year Olds | 0 (0.0%) | 0 (0.0%) |
| 25 to 34 Year Olds | 0 (0.0%) | 0 (0.0%) |
| 35 Years and over | 12 (100.0%) | 0 (0.0%) |
| Total | 119 (93.7%) | 8 (6.3%) |
Educational Attainment by Field of Study in Lake Camelot
Business (167 | 42.9%), education (57 | 14.6%), liberal arts & history (33 | 8.5%), social sciences (30 | 7.7%), and physical & health sciences (29 | 7.5%) are the most common fields of study among 389 individuals in Lake Camelot who have obtained a bachelor's degree or higher.
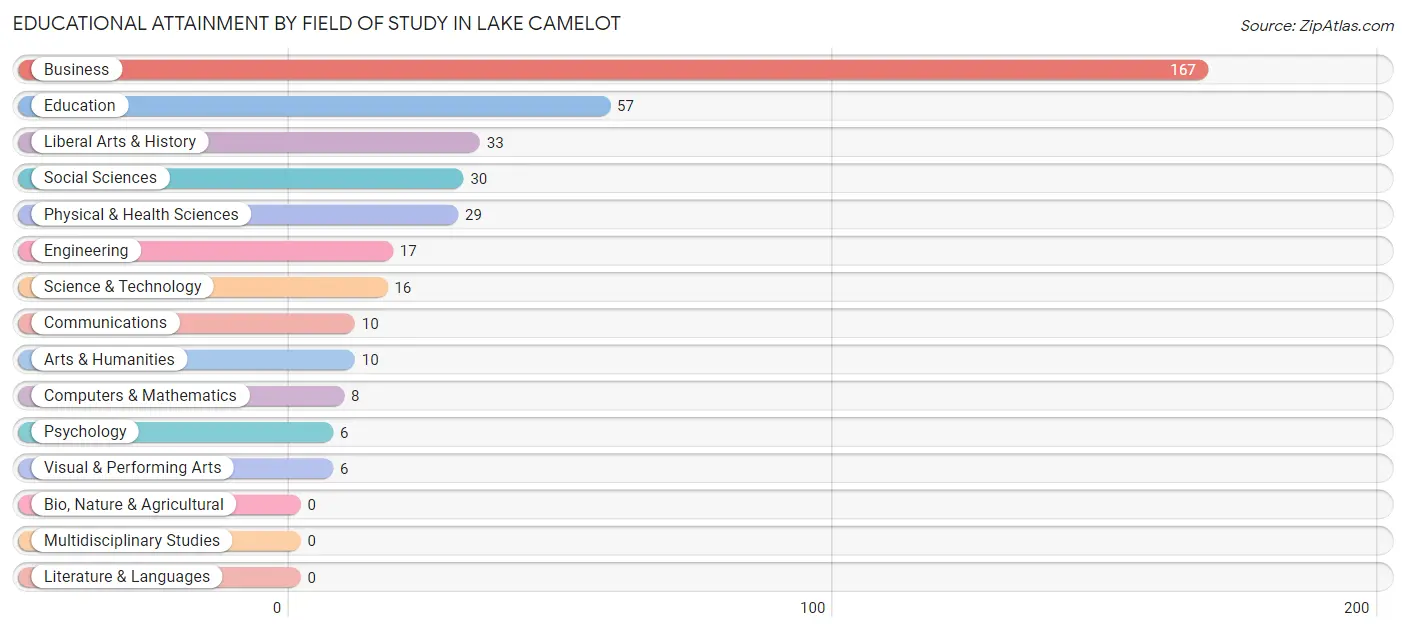
| Field of Study | # Graduates | % Graduates |
| Computers & Mathematics | 8 | 2.1% |
| Bio, Nature & Agricultural | 0 | 0.0% |
| Physical & Health Sciences | 29 | 7.5% |
| Psychology | 6 | 1.5% |
| Social Sciences | 30 | 7.7% |
| Engineering | 17 | 4.4% |
| Multidisciplinary Studies | 0 | 0.0% |
| Science & Technology | 16 | 4.1% |
| Business | 167 | 42.9% |
| Education | 57 | 14.6% |
| Literature & Languages | 0 | 0.0% |
| Liberal Arts & History | 33 | 8.5% |
| Visual & Performing Arts | 6 | 1.5% |
| Communications | 10 | 2.6% |
| Arts & Humanities | 10 | 2.6% |
| Total | 389 | 100.0% |
Transportation & Commute in Lake Camelot
Vehicle Availability by Sex in Lake Camelot
The most prevalent vehicle ownership categories in Lake Camelot are males with 2 vehicles (84, accounting for 53.5%) and females with 2 vehicles (140, making up 38.0%).
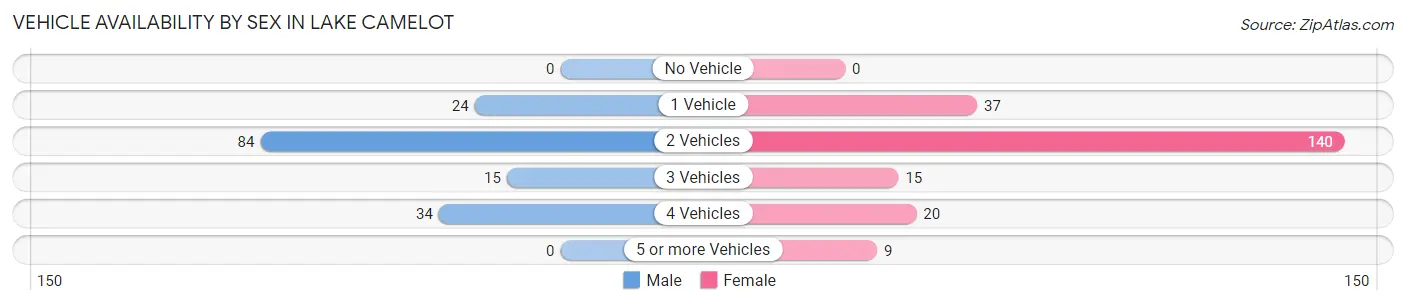
| Vehicles Available | Male | Female |
| No Vehicle | 0 (0.0%) | 0 (0.0%) |
| 1 Vehicle | 24 (15.3%) | 37 (16.7%) |
| 2 Vehicles | 84 (53.5%) | 140 (63.3%) |
| 3 Vehicles | 15 (9.6%) | 15 (6.8%) |
| 4 Vehicles | 34 (21.7%) | 20 (9.0%) |
| 5 or more Vehicles | 0 (0.0%) | 9 (4.1%) |
| Total | 157 (100.0%) | 221 (100.0%) |
Commute Time in Lake Camelot
The most frequently occuring commute durations in Lake Camelot are 60 to 89 minutes (72 commuters, 24.9%), 20 to 24 minutes (50 commuters, 17.3%), and 15 to 19 minutes (44 commuters, 15.2%).
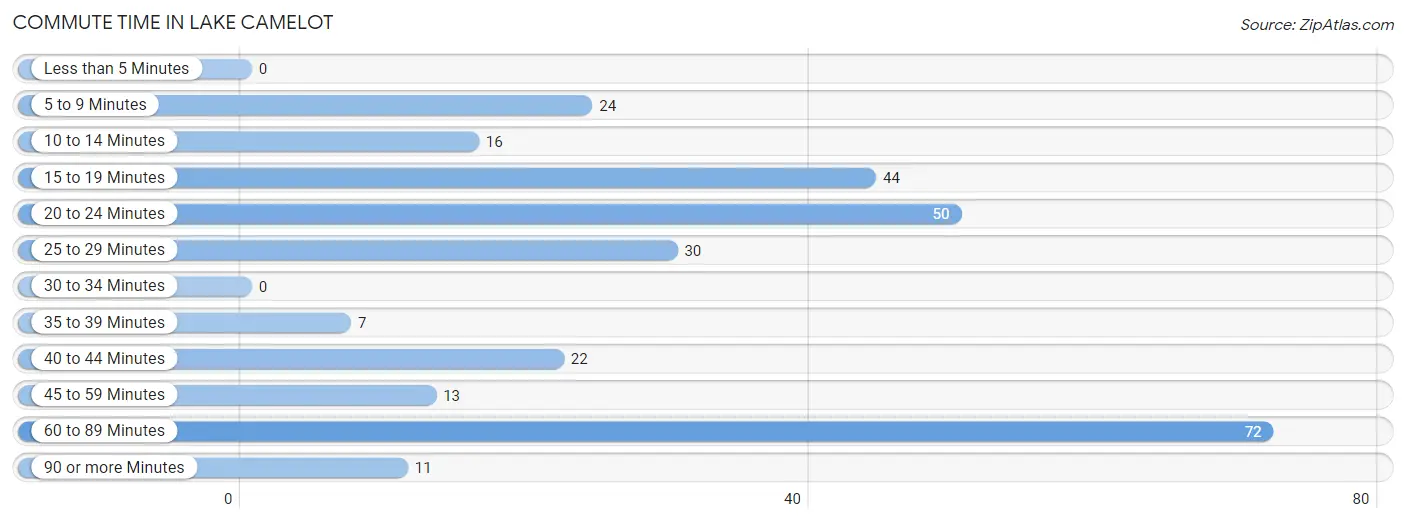
| Commute Time | # Commuters | % Commuters |
| Less than 5 Minutes | 0 | 0.0% |
| 5 to 9 Minutes | 24 | 8.3% |
| 10 to 14 Minutes | 16 | 5.5% |
| 15 to 19 Minutes | 44 | 15.2% |
| 20 to 24 Minutes | 50 | 17.3% |
| 25 to 29 Minutes | 30 | 10.4% |
| 30 to 34 Minutes | 0 | 0.0% |
| 35 to 39 Minutes | 7 | 2.4% |
| 40 to 44 Minutes | 22 | 7.6% |
| 45 to 59 Minutes | 13 | 4.5% |
| 60 to 89 Minutes | 72 | 24.9% |
| 90 or more Minutes | 11 | 3.8% |
Commute Time by Sex in Lake Camelot
The most common commute times in Lake Camelot are 60 to 89 minutes (32 commuters, 26.2%) for males and 15 to 19 minutes (40 commuters, 23.9%) for females.
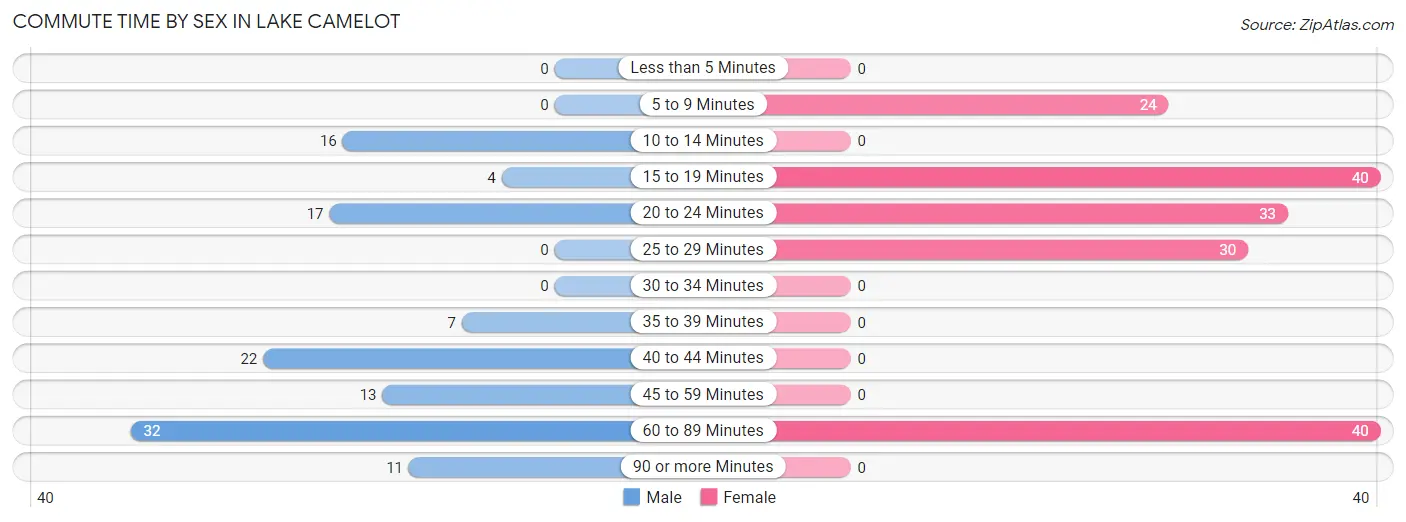
| Commute Time | Male | Female |
| Less than 5 Minutes | 0 (0.0%) | 0 (0.0%) |
| 5 to 9 Minutes | 0 (0.0%) | 24 (14.4%) |
| 10 to 14 Minutes | 16 (13.1%) | 0 (0.0%) |
| 15 to 19 Minutes | 4 (3.3%) | 40 (23.9%) |
| 20 to 24 Minutes | 17 (13.9%) | 33 (19.8%) |
| 25 to 29 Minutes | 0 (0.0%) | 30 (18.0%) |
| 30 to 34 Minutes | 0 (0.0%) | 0 (0.0%) |
| 35 to 39 Minutes | 7 (5.7%) | 0 (0.0%) |
| 40 to 44 Minutes | 22 (18.0%) | 0 (0.0%) |
| 45 to 59 Minutes | 13 (10.7%) | 0 (0.0%) |
| 60 to 89 Minutes | 32 (26.2%) | 40 (23.9%) |
| 90 or more Minutes | 11 (9.0%) | 0 (0.0%) |
Time of Departure to Work by Sex in Lake Camelot
The most frequent times of departure to work in Lake Camelot are 7:00 AM to 7:29 AM (43, 35.2%) for males and 7:00 AM to 7:29 AM (41, 24.5%) for females.
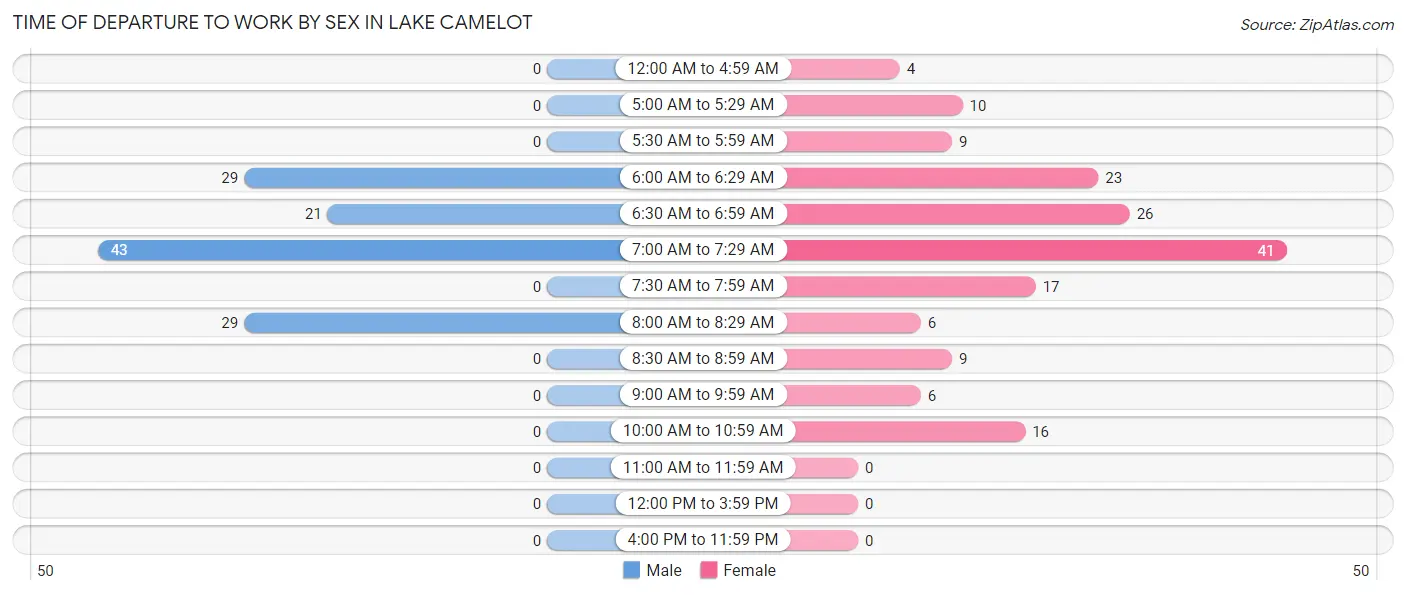
| Time of Departure | Male | Female |
| 12:00 AM to 4:59 AM | 0 (0.0%) | 4 (2.4%) |
| 5:00 AM to 5:29 AM | 0 (0.0%) | 10 (6.0%) |
| 5:30 AM to 5:59 AM | 0 (0.0%) | 9 (5.4%) |
| 6:00 AM to 6:29 AM | 29 (23.8%) | 23 (13.8%) |
| 6:30 AM to 6:59 AM | 21 (17.2%) | 26 (15.6%) |
| 7:00 AM to 7:29 AM | 43 (35.2%) | 41 (24.5%) |
| 7:30 AM to 7:59 AM | 0 (0.0%) | 17 (10.2%) |
| 8:00 AM to 8:29 AM | 29 (23.8%) | 6 (3.6%) |
| 8:30 AM to 8:59 AM | 0 (0.0%) | 9 (5.4%) |
| 9:00 AM to 9:59 AM | 0 (0.0%) | 6 (3.6%) |
| 10:00 AM to 10:59 AM | 0 (0.0%) | 16 (9.6%) |
| 11:00 AM to 11:59 AM | 0 (0.0%) | 0 (0.0%) |
| 12:00 PM to 3:59 PM | 0 (0.0%) | 0 (0.0%) |
| 4:00 PM to 11:59 PM | 0 (0.0%) | 0 (0.0%) |
| Total | 122 (100.0%) | 167 (100.0%) |
Housing Occupancy in Lake Camelot
Occupancy by Ownership in Lake Camelot
Of the total 597 dwellings in Lake Camelot, owner-occupied units account for 578 (96.8%), while renter-occupied units make up 19 (3.2%).
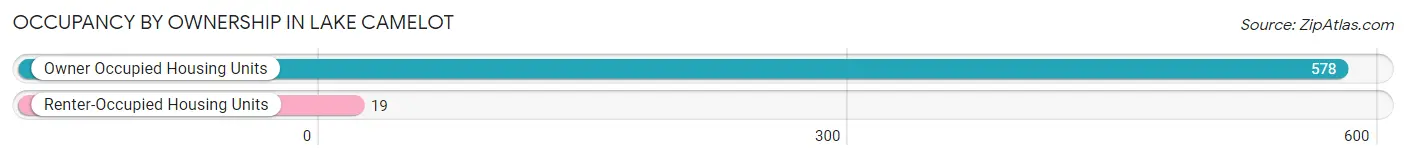
| Occupancy | # Housing Units | % Housing Units |
| Owner Occupied Housing Units | 578 | 96.8% |
| Renter-Occupied Housing Units | 19 | 3.2% |
| Total Occupied Housing Units | 597 | 100.0% |
Occupancy by Household Size in Lake Camelot
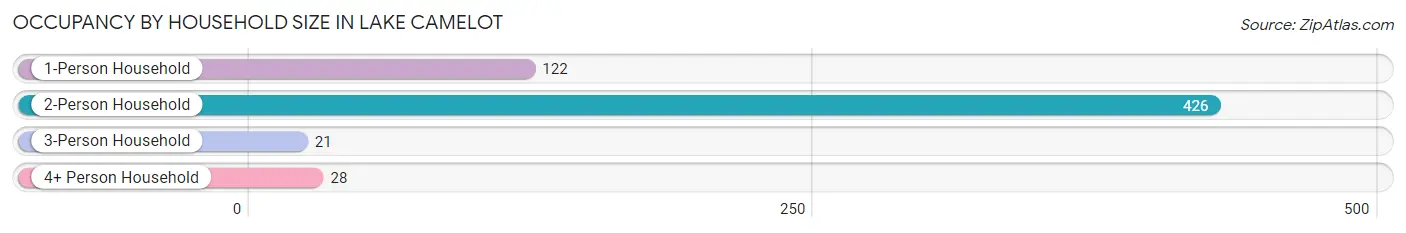
| Household Size | # Housing Units | % Housing Units |
| 1-Person Household | 122 | 20.4% |
| 2-Person Household | 426 | 71.4% |
| 3-Person Household | 21 | 3.5% |
| 4+ Person Household | 28 | 4.7% |
| Total Housing Units | 597 | 100.0% |
Occupancy by Ownership by Household Size in Lake Camelot
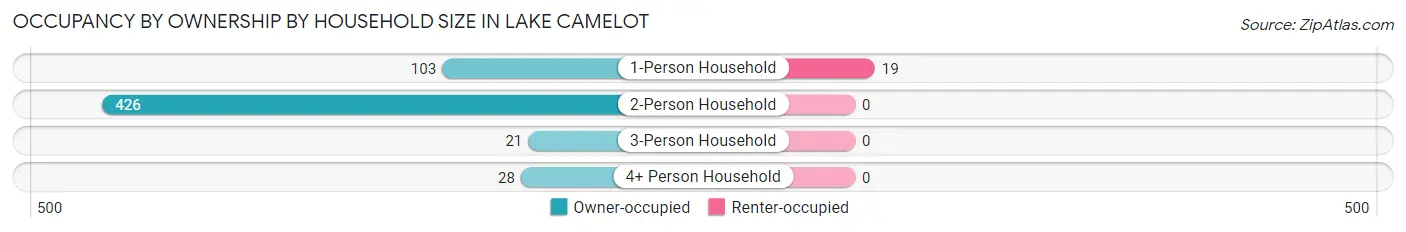
| Household Size | Owner-occupied | Renter-occupied |
| 1-Person Household | 103 (84.4%) | 19 (15.6%) |
| 2-Person Household | 426 (100.0%) | 0 (0.0%) |
| 3-Person Household | 21 (100.0%) | 0 (0.0%) |
| 4+ Person Household | 28 (100.0%) | 0 (0.0%) |
| Total Housing Units | 578 (96.8%) | 19 (3.2%) |
Occupancy by Educational Attainment in Lake Camelot
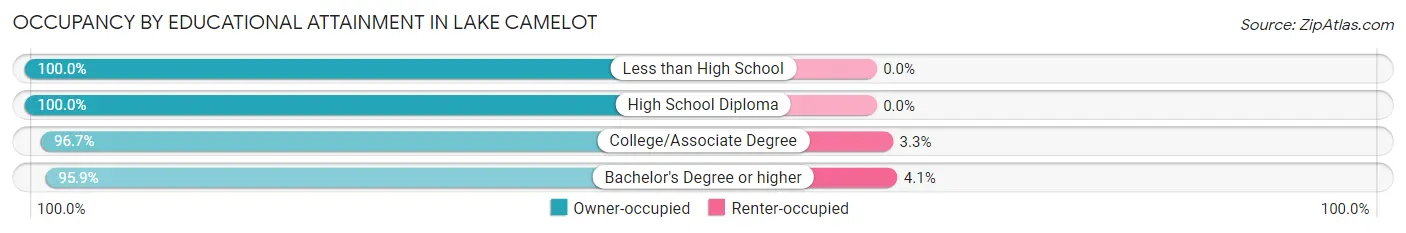
| Household Size | Owner-occupied | Renter-occupied |
| Less than High School | 18 (100.0%) | 0 (0.0%) |
| High School Diploma | 73 (100.0%) | 0 (0.0%) |
| College/Associate Degree | 207 (96.7%) | 7 (3.3%) |
| Bachelor's Degree or higher | 280 (95.9%) | 12 (4.1%) |
Occupancy by Age of Householder in Lake Camelot
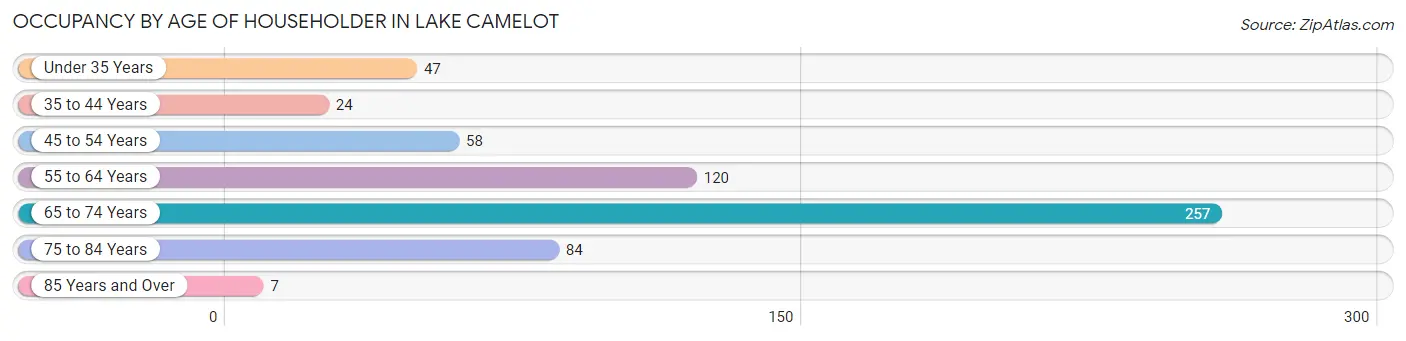
| Age Bracket | # Households | % Households |
| Under 35 Years | 47 | 7.9% |
| 35 to 44 Years | 24 | 4.0% |
| 45 to 54 Years | 58 | 9.7% |
| 55 to 64 Years | 120 | 20.1% |
| 65 to 74 Years | 257 | 43.0% |
| 75 to 84 Years | 84 | 14.1% |
| 85 Years and Over | 7 | 1.2% |
| Total | 597 | 100.0% |
Housing Finances in Lake Camelot
Median Income by Occupancy in Lake Camelot
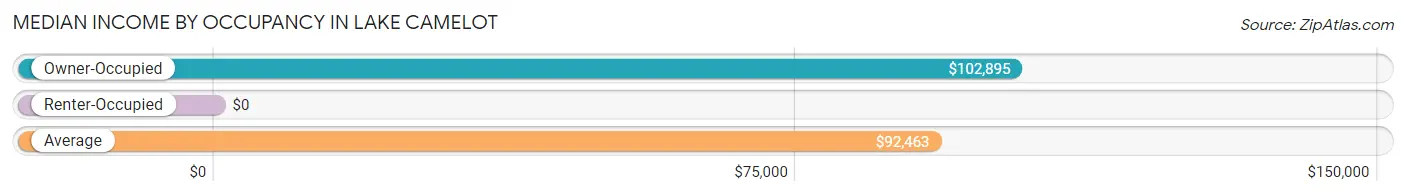
| Occupancy Type | # Households | Median Income |
| Owner-Occupied | 578 (96.8%) | $102,895 |
| Renter-Occupied | 19 (3.2%) | $0 |
| Average | 597 (100.0%) | $92,463 |
Occupancy by Householder Income Bracket in Lake Camelot
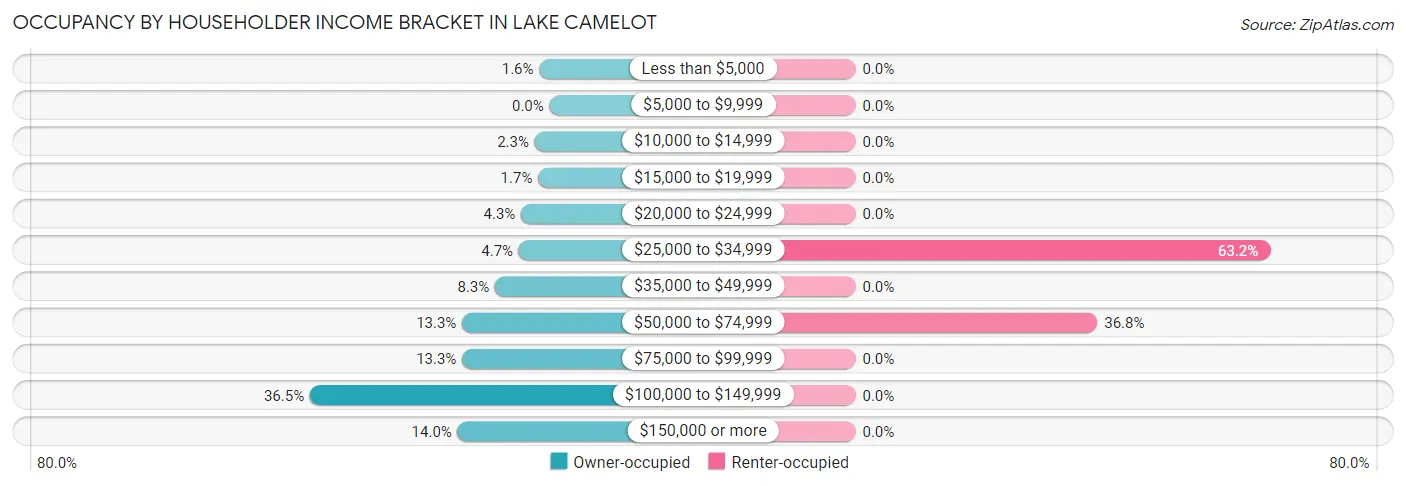
| Income Bracket | Owner-occupied | Renter-occupied |
| Less than $5,000 | 9 (1.6%) | 0 (0.0%) |
| $5,000 to $9,999 | 0 (0.0%) | 0 (0.0%) |
| $10,000 to $14,999 | 13 (2.2%) | 0 (0.0%) |
| $15,000 to $19,999 | 10 (1.7%) | 0 (0.0%) |
| $20,000 to $24,999 | 25 (4.3%) | 0 (0.0%) |
| $25,000 to $34,999 | 27 (4.7%) | 12 (63.2%) |
| $35,000 to $49,999 | 48 (8.3%) | 0 (0.0%) |
| $50,000 to $74,999 | 77 (13.3%) | 7 (36.8%) |
| $75,000 to $99,999 | 77 (13.3%) | 0 (0.0%) |
| $100,000 to $149,999 | 211 (36.5%) | 0 (0.0%) |
| $150,000 or more | 81 (14.0%) | 0 (0.0%) |
| Total | 578 (100.0%) | 19 (100.0%) |
Monthly Housing Cost Tiers in Lake Camelot
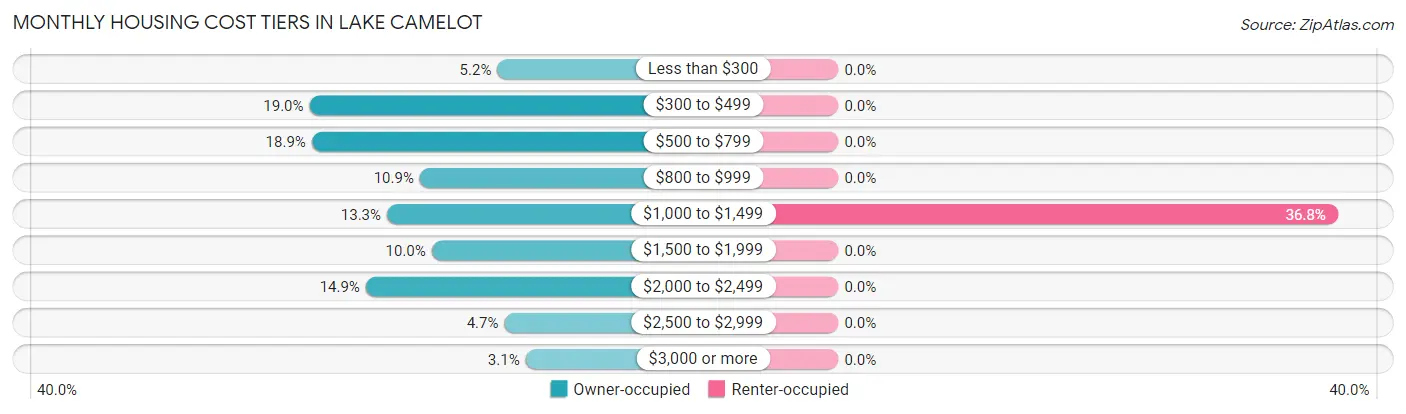
| Monthly Cost | Owner-occupied | Renter-occupied |
| Less than $300 | 30 (5.2%) | 0 (0.0%) |
| $300 to $499 | 110 (19.0%) | 0 (0.0%) |
| $500 to $799 | 109 (18.9%) | 0 (0.0%) |
| $800 to $999 | 63 (10.9%) | 0 (0.0%) |
| $1,000 to $1,499 | 77 (13.3%) | 7 (36.8%) |
| $1,500 to $1,999 | 58 (10.0%) | 0 (0.0%) |
| $2,000 to $2,499 | 86 (14.9%) | 0 (0.0%) |
| $2,500 to $2,999 | 27 (4.7%) | 0 (0.0%) |
| $3,000 or more | 18 (3.1%) | 0 (0.0%) |
| Total | 578 (100.0%) | 19 (100.0%) |
Physical Housing Characteristics in Lake Camelot
Housing Structures in Lake Camelot
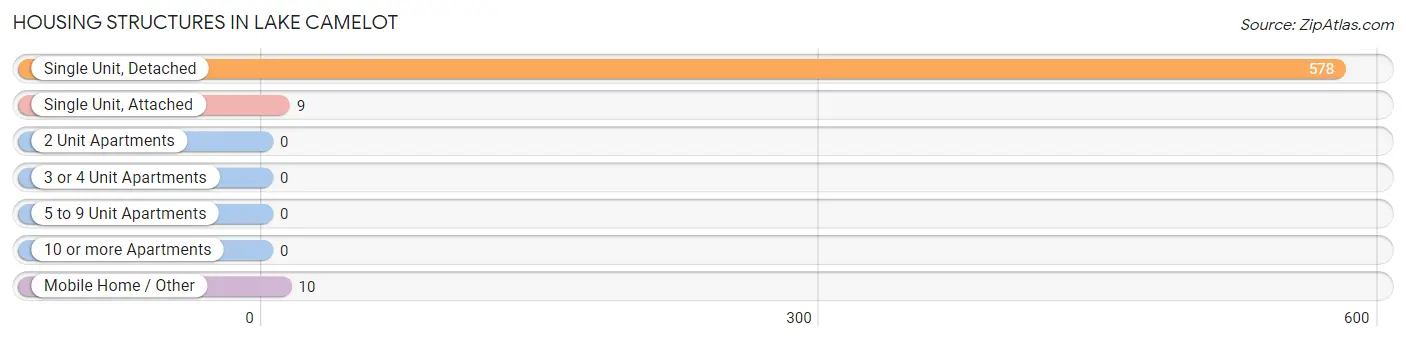
| Structure Type | # Housing Units | % Housing Units |
| Single Unit, Detached | 578 | 96.8% |
| Single Unit, Attached | 9 | 1.5% |
| 2 Unit Apartments | 0 | 0.0% |
| 3 or 4 Unit Apartments | 0 | 0.0% |
| 5 to 9 Unit Apartments | 0 | 0.0% |
| 10 or more Apartments | 0 | 0.0% |
| Mobile Home / Other | 10 | 1.7% |
| Total | 597 | 100.0% |
Housing Structures by Occupancy in Lake Camelot
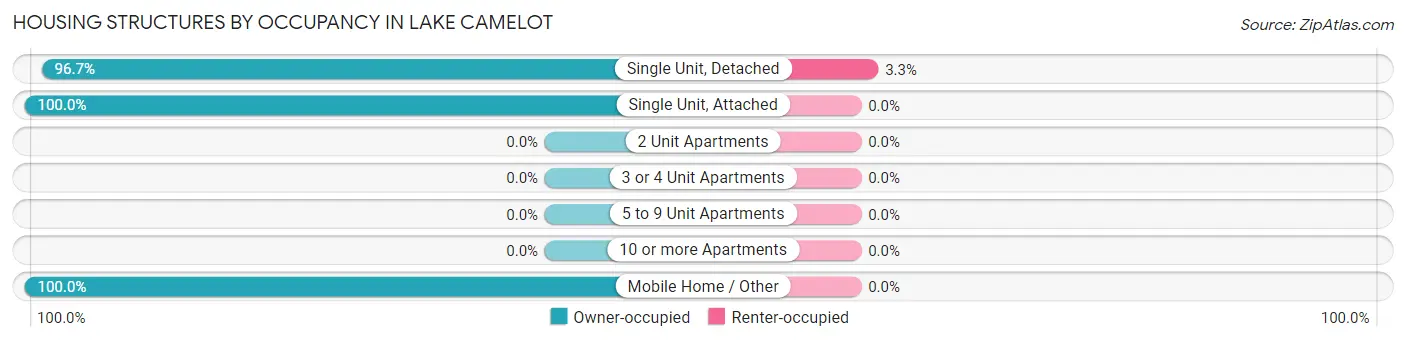
| Structure Type | Owner-occupied | Renter-occupied |
| Single Unit, Detached | 559 (96.7%) | 19 (3.3%) |
| Single Unit, Attached | 9 (100.0%) | 0 (0.0%) |
| 2 Unit Apartments | 0 (0.0%) | 0 (0.0%) |
| 3 or 4 Unit Apartments | 0 (0.0%) | 0 (0.0%) |
| 5 to 9 Unit Apartments | 0 (0.0%) | 0 (0.0%) |
| 10 or more Apartments | 0 (0.0%) | 0 (0.0%) |
| Mobile Home / Other | 10 (100.0%) | 0 (0.0%) |
| Total | 578 (96.8%) | 19 (3.2%) |
Housing Structures by Number of Rooms in Lake Camelot
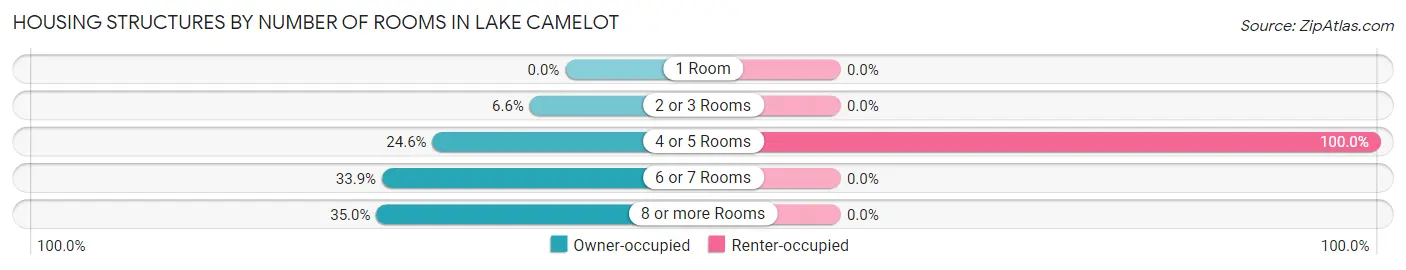
| Number of Rooms | Owner-occupied | Renter-occupied |
| 1 Room | 0 (0.0%) | 0 (0.0%) |
| 2 or 3 Rooms | 38 (6.6%) | 0 (0.0%) |
| 4 or 5 Rooms | 142 (24.6%) | 19 (100.0%) |
| 6 or 7 Rooms | 196 (33.9%) | 0 (0.0%) |
| 8 or more Rooms | 202 (34.9%) | 0 (0.0%) |
| Total | 578 (100.0%) | 19 (100.0%) |
Housing Structure by Heating Type in Lake Camelot
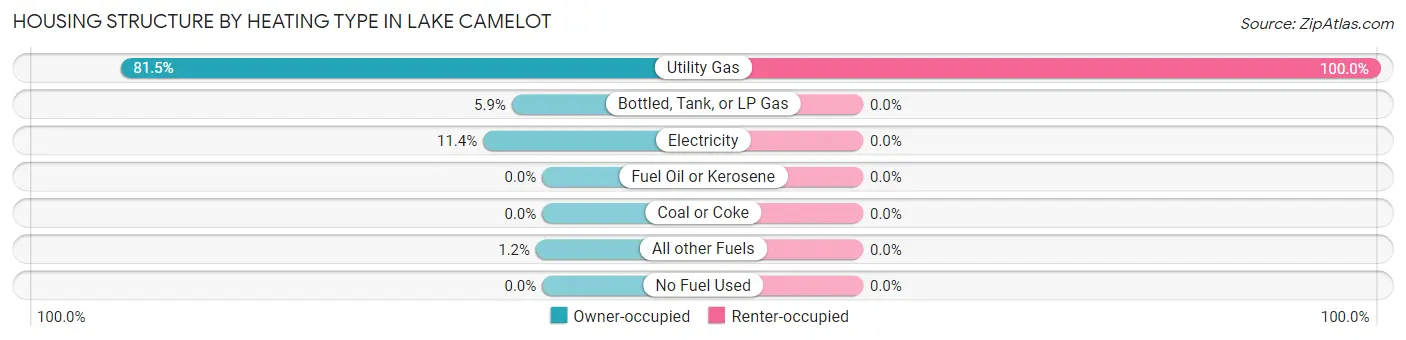
| Heating Type | Owner-occupied | Renter-occupied |
| Utility Gas | 471 (81.5%) | 19 (100.0%) |
| Bottled, Tank, or LP Gas | 34 (5.9%) | 0 (0.0%) |
| Electricity | 66 (11.4%) | 0 (0.0%) |
| Fuel Oil or Kerosene | 0 (0.0%) | 0 (0.0%) |
| Coal or Coke | 0 (0.0%) | 0 (0.0%) |
| All other Fuels | 7 (1.2%) | 0 (0.0%) |
| No Fuel Used | 0 (0.0%) | 0 (0.0%) |
| Total | 578 (100.0%) | 19 (100.0%) |
Household Vehicle Usage in Lake Camelot
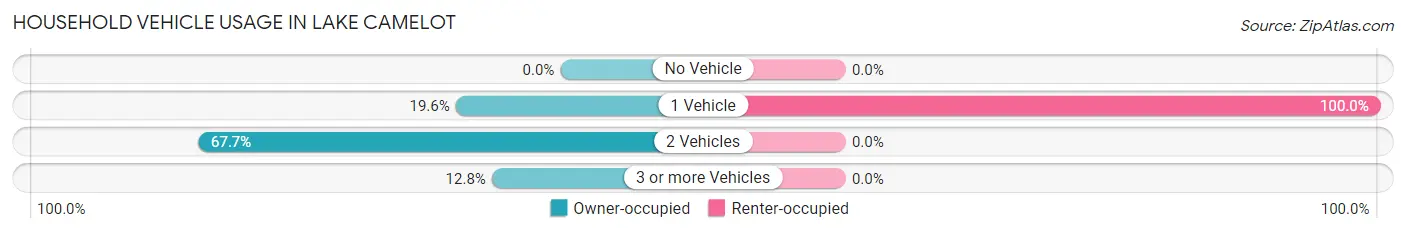
| Vehicles per Household | Owner-occupied | Renter-occupied |
| No Vehicle | 0 (0.0%) | 0 (0.0%) |
| 1 Vehicle | 113 (19.6%) | 19 (100.0%) |
| 2 Vehicles | 391 (67.6%) | 0 (0.0%) |
| 3 or more Vehicles | 74 (12.8%) | 0 (0.0%) |
| Total | 578 (100.0%) | 19 (100.0%) |
Real Estate & Mortgages in Lake Camelot
Real Estate and Mortgage Overview in Lake Camelot
| Characteristic | Without Mortgage | With Mortgage |
| Housing Units | 308 | 270 |
| Median Property Value | $196,000 | $335,300 |
| Median Household Income | $87,813 | $51 |
| Monthly Housing Costs | $554 | $18 |
| Real Estate Taxes | $3,947 | $0 |
Property Value by Mortgage Status in Lake Camelot
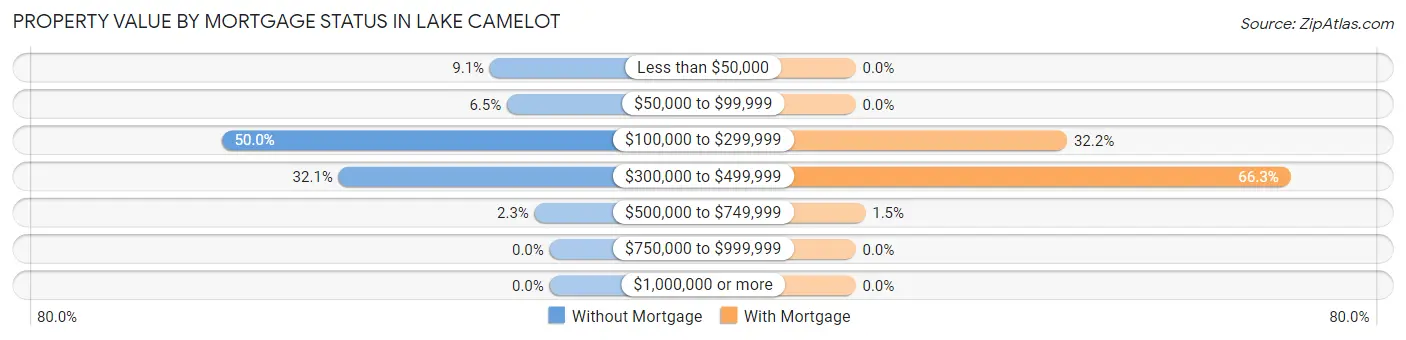
| Property Value | Without Mortgage | With Mortgage |
| Less than $50,000 | 28 (9.1%) | 0 (0.0%) |
| $50,000 to $99,999 | 20 (6.5%) | 0 (0.0%) |
| $100,000 to $299,999 | 154 (50.0%) | 87 (32.2%) |
| $300,000 to $499,999 | 99 (32.1%) | 179 (66.3%) |
| $500,000 to $749,999 | 7 (2.3%) | 4 (1.5%) |
| $750,000 to $999,999 | 0 (0.0%) | 0 (0.0%) |
| $1,000,000 or more | 0 (0.0%) | 0 (0.0%) |
| Total | 308 (100.0%) | 270 (100.0%) |
Household Income by Mortgage Status in Lake Camelot
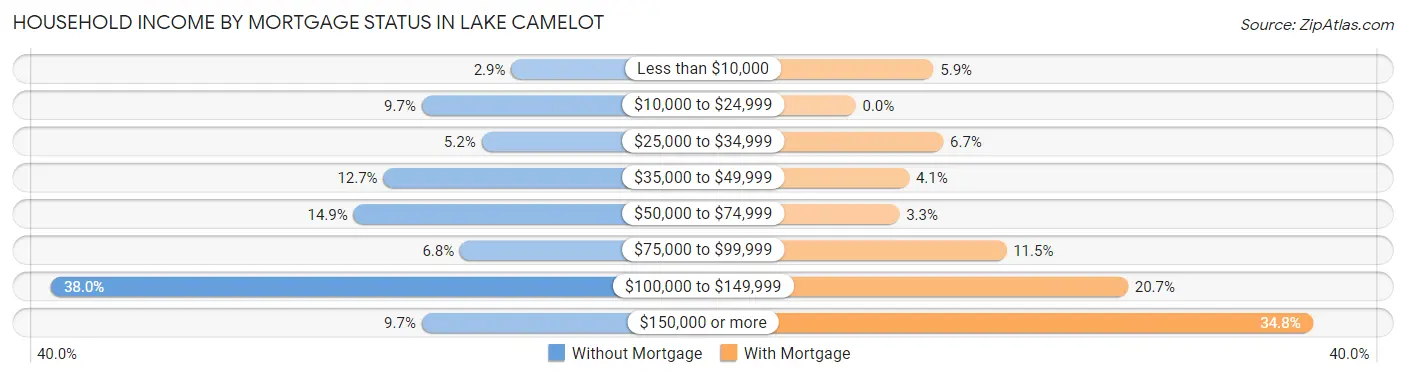
| Household Income | Without Mortgage | With Mortgage |
| Less than $10,000 | 9 (2.9%) | 16 (5.9%) |
| $10,000 to $24,999 | 30 (9.7%) | 0 (0.0%) |
| $25,000 to $34,999 | 16 (5.2%) | 18 (6.7%) |
| $35,000 to $49,999 | 39 (12.7%) | 11 (4.1%) |
| $50,000 to $74,999 | 46 (14.9%) | 9 (3.3%) |
| $75,000 to $99,999 | 21 (6.8%) | 31 (11.5%) |
| $100,000 to $149,999 | 117 (38.0%) | 56 (20.7%) |
| $150,000 or more | 30 (9.7%) | 94 (34.8%) |
| Total | 308 (100.0%) | 270 (100.0%) |
Property Value to Household Income Ratio in Lake Camelot
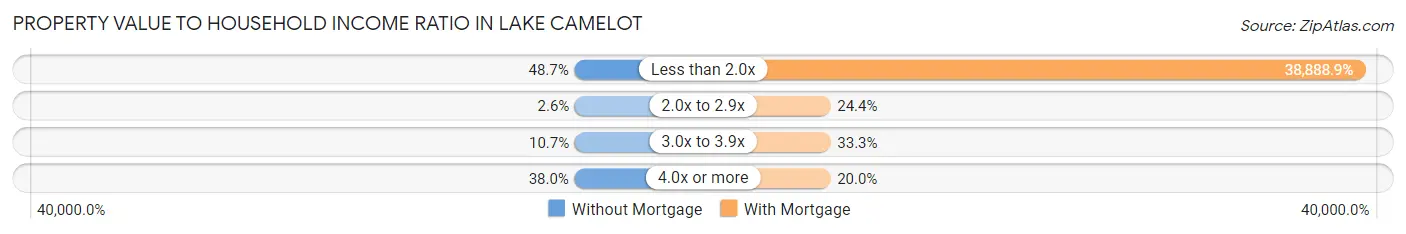
| Value-to-Income Ratio | Without Mortgage | With Mortgage |
| Less than 2.0x | 150 (48.7%) | 105,000 (38,888.9%) |
| 2.0x to 2.9x | 8 (2.6%) | 66 (24.4%) |
| 3.0x to 3.9x | 33 (10.7%) | 90 (33.3%) |
| 4.0x or more | 117 (38.0%) | 54 (20.0%) |
| Total | 308 (100.0%) | 270 (100.0%) |
Real Estate Taxes by Mortgage Status in Lake Camelot
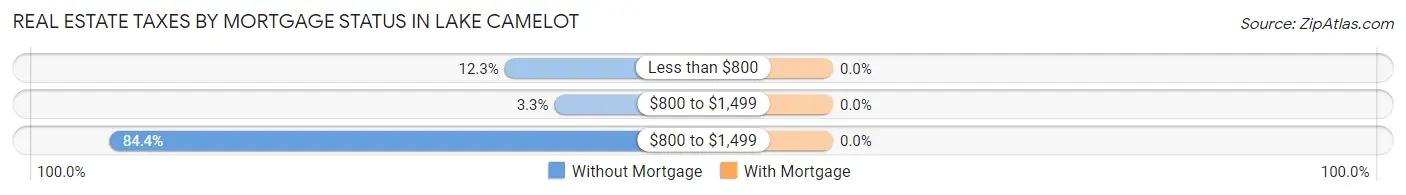
| Property Taxes | Without Mortgage | With Mortgage |
| Less than $800 | 38 (12.3%) | 0 (0.0%) |
| $800 to $1,499 | 10 (3.3%) | 0 (0.0%) |
| $800 to $1,499 | 260 (84.4%) | 0 (0.0%) |
| Total | 308 (100.0%) | 270 (100.0%) |
Health & Disability in Lake Camelot
Health Insurance Coverage by Age in Lake Camelot
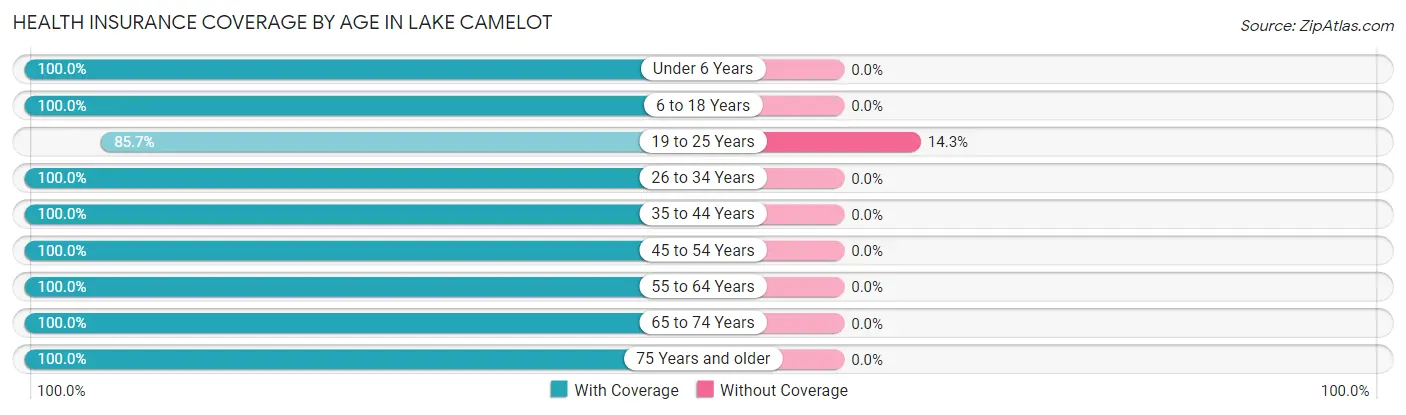
| Age Bracket | With Coverage | Without Coverage |
| Under 6 Years | 18 (100.0%) | 0 (0.0%) |
| 6 to 18 Years | 94 (100.0%) | 0 (0.0%) |
| 19 to 25 Years | 60 (85.7%) | 10 (14.3%) |
| 26 to 34 Years | 35 (100.0%) | 0 (0.0%) |
| 35 to 44 Years | 54 (100.0%) | 0 (0.0%) |
| 45 to 54 Years | 106 (100.0%) | 0 (0.0%) |
| 55 to 64 Years | 292 (100.0%) | 0 (0.0%) |
| 65 to 74 Years | 337 (100.0%) | 0 (0.0%) |
| 75 Years and older | 142 (100.0%) | 0 (0.0%) |
| Total | 1,138 (99.1%) | 10 (0.9%) |
Health Insurance Coverage by Citizenship Status in Lake Camelot
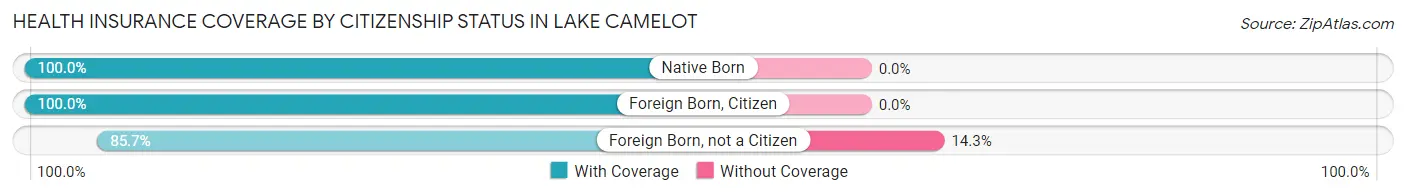
| Citizenship Status | With Coverage | Without Coverage |
| Native Born | 18 (100.0%) | 0 (0.0%) |
| Foreign Born, Citizen | 94 (100.0%) | 0 (0.0%) |
| Foreign Born, not a Citizen | 60 (85.7%) | 10 (14.3%) |
Health Insurance Coverage by Household Income in Lake Camelot
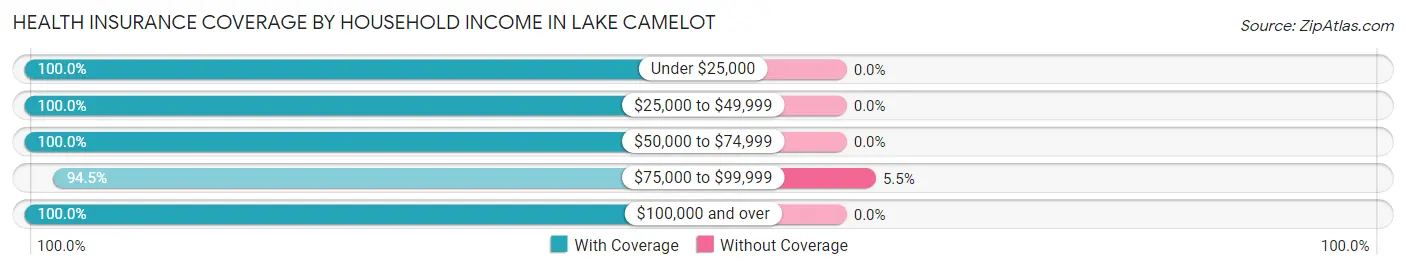
| Household Income | With Coverage | Without Coverage |
| Under $25,000 | 89 (100.0%) | 0 (0.0%) |
| $25,000 to $49,999 | 123 (100.0%) | 0 (0.0%) |
| $50,000 to $74,999 | 142 (100.0%) | 0 (0.0%) |
| $75,000 to $99,999 | 173 (94.5%) | 10 (5.5%) |
| $100,000 and over | 611 (100.0%) | 0 (0.0%) |
Public vs Private Health Insurance Coverage by Age in Lake Camelot
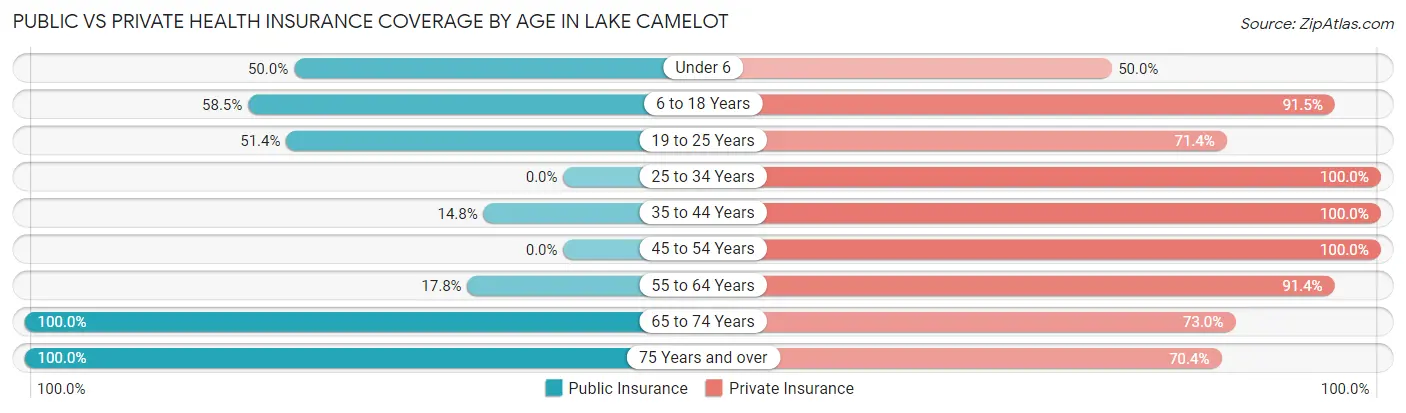
| Age Bracket | Public Insurance | Private Insurance |
| Under 6 | 9 (50.0%) | 9 (50.0%) |
| 6 to 18 Years | 55 (58.5%) | 86 (91.5%) |
| 19 to 25 Years | 36 (51.4%) | 50 (71.4%) |
| 25 to 34 Years | 0 (0.0%) | 35 (100.0%) |
| 35 to 44 Years | 8 (14.8%) | 54 (100.0%) |
| 45 to 54 Years | 0 (0.0%) | 106 (100.0%) |
| 55 to 64 Years | 52 (17.8%) | 267 (91.4%) |
| 65 to 74 Years | 337 (100.0%) | 246 (73.0%) |
| 75 Years and over | 142 (100.0%) | 100 (70.4%) |
| Total | 639 (55.7%) | 953 (83.0%) |
Disability Status by Sex by Age in Lake Camelot
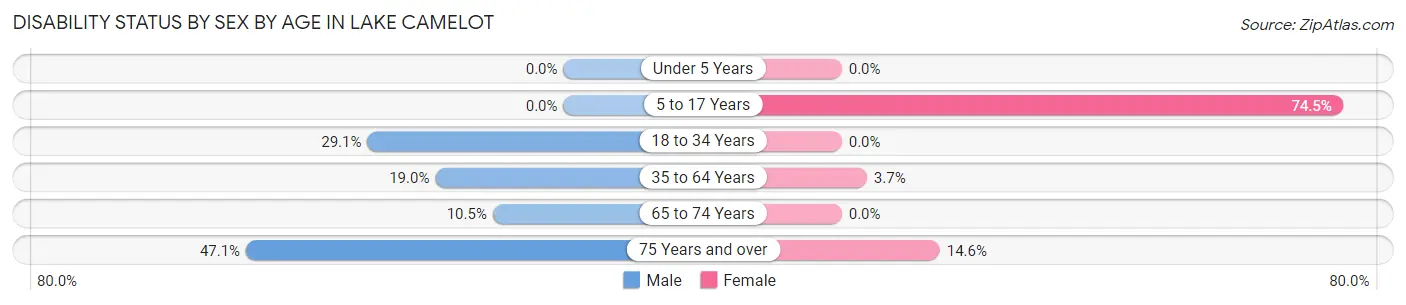
| Age Bracket | Male | Female |
| Under 5 Years | 0 (0.0%) | 0 (0.0%) |
| 5 to 17 Years | 0 (0.0%) | 38 (74.5%) |
| 18 to 34 Years | 23 (29.1%) | 0 (0.0%) |
| 35 to 64 Years | 35 (19.0%) | 10 (3.7%) |
| 65 to 74 Years | 17 (10.5%) | 0 (0.0%) |
| 75 Years and over | 41 (47.1%) | 8 (14.5%) |
Disability Class by Sex by Age in Lake Camelot
Disability Class: Hearing Difficulty
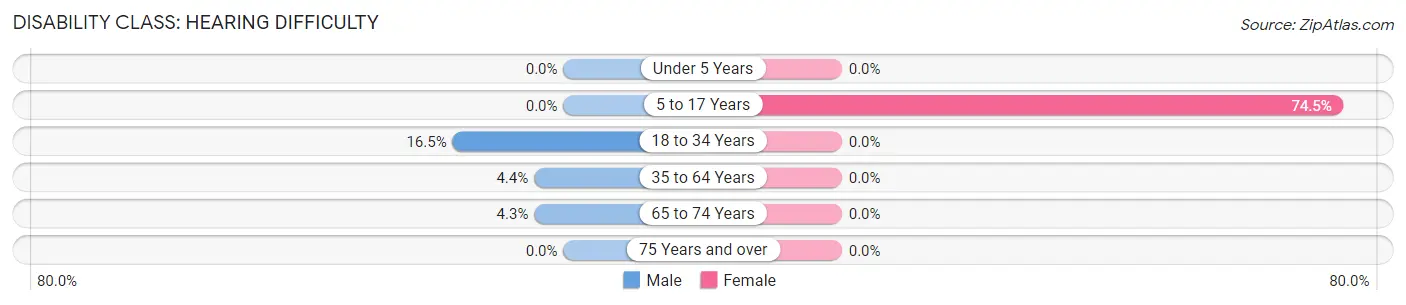
| Age Bracket | Male | Female |
| Under 5 Years | 0 (0.0%) | 0 (0.0%) |
| 5 to 17 Years | 0 (0.0%) | 38 (74.5%) |
| 18 to 34 Years | 13 (16.5%) | 0 (0.0%) |
| 35 to 64 Years | 8 (4.3%) | 0 (0.0%) |
| 65 to 74 Years | 7 (4.3%) | 0 (0.0%) |
| 75 Years and over | 0 (0.0%) | 0 (0.0%) |
Disability Class: Vision Difficulty
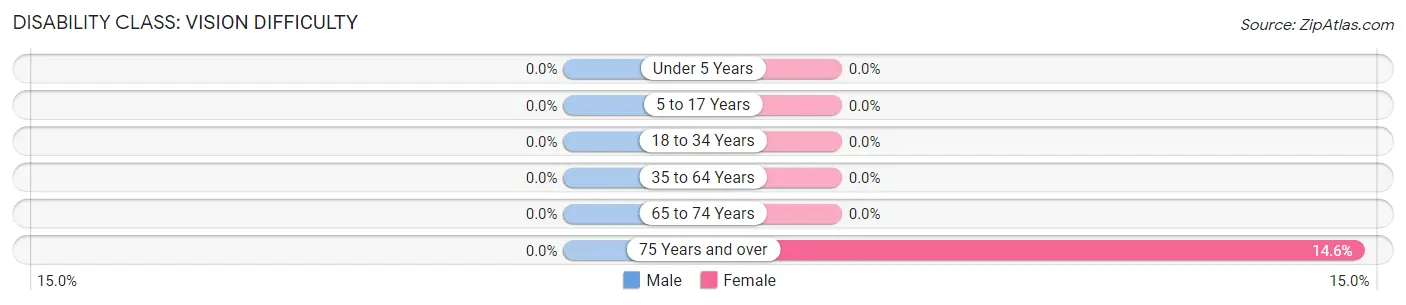
| Age Bracket | Male | Female |
| Under 5 Years | 0 (0.0%) | 0 (0.0%) |
| 5 to 17 Years | 0 (0.0%) | 0 (0.0%) |
| 18 to 34 Years | 0 (0.0%) | 0 (0.0%) |
| 35 to 64 Years | 0 (0.0%) | 0 (0.0%) |
| 65 to 74 Years | 0 (0.0%) | 0 (0.0%) |
| 75 Years and over | 0 (0.0%) | 8 (14.5%) |
Disability Class: Cognitive Difficulty
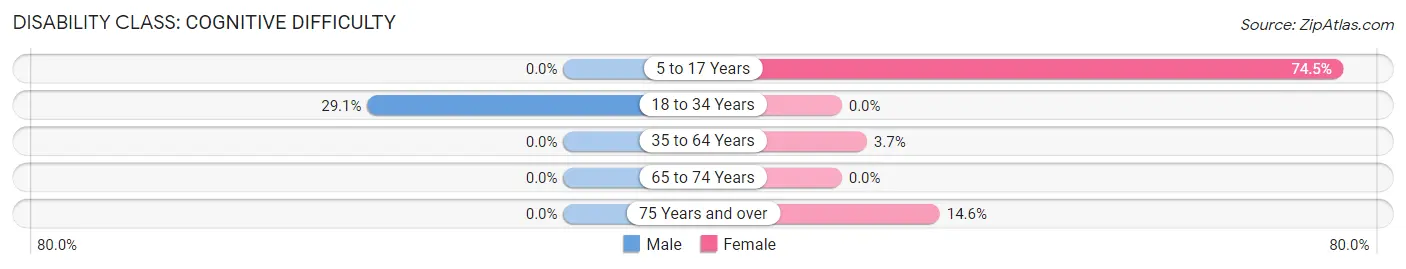
| Age Bracket | Male | Female |
| 5 to 17 Years | 0 (0.0%) | 38 (74.5%) |
| 18 to 34 Years | 23 (29.1%) | 0 (0.0%) |
| 35 to 64 Years | 0 (0.0%) | 10 (3.7%) |
| 65 to 74 Years | 0 (0.0%) | 0 (0.0%) |
| 75 Years and over | 0 (0.0%) | 8 (14.5%) |
Disability Class: Ambulatory Difficulty
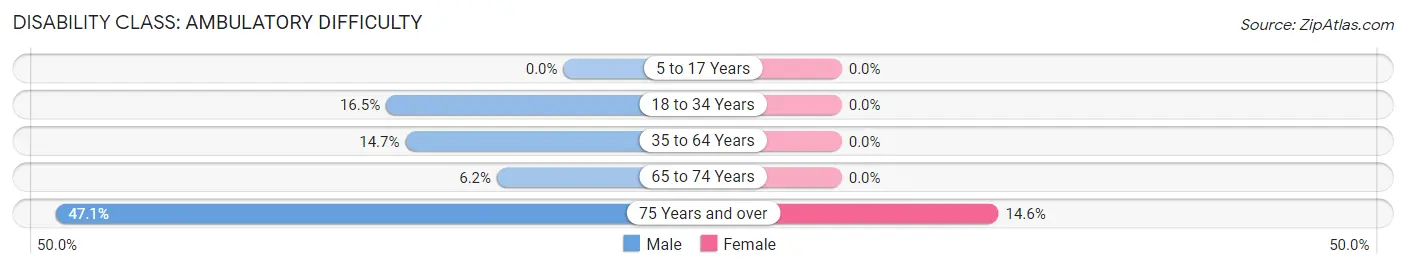
| Age Bracket | Male | Female |
| 5 to 17 Years | 0 (0.0%) | 0 (0.0%) |
| 18 to 34 Years | 13 (16.5%) | 0 (0.0%) |
| 35 to 64 Years | 27 (14.7%) | 0 (0.0%) |
| 65 to 74 Years | 10 (6.2%) | 0 (0.0%) |
| 75 Years and over | 41 (47.1%) | 8 (14.5%) |
Disability Class: Self-Care Difficulty
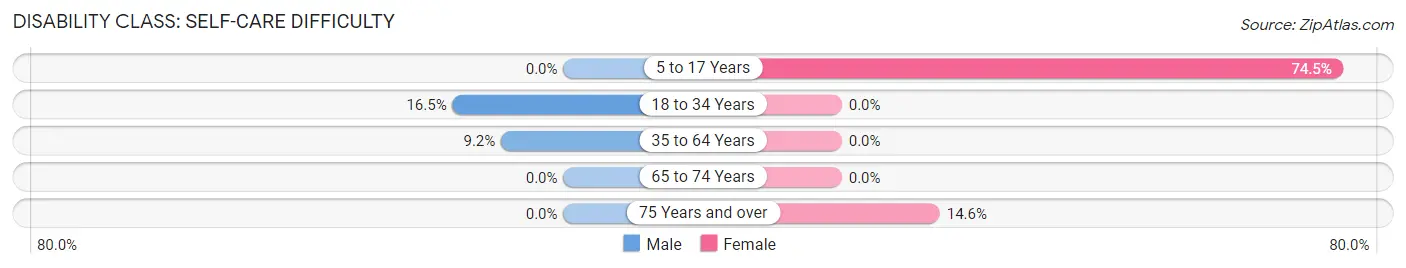
| Age Bracket | Male | Female |
| 5 to 17 Years | 0 (0.0%) | 38 (74.5%) |
| 18 to 34 Years | 13 (16.5%) | 0 (0.0%) |
| 35 to 64 Years | 17 (9.2%) | 0 (0.0%) |
| 65 to 74 Years | 0 (0.0%) | 0 (0.0%) |
| 75 Years and over | 0 (0.0%) | 8 (14.5%) |
Technology Access in Lake Camelot
Computing Device Access in Lake Camelot
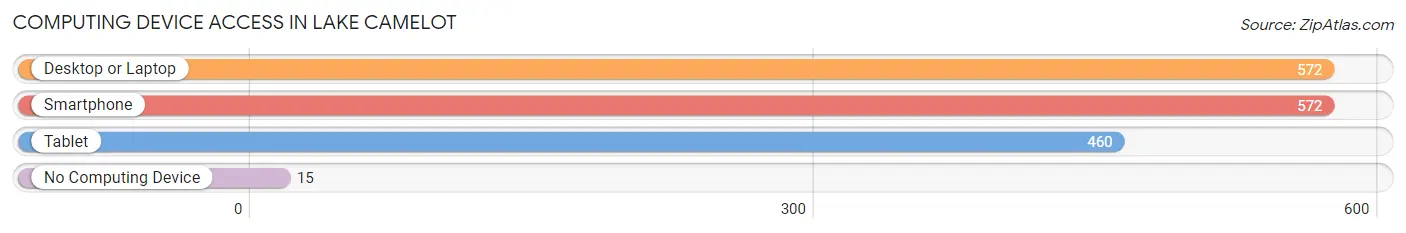
| Device Type | # Households | % Households |
| Desktop or Laptop | 572 | 95.8% |
| Smartphone | 572 | 95.8% |
| Tablet | 460 | 77.0% |
| No Computing Device | 15 | 2.5% |
| Total | 597 | 100.0% |
Internet Access in Lake Camelot
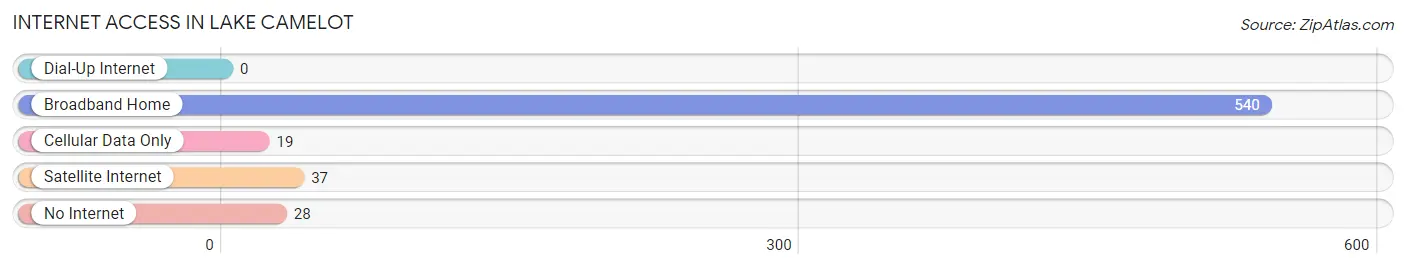
| Internet Type | # Households | % Households |
| Dial-Up Internet | 0 | 0.0% |
| Broadband Home | 540 | 90.4% |
| Cellular Data Only | 19 | 3.2% |
| Satellite Internet | 37 | 6.2% |
| No Internet | 28 | 4.7% |
| Total | 597 | 100.0% |
Lake Camelot Summary
Camelot, Wisconsin is a small village located in the southeastern corner of the state, in the county of Walworth. It is situated on the banks of Lake Camelot, a small lake that is part of the Fox River watershed. The village is home to a population of just over 1,000 people, and is known for its rural charm and small-town atmosphere.
History
The area that is now Camelot was first settled in the early 1800s by a group of settlers from New York. The settlers were attracted to the area by its abundance of natural resources, including timber and fertile soil. The village was originally known as “Camelot Corners”, and was officially incorporated in 1856.
The village was named after the legendary King Arthur’s court, and the lake was named after the village. The village was a popular destination for tourists in the late 19th and early 20th centuries, and was home to several resorts and hotels.
Geography
Camelot is located in the southeastern corner of Wisconsin, in the county of Walworth. It is situated on the banks of Lake Camelot, a small lake that is part of the Fox River watershed. The village is surrounded by rolling hills and farmland, and is located approximately 25 miles from the city of Milwaukee.
The village is located at an elevation of 890 feet above sea level, and has a total area of 1.2 square miles. The climate in Camelot is classified as humid continental, with cold winters and warm summers.
Economy
The economy of Camelot is largely based on agriculture and tourism. The village is home to several small businesses, including a grocery store, a hardware store, and a few restaurants. The village is also home to a number of small farms, which produce a variety of crops, including corn, soybeans, and hay.
Tourism is also an important part of the local economy, as the village is home to several popular attractions, including the Lake Camelot State Park, the Camelot Golf Course, and the Camelot Historical Society Museum.
Demographics
As of the 2010 census, the population of Camelot was 1,072. The racial makeup of the village was 97.3% White, 0.7% African American, 0.3% Native American, 0.2% Asian, 0.1% Pacific Islander, and 1.4% from other races. The median household income in Camelot was $50,972, and the median family income was $60,000.
Conclusion
Camelot, Wisconsin is a small village located in the southeastern corner of the state, in the county of Walworth. It is situated on the banks of Lake Camelot, a small lake that is part of the Fox River watershed. The village is home to a population of just over 1,000 people, and is known for its rural charm and small-town atmosphere. The economy of Camelot is largely based on agriculture and tourism, and the village is home to several small businesses, farms, and popular attractions. The population of Camelot is predominantly White, with a median household income of $50,972.
Common Questions
What is Per Capita Income in Lake Camelot?
Per Capita income in Lake Camelot is $49,437.
What is the Median Family Income in Lake Camelot?
Median Family Income in Lake Camelot is $106,071.
What is the Median Household income in Lake Camelot?
Median Household Income in Lake Camelot is $92,463.
What is Income or Wage Gap in Lake Camelot?
Income or Wage Gap in Lake Camelot is 2.1%.
Women in Lake Camelot earn 97.9 cents for every dollar earned by a man.
What is Inequality or Gini Index in Lake Camelot?
Inequality or Gini Index in Lake Camelot is 0.33.
What is the Total Population of Lake Camelot?
Total Population of Lake Camelot is 1,148.
What is the Total Male Population of Lake Camelot?
Total Male Population of Lake Camelot is 553.
What is the Total Female Population of Lake Camelot?
Total Female Population of Lake Camelot is 595.
What is the Ratio of Males per 100 Females in Lake Camelot?
There are 92.94 Males per 100 Females in Lake Camelot.
What is the Ratio of Females per 100 Males in Lake Camelot?
There are 107.59 Females per 100 Males in Lake Camelot.
What is the Median Population Age in Lake Camelot?
Median Population Age in Lake Camelot is 63.9 Years.
What is the Average Family Size in Lake Camelot
Average Family Size in Lake Camelot is 2.2 People.
What is the Average Household Size in Lake Camelot
Average Household Size in Lake Camelot is 1.9 People.
How Large is the Labor Force in Lake Camelot?
There are 378 People in the Labor Forcein in Lake Camelot.
What is the Percentage of People in the Labor Force in Lake Camelot?
35.9% of People are in the Labor Force in Lake Camelot.