Zip Codes with the Highest Percentage of Population Employed in Accommodation & Food Services in Oklahoma City, OK
RELATED REPORTS & OPTIONS
Accommodation & Food Services
Oklahoma City
Compare Zip Codes
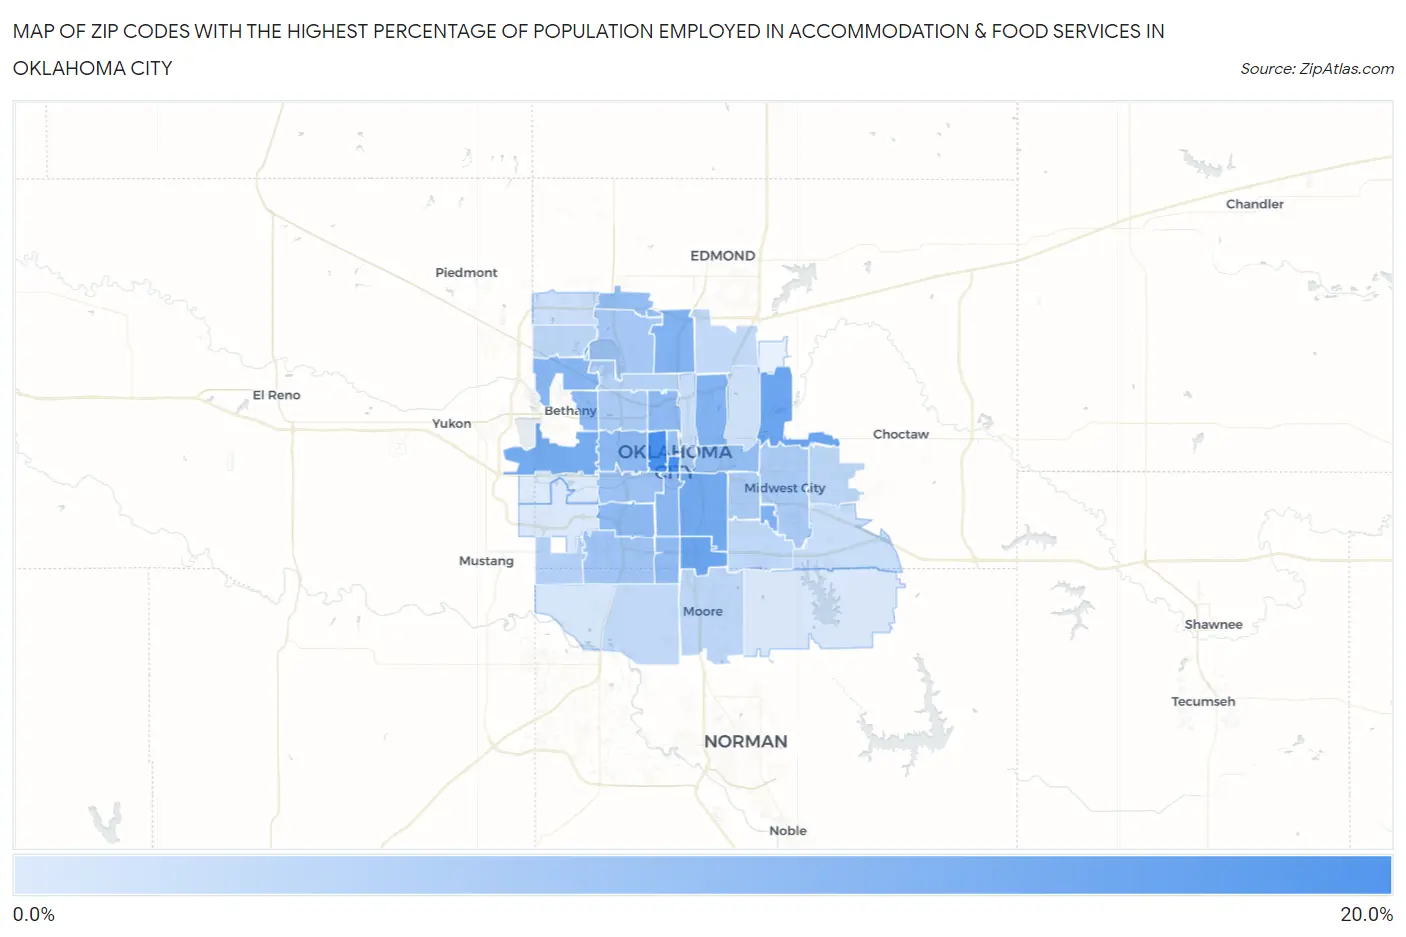
Map of Zip Codes with the Highest Percentage of Population Employed in Accommodation & Food Services in Oklahoma City
2.3%
18.2%
Zip Codes with the Highest Percentage of Population Employed in Accommodation & Food Services in Oklahoma City, OK
| Zip Code | % Employed | vs State | vs National | |
| 1. | 73106 | 18.2% | 7.0%(+11.2)#12 | 6.9%(+11.3)#1,062 |
| 2. | 73102 | 18.2% | 7.0%(+11.2)#13 | 6.9%(+11.3)#1,068 |
| 3. | 73149 | 14.0% | 7.0%(+7.02)#23 | 6.9%(+7.12)#1,969 |
| 4. | 73141 | 13.9% | 7.0%(+6.96)#24 | 6.9%(+7.07)#1,990 |
| 5. | 73129 | 13.4% | 7.0%(+6.37)#28 | 6.9%(+6.48)#2,193 |
| 6. | 73127 | 13.0% | 7.0%(+5.99)#30 | 6.9%(+6.10)#2,354 |
| 7. | 73145 | 12.0% | 7.0%(+5.01)#35 | 6.9%(+5.12)#2,825 |
| 8. | 73111 | 11.9% | 7.0%(+4.94)#36 | 6.9%(+5.04)#2,882 |
| 9. | 73114 | 11.9% | 7.0%(+4.89)#38 | 6.9%(+5.00)#2,917 |
| 10. | 73132 | 11.1% | 7.0%(+4.15)#46 | 6.9%(+4.26)#3,440 |
| 11. | 73107 | 10.8% | 7.0%(+3.86)#50 | 6.9%(+3.97)#3,677 |
| 12. | 73109 | 10.8% | 7.0%(+3.86)#51 | 6.9%(+3.97)#3,680 |
| 13. | 73122 | 10.5% | 7.0%(+3.46)#57 | 6.9%(+3.57)#4,045 |
| 14. | 73119 | 10.3% | 7.0%(+3.35)#59 | 6.9%(+3.46)#4,155 |
| 15. | 73118 | 10.2% | 7.0%(+3.25)#64 | 6.9%(+3.36)#4,256 |
| 16. | 73139 | 10.2% | 7.0%(+3.16)#67 | 6.9%(+3.27)#4,352 |
| 17. | 73134 | 9.9% | 7.0%(+2.95)#74 | 6.9%(+3.06)#4,624 |
| 18. | 73117 | 9.7% | 7.0%(+2.76)#78 | 6.9%(+2.87)#4,863 |
| 19. | 73103 | 9.3% | 7.0%(+2.32)#84 | 6.9%(+2.42)#5,493 |
| 20. | 73108 | 9.0% | 7.0%(+2.02)#92 | 6.9%(+2.13)#5,943 |
| 21. | 73159 | 8.3% | 7.0%(+1.28)#118 | 6.9%(+1.39)#7,270 |
| 22. | 73120 | 7.9% | 7.0%(+0.922)#135 | 6.9%(+1.03)#8,003 |
| 23. | 73104 | 7.8% | 7.0%(+0.856)#139 | 6.9%(+0.965)#8,158 |
| 24. | 73115 | 7.5% | 7.0%(+0.466)#165 | 6.9%(+0.575)#9,091 |
| 25. | 73112 | 7.4% | 7.0%(+0.426)#167 | 6.9%(+0.535)#9,209 |
| 26. | 73110 | 7.4% | 7.0%(+0.412)#169 | 6.9%(+0.520)#9,257 |
| 27. | 73169 | 6.6% | 7.0%(-0.402)#215 | 6.9%(-0.294)#11,561 |
| 28. | 73116 | 6.3% | 7.0%(-0.738)#234 | 6.9%(-0.630)#12,626 |
| 29. | 73130 | 5.6% | 7.0%(-1.35)#266 | 6.9%(-1.24)#14,563 |
| 30. | 73160 | 5.5% | 7.0%(-1.48)#278 | 6.9%(-1.37)#15,013 |
| 31. | 73162 | 5.5% | 7.0%(-1.53)#280 | 6.9%(-1.42)#15,177 |
| 32. | 73135 | 5.2% | 7.0%(-1.78)#296 | 6.9%(-1.67)#16,073 |
| 33. | 73131 | 5.2% | 7.0%(-1.84)#301 | 6.9%(-1.73)#16,266 |
| 34. | 73170 | 5.1% | 7.0%(-1.91)#313 | 6.9%(-1.80)#16,550 |
| 35. | 73150 | 4.4% | 7.0%(-2.55)#354 | 6.9%(-2.44)#18,692 |
| 36. | 73105 | 4.4% | 7.0%(-2.58)#356 | 6.9%(-2.47)#18,783 |
| 37. | 73142 | 4.0% | 7.0%(-2.97)#389 | 6.9%(-2.86)#20,090 |
| 38. | 73121 | 3.6% | 7.0%(-3.35)#411 | 6.9%(-3.24)#21,333 |
| 39. | 73173 | 3.0% | 7.0%(-4.01)#457 | 6.9%(-3.90)#23,266 |
| 40. | 73165 | 2.8% | 7.0%(-4.20)#472 | 6.9%(-4.09)#23,784 |
| 41. | 73179 | 2.5% | 7.0%(-4.53)#488 | 6.9%(-4.42)#24,593 |
| 42. | 73128 | 2.3% | 7.0%(-4.69)#496 | 6.9%(-4.58)#24,935 |
1
Common Questions
What are the Top 10 Zip Codes with the Highest Percentage of Population Employed in Accommodation & Food Services in Oklahoma City, OK?
Top 10 Zip Codes with the Highest Percentage of Population Employed in Accommodation & Food Services in Oklahoma City, OK are:
What zip code has the Highest Percentage of Population Employed in Accommodation & Food Services in Oklahoma City, OK?
73106 has the Highest Percentage of Population Employed in Accommodation & Food Services in Oklahoma City, OK with 18.2%.
What is the Percentage of Population Employed in Accommodation & Food Services in Oklahoma City, OK?
Percentage of Population Employed in Accommodation & Food Services in Oklahoma City is 7.9%.
What is the Percentage of Population Employed in Accommodation & Food Services in Oklahoma?
Percentage of Population Employed in Accommodation & Food Services in Oklahoma is 7.0%.
What is the Percentage of Population Employed in Accommodation & Food Services in the United States?
Percentage of Population Employed in Accommodation & Food Services in the United States is 6.9%.