Zip Codes with the Highest Percentage of Households with Income Above $100,000 in Oklahoma City, OK
RELATED REPORTS & OPTIONS
Household Income | $100k+
Oklahoma City
Compare Zip Codes
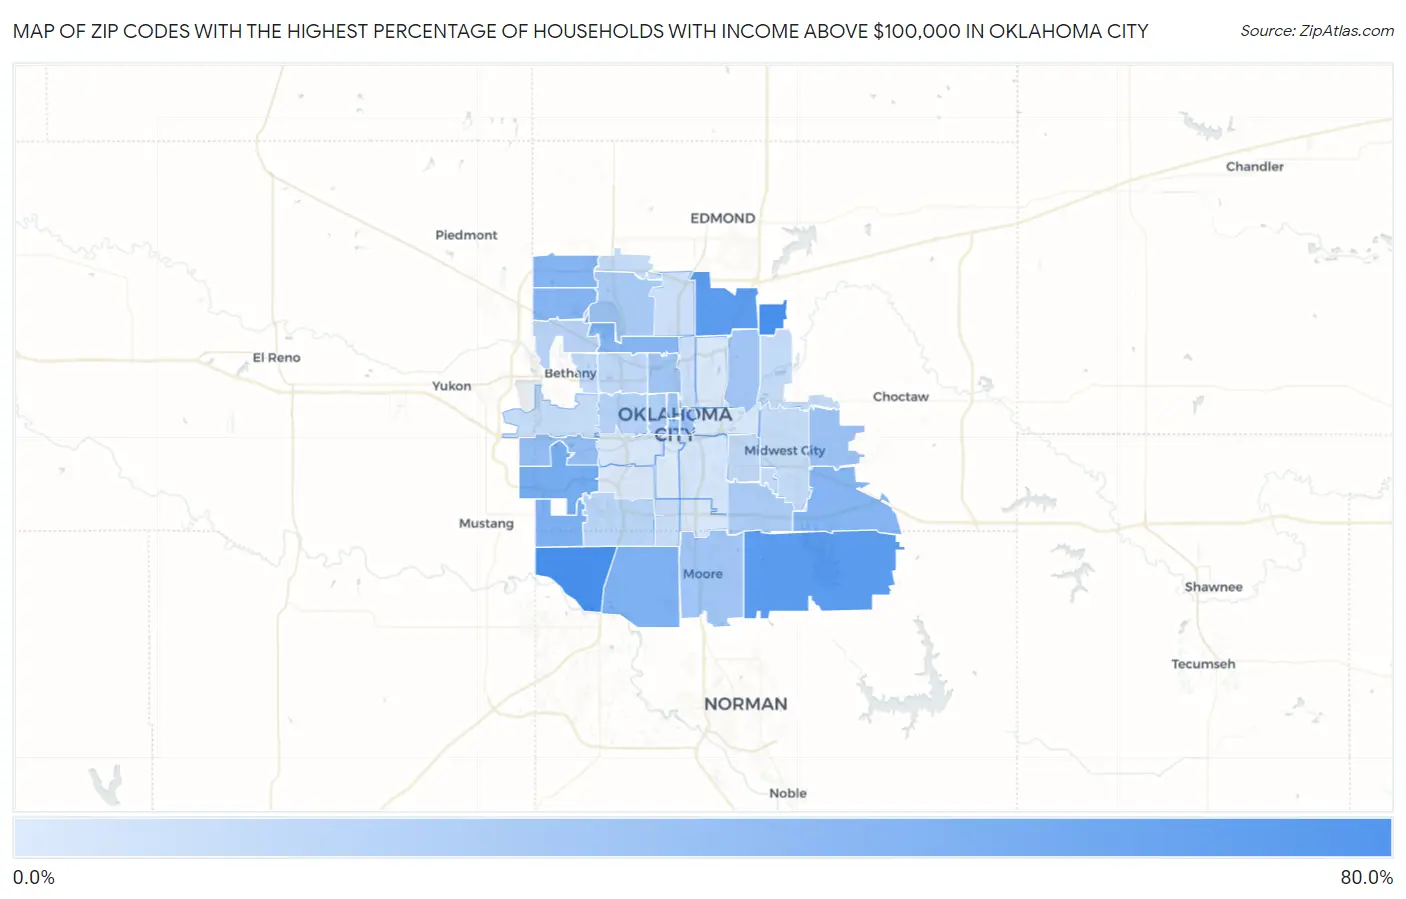
Map of Zip Codes with the Highest Percentage of Households with Income Above $100,000 in Oklahoma City
7.6%
73.1%
Zip Codes with the Highest Percentage of Households with Income Above $100,000 in Oklahoma City, OK
| Zip Code | Households with Income > $100k | vs State | vs National | |
| 1. | 73173 | 73.1% | 27.9%(+45.2)#2 | 37.3%(+35.8)#696 |
| 2. | 73151 | 72.6% | 27.9%(+44.7)#3 | 37.3%(+35.3)#734 |
| 3. | 73165 | 62.3% | 27.9%(+34.4)#7 | 37.3%(+25.0)#1,959 |
| 4. | 73131 | 61.6% | 27.9%(+33.7)#9 | 37.3%(+24.3)#2,068 |
| 5. | 73179 | 49.8% | 27.9%(+21.9)#23 | 37.3%(+12.5)#4,932 |
| 6. | 73169 | 46.2% | 27.9%(+18.3)#33 | 37.3%(+8.90)#6,136 |
| 7. | 73170 | 45.0% | 27.9%(+17.1)#36 | 37.3%(+7.70)#6,615 |
| 8. | 73142 | 42.5% | 27.9%(+14.6)#46 | 37.3%(+5.20)#7,677 |
| 9. | 73150 | 42.5% | 27.9%(+14.6)#47 | 37.3%(+5.20)#7,688 |
| 10. | 73162 | 42.3% | 27.9%(+14.4)#48 | 37.3%(+5.00)#7,760 |
| 11. | 73116 | 41.6% | 27.9%(+13.7)#52 | 37.3%(+4.30)#8,082 |
| 12. | 73128 | 36.3% | 27.9%(+8.40)#90 | 37.3%(-1.00)#10,990 |
| 13. | 73130 | 32.8% | 27.9%(+4.90)#126 | 37.3%(-4.50)#13,267 |
| 14. | 73102 | 32.6% | 27.9%(+4.70)#128 | 37.3%(-4.70)#13,411 |
| 15. | 73103 | 32.5% | 27.9%(+4.60)#132 | 37.3%(-4.80)#13,476 |
| 16. | 73104 | 32.1% | 27.9%(+4.20)#138 | 37.3%(-5.20)#13,801 |
| 17. | 73160 | 30.2% | 27.9%(+2.30)#164 | 37.3%(-7.10)#15,259 |
| 18. | 73118 | 30.0% | 27.9%(+2.10)#168 | 37.3%(-7.30)#15,454 |
| 19. | 73121 | 29.8% | 27.9%(+1.90)#169 | 37.3%(-7.50)#15,613 |
| 20. | 73120 | 27.4% | 27.9%(-0.500)#205 | 37.3%(-9.90)#17,628 |
| 21. | 73135 | 26.0% | 27.9%(-1.90)#234 | 37.3%(-11.3)#18,859 |
| 22. | 73106 | 24.5% | 27.9%(-3.40)#262 | 37.3%(-12.8)#20,198 |
| 23. | 73107 | 22.4% | 27.9%(-5.50)#325 | 37.3%(-14.9)#22,049 |
| 24. | 73132 | 21.2% | 27.9%(-6.70)#352 | 37.3%(-16.1)#23,067 |
| 25. | 73159 | 20.2% | 27.9%(-7.70)#375 | 37.3%(-17.1)#23,869 |
| 26. | 73112 | 18.6% | 27.9%(-9.30)#412 | 37.3%(-18.7)#25,102 |
| 27. | 73115 | 17.2% | 27.9%(-10.7)#442 | 37.3%(-20.1)#26,087 |
| 28. | 73122 | 17.2% | 27.9%(-10.7)#444 | 37.3%(-20.1)#26,095 |
| 29. | 73134 | 17.0% | 27.9%(-10.9)#449 | 37.3%(-20.3)#26,233 |
| 30. | 73141 | 16.7% | 27.9%(-11.2)#455 | 37.3%(-20.6)#26,456 |
| 31. | 73145 | 16.6% | 27.9%(-11.3)#457 | 37.3%(-20.7)#26,516 |
| 32. | 73110 | 16.1% | 27.9%(-11.8)#470 | 37.3%(-21.2)#26,846 |
| 33. | 73127 | 15.4% | 27.9%(-12.5)#490 | 37.3%(-21.9)#27,300 |
| 34. | 73139 | 14.9% | 27.9%(-13.0)#503 | 37.3%(-22.4)#27,606 |
| 35. | 73105 | 14.3% | 27.9%(-13.6)#525 | 37.3%(-23.0)#27,940 |
| 36. | 73114 | 13.1% | 27.9%(-14.8)#550 | 37.3%(-24.2)#28,535 |
| 37. | 73129 | 10.8% | 27.9%(-17.1)#584 | 37.3%(-26.5)#29,525 |
| 38. | 73111 | 9.5% | 27.9%(-18.4)#601 | 37.3%(-27.8)#29,983 |
| 39. | 73149 | 9.3% | 27.9%(-18.6)#603 | 37.3%(-28.0)#30,052 |
| 40. | 73117 | 9.2% | 27.9%(-18.7)#606 | 37.3%(-28.1)#30,086 |
| 41. | 73108 | 9.1% | 27.9%(-18.8)#608 | 37.3%(-28.2)#30,115 |
| 42. | 73119 | 8.1% | 27.9%(-19.8)#615 | 37.3%(-29.2)#30,403 |
| 43. | 73109 | 7.6% | 27.9%(-20.3)#618 | 37.3%(-29.7)#30,533 |
1
Common Questions
What are the Top 10 Zip Codes with the Highest Percentage of Households with Income Above $100,000 in Oklahoma City, OK?
Top 10 Zip Codes with the Highest Percentage of Households with Income Above $100,000 in Oklahoma City, OK are:
What zip code has the Highest Percentage of Households with Income Above $100,000 in Oklahoma City, OK?
73173 has the Highest Percentage of Households with Income Above $100,000 in Oklahoma City, OK with 73.1%.
What is the Percentage of Households with Income Above $100,000 in Oklahoma City, OK?
Percentage of Households with Income Above $100,000 in Oklahoma City is 29.9%.
What is the Percentage of Households with Income Above $100,000 in Oklahoma?
Percentage of Households with Income Above $100,000 in Oklahoma is 27.9%.
What is the Percentage of Households with Income Above $100,000 in the United States?
Percentage of Households with Income Above $100,000 in the United States is 37.3%.