Zip Codes with the Highest Percentage of Population Employed in Administrative & Support Services in Oklahoma City, OK

RELATED REPORTS & OPTIONS

Administrative & Support Services
Population
Families and Households
Female Fertility
Female Fertility (Unmarried)
Race (Community Size)
Race (Percentage)
Ancestry (Community Size)
AfricanAlaska NativeAlbanianAmericanApacheArabArapahoArgentineanArmenianAustralianAustrianBahamianBangladeshiBarbadianBasqueBelgianBhutaneseBlackfeetBolivianBrazilianBritishBritish West IndianBulgarianBurmeseCajunCambodianCanadianCelticCentral AmericanCentral American IndianCherokeeCheyenneChickasawChileanChippewaChoctawColombianComancheCreeCreekCroatianCubanCzechCzechoslovakianDanishDelawareDominicanDutchDutch West IndianEastern EuropeanEcuadorianEgyptianEnglishEstonianEthiopianEuropeanFijianFilipinoFinnishFrenchFrench American IndianFrench CanadianGermanGerman RussianGhanaianGreekGuamanian / ChamorroGuatemalanGuyaneseHaitianHonduranHopiHungarianIcelanderIndian (Asian)IndonesianInupiatIranianIraqiIrishIroquoisIsraeliItalianJamaicanJapaneseJordanianKenyanKiowaKoreanLaotianLatvianLebaneseLiberianLithuanianLuxembourgerMalaysianMexicanMexican American IndianMongolianMoroccanNative HawaiianNavajoNew ZealanderNicaraguanNigerianNorthern EuropeanNorwegianOkinawanOsagePakistaniPalestinianPanamanianPennsylvania GermanPeruvianPimaPolishPortuguesePotawatomiPuebloPuerto RicanRomanianRussianSalvadoranSamoanScandinavianScotch-IrishScottishSeminoleSerbianSiouxSlavicSlovakSloveneSouth AfricanSouth AmericanSouth American IndianSpaniardSpanishSpanish American IndianSri LankanSubsaharan AfricanSudaneseSwedishSwissSyrianThaiTlingit-HaidaTonganTrinidadian and TobagonianTurkishU.S. Virgin IslanderUkrainianUruguayanVenezuelanVietnameseWelshWest IndianYugoslavianZimbabwean
Ancestry (Percentage)
AfricanAlaska NativeAlbanianAmericanApacheArabArapahoArgentineanArmenianAustralianAustrianBahamianBangladeshiBarbadianBasqueBelgianBhutaneseBlackfeetBolivianBrazilianBritishBritish West IndianBulgarianBurmeseCajunCambodianCanadianCelticCentral AmericanCentral American IndianCherokeeCheyenneChickasawChileanChippewaChoctawColombianComancheCreeCreekCroatianCubanCzechCzechoslovakianDanishDelawareDominicanDutchDutch West IndianEastern EuropeanEcuadorianEgyptianEnglishEstonianEthiopianEuropeanFijianFilipinoFinnishFrenchFrench American IndianFrench CanadianGermanGerman RussianGhanaianGreekGuamanian / ChamorroGuatemalanGuyaneseHaitianHonduranHopiHungarianIcelanderIndian (Asian)IndonesianInupiatIranianIraqiIrishIroquoisIsraeliItalianJamaicanJapaneseJordanianKenyanKiowaKoreanLaotianLatvianLebaneseLiberianLithuanianLuxembourgerMalaysianMexicanMexican American IndianMongolianMoroccanNative HawaiianNavajoNew ZealanderNicaraguanNigerianNorthern EuropeanNorwegianOkinawanOsagePakistaniPalestinianPanamanianPennsylvania GermanPeruvianPimaPolishPortuguesePotawatomiPuebloPuerto RicanRomanianRussianSalvadoranSamoanScandinavianScotch-IrishScottishSeminoleSerbianSiouxSlavicSlovakSloveneSouth AfricanSouth AmericanSouth American IndianSpaniardSpanishSpanish American IndianSri LankanSubsaharan AfricanSudaneseSwedishSwissSyrianThaiTlingit-HaidaTonganTrinidadian and TobagonianTurkishU.S. Virgin IslanderUkrainianUruguayanVenezuelanVietnameseWelshWest IndianYugoslavianZimbabwean
Immigrant Origin (Total)
AfricaArgentinaAsiaAustraliaAustriaBahamasBangladeshBosnia and HerzegovinaBrazilBulgariaBurma / MyanmarCambodiaCameroonCanadaCaribbeanCentral AmericaChileChinaColombiaCubaDominican RepublicEastern AfricaEastern AsiaEastern EuropeEcuadorEgyptEl SalvadorEnglandEritreaEthiopiaEuropeFranceGermanyGhanaGreeceGuatemalaHondurasHong KongIndiaIndonesiaIranIraqIrelandItalyJamaicaJapanJordanKazakhstanKenyaKoreaKuwaitLaosLatin AmericaLebanonLiberiaMalaysiaMexicoMiddle AfricaMoroccoNepalNetherlandsNicaraguaNigeriaNorthern AfricaNorthern EuropeNorwayOceaniaPakistanPanamaPeruPhilippinesPolandPortugalRussiaSaudi ArabiaScotlandSingaporeSouth AfricaSouth AmericaSouth Central AsiaSouth Eastern AsiaSouthern EuropeSpainSudanSyriaTaiwanThailandTrinidad and TobagoTurkeyUkraineVenezuelaVietnamWestern AfricaWestern AsiaWestern EuropeZaireZimbabwe
Immigrant Origin (Percentage)
AfricaArgentinaAsiaAustraliaAustriaBahamasBangladeshBosnia and HerzegovinaBrazilBulgariaBurma / MyanmarCambodiaCameroonCanadaCaribbeanCentral AmericaChileChinaColombiaCubaDominican RepublicEastern AfricaEastern AsiaEastern EuropeEcuadorEgyptEl SalvadorEnglandEritreaEthiopiaEuropeFranceGermanyGhanaGreeceGuatemalaHondurasHong KongIndiaIndonesiaIranIraqIrelandItalyJamaicaJapanJordanKazakhstanKenyaKoreaKuwaitLaosLatin AmericaLebanonLiberiaMalaysiaMexicoMiddle AfricaMoroccoNepalNetherlandsNicaraguaNigeriaNorthern AfricaNorthern EuropeNorwayOceaniaPakistanPanamaPeruPhilippinesPolandPortugalRussiaSaudi ArabiaScotlandSingaporeSouth AfricaSouth AmericaSouth Central AsiaSouth Eastern AsiaSouthern EuropeSpainSudanSyriaTaiwanThailandTrinidad and TobagoTurkeyUkraineVenezuelaVietnamWestern AfricaWestern AsiaWestern EuropeZaireZimbabwe
Income
Income (Families)
Income (Households)
Poverty
Poverty (Families)
Unemployment
Employment Occupations
Employment Industries
Employer Class
Commute Time
Commute Means
School Enrollment
Education by Degree Field
Occupancy
Finances
Physical Characteristics
Oklahoma City
Compare Zip Codes
Comparison Subject

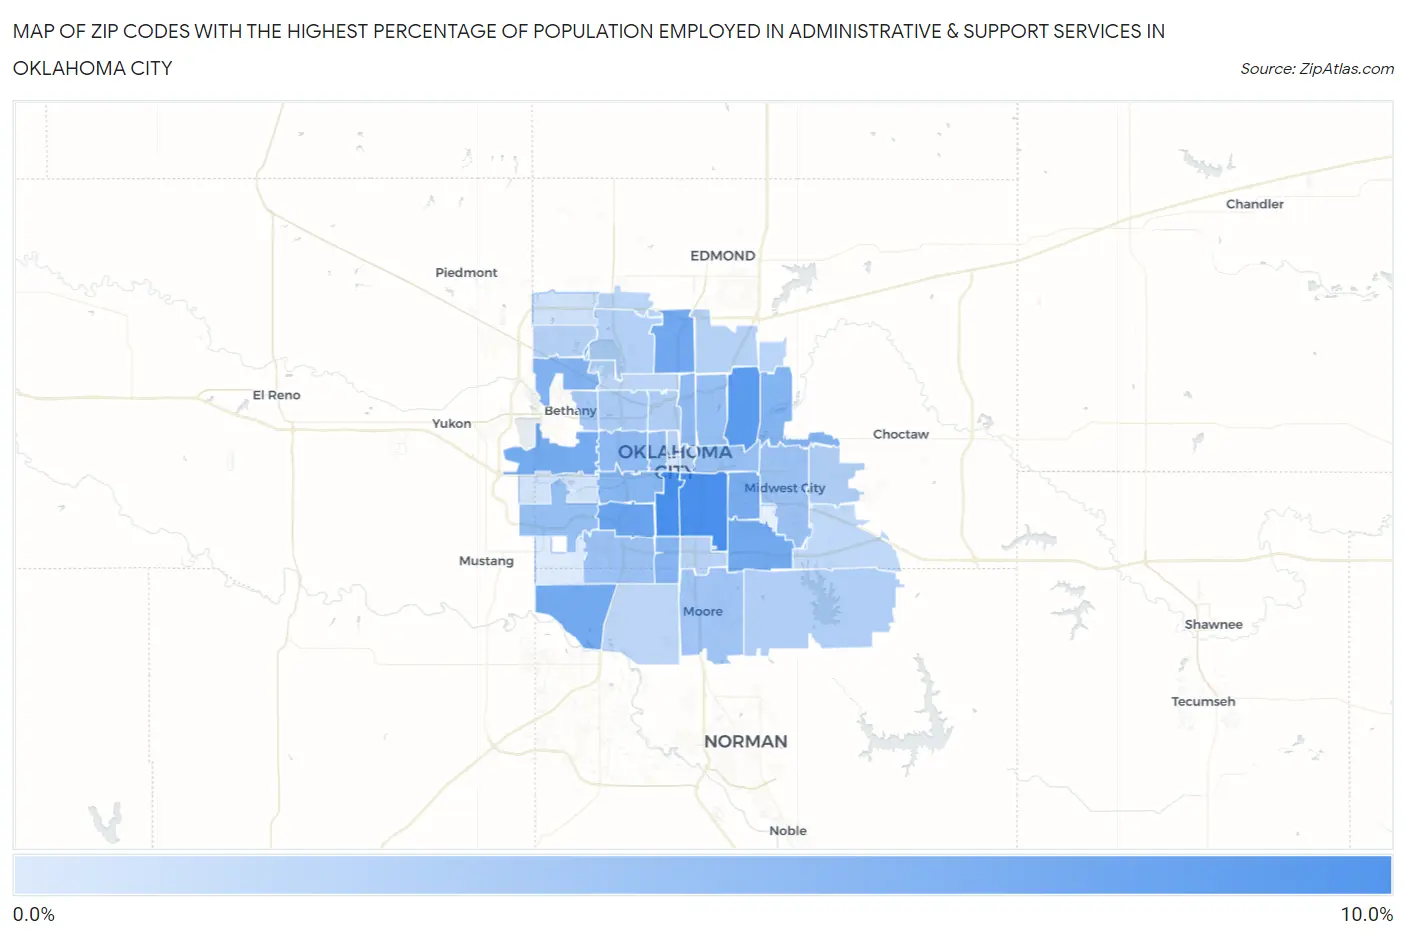
Map of Zip Codes with the Highest Percentage of Population Employed in Administrative & Support Services in Oklahoma City

0.0%
10.0%
Zip Codes with the Highest Percentage of Population Employed in Administrative & Support Services in Oklahoma City Map

Zip Codes with the Highest Percentage of Population Employed in Administrative & Support Services in Oklahoma City, OK

Zip Code % Employed vs State vs National
1.731099.0%3.6%(+5.34)#254.1%(+4.81)#1,708
2.731298.9%3.6%(+5.25)#264.1%(+4.72)#1,757
3.731217.7%3.6%(+4.12)#344.1%(+3.59)#2,476
4.731197.0%3.6%(+3.42)#404.1%(+2.88)#3,183
5.731146.7%3.6%(+3.08)#474.1%(+2.54)#3,631
6.731736.5%3.6%(+2.92)#484.1%(+2.39)#3,847
7.731356.5%3.6%(+2.87)#504.1%(+2.34)#3,921
8.731276.3%3.6%(+2.73)#524.1%(+2.20)#4,163
9.731156.1%3.6%(+2.52)#604.1%(+1.99)#4,524
10.731325.7%3.6%(+2.06)#674.1%(+1.53)#5,398
11.731415.7%3.6%(+2.04)#684.1%(+1.51)#5,451
12.731395.5%3.6%(+1.86)#744.1%(+1.33)#5,906
13.731085.4%3.6%(+1.75)#794.1%(+1.21)#6,163
14.731075.0%3.6%(+1.43)#854.1%(+0.898)#6,976
15.731055.0%3.6%(+1.38)#894.1%(+0.849)#7,111
16.731114.7%3.6%(+1.04)#1064.1%(+0.506)#8,169
17.731064.7%3.6%(+1.03)#1074.1%(+0.502)#8,183
18.731794.6%3.6%(+0.961)#1134.1%(+0.429)#8,443
19.731174.5%3.6%(+0.858)#1204.1%(+0.326)#8,807
20.731104.3%3.6%(+0.693)#1324.1%(+0.161)#9,400
21.731594.3%3.6%(+0.658)#1354.1%(+0.125)#9,542
22.731604.1%3.6%(+0.440)#1484.1%(-0.092)#10,437
23.731223.8%3.6%(+0.167)#1724.1%(-0.365)#11,618
24.731123.5%3.6%(-0.149)#2164.1%(-0.681)#13,126
25.731303.3%3.6%(-0.338)#2324.1%(-0.870)#14,050
26.731183.3%3.6%(-0.362)#2354.1%(-0.894)#14,177
27.731653.2%3.6%(-0.432)#2414.1%(-0.965)#14,547
28.731043.1%3.6%(-0.527)#2534.1%(-1.06)#15,039
29.731203.0%3.6%(-0.614)#2584.1%(-1.15)#15,463
30.731622.9%3.6%(-0.674)#2664.1%(-1.21)#15,778
31.731032.9%3.6%(-0.687)#2704.1%(-1.22)#15,846
32.731312.9%3.6%(-0.748)#2794.1%(-1.28)#16,147
33.731492.8%3.6%(-0.852)#2894.1%(-1.38)#16,748
34.731342.6%3.6%(-0.968)#3024.1%(-1.50)#17,350
35.731512.6%3.6%(-1.01)#3054.1%(-1.54)#17,537
36.731702.6%3.6%(-1.05)#3124.1%(-1.58)#17,776
37.731162.6%3.6%(-1.06)#3144.1%(-1.60)#17,860
38.731502.4%3.6%(-1.23)#3384.1%(-1.76)#18,698
39.731421.5%3.6%(-2.10)#4404.1%(-2.63)#22,663
40.731281.4%3.6%(-2.19)#4464.1%(-2.72)#23,034
41.731021.0%3.6%(-2.62)#4874.1%(-3.15)#24,482
42.731690.82%3.6%(-2.80)#5004.1%(-3.33)#25,076

Common Questions

What are the Top 10 Zip Codes with the Highest Percentage of Population Employed in Administrative & Support Services in Oklahoma City, OK?
Top 10 Zip Codes with the Highest Percentage of Population Employed in Administrative & Support Services in Oklahoma City, OK are:
#1
9.0%
#2
8.9%
#3
7.7%
#4
7.0%
#5
6.7%
#6
6.5%
#7
6.5%
#8
6.3%
#9
6.1%
#10
5.7%
What zip code has the Highest Percentage of Population Employed in Administrative & Support Services in Oklahoma City, OK?
73109 has the Highest Percentage of Population Employed in Administrative & Support Services in Oklahoma City, OK with 9.0%.
What is the Percentage of Population Employed in Administrative & Support Services in Oklahoma City, OK?
Percentage of Population Employed in Administrative & Support Services in Oklahoma City is 4.2%.
What is the Percentage of Population Employed in Administrative & Support Services in Oklahoma?
Percentage of Population Employed in Administrative & Support Services in Oklahoma is 3.6%.
What is the Percentage of Population Employed in Administrative & Support Services in the United States?
Percentage of Population Employed in Administrative & Support Services in the United States is 4.1%.