Zip Codes with the Largest Arab Community in Oklahoma City, OK

RELATED REPORTS & OPTIONS

Arab
Population
Families and Households
Female Fertility
Female Fertility (Unmarried)
Race (Community Size)
Race (Percentage)
Ancestry (Community Size)
AfricanAlaska NativeAlbanianAmericanApacheArabArapahoArgentineanArmenianAustralianAustrianBahamianBangladeshiBarbadianBasqueBelgianBhutaneseBlackfeetBolivianBrazilianBritishBritish West IndianBulgarianBurmeseCajunCambodianCanadianCelticCentral AmericanCentral American IndianCherokeeCheyenneChickasawChileanChippewaChoctawColombianComancheCreeCreekCroatianCubanCzechCzechoslovakianDanishDelawareDominicanDutchDutch West IndianEastern EuropeanEcuadorianEgyptianEnglishEstonianEthiopianEuropeanFijianFilipinoFinnishFrenchFrench American IndianFrench CanadianGermanGerman RussianGhanaianGreekGuamanian / ChamorroGuatemalanGuyaneseHaitianHonduranHopiHungarianIcelanderIndian (Asian)IndonesianInupiatIranianIraqiIrishIroquoisIsraeliItalianJamaicanJapaneseJordanianKenyanKiowaKoreanLaotianLatvianLebaneseLiberianLithuanianLuxembourgerMalaysianMexicanMexican American IndianMongolianMoroccanNative HawaiianNavajoNew ZealanderNicaraguanNigerianNorthern EuropeanNorwegianOkinawanOsagePakistaniPalestinianPanamanianPennsylvania GermanPeruvianPimaPolishPortuguesePotawatomiPuebloPuerto RicanRomanianRussianSalvadoranSamoanScandinavianScotch-IrishScottishSeminoleSerbianSiouxSlavicSlovakSloveneSouth AfricanSouth AmericanSouth American IndianSpaniardSpanishSpanish American IndianSri LankanSubsaharan AfricanSudaneseSwedishSwissSyrianThaiTlingit-HaidaTonganTrinidadian and TobagonianTurkishU.S. Virgin IslanderUkrainianUruguayanVenezuelanVietnameseWelshWest IndianYugoslavianZimbabwean
Ancestry (Percentage)
AfricanAlaska NativeAlbanianAmericanApacheArabArapahoArgentineanArmenianAustralianAustrianBahamianBangladeshiBarbadianBasqueBelgianBhutaneseBlackfeetBolivianBrazilianBritishBritish West IndianBulgarianBurmeseCajunCambodianCanadianCelticCentral AmericanCentral American IndianCherokeeCheyenneChickasawChileanChippewaChoctawColombianComancheCreeCreekCroatianCubanCzechCzechoslovakianDanishDelawareDominicanDutchDutch West IndianEastern EuropeanEcuadorianEgyptianEnglishEstonianEthiopianEuropeanFijianFilipinoFinnishFrenchFrench American IndianFrench CanadianGermanGerman RussianGhanaianGreekGuamanian / ChamorroGuatemalanGuyaneseHaitianHonduranHopiHungarianIcelanderIndian (Asian)IndonesianInupiatIranianIraqiIrishIroquoisIsraeliItalianJamaicanJapaneseJordanianKenyanKiowaKoreanLaotianLatvianLebaneseLiberianLithuanianLuxembourgerMalaysianMexicanMexican American IndianMongolianMoroccanNative HawaiianNavajoNew ZealanderNicaraguanNigerianNorthern EuropeanNorwegianOkinawanOsagePakistaniPalestinianPanamanianPennsylvania GermanPeruvianPimaPolishPortuguesePotawatomiPuebloPuerto RicanRomanianRussianSalvadoranSamoanScandinavianScotch-IrishScottishSeminoleSerbianSiouxSlavicSlovakSloveneSouth AfricanSouth AmericanSouth American IndianSpaniardSpanishSpanish American IndianSri LankanSubsaharan AfricanSudaneseSwedishSwissSyrianThaiTlingit-HaidaTonganTrinidadian and TobagonianTurkishU.S. Virgin IslanderUkrainianUruguayanVenezuelanVietnameseWelshWest IndianYugoslavianZimbabwean
Immigrant Origin (Total)
AfricaArgentinaAsiaAustraliaAustriaBahamasBangladeshBosnia and HerzegovinaBrazilBulgariaBurma / MyanmarCambodiaCameroonCanadaCaribbeanCentral AmericaChileChinaColombiaCubaDominican RepublicEastern AfricaEastern AsiaEastern EuropeEcuadorEgyptEl SalvadorEnglandEritreaEthiopiaEuropeFranceGermanyGhanaGreeceGuatemalaHondurasHong KongIndiaIndonesiaIranIraqIrelandItalyJamaicaJapanJordanKazakhstanKenyaKoreaKuwaitLaosLatin AmericaLebanonLiberiaMalaysiaMexicoMiddle AfricaMoroccoNepalNetherlandsNicaraguaNigeriaNorthern AfricaNorthern EuropeNorwayOceaniaPakistanPanamaPeruPhilippinesPolandPortugalRussiaSaudi ArabiaScotlandSingaporeSouth AfricaSouth AmericaSouth Central AsiaSouth Eastern AsiaSouthern EuropeSpainSudanSyriaTaiwanThailandTrinidad and TobagoTurkeyUkraineVenezuelaVietnamWestern AfricaWestern AsiaWestern EuropeZaireZimbabwe
Immigrant Origin (Percentage)
AfricaArgentinaAsiaAustraliaAustriaBahamasBangladeshBosnia and HerzegovinaBrazilBulgariaBurma / MyanmarCambodiaCameroonCanadaCaribbeanCentral AmericaChileChinaColombiaCubaDominican RepublicEastern AfricaEastern AsiaEastern EuropeEcuadorEgyptEl SalvadorEnglandEritreaEthiopiaEuropeFranceGermanyGhanaGreeceGuatemalaHondurasHong KongIndiaIndonesiaIranIraqIrelandItalyJamaicaJapanJordanKazakhstanKenyaKoreaKuwaitLaosLatin AmericaLebanonLiberiaMalaysiaMexicoMiddle AfricaMoroccoNepalNetherlandsNicaraguaNigeriaNorthern AfricaNorthern EuropeNorwayOceaniaPakistanPanamaPeruPhilippinesPolandPortugalRussiaSaudi ArabiaScotlandSingaporeSouth AfricaSouth AmericaSouth Central AsiaSouth Eastern AsiaSouthern EuropeSpainSudanSyriaTaiwanThailandTrinidad and TobagoTurkeyUkraineVenezuelaVietnamWestern AfricaWestern AsiaWestern EuropeZaireZimbabwe
Income
Income (Families)
Income (Households)
Poverty
Poverty (Families)
Unemployment
Employment Occupations
Employment Industries
Employer Class
Commute Time
Commute Means
School Enrollment
Education by Degree Field
Occupancy
Finances
Physical Characteristics
Oklahoma City
Compare Zip Codes
Comparison Subject

Map of Zip Codes with the Largest Arab Community in Oklahoma City

5
283
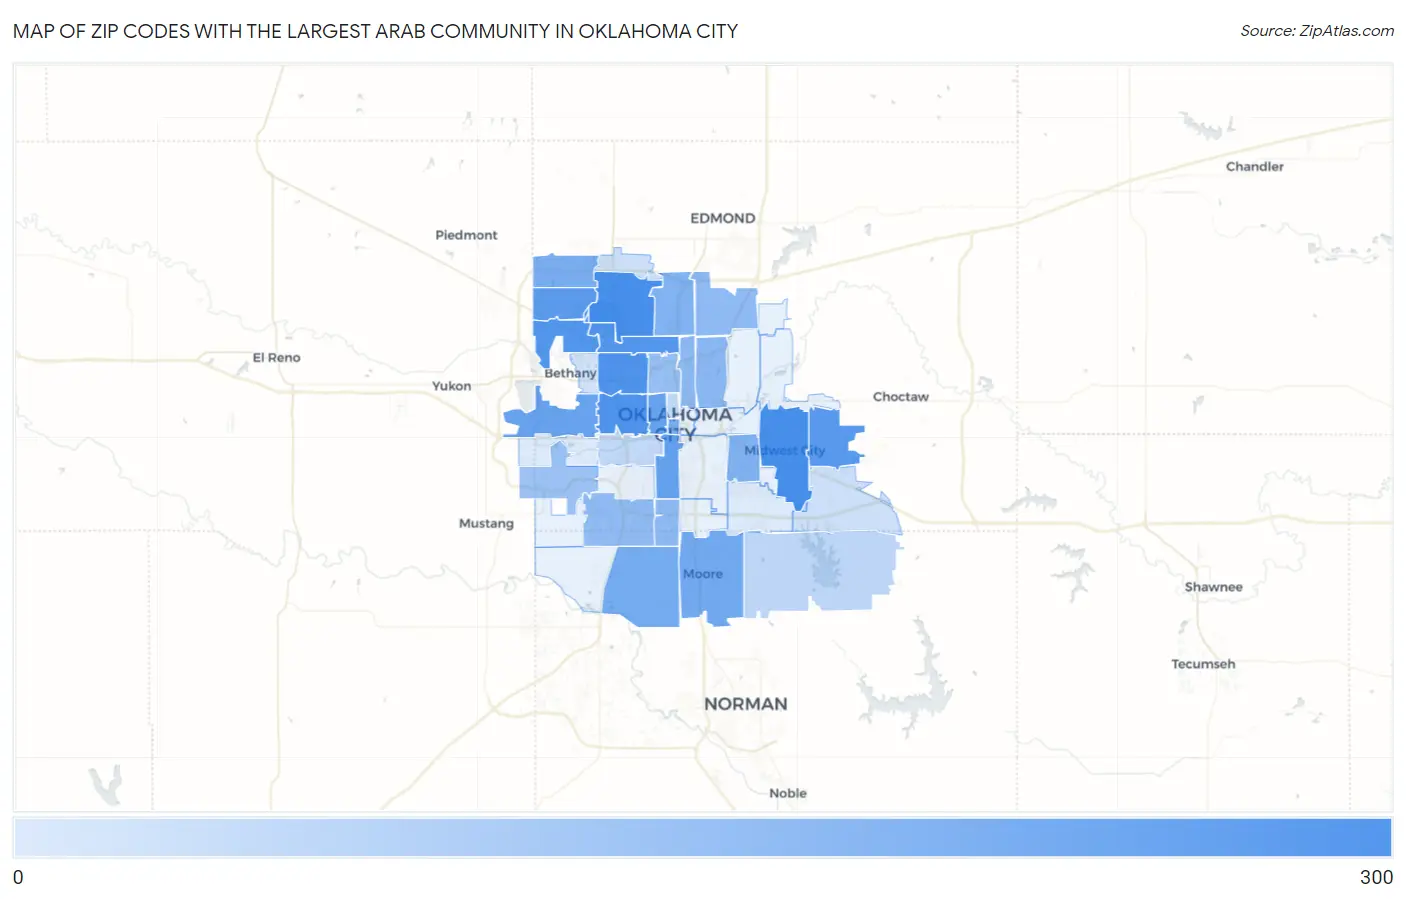
Zip Codes with the Largest Arab Community in Oklahoma City Map

Zip Codes with the Largest Arab Community in Oklahoma City, OK

Zip Code Arab vs State vs National
1. 73120 283 12,001 (2.36%)#10 2,164,088 (0.01%)#2,119
2. 73110 283 12,001 (2.36%)#11 2,164,088 (0.01%)#2,120
3. 73112 243 12,001 (2.02%)#14 2,164,088 (0.01%)#2,501
4. 73107 232 12,001 (1.93%)#15 2,164,088 (0.01%)#2,626
5. 73132 207 12,001 (1.72%)#19 2,164,088 (0.01%)#2,903
6. 73116 197 12,001 (1.64%)#20 2,164,088 (0.01%)#3,025
7. 73130 190 12,001 (1.58%)#22 2,164,088 (0.01%)#3,119
8. 73162 172 12,001 (1.43%)#24 2,164,088 (0.01%)#3,347
9. 73109 127 12,001 (1.06%)#32 2,164,088 (0.01%)#4,190
10. 73106 126 12,001 (1.05%)#33 2,164,088 (0.01%)#4,222
11. 73127 123 12,001 (1.02%)#34 2,164,088 (0.01%)#4,274
12. 73160 93 12,001 (0.77%)#36 2,164,088 (0.00%)#4,973
13. 73170 87 12,001 (0.72%)#39 2,164,088 (0.00%)#5,153
14. 73102 83 12,001 (0.69%)#41 2,164,088 (0.00%)#5,311
15. 73142 75 12,001 (0.62%)#48 2,164,088 (0.00%)#5,602
16. 73114 64 12,001 (0.53%)#53 2,164,088 (0.00%)#6,032
17. 73115 62 12,001 (0.52%)#54 2,164,088 (0.00%)#6,119
18. 73111 50 12,001 (0.42%)#62 2,164,088 (0.00%)#6,708
19. 73105 46 12,001 (0.38%)#64 2,164,088 (0.00%)#6,948
20. 73139 45 12,001 (0.37%)#65 2,164,088 (0.00%)#6,973
21. 73131 43 12,001 (0.36%)#69 2,164,088 (0.00%)#7,120
22. 73159 41 12,001 (0.34%)#70 2,164,088 (0.00%)#7,198
23. 73118 36 12,001 (0.30%)#76 2,164,088 (0.00%)#7,561
24. 73179 31 12,001 (0.26%)#80 2,164,088 (0.00%)#7,916
25. 73165 13 12,001 (0.11%)#100 2,164,088 (0.00%)#9,890
26. 73103 12 12,001 (0.10%)#105 2,164,088 (0.00%)#10,093
27. 73108 11 12,001 (0.09%)#107 2,164,088 (0.00%)#10,196
28. 73134 8 12,001 (0.07%)#126 2,164,088 (0.00%)#10,889
29. 73150 8 12,001 (0.07%)#127 2,164,088 (0.00%)#10,897
30. 73122 7 12,001 (0.06%)#128 2,164,088 (0.00%)#11,081
31. 73135 5 12,001 (0.04%)#143 2,164,088 (0.00%)#11,564
32. 73128 5 12,001 (0.04%)#145 2,164,088 (0.00%)#11,620

Common Questions

What are the Top 10 Zip Codes with the Largest Arab Community in Oklahoma City, OK?
Top 10 Zip Codes with the Largest Arab Community in Oklahoma City, OK are:
#1
283
#2
283
#3
243
#4
232
#5
207
#6
197
#7
190
#8
172
#9
127
#10
126
What zip code has the Largest Arab Community in Oklahoma City, OK?
73120 has the Largest Arab Community in Oklahoma City, OK with 283.
What is the Total Arab Population in Oklahoma City, OK?
Total Arab Population in Oklahoma City is 2,826.
What is the Total Arab Population in Oklahoma?
Total Arab Population in Oklahoma is 12,001.
What is the Total Arab Population in the United States?
Total Arab Population in the United States is 2,164,088.