Zip Codes with the Highest Percentage of Population Employed in Office & Administration in Oklahoma City, OK
RELATED REPORTS & OPTIONS
Office & Administration
Oklahoma City
Compare Zip Codes
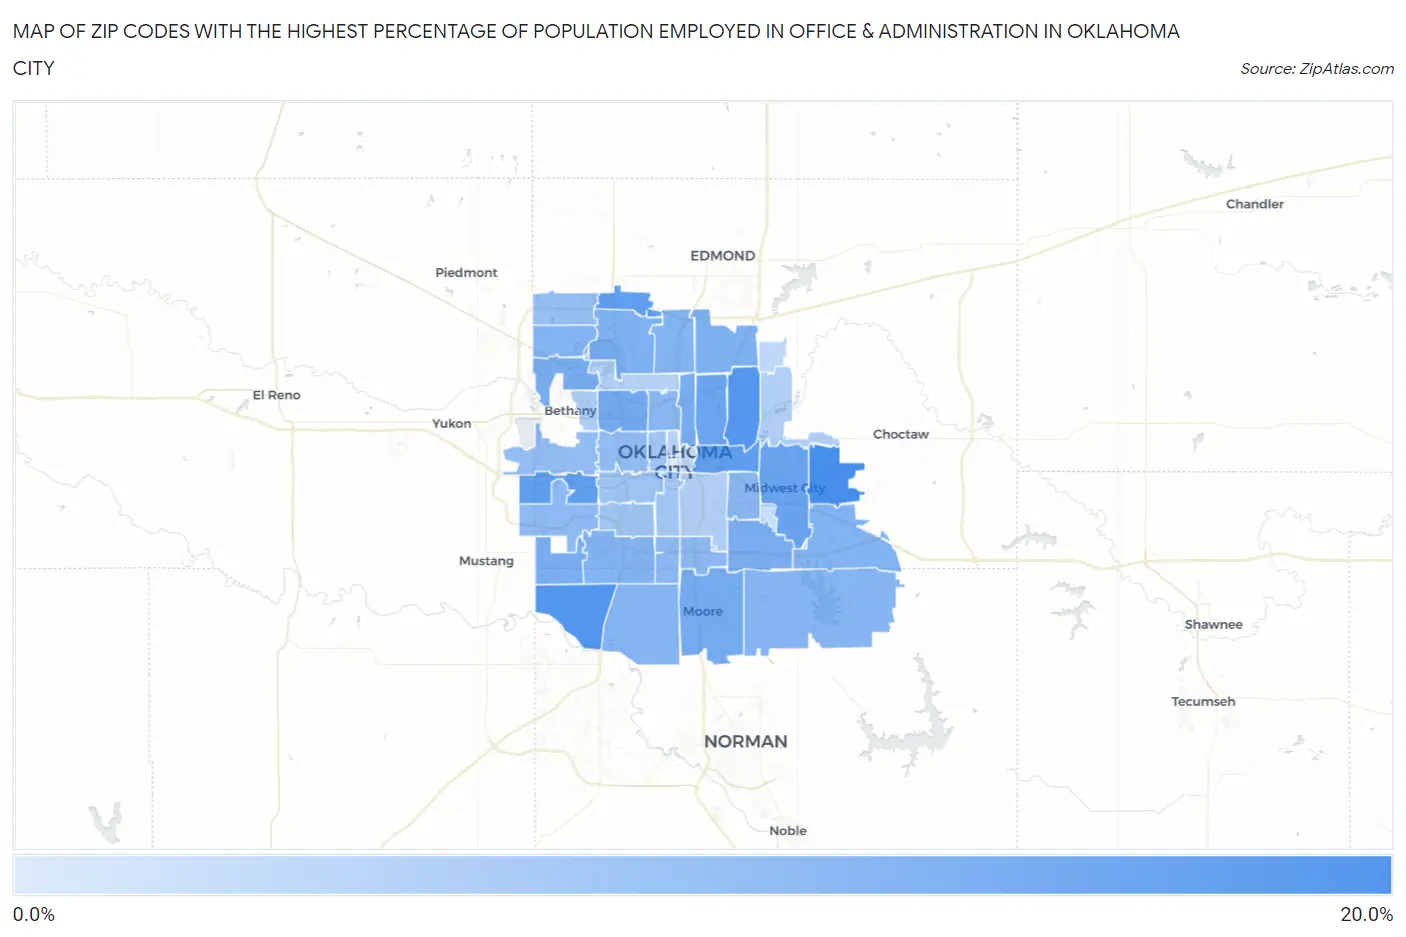
Map of Zip Codes with the Highest Percentage of Population Employed in Office & Administration in Oklahoma City
4.0%
18.2%
Zip Codes with the Highest Percentage of Population Employed in Office & Administration in Oklahoma City, OK
| Zip Code | % Employed | vs State | vs National | |
| 1. | 73130 | 18.2% | 11.5%(+6.66)#48 | 10.9%(+7.35)#2,250 |
| 2. | 73173 | 17.0% | 11.5%(+5.50)#58 | 10.9%(+6.19)#2,818 |
| 3. | 73121 | 16.9% | 11.5%(+5.39)#60 | 10.9%(+6.07)#2,883 |
| 4. | 73117 | 15.8% | 11.5%(+4.22)#86 | 10.9%(+4.91)#3,766 |
| 5. | 73128 | 15.7% | 11.5%(+4.17)#89 | 10.9%(+4.85)#3,830 |
| 6. | 73134 | 15.6% | 11.5%(+4.11)#91 | 10.9%(+4.79)#3,876 |
| 7. | 73110 | 14.8% | 11.5%(+3.27)#109 | 10.9%(+3.95)#4,822 |
| 8. | 73111 | 14.6% | 11.5%(+3.02)#113 | 10.9%(+3.71)#5,176 |
| 9. | 73112 | 13.9% | 11.5%(+2.39)#136 | 10.9%(+3.07)#6,142 |
| 10. | 73160 | 13.5% | 11.5%(+1.99)#147 | 10.9%(+2.68)#6,851 |
| 11. | 73132 | 13.3% | 11.5%(+1.80)#153 | 10.9%(+2.48)#7,286 |
| 12. | 73105 | 13.3% | 11.5%(+1.79)#154 | 10.9%(+2.47)#7,311 |
| 13. | 73135 | 13.3% | 11.5%(+1.75)#157 | 10.9%(+2.43)#7,404 |
| 14. | 73169 | 13.1% | 11.5%(+1.57)#169 | 10.9%(+2.26)#7,796 |
| 15. | 73120 | 12.7% | 11.5%(+1.20)#192 | 10.9%(+1.88)#8,694 |
| 16. | 73131 | 12.6% | 11.5%(+1.11)#196 | 10.9%(+1.79)#8,923 |
| 17. | 73150 | 12.4% | 11.5%(+0.890)#206 | 10.9%(+1.57)#9,488 |
| 18. | 73159 | 12.4% | 11.5%(+0.873)#208 | 10.9%(+1.56)#9,529 |
| 19. | 73114 | 12.2% | 11.5%(+0.684)#225 | 10.9%(+1.37)#10,072 |
| 20. | 73162 | 12.2% | 11.5%(+0.644)#229 | 10.9%(+1.33)#10,197 |
| 21. | 73165 | 12.2% | 11.5%(+0.632)#230 | 10.9%(+1.32)#10,220 |
| 22. | 73170 | 12.0% | 11.5%(+0.481)#239 | 10.9%(+1.17)#10,650 |
| 23. | 73118 | 11.6% | 11.5%(+0.066)#268 | 10.9%(+0.751)#11,920 |
| 24. | 73115 | 11.6% | 11.5%(+0.017)#272 | 10.9%(+0.702)#12,083 |
| 25. | 73149 | 11.5% | 11.5%(-0.078)#275 | 10.9%(+0.607)#12,352 |
| 26. | 73139 | 11.3% | 11.5%(-0.192)#287 | 10.9%(+0.493)#12,723 |
| 27. | 73179 | 11.2% | 11.5%(-0.292)#295 | 10.9%(+0.393)#13,055 |
| 28. | 73107 | 11.0% | 11.5%(-0.533)#310 | 10.9%(+0.152)#13,814 |
| 29. | 73127 | 10.7% | 11.5%(-0.820)#330 | 10.9%(-0.136)#14,745 |
| 30. | 73142 | 10.6% | 11.5%(-0.899)#334 | 10.9%(-0.215)#14,995 |
| 31. | 73108 | 9.7% | 11.5%(-1.85)#400 | 10.9%(-1.16)#18,090 |
| 32. | 73119 | 9.7% | 11.5%(-1.87)#402 | 10.9%(-1.19)#18,188 |
| 33. | 73106 | 9.5% | 11.5%(-2.08)#417 | 10.9%(-1.40)#18,892 |
| 34. | 73109 | 9.2% | 11.5%(-2.31)#437 | 10.9%(-1.62)#19,576 |
| 35. | 73122 | 8.4% | 11.5%(-3.15)#479 | 10.9%(-2.47)#21,994 |
| 36. | 73129 | 8.0% | 11.5%(-3.54)#500 | 10.9%(-2.85)#23,003 |
| 37. | 73141 | 7.9% | 11.5%(-3.62)#507 | 10.9%(-2.94)#23,206 |
| 38. | 73116 | 7.8% | 11.5%(-3.70)#511 | 10.9%(-3.02)#23,399 |
| 39. | 73103 | 7.4% | 11.5%(-4.14)#528 | 10.9%(-3.45)#24,401 |
| 40. | 73151 | 6.6% | 11.5%(-4.90)#558 | 10.9%(-4.22)#25,850 |
| 41. | 73104 | 6.5% | 11.5%(-5.07)#565 | 10.9%(-4.39)#26,150 |
| 42. | 73145 | 5.9% | 11.5%(-5.63)#580 | 10.9%(-4.94)#26,966 |
| 43. | 73102 | 4.0% | 11.5%(-7.54)#610 | 10.9%(-6.86)#29,004 |
1
Common Questions
What are the Top 10 Zip Codes with the Highest Percentage of Population Employed in Office & Administration in Oklahoma City, OK?
Top 10 Zip Codes with the Highest Percentage of Population Employed in Office & Administration in Oklahoma City, OK are:
What zip code has the Highest Percentage of Population Employed in Office & Administration in Oklahoma City, OK?
73130 has the Highest Percentage of Population Employed in Office & Administration in Oklahoma City, OK with 18.2%.
What is the Percentage of Population Employed in Office & Administration in Oklahoma City, OK?
Percentage of Population Employed in Office & Administration in Oklahoma City is 11.5%.
What is the Percentage of Population Employed in Office & Administration in Oklahoma?
Percentage of Population Employed in Office & Administration in Oklahoma is 11.5%.
What is the Percentage of Population Employed in Office & Administration in the United States?
Percentage of Population Employed in Office & Administration in the United States is 10.9%.