Zip Codes with the Highest Percentage of Population with a Degree in Arts and Humanities in Oklahoma City, OK

RELATED REPORTS & OPTIONS

Arts and Humanities
Population
Families and Households
Female Fertility
Female Fertility (Unmarried)
Race (Community Size)
Race (Percentage)
Ancestry (Community Size)
AfricanAlaska NativeAlbanianAmericanApacheArabArapahoArgentineanArmenianAustralianAustrianBahamianBangladeshiBarbadianBasqueBelgianBhutaneseBlackfeetBolivianBrazilianBritishBritish West IndianBulgarianBurmeseCajunCambodianCanadianCelticCentral AmericanCentral American IndianCherokeeCheyenneChickasawChileanChippewaChoctawColombianComancheCreeCreekCroatianCubanCzechCzechoslovakianDanishDelawareDominicanDutchDutch West IndianEastern EuropeanEcuadorianEgyptianEnglishEstonianEthiopianEuropeanFijianFilipinoFinnishFrenchFrench American IndianFrench CanadianGermanGerman RussianGhanaianGreekGuamanian / ChamorroGuatemalanGuyaneseHaitianHonduranHopiHungarianIcelanderIndian (Asian)IndonesianInupiatIranianIraqiIrishIroquoisIsraeliItalianJamaicanJapaneseJordanianKenyanKiowaKoreanLaotianLatvianLebaneseLiberianLithuanianLuxembourgerMalaysianMexicanMexican American IndianMongolianMoroccanNative HawaiianNavajoNew ZealanderNicaraguanNigerianNorthern EuropeanNorwegianOkinawanOsagePakistaniPalestinianPanamanianPennsylvania GermanPeruvianPimaPolishPortuguesePotawatomiPuebloPuerto RicanRomanianRussianSalvadoranSamoanScandinavianScotch-IrishScottishSeminoleSerbianSiouxSlavicSlovakSloveneSouth AfricanSouth AmericanSouth American IndianSpaniardSpanishSpanish American IndianSri LankanSubsaharan AfricanSudaneseSwedishSwissSyrianThaiTlingit-HaidaTonganTrinidadian and TobagonianTurkishU.S. Virgin IslanderUkrainianUruguayanVenezuelanVietnameseWelshWest IndianYugoslavianZimbabwean
Ancestry (Percentage)
AfricanAlaska NativeAlbanianAmericanApacheArabArapahoArgentineanArmenianAustralianAustrianBahamianBangladeshiBarbadianBasqueBelgianBhutaneseBlackfeetBolivianBrazilianBritishBritish West IndianBulgarianBurmeseCajunCambodianCanadianCelticCentral AmericanCentral American IndianCherokeeCheyenneChickasawChileanChippewaChoctawColombianComancheCreeCreekCroatianCubanCzechCzechoslovakianDanishDelawareDominicanDutchDutch West IndianEastern EuropeanEcuadorianEgyptianEnglishEstonianEthiopianEuropeanFijianFilipinoFinnishFrenchFrench American IndianFrench CanadianGermanGerman RussianGhanaianGreekGuamanian / ChamorroGuatemalanGuyaneseHaitianHonduranHopiHungarianIcelanderIndian (Asian)IndonesianInupiatIranianIraqiIrishIroquoisIsraeliItalianJamaicanJapaneseJordanianKenyanKiowaKoreanLaotianLatvianLebaneseLiberianLithuanianLuxembourgerMalaysianMexicanMexican American IndianMongolianMoroccanNative HawaiianNavajoNew ZealanderNicaraguanNigerianNorthern EuropeanNorwegianOkinawanOsagePakistaniPalestinianPanamanianPennsylvania GermanPeruvianPimaPolishPortuguesePotawatomiPuebloPuerto RicanRomanianRussianSalvadoranSamoanScandinavianScotch-IrishScottishSeminoleSerbianSiouxSlavicSlovakSloveneSouth AfricanSouth AmericanSouth American IndianSpaniardSpanishSpanish American IndianSri LankanSubsaharan AfricanSudaneseSwedishSwissSyrianThaiTlingit-HaidaTonganTrinidadian and TobagonianTurkishU.S. Virgin IslanderUkrainianUruguayanVenezuelanVietnameseWelshWest IndianYugoslavianZimbabwean
Immigrant Origin (Total)
AfricaArgentinaAsiaAustraliaAustriaBahamasBangladeshBosnia and HerzegovinaBrazilBulgariaBurma / MyanmarCambodiaCameroonCanadaCaribbeanCentral AmericaChileChinaColombiaCubaDominican RepublicEastern AfricaEastern AsiaEastern EuropeEcuadorEgyptEl SalvadorEnglandEritreaEthiopiaEuropeFranceGermanyGhanaGreeceGuatemalaHondurasHong KongIndiaIndonesiaIranIraqIrelandItalyJamaicaJapanJordanKazakhstanKenyaKoreaKuwaitLaosLatin AmericaLebanonLiberiaMalaysiaMexicoMiddle AfricaMoroccoNepalNetherlandsNicaraguaNigeriaNorthern AfricaNorthern EuropeNorwayOceaniaPakistanPanamaPeruPhilippinesPolandPortugalRussiaSaudi ArabiaScotlandSingaporeSouth AfricaSouth AmericaSouth Central AsiaSouth Eastern AsiaSouthern EuropeSpainSudanSyriaTaiwanThailandTrinidad and TobagoTurkeyUkraineVenezuelaVietnamWestern AfricaWestern AsiaWestern EuropeZaireZimbabwe
Immigrant Origin (Percentage)
AfricaArgentinaAsiaAustraliaAustriaBahamasBangladeshBosnia and HerzegovinaBrazilBulgariaBurma / MyanmarCambodiaCameroonCanadaCaribbeanCentral AmericaChileChinaColombiaCubaDominican RepublicEastern AfricaEastern AsiaEastern EuropeEcuadorEgyptEl SalvadorEnglandEritreaEthiopiaEuropeFranceGermanyGhanaGreeceGuatemalaHondurasHong KongIndiaIndonesiaIranIraqIrelandItalyJamaicaJapanJordanKazakhstanKenyaKoreaKuwaitLaosLatin AmericaLebanonLiberiaMalaysiaMexicoMiddle AfricaMoroccoNepalNetherlandsNicaraguaNigeriaNorthern AfricaNorthern EuropeNorwayOceaniaPakistanPanamaPeruPhilippinesPolandPortugalRussiaSaudi ArabiaScotlandSingaporeSouth AfricaSouth AmericaSouth Central AsiaSouth Eastern AsiaSouthern EuropeSpainSudanSyriaTaiwanThailandTrinidad and TobagoTurkeyUkraineVenezuelaVietnamWestern AfricaWestern AsiaWestern EuropeZaireZimbabwe
Income
Income (Families)
Income (Households)
Poverty
Poverty (Families)
Unemployment
Employment Occupations
Employment Industries
Employer Class
Commute Time
Commute Means
School Enrollment
Education by Degree Field
Occupancy
Finances
Physical Characteristics
Oklahoma City
Compare Zip Codes
Comparison Subject

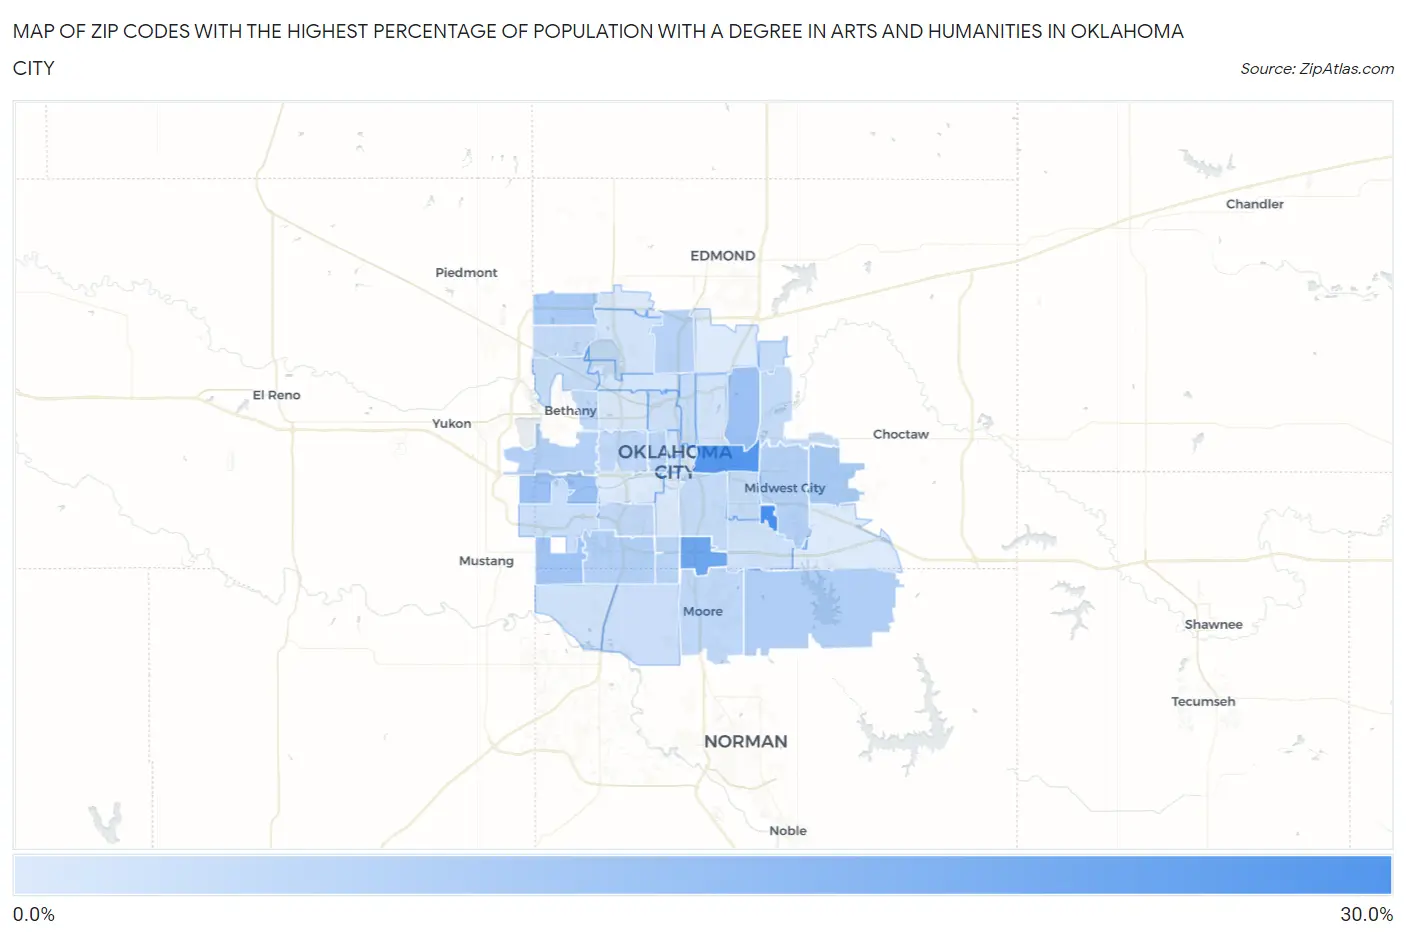
Map of Zip Codes with the Highest Percentage of Population with a Degree in Arts and Humanities in Oklahoma City

0.0%
30.0%
Zip Codes with the Highest Percentage of Population with a Degree in Arts and Humanities in Oklahoma City Map

Zip Codes with the Highest Percentage of Population with a Degree in Arts and Humanities in Oklahoma City, OK

Zip Code % Graduates vs State vs National
1.7314528.7%7.2%(+21.5)#136.0%(+22.7)#717
2.7311726.0%7.2%(+18.8)#176.0%(+20.0)#891
3.7314921.3%7.2%(+14.1)#266.0%(+15.3)#1,313
4.7312113.4%7.2%(+6.19)#746.0%(+7.37)#3,427
5.7312813.1%7.2%(+5.89)#816.0%(+7.07)#3,603
6.7316912.5%7.2%(+5.36)#916.0%(+6.53)#3,930
7.7313011.1%7.2%(+3.91)#1196.0%(+5.09)#5,078
8.7314211.0%7.2%(+3.86)#1206.0%(+5.03)#5,122
9.731659.8%7.2%(+2.61)#1566.0%(+3.78)#6,554
10.731279.5%7.2%(+2.34)#1706.0%(+3.52)#6,923
11.731599.5%7.2%(+2.31)#1716.0%(+3.49)#6,955
12.731109.0%7.2%(+1.87)#1866.0%(+3.04)#7,684
13.731148.7%7.2%(+1.54)#2036.0%(+2.71)#8,245
14.731068.3%7.2%(+1.13)#2236.0%(+2.30)#9,048
15.731398.1%7.2%(+0.942)#2296.0%(+2.12)#9,405
16.731607.6%7.2%(+0.411)#2506.0%(+1.59)#10,523
17.731077.5%7.2%(+0.340)#2536.0%(+1.52)#10,696
18.731227.1%7.2%(-0.054)#2826.0%(+1.12)#11,683
19.731197.0%7.2%(-0.134)#2846.0%(+1.04)#11,850
20.731296.9%7.2%(-0.257)#2936.0%(+0.918)#12,181
21.731416.7%7.2%(-0.485)#3046.0%(+0.690)#12,789
22.731626.7%7.2%(-0.511)#3076.0%(+0.664)#12,854
23.731056.5%7.2%(-0.702)#3136.0%(+0.473)#13,345
24.731156.5%7.2%(-0.719)#3146.0%(+0.456)#13,386
25.731516.4%7.2%(-0.816)#3176.0%(+0.360)#13,652
26.731326.3%7.2%(-0.892)#3226.0%(+0.283)#13,840
27.731796.0%7.2%(-1.20)#3416.0%(-0.020)#14,736
28.731705.5%7.2%(-1.63)#3666.0%(-0.450)#16,007
29.731185.2%7.2%(-2.01)#3846.0%(-0.833)#17,121
30.731025.1%7.2%(-2.11)#3896.0%(-0.934)#17,414
31.731735.0%7.2%(-2.17)#3936.0%(-0.999)#17,620
32.731355.0%7.2%(-2.20)#3966.0%(-1.03)#17,707
33.731114.7%7.2%(-2.49)#4046.0%(-1.31)#18,500
34.731204.6%7.2%(-2.61)#4076.0%(-1.43)#18,832
35.731034.4%7.2%(-2.76)#4146.0%(-1.59)#19,272
36.731164.3%7.2%(-2.91)#4196.0%(-1.73)#19,649
37.731123.6%7.2%(-3.53)#4376.0%(-2.35)#21,240
38.731043.6%7.2%(-3.61)#4426.0%(-2.44)#21,453
39.731093.1%7.2%(-4.02)#4576.0%(-2.85)#22,387
40.731343.0%7.2%(-4.19)#4686.0%(-3.01)#22,694
41.731082.9%7.2%(-4.24)#4706.0%(-3.07)#22,813
42.731502.8%7.2%(-4.33)#4726.0%(-3.16)#22,977
43.731312.8%7.2%(-4.41)#4756.0%(-3.24)#23,124

Common Questions

What are the Top 10 Zip Codes with the Highest Percentage of Population with a Degree in Arts and Humanities in Oklahoma City, OK?
Top 10 Zip Codes with the Highest Percentage of Population with a Degree in Arts and Humanities in Oklahoma City, OK are:
#1
28.7%
#2
26.0%
#3
21.3%
#4
13.4%
#5
13.1%
#6
12.5%
#7
11.1%
#8
11.0%
#9
9.8%
#10
9.5%
What zip code has the Highest Percentage of Population with a Degree in Arts and Humanities in Oklahoma City, OK?
73145 has the Highest Percentage of Population with a Degree in Arts and Humanities in Oklahoma City, OK with 28.7%.
What is the Percentage of Population with a Degree in Arts and Humanities in Oklahoma City, OK?
Percentage of Population with a Degree in Arts and Humanities in Oklahoma City is 7.0%.
What is the Percentage of Population with a Degree in Arts and Humanities in Oklahoma?
Percentage of Population with a Degree in Arts and Humanities in Oklahoma is 7.2%.
What is the Percentage of Population with a Degree in Arts and Humanities in the United States?
Percentage of Population with a Degree in Arts and Humanities in the United States is 6.0%.