Zip Codes with the Highest Median Property Prices in Oklahoma City, OK

RELATED REPORTS & OPTIONS

Highest Property Prices
Population
Families and Households
Female Fertility
Female Fertility (Unmarried)
Race (Community Size)
Race (Percentage)
Ancestry (Community Size)
AfricanAlaska NativeAlbanianAmericanApacheArabArapahoArgentineanArmenianAustralianAustrianBahamianBangladeshiBarbadianBasqueBelgianBhutaneseBlackfeetBolivianBrazilianBritishBritish West IndianBulgarianBurmeseCajunCambodianCanadianCelticCentral AmericanCentral American IndianCherokeeCheyenneChickasawChileanChippewaChoctawColombianComancheCreeCreekCroatianCubanCzechCzechoslovakianDanishDelawareDominicanDutchDutch West IndianEastern EuropeanEcuadorianEgyptianEnglishEstonianEthiopianEuropeanFijianFilipinoFinnishFrenchFrench American IndianFrench CanadianGermanGerman RussianGhanaianGreekGuamanian / ChamorroGuatemalanGuyaneseHaitianHonduranHopiHungarianIcelanderIndian (Asian)IndonesianInupiatIranianIraqiIrishIroquoisIsraeliItalianJamaicanJapaneseJordanianKenyanKiowaKoreanLaotianLatvianLebaneseLiberianLithuanianLuxembourgerMalaysianMexicanMexican American IndianMongolianMoroccanNative HawaiianNavajoNew ZealanderNicaraguanNigerianNorthern EuropeanNorwegianOkinawanOsagePakistaniPalestinianPanamanianPennsylvania GermanPeruvianPimaPolishPortuguesePotawatomiPuebloPuerto RicanRomanianRussianSalvadoranSamoanScandinavianScotch-IrishScottishSeminoleSerbianSiouxSlavicSlovakSloveneSouth AfricanSouth AmericanSouth American IndianSpaniardSpanishSpanish American IndianSri LankanSubsaharan AfricanSudaneseSwedishSwissSyrianThaiTlingit-HaidaTonganTrinidadian and TobagonianTurkishU.S. Virgin IslanderUkrainianUruguayanVenezuelanVietnameseWelshWest IndianYugoslavianZimbabwean
Ancestry (Percentage)
AfricanAlaska NativeAlbanianAmericanApacheArabArapahoArgentineanArmenianAustralianAustrianBahamianBangladeshiBarbadianBasqueBelgianBhutaneseBlackfeetBolivianBrazilianBritishBritish West IndianBulgarianBurmeseCajunCambodianCanadianCelticCentral AmericanCentral American IndianCherokeeCheyenneChickasawChileanChippewaChoctawColombianComancheCreeCreekCroatianCubanCzechCzechoslovakianDanishDelawareDominicanDutchDutch West IndianEastern EuropeanEcuadorianEgyptianEnglishEstonianEthiopianEuropeanFijianFilipinoFinnishFrenchFrench American IndianFrench CanadianGermanGerman RussianGhanaianGreekGuamanian / ChamorroGuatemalanGuyaneseHaitianHonduranHopiHungarianIcelanderIndian (Asian)IndonesianInupiatIranianIraqiIrishIroquoisIsraeliItalianJamaicanJapaneseJordanianKenyanKiowaKoreanLaotianLatvianLebaneseLiberianLithuanianLuxembourgerMalaysianMexicanMexican American IndianMongolianMoroccanNative HawaiianNavajoNew ZealanderNicaraguanNigerianNorthern EuropeanNorwegianOkinawanOsagePakistaniPalestinianPanamanianPennsylvania GermanPeruvianPimaPolishPortuguesePotawatomiPuebloPuerto RicanRomanianRussianSalvadoranSamoanScandinavianScotch-IrishScottishSeminoleSerbianSiouxSlavicSlovakSloveneSouth AfricanSouth AmericanSouth American IndianSpaniardSpanishSpanish American IndianSri LankanSubsaharan AfricanSudaneseSwedishSwissSyrianThaiTlingit-HaidaTonganTrinidadian and TobagonianTurkishU.S. Virgin IslanderUkrainianUruguayanVenezuelanVietnameseWelshWest IndianYugoslavianZimbabwean
Immigrant Origin (Total)
AfricaArgentinaAsiaAustraliaAustriaBahamasBangladeshBosnia and HerzegovinaBrazilBulgariaBurma / MyanmarCambodiaCameroonCanadaCaribbeanCentral AmericaChileChinaColombiaCubaDominican RepublicEastern AfricaEastern AsiaEastern EuropeEcuadorEgyptEl SalvadorEnglandEritreaEthiopiaEuropeFranceGermanyGhanaGreeceGuatemalaHondurasHong KongIndiaIndonesiaIranIraqIrelandItalyJamaicaJapanJordanKazakhstanKenyaKoreaKuwaitLaosLatin AmericaLebanonLiberiaMalaysiaMexicoMiddle AfricaMoroccoNepalNetherlandsNicaraguaNigeriaNorthern AfricaNorthern EuropeNorwayOceaniaPakistanPanamaPeruPhilippinesPolandPortugalRussiaSaudi ArabiaScotlandSingaporeSouth AfricaSouth AmericaSouth Central AsiaSouth Eastern AsiaSouthern EuropeSpainSudanSyriaTaiwanThailandTrinidad and TobagoTurkeyUkraineVenezuelaVietnamWestern AfricaWestern AsiaWestern EuropeZaireZimbabwe
Immigrant Origin (Percentage)
AfricaArgentinaAsiaAustraliaAustriaBahamasBangladeshBosnia and HerzegovinaBrazilBulgariaBurma / MyanmarCambodiaCameroonCanadaCaribbeanCentral AmericaChileChinaColombiaCubaDominican RepublicEastern AfricaEastern AsiaEastern EuropeEcuadorEgyptEl SalvadorEnglandEritreaEthiopiaEuropeFranceGermanyGhanaGreeceGuatemalaHondurasHong KongIndiaIndonesiaIranIraqIrelandItalyJamaicaJapanJordanKazakhstanKenyaKoreaKuwaitLaosLatin AmericaLebanonLiberiaMalaysiaMexicoMiddle AfricaMoroccoNepalNetherlandsNicaraguaNigeriaNorthern AfricaNorthern EuropeNorwayOceaniaPakistanPanamaPeruPhilippinesPolandPortugalRussiaSaudi ArabiaScotlandSingaporeSouth AfricaSouth AmericaSouth Central AsiaSouth Eastern AsiaSouthern EuropeSpainSudanSyriaTaiwanThailandTrinidad and TobagoTurkeyUkraineVenezuelaVietnamWestern AfricaWestern AsiaWestern EuropeZaireZimbabwe
Income
Income (Families)
Income (Households)
Poverty
Poverty (Families)
Unemployment
Employment Occupations
Employment Industries
Employer Class
Commute Time
Commute Means
School Enrollment
Education by Degree Field
Occupancy
Finances
Physical Characteristics
Oklahoma City
Compare Zip Codes
Comparison Subject

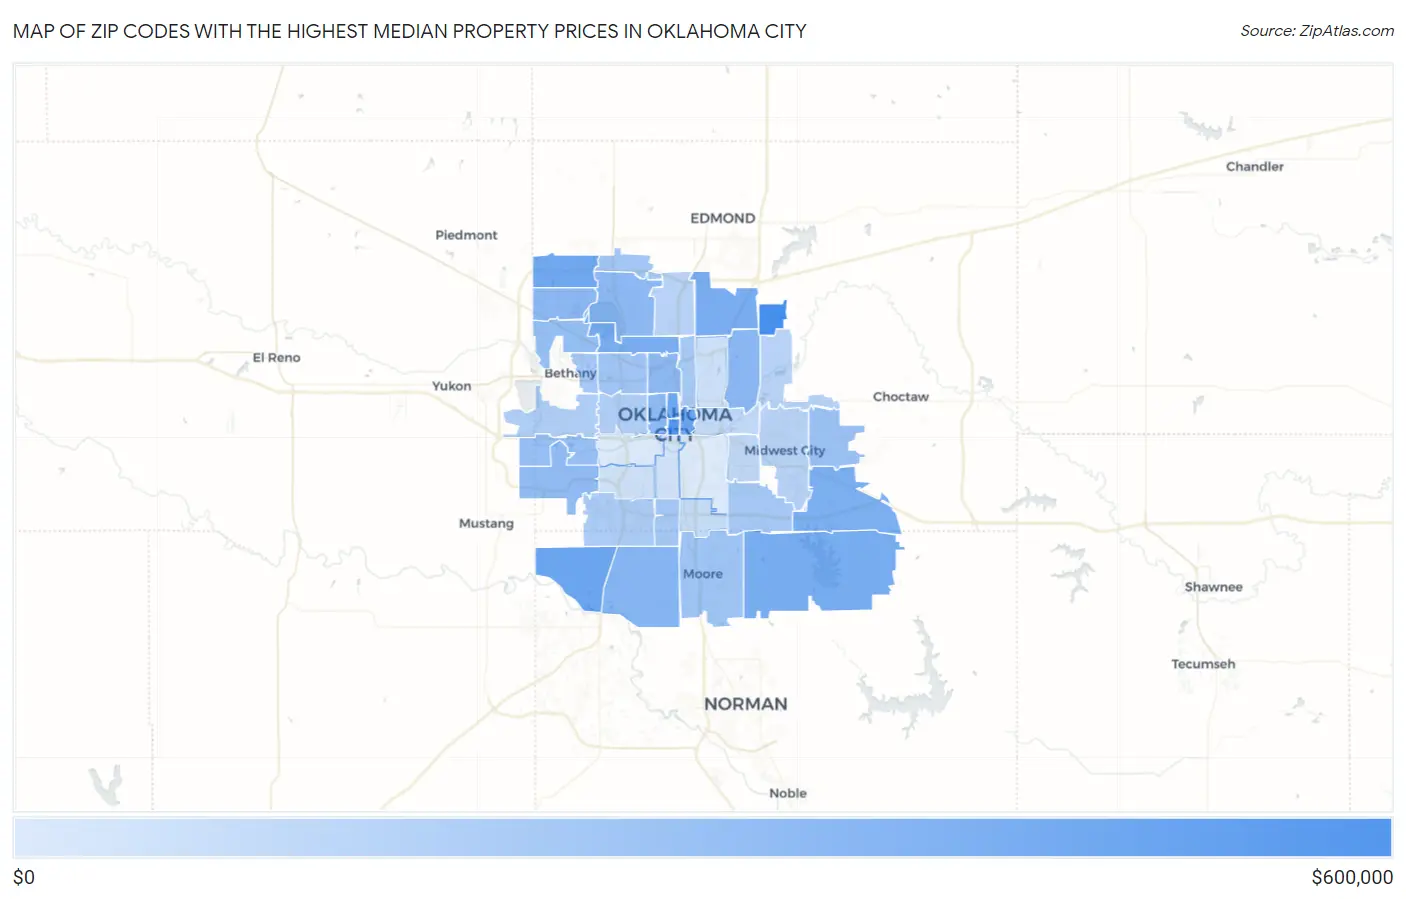
Map of Zip Codes with the Highest Median Property Prices in Oklahoma City

$0
$600,000
Zip Codes with the Highest Median Property Prices in Oklahoma City Map

Zip Codes with the Highest Median Property Prices in Oklahoma City, OK

Zip Code Avg Property Price vs State vs National
1.73151$576,501$168,361(+408k)#1$281,181(+295k)#2,136
2.73102$468,203$168,361(+300k)#3$281,181(+187k)#3,166
3.73173$341,849$168,361(+173k)#8$281,181(+60.7k)#5,869
4.73103$338,976$168,361(+171k)#9$281,181(+57.8k)#5,965
5.73104$330,145$168,361(+162k)#10$281,181(+49.0k)#6,244
6.73142$319,868$168,361(+152k)#11$281,181(+38.7k)#6,590
7.73165$291,949$168,361(+124k)#14$281,181(+10.8k)#7,576
8.73116$285,479$168,361(+117k)#16$281,181(+4.30k)#7,873
9.73131$280,971$168,361(+113k)#19$281,181(-210)#8,094
10.73150$269,451$168,361(+101k)#23$281,181(-11.7k)#8,617
11.73170$239,642$168,361(+71.3k)#37$281,181(-41.5k)#10,243
12.73121$225,238$168,361(+56.9k)#46$281,181(-55.9k)#11,215
13.73162$220,476$168,361(+52.1k)#51$281,181(-60.7k)#11,549
14.73120$217,959$168,361(+49.6k)#55$281,181(-63.2k)#11,741
15.73118$215,783$168,361(+47.4k)#57$281,181(-65.4k)#11,906
16.73106$215,670$168,361(+47.3k)#58$281,181(-65.5k)#11,918
17.73179$202,893$168,361(+34.5k)#68$281,181(-78.3k)#12,893
18.73132$189,472$168,361(+21.1k)#83$281,181(-91.7k)#14,076
19.73128$181,991$168,361(+13.6k)#97$281,181(-99.2k)#14,792
20.73130$179,279$168,361(+10.9k)#98$281,181(-102k)#15,037
21.73160$168,885$168,361(+524)#119$281,181(-112k)#16,075
22.73112$161,992$168,361(-6.37k)#130$281,181(-119k)#16,798
23.73134$155,411$168,361(-12.9k)#141$281,181(-126k)#17,535
24.73135$152,151$168,361(-16.2k)#154$281,181(-129k)#17,930
25.73139$150,297$168,361(-18.1k)#164$281,181(-131k)#18,137
26.73122$150,273$168,361(-18.1k)#165$281,181(-131k)#18,145
27.73105$148,513$168,361(-19.8k)#168$281,181(-133k)#18,338
28.73159$136,312$168,361(-32.0k)#218$281,181(-145k)#19,732
29.73127$135,397$168,361(-33.0k)#222$281,181(-146k)#19,845
30.73107$131,358$168,361(-37.0k)#239$281,181(-150k)#20,321
31.73114$118,589$168,361(-49.8k)#302$281,181(-163k)#21,890
32.73141$117,379$168,361(-51.0k)#313$281,181(-164k)#22,033
33.73110$116,482$168,361(-51.9k)#320$281,181(-165k)#22,130
34.73117$104,231$168,361(-64.1k)#383$281,181(-177k)#23,554
35.73115$102,960$168,361(-65.4k)#392$281,181(-178k)#23,691
36.73149$96,659$168,361(-71.7k)#422$281,181(-185k)#24,359
37.73111$87,104$168,361(-81.3k)#461$281,181(-194k)#25,236
38.73119$83,383$168,361(-85.0k)#472$281,181(-198k)#25,504
39.73109$82,292$168,361(-86.1k)#475$281,181(-199k)#25,592
40.73108$69,891$168,361(-98.5k)#512$281,181(-211k)#26,237
41.73129$69,591$168,361(-98.8k)#514$281,181(-212k)#26,253

Common Questions

What are the Top 10 Zip Codes with the Highest Median Property Prices in Oklahoma City, OK?
Top 10 Zip Codes with the Highest Median Property Prices in Oklahoma City, OK are:
#1
$576,501
#2
$468,203
#3
$341,849
#4
$338,976
#5
$330,145
#6
$319,868
#7
$291,949
#8
$285,479
#9
$280,971
#10
$269,451
What zip code has the Highest Median Property Prices in Oklahoma City, OK?
73151 has the Highest Median Property Prices in Oklahoma City, OK with $576,501.
What is the Median Property Prices in Oklahoma City, OK?
Median Property Prices in Oklahoma City is $194,839.
What is the Median Property Prices in Oklahoma?
Median Property Prices in Oklahoma is $168,361.
What is the Median Property Prices in the United States?
Median Property Prices in the United States is $281,181.