Zip Codes with the Highest Percentage of Families with Income Above $100,000 in Oklahoma City, OK

RELATED REPORTS & OPTIONS

Family Income | $100k+
Population
Families and Households
Female Fertility
Female Fertility (Unmarried)
Race (Community Size)
Race (Percentage)
Ancestry (Community Size)
AfricanAlaska NativeAlbanianAmericanApacheArabArapahoArgentineanArmenianAustralianAustrianBahamianBangladeshiBarbadianBasqueBelgianBhutaneseBlackfeetBolivianBrazilianBritishBritish West IndianBulgarianBurmeseCajunCambodianCanadianCelticCentral AmericanCentral American IndianCherokeeCheyenneChickasawChileanChippewaChoctawColombianComancheCreeCreekCroatianCubanCzechCzechoslovakianDanishDelawareDominicanDutchDutch West IndianEastern EuropeanEcuadorianEgyptianEnglishEstonianEthiopianEuropeanFijianFilipinoFinnishFrenchFrench American IndianFrench CanadianGermanGerman RussianGhanaianGreekGuamanian / ChamorroGuatemalanGuyaneseHaitianHonduranHopiHungarianIcelanderIndian (Asian)IndonesianInupiatIranianIraqiIrishIroquoisIsraeliItalianJamaicanJapaneseJordanianKenyanKiowaKoreanLaotianLatvianLebaneseLiberianLithuanianLuxembourgerMalaysianMexicanMexican American IndianMongolianMoroccanNative HawaiianNavajoNew ZealanderNicaraguanNigerianNorthern EuropeanNorwegianOkinawanOsagePakistaniPalestinianPanamanianPennsylvania GermanPeruvianPimaPolishPortuguesePotawatomiPuebloPuerto RicanRomanianRussianSalvadoranSamoanScandinavianScotch-IrishScottishSeminoleSerbianSiouxSlavicSlovakSloveneSouth AfricanSouth AmericanSouth American IndianSpaniardSpanishSpanish American IndianSri LankanSubsaharan AfricanSudaneseSwedishSwissSyrianThaiTlingit-HaidaTonganTrinidadian and TobagonianTurkishU.S. Virgin IslanderUkrainianUruguayanVenezuelanVietnameseWelshWest IndianYugoslavianZimbabwean
Ancestry (Percentage)
AfricanAlaska NativeAlbanianAmericanApacheArabArapahoArgentineanArmenianAustralianAustrianBahamianBangladeshiBarbadianBasqueBelgianBhutaneseBlackfeetBolivianBrazilianBritishBritish West IndianBulgarianBurmeseCajunCambodianCanadianCelticCentral AmericanCentral American IndianCherokeeCheyenneChickasawChileanChippewaChoctawColombianComancheCreeCreekCroatianCubanCzechCzechoslovakianDanishDelawareDominicanDutchDutch West IndianEastern EuropeanEcuadorianEgyptianEnglishEstonianEthiopianEuropeanFijianFilipinoFinnishFrenchFrench American IndianFrench CanadianGermanGerman RussianGhanaianGreekGuamanian / ChamorroGuatemalanGuyaneseHaitianHonduranHopiHungarianIcelanderIndian (Asian)IndonesianInupiatIranianIraqiIrishIroquoisIsraeliItalianJamaicanJapaneseJordanianKenyanKiowaKoreanLaotianLatvianLebaneseLiberianLithuanianLuxembourgerMalaysianMexicanMexican American IndianMongolianMoroccanNative HawaiianNavajoNew ZealanderNicaraguanNigerianNorthern EuropeanNorwegianOkinawanOsagePakistaniPalestinianPanamanianPennsylvania GermanPeruvianPimaPolishPortuguesePotawatomiPuebloPuerto RicanRomanianRussianSalvadoranSamoanScandinavianScotch-IrishScottishSeminoleSerbianSiouxSlavicSlovakSloveneSouth AfricanSouth AmericanSouth American IndianSpaniardSpanishSpanish American IndianSri LankanSubsaharan AfricanSudaneseSwedishSwissSyrianThaiTlingit-HaidaTonganTrinidadian and TobagonianTurkishU.S. Virgin IslanderUkrainianUruguayanVenezuelanVietnameseWelshWest IndianYugoslavianZimbabwean
Immigrant Origin (Total)
AfricaArgentinaAsiaAustraliaAustriaBahamasBangladeshBosnia and HerzegovinaBrazilBulgariaBurma / MyanmarCambodiaCameroonCanadaCaribbeanCentral AmericaChileChinaColombiaCubaDominican RepublicEastern AfricaEastern AsiaEastern EuropeEcuadorEgyptEl SalvadorEnglandEritreaEthiopiaEuropeFranceGermanyGhanaGreeceGuatemalaHondurasHong KongIndiaIndonesiaIranIraqIrelandItalyJamaicaJapanJordanKazakhstanKenyaKoreaKuwaitLaosLatin AmericaLebanonLiberiaMalaysiaMexicoMiddle AfricaMoroccoNepalNetherlandsNicaraguaNigeriaNorthern AfricaNorthern EuropeNorwayOceaniaPakistanPanamaPeruPhilippinesPolandPortugalRussiaSaudi ArabiaScotlandSingaporeSouth AfricaSouth AmericaSouth Central AsiaSouth Eastern AsiaSouthern EuropeSpainSudanSyriaTaiwanThailandTrinidad and TobagoTurkeyUkraineVenezuelaVietnamWestern AfricaWestern AsiaWestern EuropeZaireZimbabwe
Immigrant Origin (Percentage)
AfricaArgentinaAsiaAustraliaAustriaBahamasBangladeshBosnia and HerzegovinaBrazilBulgariaBurma / MyanmarCambodiaCameroonCanadaCaribbeanCentral AmericaChileChinaColombiaCubaDominican RepublicEastern AfricaEastern AsiaEastern EuropeEcuadorEgyptEl SalvadorEnglandEritreaEthiopiaEuropeFranceGermanyGhanaGreeceGuatemalaHondurasHong KongIndiaIndonesiaIranIraqIrelandItalyJamaicaJapanJordanKazakhstanKenyaKoreaKuwaitLaosLatin AmericaLebanonLiberiaMalaysiaMexicoMiddle AfricaMoroccoNepalNetherlandsNicaraguaNigeriaNorthern AfricaNorthern EuropeNorwayOceaniaPakistanPanamaPeruPhilippinesPolandPortugalRussiaSaudi ArabiaScotlandSingaporeSouth AfricaSouth AmericaSouth Central AsiaSouth Eastern AsiaSouthern EuropeSpainSudanSyriaTaiwanThailandTrinidad and TobagoTurkeyUkraineVenezuelaVietnamWestern AfricaWestern AsiaWestern EuropeZaireZimbabwe
Income
Income (Families)
Income (Households)
Poverty
Poverty (Families)
Unemployment
Employment Occupations
Employment Industries
Employer Class
Commute Time
Commute Means
School Enrollment
Education by Degree Field
Occupancy
Finances
Physical Characteristics
Oklahoma City
Compare Zip Codes
Comparison Subject

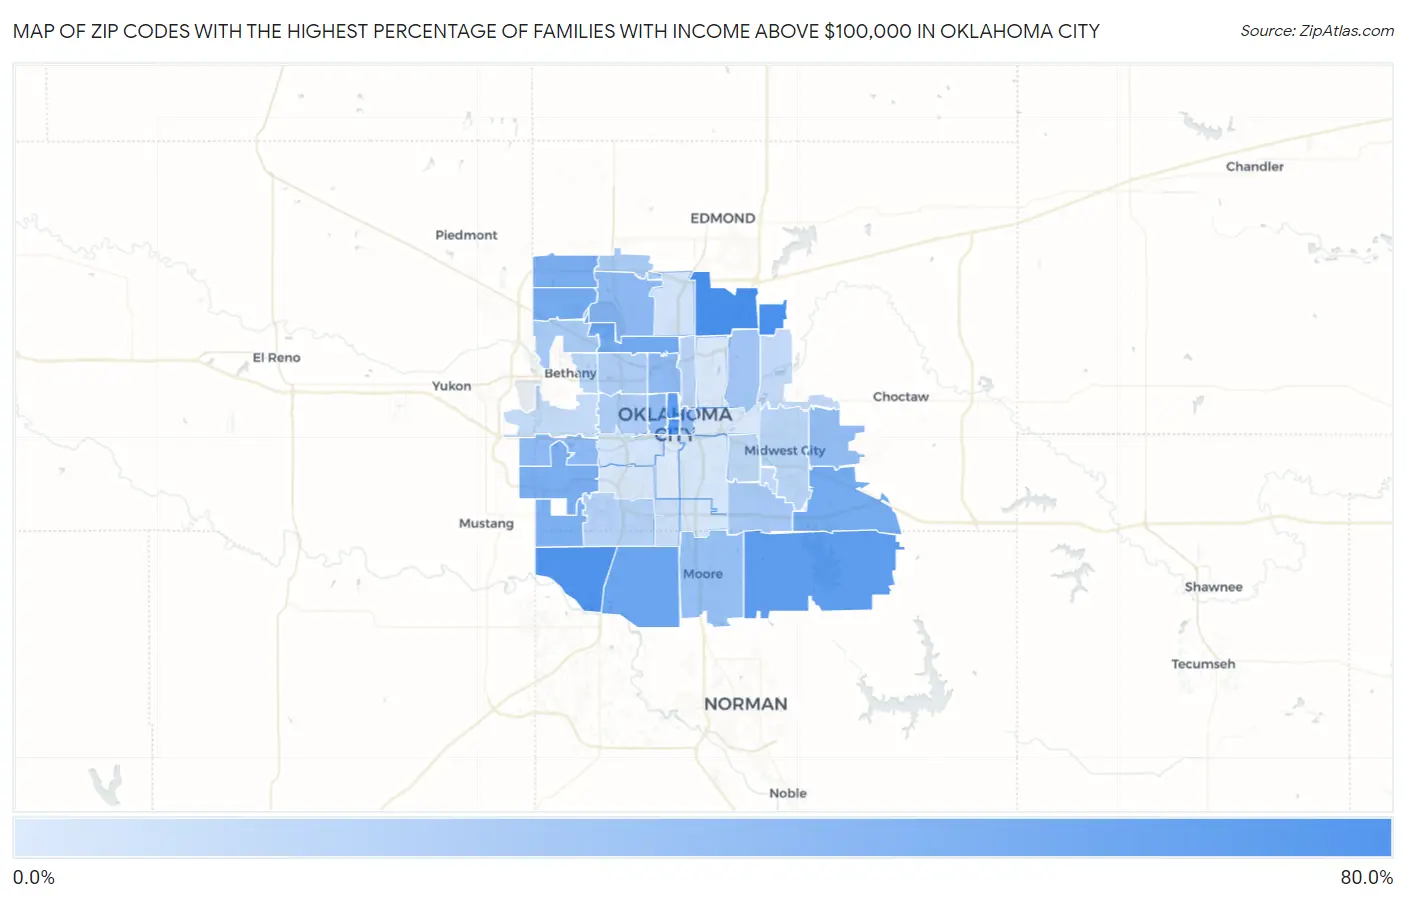
Map of Zip Codes with the Highest Percentage of Families with Income Above $100,000 in Oklahoma City

0.0%
80.0%
Zip Codes with the Highest Percentage of Families with Income Above $100,000 in Oklahoma City Map

Zip Codes with the Highest Percentage of Families with Income Above $100,000 in Oklahoma City, OK

Zip Code Families with Income > $100k vs State vs National
1.7313177.9%36.7%(+41.2)#646.1%(+31.8)#1,276
2.7315176.2%36.7%(+39.5)#1046.1%(+30.1)#1,535
3.7317373.5%36.7%(+36.8)#1146.1%(+27.4)#1,958
4.7310269.7%36.7%(+33.0)#1346.1%(+23.6)#2,680
5.7316565.6%36.7%(+28.9)#1646.1%(+19.5)#3,586
6.7310364.8%36.7%(+28.1)#1846.1%(+18.7)#3,801
7.7317057.4%36.7%(+20.7)#3046.1%(+11.3)#5,972
8.7311654.6%36.7%(+17.9)#4046.1%(+8.50)#6,943
9.7316253.6%36.7%(+16.9)#4846.1%(+7.50)#7,306
10.7315053.1%36.7%(+16.4)#5246.1%(+7.00)#7,508
11.7314251.1%36.7%(+14.4)#6546.1%(+5.00)#8,368
12.7317951.1%36.7%(+14.4)#6646.1%(+5.00)#8,372
13.7316950.2%36.7%(+13.5)#7246.1%(+4.10)#8,743
14.7312042.6%36.7%(+5.90)#13046.1%(-3.50)#12,739
15.7312841.2%36.7%(+4.50)#14446.1%(-4.90)#13,610
16.7311840.6%36.7%(+3.90)#14846.1%(-5.50)#13,993
17.7310440.1%36.7%(+3.40)#15346.1%(-6.00)#14,338
18.7310639.7%36.7%(+3.00)#16546.1%(-6.40)#14,612
19.7313039.2%36.7%(+2.50)#17046.1%(-6.90)#14,931
20.7316038.0%36.7%(+1.30)#18746.1%(-8.10)#15,736
21.7312133.3%36.7%(-3.40)#24746.1%(-12.8)#19,074
22.7313530.9%36.7%(-5.80)#27946.1%(-15.2)#20,786
23.7313230.2%36.7%(-6.50)#29146.1%(-15.9)#21,266
24.7313430.1%36.7%(-6.60)#29346.1%(-16.0)#21,347
25.7311228.2%36.7%(-8.50)#33346.1%(-17.9)#22,629
26.7310727.7%36.7%(-9.00)#34646.1%(-18.4)#22,971
27.7315923.9%36.7%(-12.8)#42246.1%(-22.2)#25,329
28.7310522.8%36.7%(-13.9)#45146.1%(-23.3)#25,901
29.7311022.0%36.7%(-14.7)#46446.1%(-24.1)#26,292
30.7312222.0%36.7%(-14.7)#46646.1%(-24.1)#26,298
31.7311521.4%36.7%(-15.3)#47946.1%(-24.7)#26,590
32.7314120.0%36.7%(-16.7)#49446.1%(-26.1)#27,231
33.7314519.3%36.7%(-17.4)#51546.1%(-26.8)#27,569
34.7312718.3%36.7%(-18.4)#53346.1%(-27.8)#27,961
35.7313916.8%36.7%(-19.9)#55446.1%(-29.3)#28,510
36.7311413.4%36.7%(-23.3)#58946.1%(-32.7)#29,577
37.7310812.9%36.7%(-23.8)#59246.1%(-33.2)#29,726
38.7314911.8%36.7%(-24.9)#59846.1%(-34.3)#29,994
39.7312911.5%36.7%(-25.2)#60046.1%(-34.6)#30,052
40.7311111.3%36.7%(-25.4)#60246.1%(-34.8)#30,094
41.7311910.8%36.7%(-25.9)#60746.1%(-35.3)#30,186
42.731179.8%36.7%(-26.9)#61046.1%(-36.3)#30,365
43.731099.3%36.7%(-27.4)#61446.1%(-36.8)#30,443

Common Questions

What are the Top 10 Zip Codes with the Highest Percentage of Families with Income Above $100,000 in Oklahoma City, OK?
Top 10 Zip Codes with the Highest Percentage of Families with Income Above $100,000 in Oklahoma City, OK are:
#1
77.9%
#2
76.2%
#3
73.5%
#4
69.7%
#5
65.6%
#6
64.8%
#7
57.4%
#8
54.6%
#9
53.6%
#10
53.1%
What zip code has the Highest Percentage of Families with Income Above $100,000 in Oklahoma City, OK?
73131 has the Highest Percentage of Families with Income Above $100,000 in Oklahoma City, OK with 77.9%.
What is the Percentage of Families with Income Above $100,000 in Oklahoma City, OK?
Percentage of Families with Income Above $100,000 in Oklahoma City is 38.8%.
What is the Percentage of Families with Income Above $100,000 in Oklahoma?
Percentage of Families with Income Above $100,000 in Oklahoma is 36.7%.
What is the Percentage of Families with Income Above $100,000 in the United States?
Percentage of Families with Income Above $100,000 in the United States is 46.1%.