Zip Codes with the Highest Percentage of Population Employed in Cleaning & Maintenance in Oklahoma City, OK

RELATED REPORTS & OPTIONS

Cleaning & Maintenance
Population
Families and Households
Female Fertility
Female Fertility (Unmarried)
Race (Community Size)
Race (Percentage)
Ancestry (Community Size)
AfricanAlaska NativeAlbanianAmericanApacheArabArapahoArgentineanArmenianAustralianAustrianBahamianBangladeshiBarbadianBasqueBelgianBhutaneseBlackfeetBolivianBrazilianBritishBritish West IndianBulgarianBurmeseCajunCambodianCanadianCelticCentral AmericanCentral American IndianCherokeeCheyenneChickasawChileanChippewaChoctawColombianComancheCreeCreekCroatianCubanCzechCzechoslovakianDanishDelawareDominicanDutchDutch West IndianEastern EuropeanEcuadorianEgyptianEnglishEstonianEthiopianEuropeanFijianFilipinoFinnishFrenchFrench American IndianFrench CanadianGermanGerman RussianGhanaianGreekGuamanian / ChamorroGuatemalanGuyaneseHaitianHonduranHopiHungarianIcelanderIndian (Asian)IndonesianInupiatIranianIraqiIrishIroquoisIsraeliItalianJamaicanJapaneseJordanianKenyanKiowaKoreanLaotianLatvianLebaneseLiberianLithuanianLuxembourgerMalaysianMexicanMexican American IndianMongolianMoroccanNative HawaiianNavajoNew ZealanderNicaraguanNigerianNorthern EuropeanNorwegianOkinawanOsagePakistaniPalestinianPanamanianPennsylvania GermanPeruvianPimaPolishPortuguesePotawatomiPuebloPuerto RicanRomanianRussianSalvadoranSamoanScandinavianScotch-IrishScottishSeminoleSerbianSiouxSlavicSlovakSloveneSouth AfricanSouth AmericanSouth American IndianSpaniardSpanishSpanish American IndianSri LankanSubsaharan AfricanSudaneseSwedishSwissSyrianThaiTlingit-HaidaTonganTrinidadian and TobagonianTurkishU.S. Virgin IslanderUkrainianUruguayanVenezuelanVietnameseWelshWest IndianYugoslavianZimbabwean
Ancestry (Percentage)
AfricanAlaska NativeAlbanianAmericanApacheArabArapahoArgentineanArmenianAustralianAustrianBahamianBangladeshiBarbadianBasqueBelgianBhutaneseBlackfeetBolivianBrazilianBritishBritish West IndianBulgarianBurmeseCajunCambodianCanadianCelticCentral AmericanCentral American IndianCherokeeCheyenneChickasawChileanChippewaChoctawColombianComancheCreeCreekCroatianCubanCzechCzechoslovakianDanishDelawareDominicanDutchDutch West IndianEastern EuropeanEcuadorianEgyptianEnglishEstonianEthiopianEuropeanFijianFilipinoFinnishFrenchFrench American IndianFrench CanadianGermanGerman RussianGhanaianGreekGuamanian / ChamorroGuatemalanGuyaneseHaitianHonduranHopiHungarianIcelanderIndian (Asian)IndonesianInupiatIranianIraqiIrishIroquoisIsraeliItalianJamaicanJapaneseJordanianKenyanKiowaKoreanLaotianLatvianLebaneseLiberianLithuanianLuxembourgerMalaysianMexicanMexican American IndianMongolianMoroccanNative HawaiianNavajoNew ZealanderNicaraguanNigerianNorthern EuropeanNorwegianOkinawanOsagePakistaniPalestinianPanamanianPennsylvania GermanPeruvianPimaPolishPortuguesePotawatomiPuebloPuerto RicanRomanianRussianSalvadoranSamoanScandinavianScotch-IrishScottishSeminoleSerbianSiouxSlavicSlovakSloveneSouth AfricanSouth AmericanSouth American IndianSpaniardSpanishSpanish American IndianSri LankanSubsaharan AfricanSudaneseSwedishSwissSyrianThaiTlingit-HaidaTonganTrinidadian and TobagonianTurkishU.S. Virgin IslanderUkrainianUruguayanVenezuelanVietnameseWelshWest IndianYugoslavianZimbabwean
Immigrant Origin (Total)
AfricaArgentinaAsiaAustraliaAustriaBahamasBangladeshBosnia and HerzegovinaBrazilBulgariaBurma / MyanmarCambodiaCameroonCanadaCaribbeanCentral AmericaChileChinaColombiaCubaDominican RepublicEastern AfricaEastern AsiaEastern EuropeEcuadorEgyptEl SalvadorEnglandEritreaEthiopiaEuropeFranceGermanyGhanaGreeceGuatemalaHondurasHong KongIndiaIndonesiaIranIraqIrelandItalyJamaicaJapanJordanKazakhstanKenyaKoreaKuwaitLaosLatin AmericaLebanonLiberiaMalaysiaMexicoMiddle AfricaMoroccoNepalNetherlandsNicaraguaNigeriaNorthern AfricaNorthern EuropeNorwayOceaniaPakistanPanamaPeruPhilippinesPolandPortugalRussiaSaudi ArabiaScotlandSingaporeSouth AfricaSouth AmericaSouth Central AsiaSouth Eastern AsiaSouthern EuropeSpainSudanSyriaTaiwanThailandTrinidad and TobagoTurkeyUkraineVenezuelaVietnamWestern AfricaWestern AsiaWestern EuropeZaireZimbabwe
Immigrant Origin (Percentage)
AfricaArgentinaAsiaAustraliaAustriaBahamasBangladeshBosnia and HerzegovinaBrazilBulgariaBurma / MyanmarCambodiaCameroonCanadaCaribbeanCentral AmericaChileChinaColombiaCubaDominican RepublicEastern AfricaEastern AsiaEastern EuropeEcuadorEgyptEl SalvadorEnglandEritreaEthiopiaEuropeFranceGermanyGhanaGreeceGuatemalaHondurasHong KongIndiaIndonesiaIranIraqIrelandItalyJamaicaJapanJordanKazakhstanKenyaKoreaKuwaitLaosLatin AmericaLebanonLiberiaMalaysiaMexicoMiddle AfricaMoroccoNepalNetherlandsNicaraguaNigeriaNorthern AfricaNorthern EuropeNorwayOceaniaPakistanPanamaPeruPhilippinesPolandPortugalRussiaSaudi ArabiaScotlandSingaporeSouth AfricaSouth AmericaSouth Central AsiaSouth Eastern AsiaSouthern EuropeSpainSudanSyriaTaiwanThailandTrinidad and TobagoTurkeyUkraineVenezuelaVietnamWestern AfricaWestern AsiaWestern EuropeZaireZimbabwe
Income
Income (Families)
Income (Households)
Poverty
Poverty (Families)
Unemployment
Employment Occupations
Employment Industries
Employer Class
Commute Time
Commute Means
School Enrollment
Education by Degree Field
Occupancy
Finances
Physical Characteristics
Oklahoma City
Compare Zip Codes
Comparison Subject

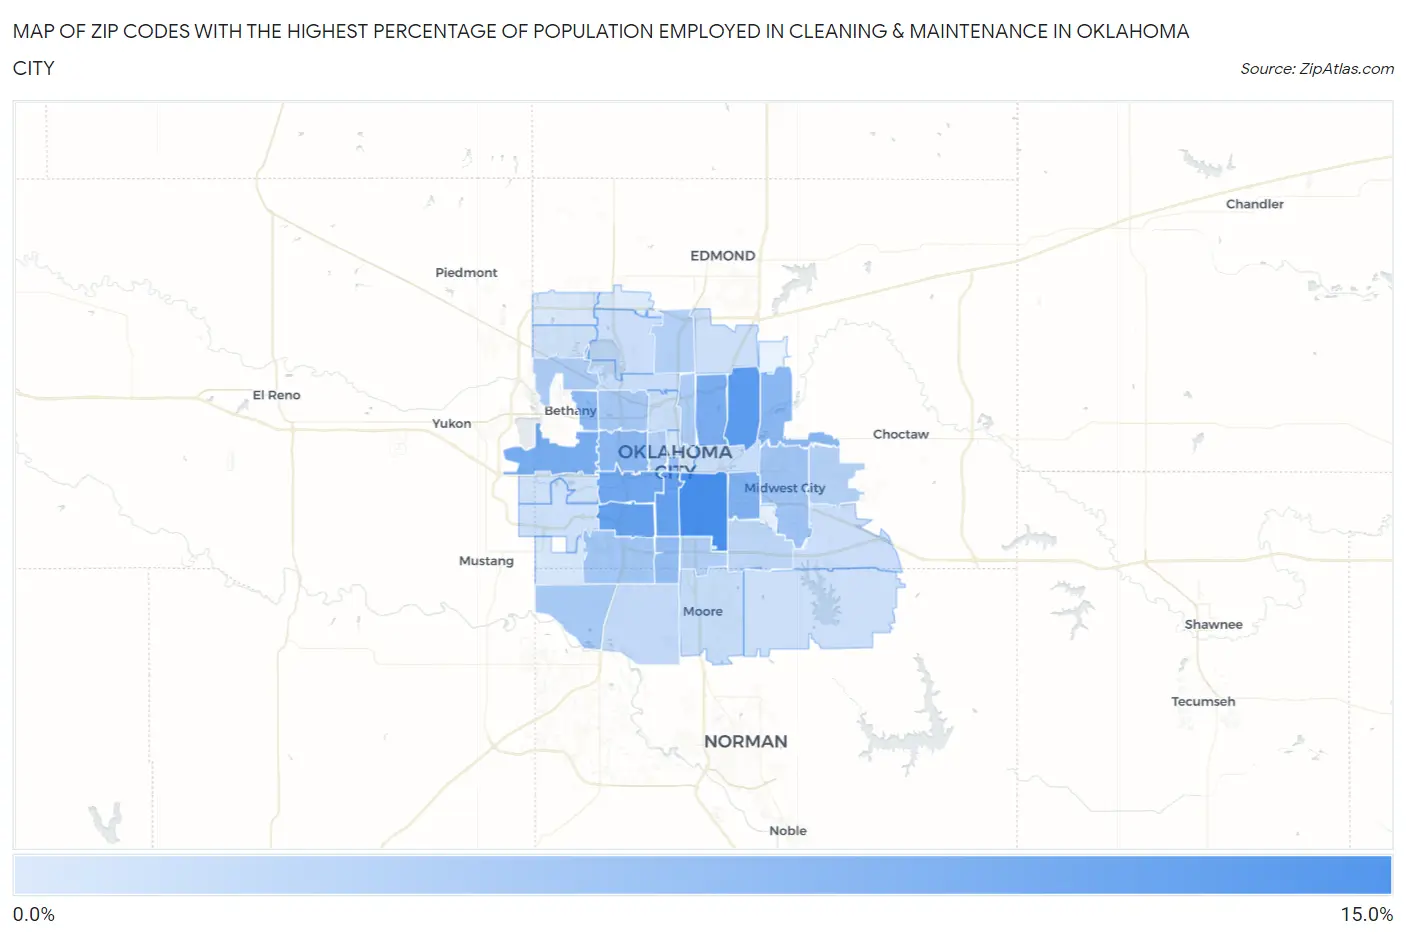
Map of Zip Codes with the Highest Percentage of Population Employed in Cleaning & Maintenance in Oklahoma City

0.0%
15.0%
Zip Codes with the Highest Percentage of Population Employed in Cleaning & Maintenance in Oklahoma City Map

Zip Codes with the Highest Percentage of Population Employed in Cleaning & Maintenance in Oklahoma City, OK

Zip Code % Employed vs State vs National
1.7312911.5%3.6%(+7.84)#203.5%(+7.99)#1,342
2.731219.9%3.6%(+6.22)#283.5%(+6.37)#1,875
3.731199.2%3.6%(+5.59)#383.5%(+5.75)#2,175
4.731099.2%3.6%(+5.54)#393.5%(+5.69)#2,202
5.731088.3%3.6%(+4.70)#533.5%(+4.86)#2,737
6.731277.7%3.6%(+4.11)#633.5%(+4.26)#3,279
7.731117.6%3.6%(+3.97)#673.5%(+4.12)#3,431
8.731157.0%3.6%(+3.36)#733.5%(+3.51)#4,078
9.731076.4%3.6%(+2.80)#863.5%(+2.96)#4,873
10.731416.4%3.6%(+2.77)#883.5%(+2.93)#4,920
11.731226.0%3.6%(+2.38)#1063.5%(+2.54)#5,610
12.731395.7%3.6%(+2.02)#1273.5%(+2.17)#6,351
13.731025.4%3.6%(+1.78)#1423.5%(+1.93)#6,899
14.731104.6%3.6%(+0.970)#1923.5%(+1.12)#9,124
15.731594.5%3.6%(+0.833)#2043.5%(+0.985)#9,600
16.731124.4%3.6%(+0.773)#2113.5%(+0.926)#9,795
17.731734.1%3.6%(+0.504)#2383.5%(+0.656)#10,787
18.731053.9%3.6%(+0.253)#2633.5%(+0.405)#11,767
19.731323.9%3.6%(+0.227)#2683.5%(+0.379)#11,872
20.731063.7%3.6%(+0.043)#2853.5%(+0.196)#12,648
21.731493.4%3.6%(-0.201)#3143.5%(-0.048)#13,720
22.731143.3%3.6%(-0.356)#3273.5%(-0.204)#14,466
23.731303.2%3.6%(-0.460)#3373.5%(-0.307)#14,996
24.731352.6%3.6%(-0.994)#3873.5%(-0.841)#17,754
25.731702.4%3.6%(-1.25)#4173.5%(-1.10)#19,146
26.731602.0%3.6%(-1.65)#4543.5%(-1.50)#21,133
27.731161.9%3.6%(-1.76)#4613.5%(-1.61)#21,681
28.731171.8%3.6%(-1.80)#4663.5%(-1.64)#21,862
29.731181.8%3.6%(-1.80)#4673.5%(-1.64)#21,864
30.731501.8%3.6%(-1.88)#4783.5%(-1.73)#22,306
31.731201.7%3.6%(-1.94)#4833.5%(-1.79)#22,553
32.731651.6%3.6%(-2.08)#4943.5%(-1.93)#23,235
33.731311.5%3.6%(-2.15)#5003.5%(-1.99)#23,551
34.731791.5%3.6%(-2.18)#5053.5%(-2.03)#23,697
35.731281.4%3.6%(-2.24)#5113.5%(-2.08)#23,938
36.731621.3%3.6%(-2.37)#5183.5%(-2.21)#24,531
37.731041.1%3.6%(-2.54)#5303.5%(-2.39)#25,173
38.731031.1%3.6%(-2.58)#5353.5%(-2.43)#25,306
39.731690.82%3.6%(-2.82)#5453.5%(-2.67)#26,123
40.731420.62%3.6%(-3.01)#5563.5%(-2.86)#26,670
41.731340.37%3.6%(-3.27)#5623.5%(-3.12)#27,265

Common Questions

What are the Top 10 Zip Codes with the Highest Percentage of Population Employed in Cleaning & Maintenance in Oklahoma City, OK?
Top 10 Zip Codes with the Highest Percentage of Population Employed in Cleaning & Maintenance in Oklahoma City, OK are:
#1
11.5%
#2
9.9%
#3
9.2%
#4
9.2%
#5
8.3%
#6
7.7%
#7
7.6%
#8
7.0%
#9
6.4%
#10
6.4%
What zip code has the Highest Percentage of Population Employed in Cleaning & Maintenance in Oklahoma City, OK?
73129 has the Highest Percentage of Population Employed in Cleaning & Maintenance in Oklahoma City, OK with 11.5%.
What is the Percentage of Population Employed in Cleaning & Maintenance in Oklahoma City, OK?
Percentage of Population Employed in Cleaning & Maintenance in Oklahoma City is 3.5%.
What is the Percentage of Population Employed in Cleaning & Maintenance in Oklahoma?
Percentage of Population Employed in Cleaning & Maintenance in Oklahoma is 3.6%.
What is the Percentage of Population Employed in Cleaning & Maintenance in the United States?
Percentage of Population Employed in Cleaning & Maintenance in the United States is 3.5%.