Zip Codes with the Highest Percentage of Population with a Degree in Communications in Oklahoma City, OK

RELATED REPORTS & OPTIONS

Communications
Population
Families and Households
Female Fertility
Female Fertility (Unmarried)
Race (Community Size)
Race (Percentage)
Ancestry (Community Size)
AfricanAlaska NativeAlbanianAmericanApacheArabArapahoArgentineanArmenianAustralianAustrianBahamianBangladeshiBarbadianBasqueBelgianBhutaneseBlackfeetBolivianBrazilianBritishBritish West IndianBulgarianBurmeseCajunCambodianCanadianCelticCentral AmericanCentral American IndianCherokeeCheyenneChickasawChileanChippewaChoctawColombianComancheCreeCreekCroatianCubanCzechCzechoslovakianDanishDelawareDominicanDutchDutch West IndianEastern EuropeanEcuadorianEgyptianEnglishEstonianEthiopianEuropeanFijianFilipinoFinnishFrenchFrench American IndianFrench CanadianGermanGerman RussianGhanaianGreekGuamanian / ChamorroGuatemalanGuyaneseHaitianHonduranHopiHungarianIcelanderIndian (Asian)IndonesianInupiatIranianIraqiIrishIroquoisIsraeliItalianJamaicanJapaneseJordanianKenyanKiowaKoreanLaotianLatvianLebaneseLiberianLithuanianLuxembourgerMalaysianMexicanMexican American IndianMongolianMoroccanNative HawaiianNavajoNew ZealanderNicaraguanNigerianNorthern EuropeanNorwegianOkinawanOsagePakistaniPalestinianPanamanianPennsylvania GermanPeruvianPimaPolishPortuguesePotawatomiPuebloPuerto RicanRomanianRussianSalvadoranSamoanScandinavianScotch-IrishScottishSeminoleSerbianSiouxSlavicSlovakSloveneSouth AfricanSouth AmericanSouth American IndianSpaniardSpanishSpanish American IndianSri LankanSubsaharan AfricanSudaneseSwedishSwissSyrianThaiTlingit-HaidaTonganTrinidadian and TobagonianTurkishU.S. Virgin IslanderUkrainianUruguayanVenezuelanVietnameseWelshWest IndianYugoslavianZimbabwean
Ancestry (Percentage)
AfricanAlaska NativeAlbanianAmericanApacheArabArapahoArgentineanArmenianAustralianAustrianBahamianBangladeshiBarbadianBasqueBelgianBhutaneseBlackfeetBolivianBrazilianBritishBritish West IndianBulgarianBurmeseCajunCambodianCanadianCelticCentral AmericanCentral American IndianCherokeeCheyenneChickasawChileanChippewaChoctawColombianComancheCreeCreekCroatianCubanCzechCzechoslovakianDanishDelawareDominicanDutchDutch West IndianEastern EuropeanEcuadorianEgyptianEnglishEstonianEthiopianEuropeanFijianFilipinoFinnishFrenchFrench American IndianFrench CanadianGermanGerman RussianGhanaianGreekGuamanian / ChamorroGuatemalanGuyaneseHaitianHonduranHopiHungarianIcelanderIndian (Asian)IndonesianInupiatIranianIraqiIrishIroquoisIsraeliItalianJamaicanJapaneseJordanianKenyanKiowaKoreanLaotianLatvianLebaneseLiberianLithuanianLuxembourgerMalaysianMexicanMexican American IndianMongolianMoroccanNative HawaiianNavajoNew ZealanderNicaraguanNigerianNorthern EuropeanNorwegianOkinawanOsagePakistaniPalestinianPanamanianPennsylvania GermanPeruvianPimaPolishPortuguesePotawatomiPuebloPuerto RicanRomanianRussianSalvadoranSamoanScandinavianScotch-IrishScottishSeminoleSerbianSiouxSlavicSlovakSloveneSouth AfricanSouth AmericanSouth American IndianSpaniardSpanishSpanish American IndianSri LankanSubsaharan AfricanSudaneseSwedishSwissSyrianThaiTlingit-HaidaTonganTrinidadian and TobagonianTurkishU.S. Virgin IslanderUkrainianUruguayanVenezuelanVietnameseWelshWest IndianYugoslavianZimbabwean
Immigrant Origin (Total)
AfricaArgentinaAsiaAustraliaAustriaBahamasBangladeshBosnia and HerzegovinaBrazilBulgariaBurma / MyanmarCambodiaCameroonCanadaCaribbeanCentral AmericaChileChinaColombiaCubaDominican RepublicEastern AfricaEastern AsiaEastern EuropeEcuadorEgyptEl SalvadorEnglandEritreaEthiopiaEuropeFranceGermanyGhanaGreeceGuatemalaHondurasHong KongIndiaIndonesiaIranIraqIrelandItalyJamaicaJapanJordanKazakhstanKenyaKoreaKuwaitLaosLatin AmericaLebanonLiberiaMalaysiaMexicoMiddle AfricaMoroccoNepalNetherlandsNicaraguaNigeriaNorthern AfricaNorthern EuropeNorwayOceaniaPakistanPanamaPeruPhilippinesPolandPortugalRussiaSaudi ArabiaScotlandSingaporeSouth AfricaSouth AmericaSouth Central AsiaSouth Eastern AsiaSouthern EuropeSpainSudanSyriaTaiwanThailandTrinidad and TobagoTurkeyUkraineVenezuelaVietnamWestern AfricaWestern AsiaWestern EuropeZaireZimbabwe
Immigrant Origin (Percentage)
AfricaArgentinaAsiaAustraliaAustriaBahamasBangladeshBosnia and HerzegovinaBrazilBulgariaBurma / MyanmarCambodiaCameroonCanadaCaribbeanCentral AmericaChileChinaColombiaCubaDominican RepublicEastern AfricaEastern AsiaEastern EuropeEcuadorEgyptEl SalvadorEnglandEritreaEthiopiaEuropeFranceGermanyGhanaGreeceGuatemalaHondurasHong KongIndiaIndonesiaIranIraqIrelandItalyJamaicaJapanJordanKazakhstanKenyaKoreaKuwaitLaosLatin AmericaLebanonLiberiaMalaysiaMexicoMiddle AfricaMoroccoNepalNetherlandsNicaraguaNigeriaNorthern AfricaNorthern EuropeNorwayOceaniaPakistanPanamaPeruPhilippinesPolandPortugalRussiaSaudi ArabiaScotlandSingaporeSouth AfricaSouth AmericaSouth Central AsiaSouth Eastern AsiaSouthern EuropeSpainSudanSyriaTaiwanThailandTrinidad and TobagoTurkeyUkraineVenezuelaVietnamWestern AfricaWestern AsiaWestern EuropeZaireZimbabwe
Income
Income (Families)
Income (Households)
Poverty
Poverty (Families)
Unemployment
Employment Occupations
Employment Industries
Employer Class
Commute Time
Commute Means
School Enrollment
Education by Degree Field
Occupancy
Finances
Physical Characteristics
Oklahoma City
Compare Zip Codes
Comparison Subject

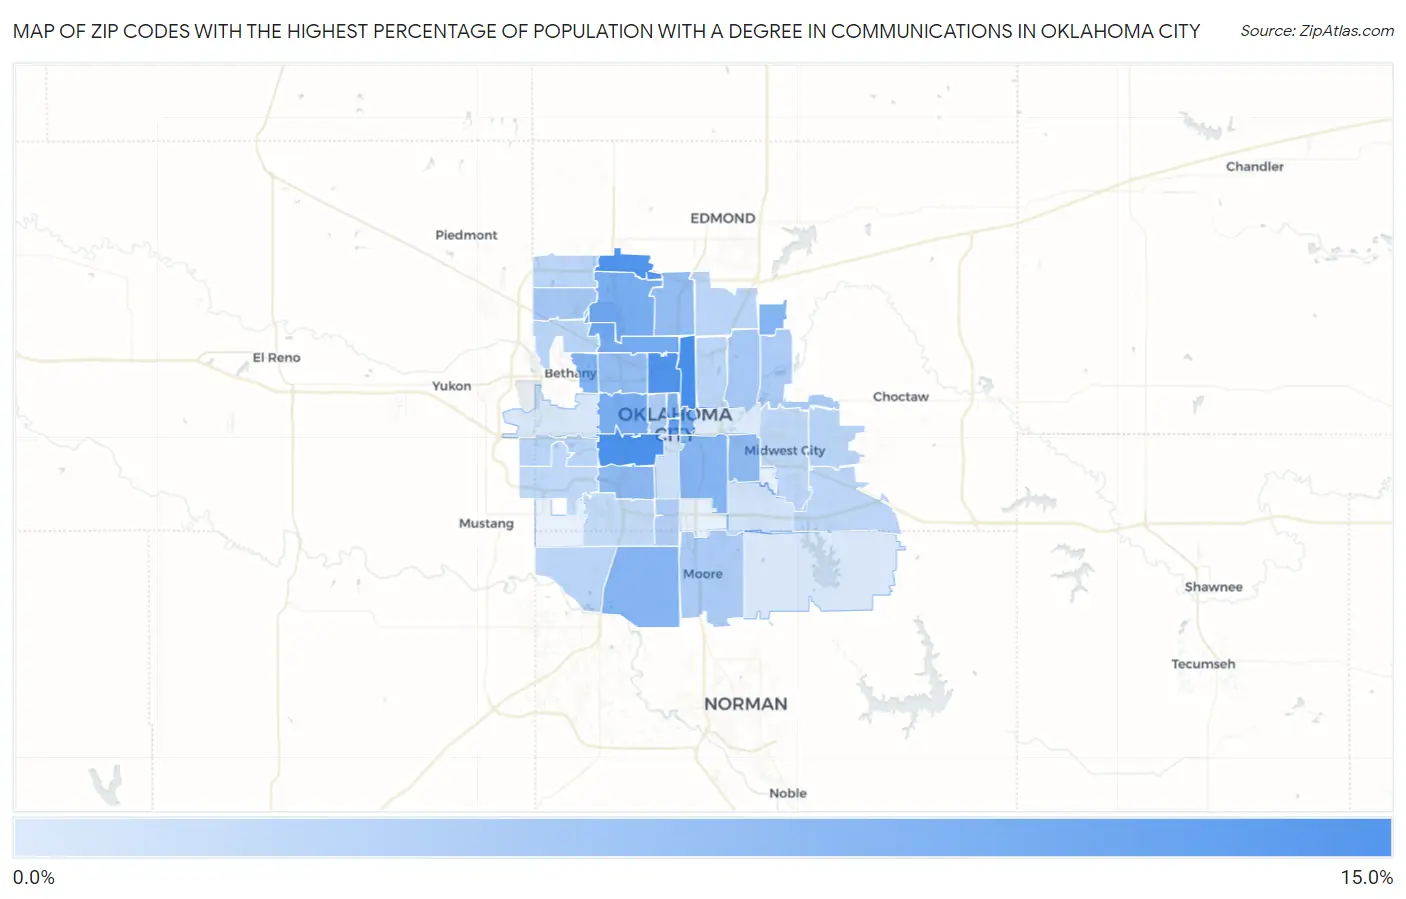
Map of Zip Codes with the Highest Percentage of Population with a Degree in Communications in Oklahoma City

0.0%
15.0%
Zip Codes with the Highest Percentage of Population with a Degree in Communications in Oklahoma City Map

Zip Codes with the Highest Percentage of Population with a Degree in Communications in Oklahoma City, OK

Zip Code % Graduates vs State vs National
1.7310511.4%3.8%(+7.57)#164.1%(+7.23)#919
2.7310811.0%3.8%(+7.18)#194.1%(+6.84)#985
3.7311810.9%3.8%(+7.12)#204.1%(+6.78)#991
4.7313410.9%3.8%(+7.09)#214.1%(+6.75)#997
5.731029.5%3.8%(+5.71)#284.1%(+5.37)#1,265
6.731167.9%3.8%(+4.08)#404.1%(+3.74)#1,953
7.731047.8%3.8%(+4.03)#434.1%(+3.69)#1,992
8.731207.7%3.8%(+3.95)#444.1%(+3.61)#2,030
9.731077.7%3.8%(+3.93)#454.1%(+3.59)#2,042
10.731037.5%3.8%(+3.71)#504.1%(+3.37)#2,181
11.731227.2%3.8%(+3.37)#544.1%(+3.03)#2,458
12.731517.0%3.8%(+3.21)#564.1%(+2.87)#2,600
13.731296.7%3.8%(+2.95)#604.1%(+2.61)#2,859
14.731706.7%3.8%(+2.92)#614.1%(+2.58)#2,895
15.731196.3%3.8%(+2.55)#654.1%(+2.21)#3,321
16.731156.1%3.8%(+2.28)#714.1%(+1.94)#3,660
17.731145.8%3.8%(+1.98)#794.1%(+1.64)#4,161
18.731125.7%3.8%(+1.90)#814.1%(+1.56)#4,287
19.731214.5%3.8%(+0.659)#1214.1%(+0.319)#7,084
20.731624.4%3.8%(+0.590)#1234.1%(+0.250)#7,289
21.731604.2%3.8%(+0.368)#1324.1%(+0.028)#8,018
22.731414.1%3.8%(+0.275)#1364.1%(-0.065)#8,349
23.731064.0%3.8%(+0.182)#1414.1%(-0.157)#8,649
24.731393.8%3.8%(+0.002)#1504.1%(-0.338)#9,281
25.731423.1%3.8%(-0.733)#1804.1%(-1.07)#11,966
26.731323.1%3.8%(-0.740)#1814.1%(-1.08)#11,991
27.731313.0%3.8%(-0.809)#1854.1%(-1.15)#12,235
28.731283.0%3.8%(-0.819)#1874.1%(-1.16)#12,283
29.731733.0%3.8%(-0.826)#1884.1%(-1.17)#12,313
30.731113.0%3.8%(-0.845)#1904.1%(-1.18)#12,389
31.731302.9%3.8%(-0.874)#1914.1%(-1.21)#12,515
32.731502.8%3.8%(-1.02)#2004.1%(-1.36)#13,111
33.731102.7%3.8%(-1.10)#2074.1%(-1.44)#13,444
34.731792.6%3.8%(-1.17)#2124.1%(-1.51)#13,701
35.731592.4%3.8%(-1.40)#2234.1%(-1.74)#14,505
36.731091.5%3.8%(-2.29)#2824.1%(-2.63)#17,484
37.731351.3%3.8%(-2.47)#2954.1%(-2.81)#18,051
38.731270.92%3.8%(-2.87)#3254.1%(-3.21)#19,186
39.731650.91%3.8%(-2.88)#3264.1%(-3.22)#19,211
40.731170.60%3.8%(-3.19)#3454.1%(-3.53)#19,928

Common Questions

What are the Top 10 Zip Codes with the Highest Percentage of Population with a Degree in Communications in Oklahoma City, OK?
Top 10 Zip Codes with the Highest Percentage of Population with a Degree in Communications in Oklahoma City, OK are:
#1
11.4%
#2
11.0%
#3
10.9%
#4
10.9%
#5
9.5%
#6
7.9%
#7
7.8%
#8
7.7%
#9
7.7%
#10
7.5%
What zip code has the Highest Percentage of Population with a Degree in Communications in Oklahoma City, OK?
73105 has the Highest Percentage of Population with a Degree in Communications in Oklahoma City, OK with 11.4%.
What is the Percentage of Population with a Degree in Communications in Oklahoma City, OK?
Percentage of Population with a Degree in Communications in Oklahoma City is 5.0%.
What is the Percentage of Population with a Degree in Communications in Oklahoma?
Percentage of Population with a Degree in Communications in Oklahoma is 3.8%.
What is the Percentage of Population with a Degree in Communications in the United States?
Percentage of Population with a Degree in Communications in the United States is 4.1%.