Zip Codes with the Highest Percentage of Population Employed in Legal Services & Support in Oklahoma City, OK

RELATED REPORTS & OPTIONS

Legal Services & Support
Population
Families and Households
Female Fertility
Female Fertility (Unmarried)
Race (Community Size)
Race (Percentage)
Ancestry (Community Size)
AfricanAlaska NativeAlbanianAmericanApacheArabArapahoArgentineanArmenianAustralianAustrianBahamianBangladeshiBarbadianBasqueBelgianBhutaneseBlackfeetBolivianBrazilianBritishBritish West IndianBulgarianBurmeseCajunCambodianCanadianCelticCentral AmericanCentral American IndianCherokeeCheyenneChickasawChileanChippewaChoctawColombianComancheCreeCreekCroatianCubanCzechCzechoslovakianDanishDelawareDominicanDutchDutch West IndianEastern EuropeanEcuadorianEgyptianEnglishEstonianEthiopianEuropeanFijianFilipinoFinnishFrenchFrench American IndianFrench CanadianGermanGerman RussianGhanaianGreekGuamanian / ChamorroGuatemalanGuyaneseHaitianHonduranHopiHungarianIcelanderIndian (Asian)IndonesianInupiatIranianIraqiIrishIroquoisIsraeliItalianJamaicanJapaneseJordanianKenyanKiowaKoreanLaotianLatvianLebaneseLiberianLithuanianLuxembourgerMalaysianMexicanMexican American IndianMongolianMoroccanNative HawaiianNavajoNew ZealanderNicaraguanNigerianNorthern EuropeanNorwegianOkinawanOsagePakistaniPalestinianPanamanianPennsylvania GermanPeruvianPimaPolishPortuguesePotawatomiPuebloPuerto RicanRomanianRussianSalvadoranSamoanScandinavianScotch-IrishScottishSeminoleSerbianSiouxSlavicSlovakSloveneSouth AfricanSouth AmericanSouth American IndianSpaniardSpanishSpanish American IndianSri LankanSubsaharan AfricanSudaneseSwedishSwissSyrianThaiTlingit-HaidaTonganTrinidadian and TobagonianTurkishU.S. Virgin IslanderUkrainianUruguayanVenezuelanVietnameseWelshWest IndianYugoslavianZimbabwean
Ancestry (Percentage)
AfricanAlaska NativeAlbanianAmericanApacheArabArapahoArgentineanArmenianAustralianAustrianBahamianBangladeshiBarbadianBasqueBelgianBhutaneseBlackfeetBolivianBrazilianBritishBritish West IndianBulgarianBurmeseCajunCambodianCanadianCelticCentral AmericanCentral American IndianCherokeeCheyenneChickasawChileanChippewaChoctawColombianComancheCreeCreekCroatianCubanCzechCzechoslovakianDanishDelawareDominicanDutchDutch West IndianEastern EuropeanEcuadorianEgyptianEnglishEstonianEthiopianEuropeanFijianFilipinoFinnishFrenchFrench American IndianFrench CanadianGermanGerman RussianGhanaianGreekGuamanian / ChamorroGuatemalanGuyaneseHaitianHonduranHopiHungarianIcelanderIndian (Asian)IndonesianInupiatIranianIraqiIrishIroquoisIsraeliItalianJamaicanJapaneseJordanianKenyanKiowaKoreanLaotianLatvianLebaneseLiberianLithuanianLuxembourgerMalaysianMexicanMexican American IndianMongolianMoroccanNative HawaiianNavajoNew ZealanderNicaraguanNigerianNorthern EuropeanNorwegianOkinawanOsagePakistaniPalestinianPanamanianPennsylvania GermanPeruvianPimaPolishPortuguesePotawatomiPuebloPuerto RicanRomanianRussianSalvadoranSamoanScandinavianScotch-IrishScottishSeminoleSerbianSiouxSlavicSlovakSloveneSouth AfricanSouth AmericanSouth American IndianSpaniardSpanishSpanish American IndianSri LankanSubsaharan AfricanSudaneseSwedishSwissSyrianThaiTlingit-HaidaTonganTrinidadian and TobagonianTurkishU.S. Virgin IslanderUkrainianUruguayanVenezuelanVietnameseWelshWest IndianYugoslavianZimbabwean
Immigrant Origin (Total)
AfricaArgentinaAsiaAustraliaAustriaBahamasBangladeshBosnia and HerzegovinaBrazilBulgariaBurma / MyanmarCambodiaCameroonCanadaCaribbeanCentral AmericaChileChinaColombiaCubaDominican RepublicEastern AfricaEastern AsiaEastern EuropeEcuadorEgyptEl SalvadorEnglandEritreaEthiopiaEuropeFranceGermanyGhanaGreeceGuatemalaHondurasHong KongIndiaIndonesiaIranIraqIrelandItalyJamaicaJapanJordanKazakhstanKenyaKoreaKuwaitLaosLatin AmericaLebanonLiberiaMalaysiaMexicoMiddle AfricaMoroccoNepalNetherlandsNicaraguaNigeriaNorthern AfricaNorthern EuropeNorwayOceaniaPakistanPanamaPeruPhilippinesPolandPortugalRussiaSaudi ArabiaScotlandSingaporeSouth AfricaSouth AmericaSouth Central AsiaSouth Eastern AsiaSouthern EuropeSpainSudanSyriaTaiwanThailandTrinidad and TobagoTurkeyUkraineVenezuelaVietnamWestern AfricaWestern AsiaWestern EuropeZaireZimbabwe
Immigrant Origin (Percentage)
AfricaArgentinaAsiaAustraliaAustriaBahamasBangladeshBosnia and HerzegovinaBrazilBulgariaBurma / MyanmarCambodiaCameroonCanadaCaribbeanCentral AmericaChileChinaColombiaCubaDominican RepublicEastern AfricaEastern AsiaEastern EuropeEcuadorEgyptEl SalvadorEnglandEritreaEthiopiaEuropeFranceGermanyGhanaGreeceGuatemalaHondurasHong KongIndiaIndonesiaIranIraqIrelandItalyJamaicaJapanJordanKazakhstanKenyaKoreaKuwaitLaosLatin AmericaLebanonLiberiaMalaysiaMexicoMiddle AfricaMoroccoNepalNetherlandsNicaraguaNigeriaNorthern AfricaNorthern EuropeNorwayOceaniaPakistanPanamaPeruPhilippinesPolandPortugalRussiaSaudi ArabiaScotlandSingaporeSouth AfricaSouth AmericaSouth Central AsiaSouth Eastern AsiaSouthern EuropeSpainSudanSyriaTaiwanThailandTrinidad and TobagoTurkeyUkraineVenezuelaVietnamWestern AfricaWestern AsiaWestern EuropeZaireZimbabwe
Income
Income (Families)
Income (Households)
Poverty
Poverty (Families)
Unemployment
Employment Occupations
Employment Industries
Employer Class
Commute Time
Commute Means
School Enrollment
Education by Degree Field
Occupancy
Finances
Physical Characteristics
Oklahoma City
Compare Zip Codes
Comparison Subject

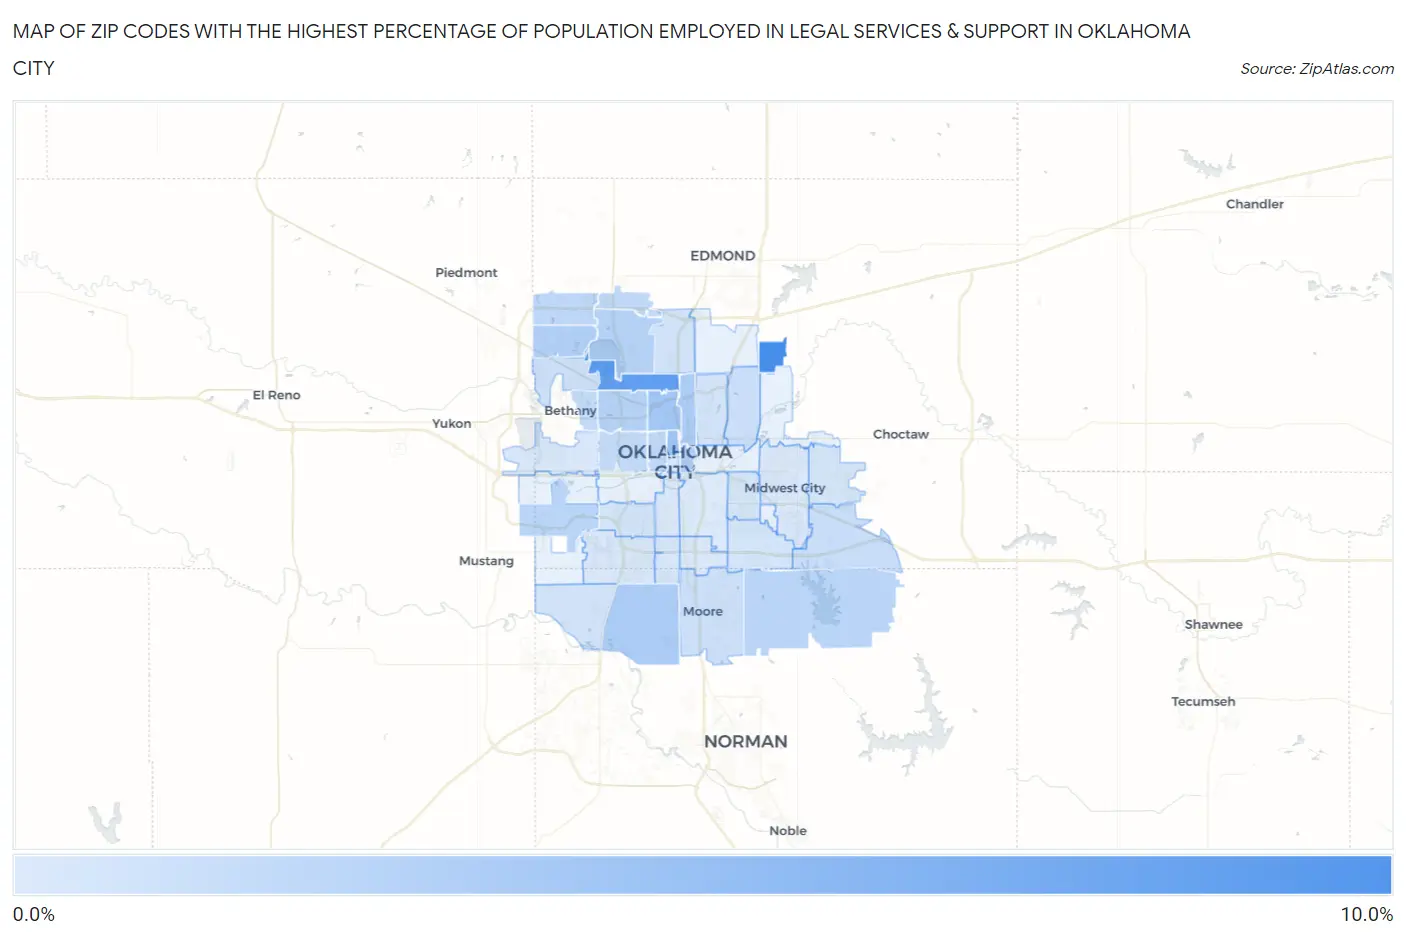
Map of Zip Codes with the Highest Percentage of Population Employed in Legal Services & Support in Oklahoma City

0.0%
10.0%
Zip Codes with the Highest Percentage of Population Employed in Legal Services & Support in Oklahoma City Map

Zip Codes with the Highest Percentage of Population Employed in Legal Services & Support in Oklahoma City, OK

Zip Code % Employed vs State vs National
1.731519.4%1.0%(+8.35)#31.2%(+8.17)#178
2.731167.7%1.0%(+6.69)#41.2%(+6.51)#287
3.731034.1%1.0%(+3.13)#131.2%(+2.96)#1,050
4.731183.5%1.0%(+2.54)#141.2%(+2.36)#1,394
5.731703.0%1.0%(+2.04)#181.2%(+1.87)#1,802
6.731053.0%1.0%(+1.95)#211.2%(+1.78)#1,891
7.731042.8%1.0%(+1.75)#271.2%(+1.57)#2,125
8.731622.5%1.0%(+1.53)#311.2%(+1.35)#2,455
9.731202.4%1.0%(+1.41)#321.2%(+1.23)#2,645
10.731122.4%1.0%(+1.40)#341.2%(+1.23)#2,660
11.731792.1%1.0%(+1.11)#411.2%(+0.939)#3,191
12.731652.1%1.0%(+1.09)#431.2%(+0.915)#3,231
13.731421.9%1.0%(+0.858)#511.2%(+0.684)#3,816
14.731341.8%1.0%(+0.772)#531.2%(+0.598)#4,050
15.731061.7%1.0%(+0.708)#571.2%(+0.534)#4,263
16.731221.6%1.0%(+0.575)#641.2%(+0.400)#4,734
17.731071.5%1.0%(+0.526)#691.2%(+0.352)#4,903
18.731501.4%1.0%(+0.358)#821.2%(+0.183)#5,622
19.731211.1%1.0%(+0.115)#991.2%(-0.059)#6,985
20.731321.1%1.0%(+0.082)#1021.2%(-0.093)#7,235
21.731601.0%1.0%(-0.003)#1191.2%(-0.177)#7,782
22.731110.83%1.0%(-0.181)#1401.2%(-0.356)#9,208
23.731140.83%1.0%(-0.182)#1411.2%(-0.356)#9,211
24.731730.80%1.0%(-0.208)#1451.2%(-0.383)#9,428
25.731350.64%1.0%(-0.369)#1811.2%(-0.544)#11,030
26.731190.62%1.0%(-0.391)#1851.2%(-0.565)#11,265
27.731390.52%1.0%(-0.484)#2101.2%(-0.659)#12,314
28.731150.47%1.0%(-0.540)#2251.2%(-0.714)#13,012
29.731300.45%1.0%(-0.560)#2291.2%(-0.735)#13,253
30.731020.42%1.0%(-0.593)#2351.2%(-0.767)#13,647
31.731270.40%1.0%(-0.604)#2381.2%(-0.779)#13,793
32.731590.40%1.0%(-0.611)#2401.2%(-0.785)#13,849
33.731090.29%1.0%(-0.723)#2781.2%(-0.898)#15,185
34.731490.27%1.0%(-0.742)#2811.2%(-0.916)#15,417
35.731100.25%1.0%(-0.762)#2861.2%(-0.937)#15,672
36.731290.092%1.0%(-0.917)#3091.2%(-1.09)#17,186

Common Questions

What are the Top 10 Zip Codes with the Highest Percentage of Population Employed in Legal Services & Support in Oklahoma City, OK?
Top 10 Zip Codes with the Highest Percentage of Population Employed in Legal Services & Support in Oklahoma City, OK are:
#1
9.4%
#2
7.7%
#3
4.1%
#4
3.5%
#5
3.0%
#6
3.0%
#7
2.8%
#8
2.5%
#9
2.4%
#10
2.4%
What zip code has the Highest Percentage of Population Employed in Legal Services & Support in Oklahoma City, OK?
73151 has the Highest Percentage of Population Employed in Legal Services & Support in Oklahoma City, OK with 9.4%.
What is the Percentage of Population Employed in Legal Services & Support in Oklahoma City, OK?
Percentage of Population Employed in Legal Services & Support in Oklahoma City is 1.6%.
What is the Percentage of Population Employed in Legal Services & Support in Oklahoma?
Percentage of Population Employed in Legal Services & Support in Oklahoma is 1.0%.
What is the Percentage of Population Employed in Legal Services & Support in the United States?
Percentage of Population Employed in Legal Services & Support in the United States is 1.2%.