Zip Codes with the Highest Percentage of Families with Income Below $10,000 in Oklahoma City, OK
RELATED REPORTS & OPTIONS
Family Income | $0-10k
Oklahoma City
Compare Zip Codes
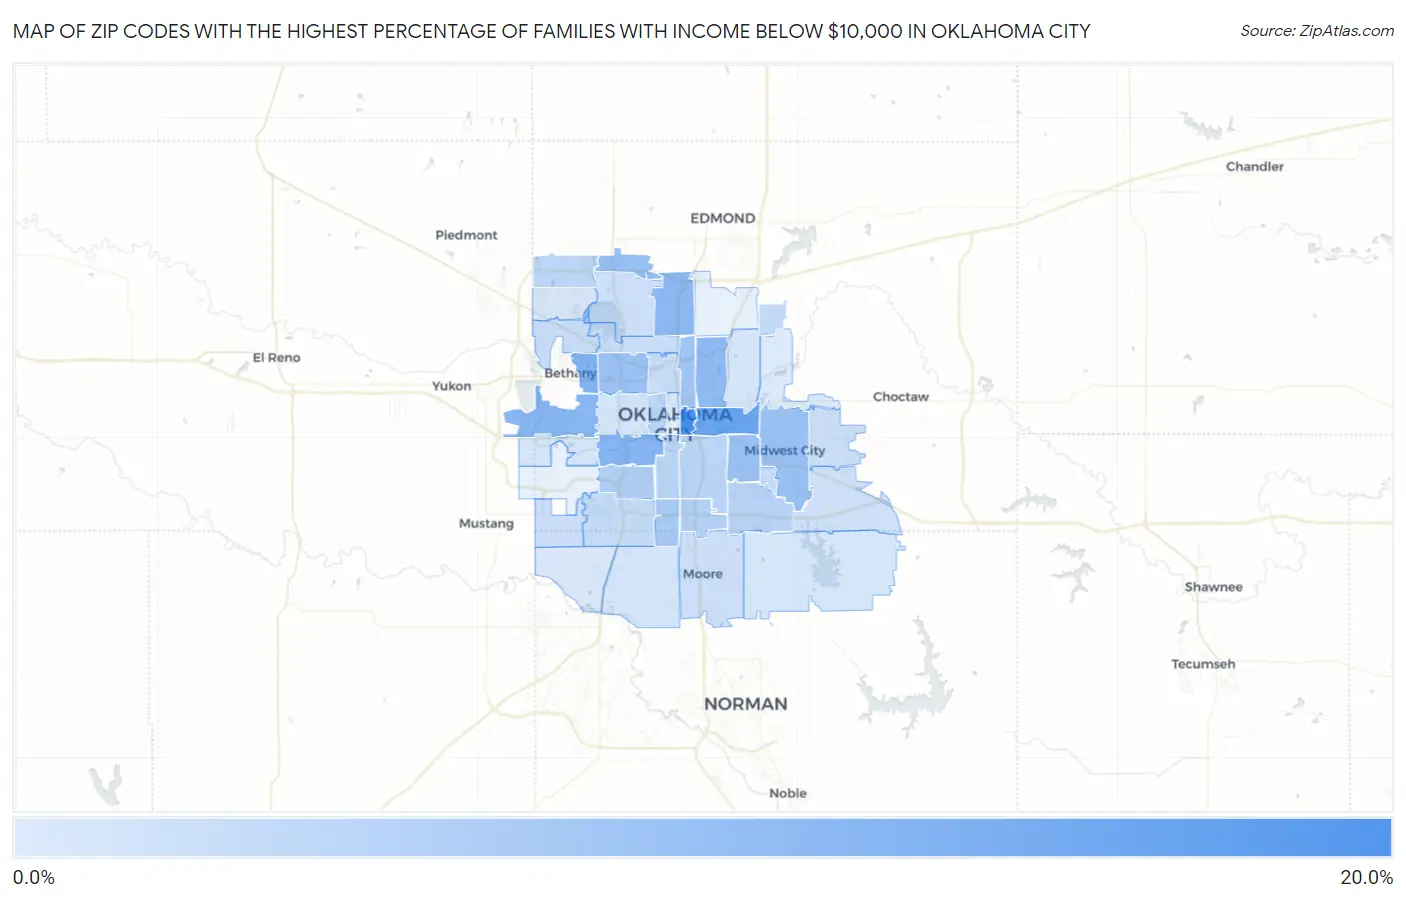
Map of Zip Codes with the Highest Percentage of Families with Income Below $10,000 in Oklahoma City
0.90%
18.9%
Zip Codes with the Highest Percentage of Families with Income Below $10,000 in Oklahoma City, OK
| Zip Code | Families with Income < $10k | vs State | vs National | |
| 1. | 73104 | 18.9% | 3.8%(+15.1)#5 | 3.1%(+15.8)#532 |
| 2. | 73117 | 14.6% | 3.8%(+10.8)#13 | 3.1%(+11.5)#903 |
| 3. | 73122 | 11.5% | 3.8%(+7.70)#28 | 3.1%(+8.40)#1,450 |
| 4. | 73108 | 11.2% | 3.8%(+7.40)#30 | 3.1%(+8.10)#1,533 |
| 5. | 73127 | 10.8% | 3.8%(+7.00)#32 | 3.1%(+7.70)#1,648 |
| 6. | 73114 | 10.1% | 3.8%(+6.30)#36 | 3.1%(+7.00)#1,868 |
| 7. | 73111 | 10.0% | 3.8%(+6.20)#37 | 3.1%(+6.90)#1,911 |
| 8. | 73134 | 9.2% | 3.8%(+5.40)#45 | 3.1%(+6.10)#2,258 |
| 9. | 73110 | 8.6% | 3.8%(+4.80)#54 | 3.1%(+5.50)#2,558 |
| 10. | 73115 | 8.6% | 3.8%(+4.80)#55 | 3.1%(+5.50)#2,567 |
| 11. | 73112 | 8.4% | 3.8%(+4.60)#60 | 3.1%(+5.30)#2,707 |
| 12. | 73105 | 7.7% | 3.8%(+3.90)#72 | 3.1%(+4.60)#3,140 |
| 13. | 73139 | 6.9% | 3.8%(+3.10)#86 | 3.1%(+3.80)#3,707 |
| 14. | 73119 | 5.9% | 3.8%(+2.10)#117 | 3.1%(+2.80)#4,777 |
| 15. | 73149 | 5.6% | 3.8%(+1.80)#132 | 3.1%(+2.50)#5,211 |
| 16. | 73135 | 5.0% | 3.8%(+1.20)#158 | 3.1%(+1.90)#6,113 |
| 17. | 73106 | 4.9% | 3.8%(+1.10)#168 | 3.1%(+1.80)#6,307 |
| 18. | 73109 | 4.8% | 3.8%(+1.00)#174 | 3.1%(+1.70)#6,463 |
| 19. | 73129 | 4.7% | 3.8%(+0.900)#183 | 3.1%(+1.60)#6,650 |
| 20. | 73142 | 4.6% | 3.8%(+0.800)#191 | 3.1%(+1.50)#6,844 |
| 21. | 73151 | 3.7% | 3.8%(-0.100)#258 | 3.1%(+0.600)#9,125 |
| 22. | 73159 | 3.5% | 3.8%(-0.300)#270 | 3.1%(+0.400)#9,511 |
| 23. | 73145 | 3.5% | 3.8%(-0.300)#274 | 3.1%(+0.400)#9,658 |
| 24. | 73116 | 3.2% | 3.8%(-0.600)#301 | 3.1%(+0.100)#10,556 |
| 25. | 73132 | 3.1% | 3.8%(-0.700)#308 | 3.1%(=0.000)#10,810 |
| 26. | 73118 | 3.1% | 3.8%(-0.700)#309 | 3.1%(=0.000)#10,871 |
| 27. | 73169 | 2.9% | 3.8%(-0.900)#326 | 3.1%(-0.200)#11,643 |
| 28. | 73160 | 2.8% | 3.8%(-1.00)#334 | 3.1%(-0.300)#11,806 |
| 29. | 73120 | 2.8% | 3.8%(-1.00)#335 | 3.1%(-0.300)#11,856 |
| 30. | 73130 | 2.6% | 3.8%(-1.20)#350 | 3.1%(-0.500)#12,718 |
| 31. | 73150 | 2.5% | 3.8%(-1.30)#362 | 3.1%(-0.600)#13,244 |
| 32. | 73170 | 2.0% | 3.8%(-1.80)#409 | 3.1%(-1.10)#15,276 |
| 33. | 73107 | 2.0% | 3.8%(-1.80)#411 | 3.1%(-1.10)#15,345 |
| 34. | 73121 | 1.8% | 3.8%(-2.00)#432 | 3.1%(-1.30)#16,539 |
| 35. | 73165 | 1.6% | 3.8%(-2.20)#444 | 3.1%(-1.50)#17,406 |
| 36. | 73128 | 1.6% | 3.8%(-2.20)#446 | 3.1%(-1.50)#17,425 |
| 37. | 73162 | 1.5% | 3.8%(-2.30)#450 | 3.1%(-1.60)#17,733 |
| 38. | 73173 | 1.4% | 3.8%(-2.40)#468 | 3.1%(-1.70)#18,459 |
| 39. | 73103 | 1.3% | 3.8%(-2.50)#472 | 3.1%(-1.80)#18,962 |
| 40. | 73141 | 0.90% | 3.8%(-2.90)#495 | 3.1%(-2.20)#21,013 |
1
Common Questions
What are the Top 10 Zip Codes with the Highest Percentage of Families with Income Below $10,000 in Oklahoma City, OK?
Top 10 Zip Codes with the Highest Percentage of Families with Income Below $10,000 in Oklahoma City, OK are:
What zip code has the Highest Percentage of Families with Income Below $10,000 in Oklahoma City, OK?
73104 has the Highest Percentage of Families with Income Below $10,000 in Oklahoma City, OK with 18.9%.
What is the Percentage of Families with Income Below $10,000 in Oklahoma City, OK?
Percentage of Families with Income Below $10,000 in Oklahoma City is 3.9%.
What is the Percentage of Families with Income Below $10,000 in Oklahoma?
Percentage of Families with Income Below $10,000 in Oklahoma is 3.8%.
What is the Percentage of Families with Income Below $10,000 in the United States?
Percentage of Families with Income Below $10,000 in the United States is 3.1%.