Zip Codes with the Highest Percentage of Population Employed in Arts, Media & Entertainment in Oklahoma City, OK

RELATED REPORTS & OPTIONS

Arts, Media & Entertainment
Population
Families and Households
Female Fertility
Female Fertility (Unmarried)
Race (Community Size)
Race (Percentage)
Ancestry (Community Size)
AfricanAlaska NativeAlbanianAmericanApacheArabArapahoArgentineanArmenianAustralianAustrianBahamianBangladeshiBarbadianBasqueBelgianBhutaneseBlackfeetBolivianBrazilianBritishBritish West IndianBulgarianBurmeseCajunCambodianCanadianCelticCentral AmericanCentral American IndianCherokeeCheyenneChickasawChileanChippewaChoctawColombianComancheCreeCreekCroatianCubanCzechCzechoslovakianDanishDelawareDominicanDutchDutch West IndianEastern EuropeanEcuadorianEgyptianEnglishEstonianEthiopianEuropeanFijianFilipinoFinnishFrenchFrench American IndianFrench CanadianGermanGerman RussianGhanaianGreekGuamanian / ChamorroGuatemalanGuyaneseHaitianHonduranHopiHungarianIcelanderIndian (Asian)IndonesianInupiatIranianIraqiIrishIroquoisIsraeliItalianJamaicanJapaneseJordanianKenyanKiowaKoreanLaotianLatvianLebaneseLiberianLithuanianLuxembourgerMalaysianMexicanMexican American IndianMongolianMoroccanNative HawaiianNavajoNew ZealanderNicaraguanNigerianNorthern EuropeanNorwegianOkinawanOsagePakistaniPalestinianPanamanianPennsylvania GermanPeruvianPimaPolishPortuguesePotawatomiPuebloPuerto RicanRomanianRussianSalvadoranSamoanScandinavianScotch-IrishScottishSeminoleSerbianSiouxSlavicSlovakSloveneSouth AfricanSouth AmericanSouth American IndianSpaniardSpanishSpanish American IndianSri LankanSubsaharan AfricanSudaneseSwedishSwissSyrianThaiTlingit-HaidaTonganTrinidadian and TobagonianTurkishU.S. Virgin IslanderUkrainianUruguayanVenezuelanVietnameseWelshWest IndianYugoslavianZimbabwean
Ancestry (Percentage)
AfricanAlaska NativeAlbanianAmericanApacheArabArapahoArgentineanArmenianAustralianAustrianBahamianBangladeshiBarbadianBasqueBelgianBhutaneseBlackfeetBolivianBrazilianBritishBritish West IndianBulgarianBurmeseCajunCambodianCanadianCelticCentral AmericanCentral American IndianCherokeeCheyenneChickasawChileanChippewaChoctawColombianComancheCreeCreekCroatianCubanCzechCzechoslovakianDanishDelawareDominicanDutchDutch West IndianEastern EuropeanEcuadorianEgyptianEnglishEstonianEthiopianEuropeanFijianFilipinoFinnishFrenchFrench American IndianFrench CanadianGermanGerman RussianGhanaianGreekGuamanian / ChamorroGuatemalanGuyaneseHaitianHonduranHopiHungarianIcelanderIndian (Asian)IndonesianInupiatIranianIraqiIrishIroquoisIsraeliItalianJamaicanJapaneseJordanianKenyanKiowaKoreanLaotianLatvianLebaneseLiberianLithuanianLuxembourgerMalaysianMexicanMexican American IndianMongolianMoroccanNative HawaiianNavajoNew ZealanderNicaraguanNigerianNorthern EuropeanNorwegianOkinawanOsagePakistaniPalestinianPanamanianPennsylvania GermanPeruvianPimaPolishPortuguesePotawatomiPuebloPuerto RicanRomanianRussianSalvadoranSamoanScandinavianScotch-IrishScottishSeminoleSerbianSiouxSlavicSlovakSloveneSouth AfricanSouth AmericanSouth American IndianSpaniardSpanishSpanish American IndianSri LankanSubsaharan AfricanSudaneseSwedishSwissSyrianThaiTlingit-HaidaTonganTrinidadian and TobagonianTurkishU.S. Virgin IslanderUkrainianUruguayanVenezuelanVietnameseWelshWest IndianYugoslavianZimbabwean
Immigrant Origin (Total)
AfricaArgentinaAsiaAustraliaAustriaBahamasBangladeshBosnia and HerzegovinaBrazilBulgariaBurma / MyanmarCambodiaCameroonCanadaCaribbeanCentral AmericaChileChinaColombiaCubaDominican RepublicEastern AfricaEastern AsiaEastern EuropeEcuadorEgyptEl SalvadorEnglandEritreaEthiopiaEuropeFranceGermanyGhanaGreeceGuatemalaHondurasHong KongIndiaIndonesiaIranIraqIrelandItalyJamaicaJapanJordanKazakhstanKenyaKoreaKuwaitLaosLatin AmericaLebanonLiberiaMalaysiaMexicoMiddle AfricaMoroccoNepalNetherlandsNicaraguaNigeriaNorthern AfricaNorthern EuropeNorwayOceaniaPakistanPanamaPeruPhilippinesPolandPortugalRussiaSaudi ArabiaScotlandSingaporeSouth AfricaSouth AmericaSouth Central AsiaSouth Eastern AsiaSouthern EuropeSpainSudanSyriaTaiwanThailandTrinidad and TobagoTurkeyUkraineVenezuelaVietnamWestern AfricaWestern AsiaWestern EuropeZaireZimbabwe
Immigrant Origin (Percentage)
AfricaArgentinaAsiaAustraliaAustriaBahamasBangladeshBosnia and HerzegovinaBrazilBulgariaBurma / MyanmarCambodiaCameroonCanadaCaribbeanCentral AmericaChileChinaColombiaCubaDominican RepublicEastern AfricaEastern AsiaEastern EuropeEcuadorEgyptEl SalvadorEnglandEritreaEthiopiaEuropeFranceGermanyGhanaGreeceGuatemalaHondurasHong KongIndiaIndonesiaIranIraqIrelandItalyJamaicaJapanJordanKazakhstanKenyaKoreaKuwaitLaosLatin AmericaLebanonLiberiaMalaysiaMexicoMiddle AfricaMoroccoNepalNetherlandsNicaraguaNigeriaNorthern AfricaNorthern EuropeNorwayOceaniaPakistanPanamaPeruPhilippinesPolandPortugalRussiaSaudi ArabiaScotlandSingaporeSouth AfricaSouth AmericaSouth Central AsiaSouth Eastern AsiaSouthern EuropeSpainSudanSyriaTaiwanThailandTrinidad and TobagoTurkeyUkraineVenezuelaVietnamWestern AfricaWestern AsiaWestern EuropeZaireZimbabwe
Income
Income (Families)
Income (Households)
Poverty
Poverty (Families)
Unemployment
Employment Occupations
Employment Industries
Employer Class
Commute Time
Commute Means
School Enrollment
Education by Degree Field
Occupancy
Finances
Physical Characteristics
Oklahoma City
Compare Zip Codes
Comparison Subject

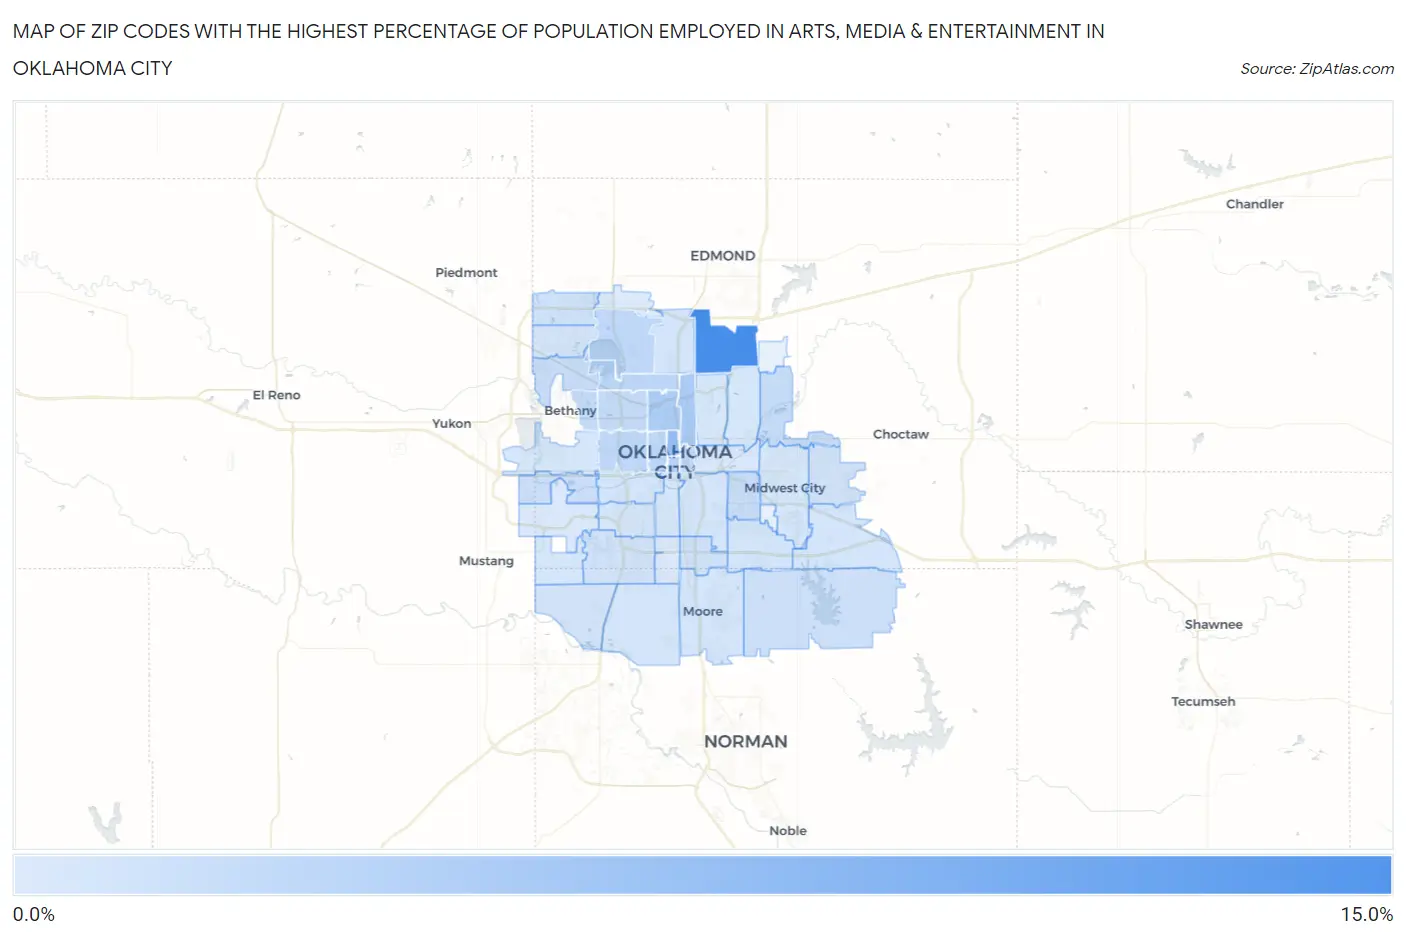
Map of Zip Codes with the Highest Percentage of Population Employed in Arts, Media & Entertainment in Oklahoma City

0.0%
15.0%
Zip Codes with the Highest Percentage of Population Employed in Arts, Media & Entertainment in Oklahoma City Map

Zip Codes with the Highest Percentage of Population Employed in Arts, Media & Entertainment in Oklahoma City, OK

Zip Code % Employed vs State vs National
1.7313112.8%1.4%(+11.3)#22.1%(+10.7)#224
2.731036.1%1.4%(+4.64)#82.1%(+4.01)#1,009
3.731054.3%1.4%(+2.89)#212.1%(+2.26)#2,017
4.731184.2%1.4%(+2.77)#222.1%(+2.14)#2,149
5.731023.2%1.4%(+1.74)#342.1%(+1.11)#3,698
6.731162.8%1.4%(+1.37)#412.1%(+0.743)#4,604
7.731202.7%1.4%(+1.31)#422.1%(+0.675)#4,806
8.731062.6%1.4%(+1.19)#472.1%(+0.558)#5,167
9.731072.6%1.4%(+1.14)#482.1%(+0.510)#5,328
10.731042.5%1.4%(+1.04)#502.1%(+0.412)#5,643
11.731122.3%1.4%(+0.865)#532.1%(+0.234)#6,398
12.731222.3%1.4%(+0.821)#582.1%(+0.190)#6,602
13.731412.2%1.4%(+0.738)#622.1%(+0.107)#6,969
14.731152.0%1.4%(+0.560)#792.1%(-0.071)#7,865
15.731322.0%1.4%(+0.544)#802.1%(-0.087)#7,954
16.731281.7%1.4%(+0.297)#952.1%(-0.334)#9,425
17.731651.5%1.4%(+0.052)#1172.1%(-0.579)#11,094
18.731491.3%1.4%(-0.136)#1482.1%(-0.767)#12,506
19.731421.3%1.4%(-0.149)#1502.1%(-0.780)#12,592
20.731731.2%1.4%(-0.228)#1592.1%(-0.859)#13,213
21.731301.1%1.4%(-0.302)#1722.1%(-0.933)#13,762
22.731591.1%1.4%(-0.311)#1732.1%(-0.942)#13,842
23.731141.1%1.4%(-0.340)#1822.1%(-0.971)#14,084
24.731701.1%1.4%(-0.345)#1852.1%(-0.976)#14,127
25.731601.0%1.4%(-0.401)#1932.1%(-1.03)#14,598
26.731501.0%1.4%(-0.405)#1942.1%(-1.04)#14,616
27.731291.0%1.4%(-0.427)#1992.1%(-1.06)#14,782
28.731080.97%1.4%(-0.458)#2082.1%(-1.09)#15,049
29.731350.94%1.4%(-0.485)#2132.1%(-1.12)#15,279
30.731620.94%1.4%(-0.486)#2142.1%(-1.12)#15,285
31.731090.90%1.4%(-0.532)#2252.1%(-1.16)#15,653
32.731100.86%1.4%(-0.573)#2322.1%(-1.20)#15,993
33.731110.85%1.4%(-0.576)#2332.1%(-1.21)#16,017
34.731190.82%1.4%(-0.610)#2402.1%(-1.24)#16,259
35.731690.82%1.4%(-0.614)#2412.1%(-1.25)#16,291
36.731210.79%1.4%(-0.636)#2472.1%(-1.27)#16,474
37.731270.79%1.4%(-0.638)#2482.1%(-1.27)#16,486
38.731170.50%1.4%(-0.932)#3072.1%(-1.56)#18,880
39.731790.49%1.4%(-0.945)#3132.1%(-1.58)#18,978
40.731390.39%1.4%(-1.04)#3312.1%(-1.67)#19,726
41.731340.27%1.4%(-1.16)#3522.1%(-1.79)#20,524

Common Questions

What are the Top 10 Zip Codes with the Highest Percentage of Population Employed in Arts, Media & Entertainment in Oklahoma City, OK?
Top 10 Zip Codes with the Highest Percentage of Population Employed in Arts, Media & Entertainment in Oklahoma City, OK are:
#1
12.8%
#2
6.1%
#3
4.3%
#4
4.2%
#5
3.2%
#6
2.8%
#7
2.7%
#8
2.6%
#9
2.6%
#10
2.5%
What zip code has the Highest Percentage of Population Employed in Arts, Media & Entertainment in Oklahoma City, OK?
73131 has the Highest Percentage of Population Employed in Arts, Media & Entertainment in Oklahoma City, OK with 12.8%.
What is the Percentage of Population Employed in Arts, Media & Entertainment in Oklahoma City, OK?
Percentage of Population Employed in Arts, Media & Entertainment in Oklahoma City is 1.8%.
What is the Percentage of Population Employed in Arts, Media & Entertainment in Oklahoma?
Percentage of Population Employed in Arts, Media & Entertainment in Oklahoma is 1.4%.
What is the Percentage of Population Employed in Arts, Media & Entertainment in the United States?
Percentage of Population Employed in Arts, Media & Entertainment in the United States is 2.1%.