Zip Codes with the Highest Percentage of Population Taking Taxi / Cab to Work in Oklahoma City, OK

RELATED REPORTS & OPTIONS

Taxi / Cab
Population
Families and Households
Female Fertility
Female Fertility (Unmarried)
Race (Community Size)
Race (Percentage)
Ancestry (Community Size)
AfricanAlaska NativeAlbanianAmericanApacheArabArapahoArgentineanArmenianAustralianAustrianBahamianBangladeshiBarbadianBasqueBelgianBhutaneseBlackfeetBolivianBrazilianBritishBritish West IndianBulgarianBurmeseCajunCambodianCanadianCelticCentral AmericanCentral American IndianCherokeeCheyenneChickasawChileanChippewaChoctawColombianComancheCreeCreekCroatianCubanCzechCzechoslovakianDanishDelawareDominicanDutchDutch West IndianEastern EuropeanEcuadorianEgyptianEnglishEstonianEthiopianEuropeanFijianFilipinoFinnishFrenchFrench American IndianFrench CanadianGermanGerman RussianGhanaianGreekGuamanian / ChamorroGuatemalanGuyaneseHaitianHonduranHopiHungarianIcelanderIndian (Asian)IndonesianInupiatIranianIraqiIrishIroquoisIsraeliItalianJamaicanJapaneseJordanianKenyanKiowaKoreanLaotianLatvianLebaneseLiberianLithuanianLuxembourgerMalaysianMexicanMexican American IndianMongolianMoroccanNative HawaiianNavajoNew ZealanderNicaraguanNigerianNorthern EuropeanNorwegianOkinawanOsagePakistaniPalestinianPanamanianPennsylvania GermanPeruvianPimaPolishPortuguesePotawatomiPuebloPuerto RicanRomanianRussianSalvadoranSamoanScandinavianScotch-IrishScottishSeminoleSerbianSiouxSlavicSlovakSloveneSouth AfricanSouth AmericanSouth American IndianSpaniardSpanishSpanish American IndianSri LankanSubsaharan AfricanSudaneseSwedishSwissSyrianThaiTlingit-HaidaTonganTrinidadian and TobagonianTurkishU.S. Virgin IslanderUkrainianUruguayanVenezuelanVietnameseWelshWest IndianYugoslavianZimbabwean
Ancestry (Percentage)
AfricanAlaska NativeAlbanianAmericanApacheArabArapahoArgentineanArmenianAustralianAustrianBahamianBangladeshiBarbadianBasqueBelgianBhutaneseBlackfeetBolivianBrazilianBritishBritish West IndianBulgarianBurmeseCajunCambodianCanadianCelticCentral AmericanCentral American IndianCherokeeCheyenneChickasawChileanChippewaChoctawColombianComancheCreeCreekCroatianCubanCzechCzechoslovakianDanishDelawareDominicanDutchDutch West IndianEastern EuropeanEcuadorianEgyptianEnglishEstonianEthiopianEuropeanFijianFilipinoFinnishFrenchFrench American IndianFrench CanadianGermanGerman RussianGhanaianGreekGuamanian / ChamorroGuatemalanGuyaneseHaitianHonduranHopiHungarianIcelanderIndian (Asian)IndonesianInupiatIranianIraqiIrishIroquoisIsraeliItalianJamaicanJapaneseJordanianKenyanKiowaKoreanLaotianLatvianLebaneseLiberianLithuanianLuxembourgerMalaysianMexicanMexican American IndianMongolianMoroccanNative HawaiianNavajoNew ZealanderNicaraguanNigerianNorthern EuropeanNorwegianOkinawanOsagePakistaniPalestinianPanamanianPennsylvania GermanPeruvianPimaPolishPortuguesePotawatomiPuebloPuerto RicanRomanianRussianSalvadoranSamoanScandinavianScotch-IrishScottishSeminoleSerbianSiouxSlavicSlovakSloveneSouth AfricanSouth AmericanSouth American IndianSpaniardSpanishSpanish American IndianSri LankanSubsaharan AfricanSudaneseSwedishSwissSyrianThaiTlingit-HaidaTonganTrinidadian and TobagonianTurkishU.S. Virgin IslanderUkrainianUruguayanVenezuelanVietnameseWelshWest IndianYugoslavianZimbabwean
Immigrant Origin (Total)
AfricaArgentinaAsiaAustraliaAustriaBahamasBangladeshBosnia and HerzegovinaBrazilBulgariaBurma / MyanmarCambodiaCameroonCanadaCaribbeanCentral AmericaChileChinaColombiaCubaDominican RepublicEastern AfricaEastern AsiaEastern EuropeEcuadorEgyptEl SalvadorEnglandEritreaEthiopiaEuropeFranceGermanyGhanaGreeceGuatemalaHondurasHong KongIndiaIndonesiaIranIraqIrelandItalyJamaicaJapanJordanKazakhstanKenyaKoreaKuwaitLaosLatin AmericaLebanonLiberiaMalaysiaMexicoMiddle AfricaMoroccoNepalNetherlandsNicaraguaNigeriaNorthern AfricaNorthern EuropeNorwayOceaniaPakistanPanamaPeruPhilippinesPolandPortugalRussiaSaudi ArabiaScotlandSingaporeSouth AfricaSouth AmericaSouth Central AsiaSouth Eastern AsiaSouthern EuropeSpainSudanSyriaTaiwanThailandTrinidad and TobagoTurkeyUkraineVenezuelaVietnamWestern AfricaWestern AsiaWestern EuropeZaireZimbabwe
Immigrant Origin (Percentage)
AfricaArgentinaAsiaAustraliaAustriaBahamasBangladeshBosnia and HerzegovinaBrazilBulgariaBurma / MyanmarCambodiaCameroonCanadaCaribbeanCentral AmericaChileChinaColombiaCubaDominican RepublicEastern AfricaEastern AsiaEastern EuropeEcuadorEgyptEl SalvadorEnglandEritreaEthiopiaEuropeFranceGermanyGhanaGreeceGuatemalaHondurasHong KongIndiaIndonesiaIranIraqIrelandItalyJamaicaJapanJordanKazakhstanKenyaKoreaKuwaitLaosLatin AmericaLebanonLiberiaMalaysiaMexicoMiddle AfricaMoroccoNepalNetherlandsNicaraguaNigeriaNorthern AfricaNorthern EuropeNorwayOceaniaPakistanPanamaPeruPhilippinesPolandPortugalRussiaSaudi ArabiaScotlandSingaporeSouth AfricaSouth AmericaSouth Central AsiaSouth Eastern AsiaSouthern EuropeSpainSudanSyriaTaiwanThailandTrinidad and TobagoTurkeyUkraineVenezuelaVietnamWestern AfricaWestern AsiaWestern EuropeZaireZimbabwe
Income
Income (Families)
Income (Households)
Poverty
Poverty (Families)
Unemployment
Employment Occupations
Employment Industries
Employer Class
Commute Time
Commute Means
School Enrollment
Education by Degree Field
Occupancy
Finances
Physical Characteristics
Oklahoma City
Compare Zip Codes
Comparison Subject

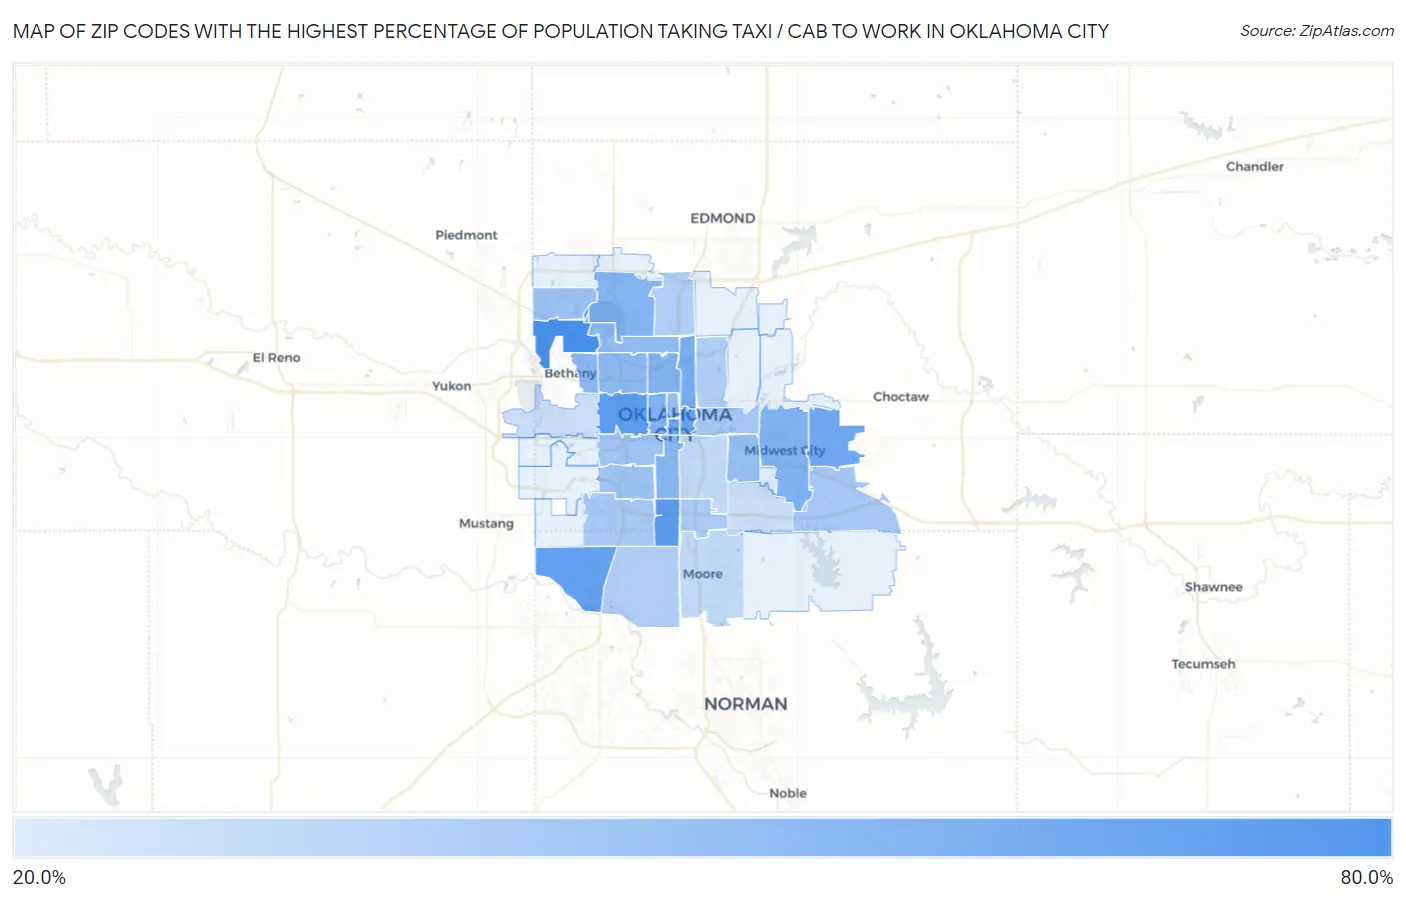
Map of Zip Codes with the Highest Percentage of Population Taking Taxi / Cab to Work in Oklahoma City

0.0%
80.0%
Zip Codes with the Highest Percentage of Population Taking Taxi / Cab to Work in Oklahoma City Map

Zip Codes with the Highest Percentage of Population Taking Taxi / Cab to Work in Oklahoma City, OK

Zip Code % Take Taxi / Cab vs State vs National
1.7313264.2%37.2%(+27.0)#638.2%(+26.0)#270
2.7313959.1%37.2%(+21.9)#1638.2%(+20.9)#822
3.7310758.4%37.2%(+21.2)#1738.2%(+20.2)#922
4.7317355.5%37.2%(+18.3)#2738.2%(+17.3)#1,470
5.7310453.0%37.2%(+15.8)#3538.2%(+14.8)#2,137
6.7310251.2%37.2%(+14.0)#4238.2%(+13.0)#2,630
7.7313050.9%37.2%(+13.7)#4338.2%(+12.7)#2,692
8.7310548.8%37.2%(+11.6)#5038.2%(+10.6)#3,336
9.7310646.2%37.2%(+9.00)#6738.2%(+8.00)#4,248
10.7311046.1%37.2%(+8.90)#6938.2%(+7.90)#4,276
11.7311845.9%37.2%(+8.70)#7338.2%(+7.70)#4,342
12.7312045.1%37.2%(+7.90)#7638.2%(+6.90)#4,617
13.7310943.7%37.2%(+6.50)#8238.2%(+5.50)#5,099
14.7312243.3%37.2%(+6.10)#8638.2%(+5.10)#5,270
15.7311242.3%37.2%(+5.10)#10038.2%(+4.10)#5,611
16.7310341.4%37.2%(+4.20)#10938.2%(+3.20)#6,009
17.7311640.9%37.2%(+3.70)#11238.2%(+2.70)#6,211
18.7311539.6%37.2%(+2.40)#12238.2%(+1.40)#6,798
19.7316238.5%37.2%(+1.30)#13038.2%(+0.300)#7,268
20.7311937.1%37.2%(-0.100)#13638.2%(-1.10)#7,896
21.7310836.5%37.2%(-0.700)#14638.2%(-1.70)#8,205
22.7311735.6%37.2%(-1.60)#15038.2%(-2.60)#8,637
23.7315035.6%37.2%(-1.60)#15138.2%(-2.60)#8,638
24.7315934.9%37.2%(-2.30)#15538.2%(-3.30)#8,925
25.7314934.1%37.2%(-3.10)#16338.2%(-4.10)#9,325
26.7317032.9%37.2%(-4.30)#17438.2%(-5.30)#9,782
27.7311132.7%37.2%(-4.50)#17838.2%(-5.50)#9,917
28.7311432.2%37.2%(-5.00)#18138.2%(-6.00)#10,112
29.7316027.9%37.2%(-9.30)#20138.2%(-10.3)#11,554
30.7312927.6%37.2%(-9.60)#20338.2%(-10.6)#11,674
31.7312725.4%37.2%(-11.8)#21738.2%(-12.8)#12,171
32.7313525.4%37.2%(-11.8)#21838.2%(-12.8)#12,173
33.7314520.8%37.2%(-16.4)#22838.2%(-17.4)#12,942

Common Questions

What are the Top 10 Zip Codes with the Highest Percentage of Population Taking Taxi / Cab to Work in Oklahoma City, OK?
Top 10 Zip Codes with the Highest Percentage of Population Taking Taxi / Cab to Work in Oklahoma City, OK are:
#1
64.2%
#2
59.1%
#3
58.4%
#4
55.5%
#5
53.0%
#6
51.2%
#7
50.9%
#8
48.8%
#9
46.2%
#10
46.1%
What zip code has the Highest Percentage of Population Taking Taxi / Cab to Work in Oklahoma City, OK?
73132 has the Highest Percentage of Population Taking Taxi / Cab to Work in Oklahoma City, OK with 64.2%.
What is the Percentage of Population Taking Taxi / Cab to Work in Oklahoma City, OK?
Percentage of Population Taking Taxi / Cab to Work in Oklahoma City is 38.2%.
What is the Percentage of Population Taking Taxi / Cab to Work in Oklahoma?
Percentage of Population Taking Taxi / Cab to Work in Oklahoma is 37.2%.
What is the Percentage of Population Taking Taxi / Cab to Work in the United States?
Percentage of Population Taking Taxi / Cab to Work in the United States is 38.2%.