Zip Codes with the Highest Percentage of Population with a Degree in Liberal Arts and History in Oklahoma City, OK

RELATED REPORTS & OPTIONS

Liberal Arts and History
Population
Families and Households
Female Fertility
Female Fertility (Unmarried)
Race (Community Size)
Race (Percentage)
Ancestry (Community Size)
AfricanAlaska NativeAlbanianAmericanApacheArabArapahoArgentineanArmenianAustralianAustrianBahamianBangladeshiBarbadianBasqueBelgianBhutaneseBlackfeetBolivianBrazilianBritishBritish West IndianBulgarianBurmeseCajunCambodianCanadianCelticCentral AmericanCentral American IndianCherokeeCheyenneChickasawChileanChippewaChoctawColombianComancheCreeCreekCroatianCubanCzechCzechoslovakianDanishDelawareDominicanDutchDutch West IndianEastern EuropeanEcuadorianEgyptianEnglishEstonianEthiopianEuropeanFijianFilipinoFinnishFrenchFrench American IndianFrench CanadianGermanGerman RussianGhanaianGreekGuamanian / ChamorroGuatemalanGuyaneseHaitianHonduranHopiHungarianIcelanderIndian (Asian)IndonesianInupiatIranianIraqiIrishIroquoisIsraeliItalianJamaicanJapaneseJordanianKenyanKiowaKoreanLaotianLatvianLebaneseLiberianLithuanianLuxembourgerMalaysianMexicanMexican American IndianMongolianMoroccanNative HawaiianNavajoNew ZealanderNicaraguanNigerianNorthern EuropeanNorwegianOkinawanOsagePakistaniPalestinianPanamanianPennsylvania GermanPeruvianPimaPolishPortuguesePotawatomiPuebloPuerto RicanRomanianRussianSalvadoranSamoanScandinavianScotch-IrishScottishSeminoleSerbianSiouxSlavicSlovakSloveneSouth AfricanSouth AmericanSouth American IndianSpaniardSpanishSpanish American IndianSri LankanSubsaharan AfricanSudaneseSwedishSwissSyrianThaiTlingit-HaidaTonganTrinidadian and TobagonianTurkishU.S. Virgin IslanderUkrainianUruguayanVenezuelanVietnameseWelshWest IndianYugoslavianZimbabwean
Ancestry (Percentage)
AfricanAlaska NativeAlbanianAmericanApacheArabArapahoArgentineanArmenianAustralianAustrianBahamianBangladeshiBarbadianBasqueBelgianBhutaneseBlackfeetBolivianBrazilianBritishBritish West IndianBulgarianBurmeseCajunCambodianCanadianCelticCentral AmericanCentral American IndianCherokeeCheyenneChickasawChileanChippewaChoctawColombianComancheCreeCreekCroatianCubanCzechCzechoslovakianDanishDelawareDominicanDutchDutch West IndianEastern EuropeanEcuadorianEgyptianEnglishEstonianEthiopianEuropeanFijianFilipinoFinnishFrenchFrench American IndianFrench CanadianGermanGerman RussianGhanaianGreekGuamanian / ChamorroGuatemalanGuyaneseHaitianHonduranHopiHungarianIcelanderIndian (Asian)IndonesianInupiatIranianIraqiIrishIroquoisIsraeliItalianJamaicanJapaneseJordanianKenyanKiowaKoreanLaotianLatvianLebaneseLiberianLithuanianLuxembourgerMalaysianMexicanMexican American IndianMongolianMoroccanNative HawaiianNavajoNew ZealanderNicaraguanNigerianNorthern EuropeanNorwegianOkinawanOsagePakistaniPalestinianPanamanianPennsylvania GermanPeruvianPimaPolishPortuguesePotawatomiPuebloPuerto RicanRomanianRussianSalvadoranSamoanScandinavianScotch-IrishScottishSeminoleSerbianSiouxSlavicSlovakSloveneSouth AfricanSouth AmericanSouth American IndianSpaniardSpanishSpanish American IndianSri LankanSubsaharan AfricanSudaneseSwedishSwissSyrianThaiTlingit-HaidaTonganTrinidadian and TobagonianTurkishU.S. Virgin IslanderUkrainianUruguayanVenezuelanVietnameseWelshWest IndianYugoslavianZimbabwean
Immigrant Origin (Total)
AfricaArgentinaAsiaAustraliaAustriaBahamasBangladeshBosnia and HerzegovinaBrazilBulgariaBurma / MyanmarCambodiaCameroonCanadaCaribbeanCentral AmericaChileChinaColombiaCubaDominican RepublicEastern AfricaEastern AsiaEastern EuropeEcuadorEgyptEl SalvadorEnglandEritreaEthiopiaEuropeFranceGermanyGhanaGreeceGuatemalaHondurasHong KongIndiaIndonesiaIranIraqIrelandItalyJamaicaJapanJordanKazakhstanKenyaKoreaKuwaitLaosLatin AmericaLebanonLiberiaMalaysiaMexicoMiddle AfricaMoroccoNepalNetherlandsNicaraguaNigeriaNorthern AfricaNorthern EuropeNorwayOceaniaPakistanPanamaPeruPhilippinesPolandPortugalRussiaSaudi ArabiaScotlandSingaporeSouth AfricaSouth AmericaSouth Central AsiaSouth Eastern AsiaSouthern EuropeSpainSudanSyriaTaiwanThailandTrinidad and TobagoTurkeyUkraineVenezuelaVietnamWestern AfricaWestern AsiaWestern EuropeZaireZimbabwe
Immigrant Origin (Percentage)
AfricaArgentinaAsiaAustraliaAustriaBahamasBangladeshBosnia and HerzegovinaBrazilBulgariaBurma / MyanmarCambodiaCameroonCanadaCaribbeanCentral AmericaChileChinaColombiaCubaDominican RepublicEastern AfricaEastern AsiaEastern EuropeEcuadorEgyptEl SalvadorEnglandEritreaEthiopiaEuropeFranceGermanyGhanaGreeceGuatemalaHondurasHong KongIndiaIndonesiaIranIraqIrelandItalyJamaicaJapanJordanKazakhstanKenyaKoreaKuwaitLaosLatin AmericaLebanonLiberiaMalaysiaMexicoMiddle AfricaMoroccoNepalNetherlandsNicaraguaNigeriaNorthern AfricaNorthern EuropeNorwayOceaniaPakistanPanamaPeruPhilippinesPolandPortugalRussiaSaudi ArabiaScotlandSingaporeSouth AfricaSouth AmericaSouth Central AsiaSouth Eastern AsiaSouthern EuropeSpainSudanSyriaTaiwanThailandTrinidad and TobagoTurkeyUkraineVenezuelaVietnamWestern AfricaWestern AsiaWestern EuropeZaireZimbabwe
Income
Income (Families)
Income (Households)
Poverty
Poverty (Families)
Unemployment
Employment Occupations
Employment Industries
Employer Class
Commute Time
Commute Means
School Enrollment
Education by Degree Field
Occupancy
Finances
Physical Characteristics
Oklahoma City
Compare Zip Codes
Comparison Subject

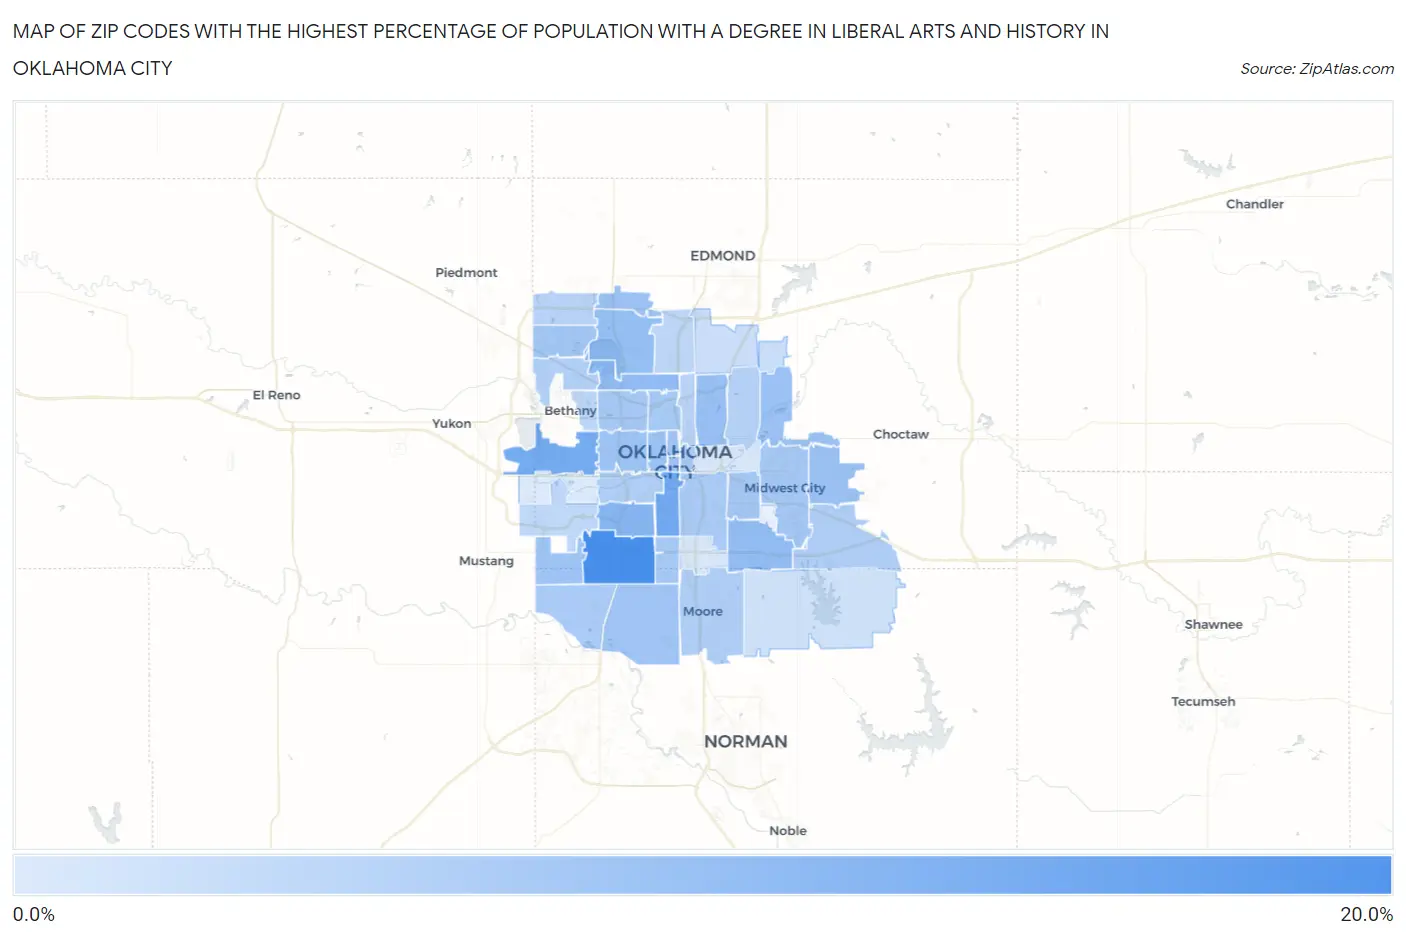
Map of Zip Codes with the Highest Percentage of Population with a Degree in Liberal Arts and History in Oklahoma City

0.0%
20.0%
Zip Codes with the Highest Percentage of Population with a Degree in Liberal Arts and History in Oklahoma City Map

Zip Codes with the Highest Percentage of Population with a Degree in Liberal Arts and History in Oklahoma City, OK

Zip Code % Graduates vs State vs National
1.7315915.3%4.9%(+10.5)#234.9%(+10.5)#1,365
2.7310910.7%4.9%(+5.80)#454.9%(+5.80)#2,716
3.7312710.4%4.9%(+5.56)#474.9%(+5.57)#2,841
4.731198.6%4.9%(+3.73)#694.9%(+3.73)#4,232
5.731167.7%4.9%(+2.86)#834.9%(+2.86)#5,253
6.731357.5%4.9%(+2.63)#894.9%(+2.63)#5,575
7.731207.3%4.9%(+2.39)#954.9%(+2.39)#5,951
8.731116.9%4.9%(+1.99)#1044.9%(+1.99)#6,612
9.731306.8%4.9%(+1.89)#1084.9%(+1.89)#6,801
10.731346.7%4.9%(+1.80)#1124.9%(+1.80)#6,990
11.731066.5%4.9%(+1.65)#1204.9%(+1.65)#7,289
12.731416.4%4.9%(+1.52)#1294.9%(+1.52)#7,571
13.731076.4%4.9%(+1.50)#1304.9%(+1.50)#7,607
14.731696.4%4.9%(+1.50)#1314.9%(+1.50)#7,624
15.731026.3%4.9%(+1.42)#1334.9%(+1.42)#7,803
16.731036.3%4.9%(+1.40)#1354.9%(+1.40)#7,849
17.731706.1%4.9%(+1.19)#1414.9%(+1.19)#8,353
18.731625.9%4.9%(+1.02)#1454.9%(+1.02)#8,798
19.731155.7%4.9%(+0.831)#1564.9%(+0.831)#9,300
20.731125.6%4.9%(+0.710)#1614.9%(+0.710)#9,613
21.731105.5%4.9%(+0.675)#1644.9%(+0.675)#9,726
22.731395.3%4.9%(+0.421)#1754.9%(+0.421)#10,461
23.731045.3%4.9%(+0.412)#1764.9%(+0.412)#10,485
24.731185.3%4.9%(+0.380)#1774.9%(+0.381)#10,590
25.731295.2%4.9%(+0.355)#1794.9%(+0.355)#10,658
26.731735.1%4.9%(+0.269)#1854.9%(+0.269)#10,899
27.731604.7%4.9%(-0.141)#2074.9%(-0.141)#12,219
28.731504.6%4.9%(-0.249)#2114.9%(-0.249)#12,575
29.731084.4%4.9%(-0.482)#2244.9%(-0.482)#13,322
30.731214.3%4.9%(-0.562)#2344.9%(-0.562)#13,605
31.731324.1%4.9%(-0.743)#2444.9%(-0.743)#14,289
32.731053.8%4.9%(-1.08)#2594.9%(-1.08)#15,567
33.731423.8%4.9%(-1.10)#2604.9%(-1.10)#15,630
34.731143.4%4.9%(-1.52)#2914.9%(-1.52)#17,131
35.731223.3%4.9%(-1.60)#2954.9%(-1.60)#17,409
36.731793.2%4.9%(-1.70)#3014.9%(-1.70)#17,759
37.731512.2%4.9%(-2.63)#3614.9%(-2.63)#20,718
38.731311.9%4.9%(-2.96)#3824.9%(-2.96)#21,586
39.731651.6%4.9%(-3.30)#3954.9%(-3.30)#22,369
40.731490.79%4.9%(-4.08)#4344.9%(-4.08)#23,705
41.731170.60%4.9%(-4.27)#4414.9%(-4.27)#23,912
42.731280.27%4.9%(-4.60)#4514.9%(-4.60)#24,170

Common Questions

What are the Top 10 Zip Codes with the Highest Percentage of Population with a Degree in Liberal Arts and History in Oklahoma City, OK?
Top 10 Zip Codes with the Highest Percentage of Population with a Degree in Liberal Arts and History in Oklahoma City, OK are:
#1
15.3%
#2
10.7%
#3
10.4%
#4
8.6%
#5
7.7%
#6
7.5%
#7
7.3%
#8
6.9%
#9
6.8%
#10
6.7%
What zip code has the Highest Percentage of Population with a Degree in Liberal Arts and History in Oklahoma City, OK?
73159 has the Highest Percentage of Population with a Degree in Liberal Arts and History in Oklahoma City, OK with 15.3%.
What is the Percentage of Population with a Degree in Liberal Arts and History in Oklahoma City, OK?
Percentage of Population with a Degree in Liberal Arts and History in Oklahoma City is 5.1%.
What is the Percentage of Population with a Degree in Liberal Arts and History in Oklahoma?
Percentage of Population with a Degree in Liberal Arts and History in Oklahoma is 4.9%.
What is the Percentage of Population with a Degree in Liberal Arts and History in the United States?
Percentage of Population with a Degree in Liberal Arts and History in the United States is 4.9%.