Zip Codes with the Lowest Poverty Level Among Single Mothers in Oklahoma City, OK

RELATED REPORTS & OPTIONS

Lowest Poverty | Single Mother
Population
Families and Households
Female Fertility
Female Fertility (Unmarried)
Race (Community Size)
Race (Percentage)
Ancestry (Community Size)
AfricanAlaska NativeAlbanianAmericanApacheArabArapahoArgentineanArmenianAustralianAustrianBahamianBangladeshiBarbadianBasqueBelgianBhutaneseBlackfeetBolivianBrazilianBritishBritish West IndianBulgarianBurmeseCajunCambodianCanadianCelticCentral AmericanCentral American IndianCherokeeCheyenneChickasawChileanChippewaChoctawColombianComancheCreeCreekCroatianCubanCzechCzechoslovakianDanishDelawareDominicanDutchDutch West IndianEastern EuropeanEcuadorianEgyptianEnglishEstonianEthiopianEuropeanFijianFilipinoFinnishFrenchFrench American IndianFrench CanadianGermanGerman RussianGhanaianGreekGuamanian / ChamorroGuatemalanGuyaneseHaitianHonduranHopiHungarianIcelanderIndian (Asian)IndonesianInupiatIranianIraqiIrishIroquoisIsraeliItalianJamaicanJapaneseJordanianKenyanKiowaKoreanLaotianLatvianLebaneseLiberianLithuanianLuxembourgerMalaysianMexicanMexican American IndianMongolianMoroccanNative HawaiianNavajoNew ZealanderNicaraguanNigerianNorthern EuropeanNorwegianOkinawanOsagePakistaniPalestinianPanamanianPennsylvania GermanPeruvianPimaPolishPortuguesePotawatomiPuebloPuerto RicanRomanianRussianSalvadoranSamoanScandinavianScotch-IrishScottishSeminoleSerbianSiouxSlavicSlovakSloveneSouth AfricanSouth AmericanSouth American IndianSpaniardSpanishSpanish American IndianSri LankanSubsaharan AfricanSudaneseSwedishSwissSyrianThaiTlingit-HaidaTonganTrinidadian and TobagonianTurkishU.S. Virgin IslanderUkrainianUruguayanVenezuelanVietnameseWelshWest IndianYugoslavianZimbabwean
Ancestry (Percentage)
AfricanAlaska NativeAlbanianAmericanApacheArabArapahoArgentineanArmenianAustralianAustrianBahamianBangladeshiBarbadianBasqueBelgianBhutaneseBlackfeetBolivianBrazilianBritishBritish West IndianBulgarianBurmeseCajunCambodianCanadianCelticCentral AmericanCentral American IndianCherokeeCheyenneChickasawChileanChippewaChoctawColombianComancheCreeCreekCroatianCubanCzechCzechoslovakianDanishDelawareDominicanDutchDutch West IndianEastern EuropeanEcuadorianEgyptianEnglishEstonianEthiopianEuropeanFijianFilipinoFinnishFrenchFrench American IndianFrench CanadianGermanGerman RussianGhanaianGreekGuamanian / ChamorroGuatemalanGuyaneseHaitianHonduranHopiHungarianIcelanderIndian (Asian)IndonesianInupiatIranianIraqiIrishIroquoisIsraeliItalianJamaicanJapaneseJordanianKenyanKiowaKoreanLaotianLatvianLebaneseLiberianLithuanianLuxembourgerMalaysianMexicanMexican American IndianMongolianMoroccanNative HawaiianNavajoNew ZealanderNicaraguanNigerianNorthern EuropeanNorwegianOkinawanOsagePakistaniPalestinianPanamanianPennsylvania GermanPeruvianPimaPolishPortuguesePotawatomiPuebloPuerto RicanRomanianRussianSalvadoranSamoanScandinavianScotch-IrishScottishSeminoleSerbianSiouxSlavicSlovakSloveneSouth AfricanSouth AmericanSouth American IndianSpaniardSpanishSpanish American IndianSri LankanSubsaharan AfricanSudaneseSwedishSwissSyrianThaiTlingit-HaidaTonganTrinidadian and TobagonianTurkishU.S. Virgin IslanderUkrainianUruguayanVenezuelanVietnameseWelshWest IndianYugoslavianZimbabwean
Immigrant Origin (Total)
AfricaArgentinaAsiaAustraliaAustriaBahamasBangladeshBosnia and HerzegovinaBrazilBulgariaBurma / MyanmarCambodiaCameroonCanadaCaribbeanCentral AmericaChileChinaColombiaCubaDominican RepublicEastern AfricaEastern AsiaEastern EuropeEcuadorEgyptEl SalvadorEnglandEritreaEthiopiaEuropeFranceGermanyGhanaGreeceGuatemalaHondurasHong KongIndiaIndonesiaIranIraqIrelandItalyJamaicaJapanJordanKazakhstanKenyaKoreaKuwaitLaosLatin AmericaLebanonLiberiaMalaysiaMexicoMiddle AfricaMoroccoNepalNetherlandsNicaraguaNigeriaNorthern AfricaNorthern EuropeNorwayOceaniaPakistanPanamaPeruPhilippinesPolandPortugalRussiaSaudi ArabiaScotlandSingaporeSouth AfricaSouth AmericaSouth Central AsiaSouth Eastern AsiaSouthern EuropeSpainSudanSyriaTaiwanThailandTrinidad and TobagoTurkeyUkraineVenezuelaVietnamWestern AfricaWestern AsiaWestern EuropeZaireZimbabwe
Immigrant Origin (Percentage)
AfricaArgentinaAsiaAustraliaAustriaBahamasBangladeshBosnia and HerzegovinaBrazilBulgariaBurma / MyanmarCambodiaCameroonCanadaCaribbeanCentral AmericaChileChinaColombiaCubaDominican RepublicEastern AfricaEastern AsiaEastern EuropeEcuadorEgyptEl SalvadorEnglandEritreaEthiopiaEuropeFranceGermanyGhanaGreeceGuatemalaHondurasHong KongIndiaIndonesiaIranIraqIrelandItalyJamaicaJapanJordanKazakhstanKenyaKoreaKuwaitLaosLatin AmericaLebanonLiberiaMalaysiaMexicoMiddle AfricaMoroccoNepalNetherlandsNicaraguaNigeriaNorthern AfricaNorthern EuropeNorwayOceaniaPakistanPanamaPeruPhilippinesPolandPortugalRussiaSaudi ArabiaScotlandSingaporeSouth AfricaSouth AmericaSouth Central AsiaSouth Eastern AsiaSouthern EuropeSpainSudanSyriaTaiwanThailandTrinidad and TobagoTurkeyUkraineVenezuelaVietnamWestern AfricaWestern AsiaWestern EuropeZaireZimbabwe
Income
Income (Families)
Income (Households)
Poverty
Poverty (Families)
Unemployment
Employment Occupations
Employment Industries
Employer Class
Commute Time
Commute Means
School Enrollment
Education by Degree Field
Occupancy
Finances
Physical Characteristics
Oklahoma City
Compare Zip Codes
Comparison Subject

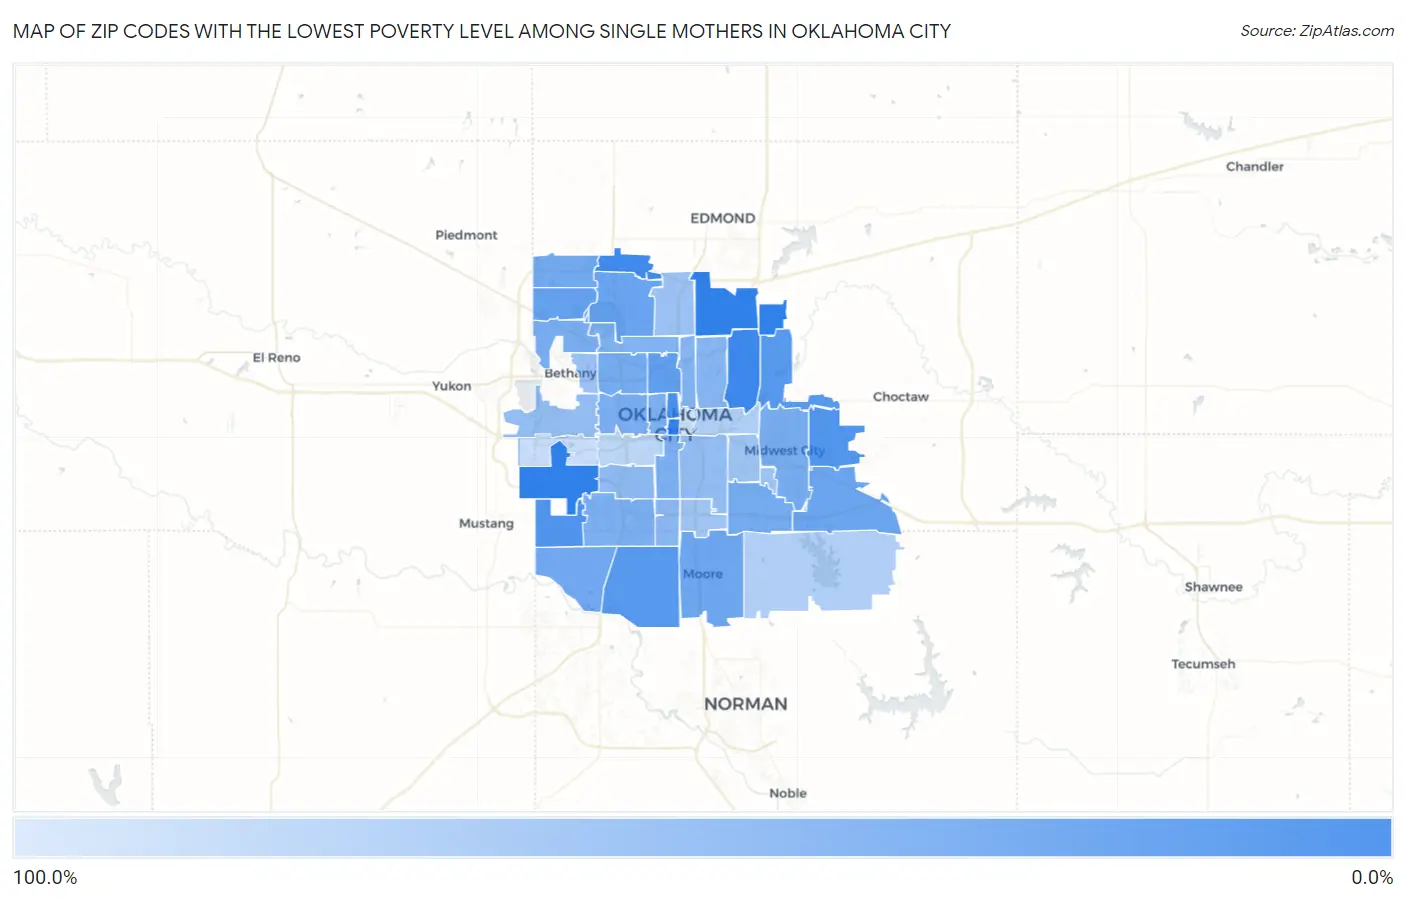
Map of Zip Codes with the Lowest Poverty Level Among Single Mothers in Oklahoma City

100.0%
0.0%
Zip Codes with the Lowest Poverty Level Among Single Mothers in Oklahoma City Map

Zip Codes with the Lowest Poverty Level Among Single Mothers in Oklahoma City, OK

Zip Code Single Mother Poverty vs State vs National
1.731214.3%39.0%(-34.7)#133.1%(-28.8)#361
2.731346.6%39.0%(-32.4)#333.1%(-26.5)#815
3.7310310.9%39.0%(-28.1)#933.1%(-22.3)#1,931
4.7316914.1%39.0%(-24.9)#2033.1%(-19.0)#2,980
5.7313015.0%39.0%(-24.0)#2633.1%(-18.1)#3,312
6.7314117.5%39.0%(-21.5)#4333.1%(-15.6)#4,217
7.7317018.2%39.0%(-20.8)#4933.1%(-14.9)#4,499
8.7311822.2%39.0%(-16.8)#7733.1%(-11.0)#6,065
9.7316224.4%39.0%(-14.6)#8533.1%(-8.77)#6,924
10.7312027.5%39.0%(-11.5)#10533.1%(-5.60)#8,189
11.7315028.8%39.0%(-10.2)#11933.1%(-4.37)#8,697
12.7316030.4%39.0%(-8.65)#13133.1%(-2.77)#9,331
13.7317331.4%39.0%(-7.59)#13733.1%(-1.71)#9,742
14.7314232.5%39.0%(-6.48)#14233.1%(-0.603)#10,187
15.7313533.9%39.0%(-5.14)#15933.1%(+0.740)#10,827
16.7311234.2%39.0%(-4.82)#16033.1%(+1.06)#10,932
17.7311035.6%39.0%(-3.40)#17033.1%(+2.48)#11,441
18.7310736.3%39.0%(-2.70)#18433.1%(+3.18)#11,709
19.7313237.1%39.0%(-1.92)#19533.1%(+3.96)#12,036
20.7310637.8%39.0%(-1.18)#20133.1%(+4.70)#12,335
21.7315938.5%39.0%(-0.502)#20833.1%(+5.38)#12,578
22.7310939.1%39.0%(+0.060)#21333.1%(+5.94)#12,755
23.7311640.6%39.0%(+1.61)#23033.1%(+7.49)#13,354
24.7310542.4%39.0%(+3.40)#24433.1%(+9.28)#13,939
25.7311143.9%39.0%(+4.84)#25833.1%(+10.7)#14,374
26.7313947.2%39.0%(+8.18)#28633.1%(+14.1)#15,408
27.7311949.3%39.0%(+10.3)#30633.1%(+16.2)#15,971
28.7312752.4%39.0%(+13.4)#34333.1%(+19.2)#16,851
29.7312953.1%39.0%(+14.1)#34933.1%(+20.0)#17,022
30.7311458.5%39.0%(+19.4)#39233.1%(+25.3)#18,154
31.7314558.8%39.0%(+19.8)#39333.1%(+25.7)#18,208
32.7312259.0%39.0%(+20.0)#39633.1%(+25.9)#18,246
33.7311559.9%39.0%(+20.9)#40133.1%(+26.8)#18,372
34.7314961.6%39.0%(+22.6)#41333.1%(+28.5)#18,703
35.7311774.4%39.0%(+35.4)#46433.1%(+41.2)#20,206
36.7316574.5%39.0%(+35.5)#46533.1%(+41.3)#20,211
37.7310883.6%39.0%(+44.6)#48833.1%(+50.4)#20,892
38.7312892.2%39.0%(+53.2)#49933.1%(+59.0)#21,254
39.73104100.0%39.0%(+61.0)#50133.1%(+66.9)#21,413

Common Questions

What are the Top 10 Zip Codes with the Lowest Poverty Level Among Single Mothers in Oklahoma City, OK?
Top 10 Zip Codes with the Lowest Poverty Level Among Single Mothers in Oklahoma City, OK are:
#1
0.0%
#2
0.0%
#3
0.0%
#4
0.0%
#5
4.3%
#6
6.6%
#7
10.9%
#8
14.1%
#9
15.0%
#10
17.5%
What zip code has the Lowest Poverty Level Among Single Mothers in Oklahoma City, OK?
73121 has the Lowest Poverty Level Among Single Mothers in Oklahoma City, OK with 4.3%.
What is the Poverty Level Among Single Mothers in Oklahoma City, OK?
Poverty Level Among Single Mothers in Oklahoma City is 38.3%.
What is the Poverty Level Among Single Mothers in Oklahoma?
Poverty Level Among Single Mothers in Oklahoma is 39.0%.
What is the Poverty Level Among Single Mothers in the United States?
Poverty Level Among Single Mothers in the United States is 33.1%.