Zip Codes with the Highest Percentage of Population with a Degree in Social Sciences in Oklahoma City, OK

RELATED REPORTS & OPTIONS

Social Sciences
Population
Families and Households
Female Fertility
Female Fertility (Unmarried)
Race (Community Size)
Race (Percentage)
Ancestry (Community Size)
AfricanAlaska NativeAlbanianAmericanApacheArabArapahoArgentineanArmenianAustralianAustrianBahamianBangladeshiBarbadianBasqueBelgianBhutaneseBlackfeetBolivianBrazilianBritishBritish West IndianBulgarianBurmeseCajunCambodianCanadianCelticCentral AmericanCentral American IndianCherokeeCheyenneChickasawChileanChippewaChoctawColombianComancheCreeCreekCroatianCubanCzechCzechoslovakianDanishDelawareDominicanDutchDutch West IndianEastern EuropeanEcuadorianEgyptianEnglishEstonianEthiopianEuropeanFijianFilipinoFinnishFrenchFrench American IndianFrench CanadianGermanGerman RussianGhanaianGreekGuamanian / ChamorroGuatemalanGuyaneseHaitianHonduranHopiHungarianIcelanderIndian (Asian)IndonesianInupiatIranianIraqiIrishIroquoisIsraeliItalianJamaicanJapaneseJordanianKenyanKiowaKoreanLaotianLatvianLebaneseLiberianLithuanianLuxembourgerMalaysianMexicanMexican American IndianMongolianMoroccanNative HawaiianNavajoNew ZealanderNicaraguanNigerianNorthern EuropeanNorwegianOkinawanOsagePakistaniPalestinianPanamanianPennsylvania GermanPeruvianPimaPolishPortuguesePotawatomiPuebloPuerto RicanRomanianRussianSalvadoranSamoanScandinavianScotch-IrishScottishSeminoleSerbianSiouxSlavicSlovakSloveneSouth AfricanSouth AmericanSouth American IndianSpaniardSpanishSpanish American IndianSri LankanSubsaharan AfricanSudaneseSwedishSwissSyrianThaiTlingit-HaidaTonganTrinidadian and TobagonianTurkishU.S. Virgin IslanderUkrainianUruguayanVenezuelanVietnameseWelshWest IndianYugoslavianZimbabwean
Ancestry (Percentage)
AfricanAlaska NativeAlbanianAmericanApacheArabArapahoArgentineanArmenianAustralianAustrianBahamianBangladeshiBarbadianBasqueBelgianBhutaneseBlackfeetBolivianBrazilianBritishBritish West IndianBulgarianBurmeseCajunCambodianCanadianCelticCentral AmericanCentral American IndianCherokeeCheyenneChickasawChileanChippewaChoctawColombianComancheCreeCreekCroatianCubanCzechCzechoslovakianDanishDelawareDominicanDutchDutch West IndianEastern EuropeanEcuadorianEgyptianEnglishEstonianEthiopianEuropeanFijianFilipinoFinnishFrenchFrench American IndianFrench CanadianGermanGerman RussianGhanaianGreekGuamanian / ChamorroGuatemalanGuyaneseHaitianHonduranHopiHungarianIcelanderIndian (Asian)IndonesianInupiatIranianIraqiIrishIroquoisIsraeliItalianJamaicanJapaneseJordanianKenyanKiowaKoreanLaotianLatvianLebaneseLiberianLithuanianLuxembourgerMalaysianMexicanMexican American IndianMongolianMoroccanNative HawaiianNavajoNew ZealanderNicaraguanNigerianNorthern EuropeanNorwegianOkinawanOsagePakistaniPalestinianPanamanianPennsylvania GermanPeruvianPimaPolishPortuguesePotawatomiPuebloPuerto RicanRomanianRussianSalvadoranSamoanScandinavianScotch-IrishScottishSeminoleSerbianSiouxSlavicSlovakSloveneSouth AfricanSouth AmericanSouth American IndianSpaniardSpanishSpanish American IndianSri LankanSubsaharan AfricanSudaneseSwedishSwissSyrianThaiTlingit-HaidaTonganTrinidadian and TobagonianTurkishU.S. Virgin IslanderUkrainianUruguayanVenezuelanVietnameseWelshWest IndianYugoslavianZimbabwean
Immigrant Origin (Total)
AfricaArgentinaAsiaAustraliaAustriaBahamasBangladeshBosnia and HerzegovinaBrazilBulgariaBurma / MyanmarCambodiaCameroonCanadaCaribbeanCentral AmericaChileChinaColombiaCubaDominican RepublicEastern AfricaEastern AsiaEastern EuropeEcuadorEgyptEl SalvadorEnglandEritreaEthiopiaEuropeFranceGermanyGhanaGreeceGuatemalaHondurasHong KongIndiaIndonesiaIranIraqIrelandItalyJamaicaJapanJordanKazakhstanKenyaKoreaKuwaitLaosLatin AmericaLebanonLiberiaMalaysiaMexicoMiddle AfricaMoroccoNepalNetherlandsNicaraguaNigeriaNorthern AfricaNorthern EuropeNorwayOceaniaPakistanPanamaPeruPhilippinesPolandPortugalRussiaSaudi ArabiaScotlandSingaporeSouth AfricaSouth AmericaSouth Central AsiaSouth Eastern AsiaSouthern EuropeSpainSudanSyriaTaiwanThailandTrinidad and TobagoTurkeyUkraineVenezuelaVietnamWestern AfricaWestern AsiaWestern EuropeZaireZimbabwe
Immigrant Origin (Percentage)
AfricaArgentinaAsiaAustraliaAustriaBahamasBangladeshBosnia and HerzegovinaBrazilBulgariaBurma / MyanmarCambodiaCameroonCanadaCaribbeanCentral AmericaChileChinaColombiaCubaDominican RepublicEastern AfricaEastern AsiaEastern EuropeEcuadorEgyptEl SalvadorEnglandEritreaEthiopiaEuropeFranceGermanyGhanaGreeceGuatemalaHondurasHong KongIndiaIndonesiaIranIraqIrelandItalyJamaicaJapanJordanKazakhstanKenyaKoreaKuwaitLaosLatin AmericaLebanonLiberiaMalaysiaMexicoMiddle AfricaMoroccoNepalNetherlandsNicaraguaNigeriaNorthern AfricaNorthern EuropeNorwayOceaniaPakistanPanamaPeruPhilippinesPolandPortugalRussiaSaudi ArabiaScotlandSingaporeSouth AfricaSouth AmericaSouth Central AsiaSouth Eastern AsiaSouthern EuropeSpainSudanSyriaTaiwanThailandTrinidad and TobagoTurkeyUkraineVenezuelaVietnamWestern AfricaWestern AsiaWestern EuropeZaireZimbabwe
Income
Income (Families)
Income (Households)
Poverty
Poverty (Families)
Unemployment
Employment Occupations
Employment Industries
Employer Class
Commute Time
Commute Means
School Enrollment
Education by Degree Field
Occupancy
Finances
Physical Characteristics
Oklahoma City
Compare Zip Codes
Comparison Subject

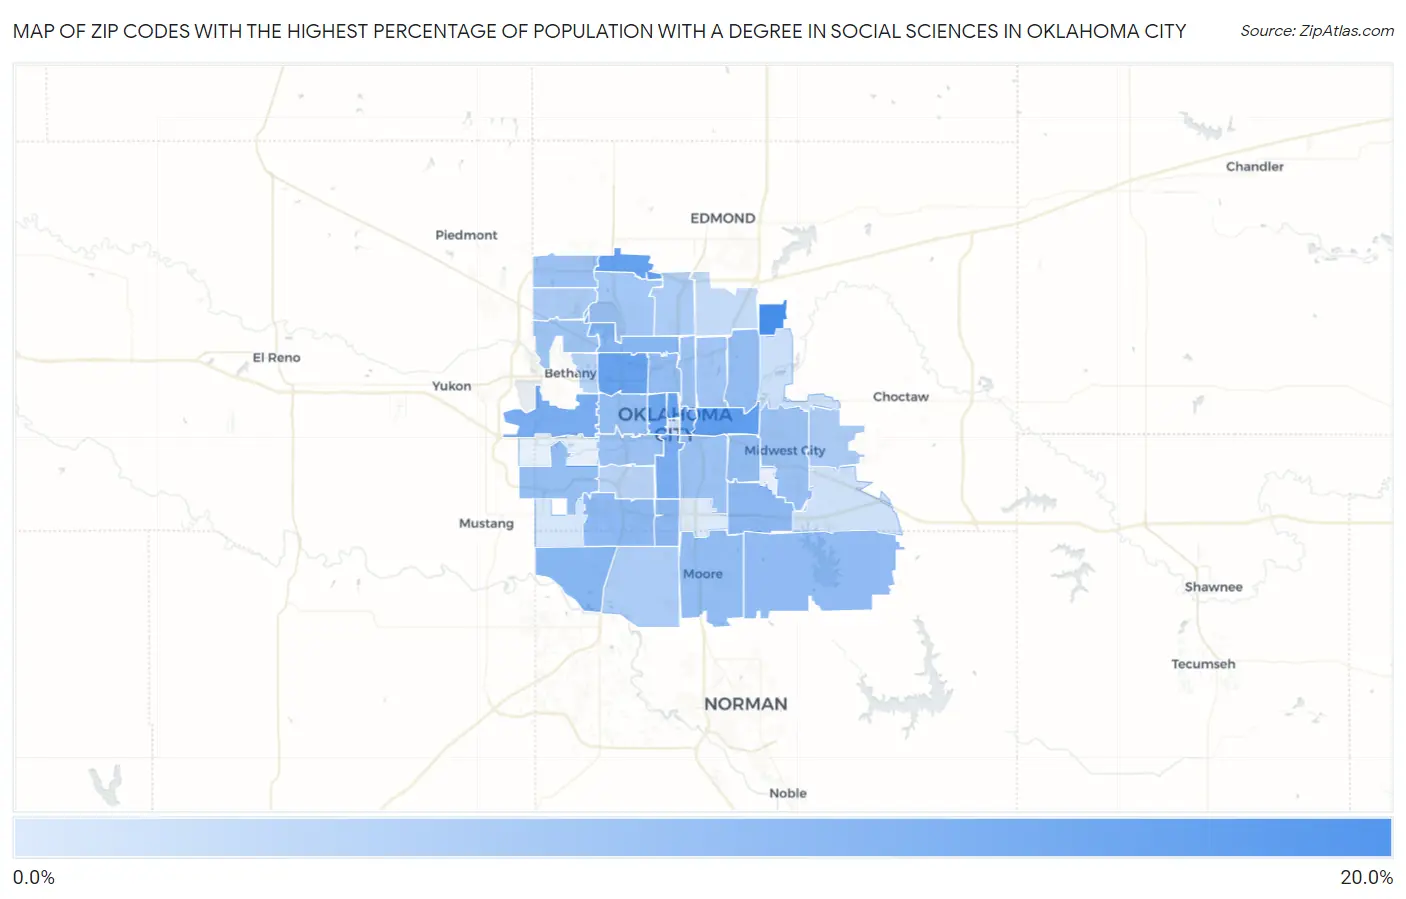
Map of Zip Codes with the Highest Percentage of Population with a Degree in Social Sciences in Oklahoma City

0.0%
20.0%
Zip Codes with the Highest Percentage of Population with a Degree in Social Sciences in Oklahoma City Map

Zip Codes with the Highest Percentage of Population with a Degree in Social Sciences in Oklahoma City, OK

Zip Code % Graduates vs State vs National
1.7315115.0%5.1%(+9.94)#138.1%(+6.98)#1,931
2.7311712.3%5.1%(+7.21)#248.1%(+4.25)#3,266
3.7313412.0%5.1%(+6.89)#288.1%(+3.93)#3,501
4.7310311.8%5.1%(+6.70)#308.1%(+3.73)#3,659
5.7311211.7%5.1%(+6.59)#318.1%(+3.63)#3,739
6.7310611.3%5.1%(+6.17)#378.1%(+3.21)#4,094
7.7310411.1%5.1%(+5.97)#408.1%(+3.01)#4,309
8.731099.8%5.1%(+4.74)#478.1%(+1.78)#5,751
9.731279.8%5.1%(+4.65)#488.1%(+1.68)#5,870
10.731168.5%5.1%(+3.39)#638.1%(+0.430)#7,797
11.731738.3%5.1%(+3.22)#648.1%(+0.256)#8,138
12.731398.1%5.1%(+2.95)#718.1%(-0.016)#8,630
13.731357.9%5.1%(+2.76)#748.1%(-0.199)#9,017
14.731597.7%5.1%(+2.58)#788.1%(-0.377)#9,364
15.731657.5%5.1%(+2.44)#818.1%(-0.523)#9,667
16.731607.4%5.1%(+2.27)#858.1%(-0.689)#10,037
17.731187.3%5.1%(+2.16)#908.1%(-0.804)#10,287
18.731077.2%5.1%(+2.11)#928.1%(-0.849)#10,387
19.731157.2%5.1%(+2.09)#938.1%(-0.872)#10,441
20.731217.2%5.1%(+2.07)#948.1%(-0.887)#10,472
21.731797.0%5.1%(+1.84)#988.1%(-1.12)#11,024
22.731056.7%5.1%(+1.59)#1088.1%(-1.37)#11,612
23.731426.4%5.1%(+1.31)#1188.1%(-1.65)#12,314
24.731296.4%5.1%(+1.30)#1198.1%(-1.66)#12,353
25.731106.4%5.1%(+1.28)#1218.1%(-1.68)#12,401
26.731086.3%5.1%(+1.23)#1248.1%(-1.73)#12,532
27.731326.1%5.1%(+1.03)#1338.1%(-1.93)#12,982
28.731116.0%5.1%(+0.856)#1438.1%(-2.11)#13,438
29.731205.6%5.1%(+0.502)#1568.1%(-2.46)#14,288
30.731625.1%5.1%(+0.017)#1748.1%(-2.95)#15,530
31.731704.9%5.1%(-0.245)#1878.1%(-3.21)#16,147
32.731144.7%5.1%(-0.375)#1948.1%(-3.34)#16,444
33.731304.7%5.1%(-0.394)#1998.1%(-3.36)#16,493
34.731223.9%5.1%(-1.21)#2438.1%(-4.18)#18,448
35.731193.8%5.1%(-1.29)#2468.1%(-4.25)#18,609
36.731022.7%5.1%(-2.39)#3068.1%(-5.36)#20,887
37.731312.7%5.1%(-2.43)#3088.1%(-5.39)#20,946
38.731411.7%5.1%(-3.37)#3648.1%(-6.33)#22,568
39.731501.5%5.1%(-3.59)#3678.1%(-6.55)#22,945
40.731690.85%5.1%(-4.26)#3968.1%(-7.22)#23,757
41.731490.26%5.1%(-4.85)#4128.1%(-7.81)#24,168

Common Questions

What are the Top 10 Zip Codes with the Highest Percentage of Population with a Degree in Social Sciences in Oklahoma City, OK?
Top 10 Zip Codes with the Highest Percentage of Population with a Degree in Social Sciences in Oklahoma City, OK are:
#1
15.0%
#2
12.3%
#3
12.0%
#4
11.8%
#5
11.7%
#6
11.3%
#7
11.1%
#8
9.8%
#9
9.8%
#10
8.5%
What zip code has the Highest Percentage of Population with a Degree in Social Sciences in Oklahoma City, OK?
73151 has the Highest Percentage of Population with a Degree in Social Sciences in Oklahoma City, OK with 15.0%.
What is the Percentage of Population with a Degree in Social Sciences in Oklahoma City, OK?
Percentage of Population with a Degree in Social Sciences in Oklahoma City is 5.9%.
What is the Percentage of Population with a Degree in Social Sciences in Oklahoma?
Percentage of Population with a Degree in Social Sciences in Oklahoma is 5.1%.
What is the Percentage of Population with a Degree in Social Sciences in the United States?
Percentage of Population with a Degree in Social Sciences in the United States is 8.1%.