Zip Codes with the Highest Percentage of Population with a Degree in Physical and Health Sciences in Oklahoma City, OK

RELATED REPORTS & OPTIONS

Physical and Health Sciences
Population
Families and Households
Female Fertility
Female Fertility (Unmarried)
Race (Community Size)
Race (Percentage)
Ancestry (Community Size)
AfricanAlaska NativeAlbanianAmericanApacheArabArapahoArgentineanArmenianAustralianAustrianBahamianBangladeshiBarbadianBasqueBelgianBhutaneseBlackfeetBolivianBrazilianBritishBritish West IndianBulgarianBurmeseCajunCambodianCanadianCelticCentral AmericanCentral American IndianCherokeeCheyenneChickasawChileanChippewaChoctawColombianComancheCreeCreekCroatianCubanCzechCzechoslovakianDanishDelawareDominicanDutchDutch West IndianEastern EuropeanEcuadorianEgyptianEnglishEstonianEthiopianEuropeanFijianFilipinoFinnishFrenchFrench American IndianFrench CanadianGermanGerman RussianGhanaianGreekGuamanian / ChamorroGuatemalanGuyaneseHaitianHonduranHopiHungarianIcelanderIndian (Asian)IndonesianInupiatIranianIraqiIrishIroquoisIsraeliItalianJamaicanJapaneseJordanianKenyanKiowaKoreanLaotianLatvianLebaneseLiberianLithuanianLuxembourgerMalaysianMexicanMexican American IndianMongolianMoroccanNative HawaiianNavajoNew ZealanderNicaraguanNigerianNorthern EuropeanNorwegianOkinawanOsagePakistaniPalestinianPanamanianPennsylvania GermanPeruvianPimaPolishPortuguesePotawatomiPuebloPuerto RicanRomanianRussianSalvadoranSamoanScandinavianScotch-IrishScottishSeminoleSerbianSiouxSlavicSlovakSloveneSouth AfricanSouth AmericanSouth American IndianSpaniardSpanishSpanish American IndianSri LankanSubsaharan AfricanSudaneseSwedishSwissSyrianThaiTlingit-HaidaTonganTrinidadian and TobagonianTurkishU.S. Virgin IslanderUkrainianUruguayanVenezuelanVietnameseWelshWest IndianYugoslavianZimbabwean
Ancestry (Percentage)
AfricanAlaska NativeAlbanianAmericanApacheArabArapahoArgentineanArmenianAustralianAustrianBahamianBangladeshiBarbadianBasqueBelgianBhutaneseBlackfeetBolivianBrazilianBritishBritish West IndianBulgarianBurmeseCajunCambodianCanadianCelticCentral AmericanCentral American IndianCherokeeCheyenneChickasawChileanChippewaChoctawColombianComancheCreeCreekCroatianCubanCzechCzechoslovakianDanishDelawareDominicanDutchDutch West IndianEastern EuropeanEcuadorianEgyptianEnglishEstonianEthiopianEuropeanFijianFilipinoFinnishFrenchFrench American IndianFrench CanadianGermanGerman RussianGhanaianGreekGuamanian / ChamorroGuatemalanGuyaneseHaitianHonduranHopiHungarianIcelanderIndian (Asian)IndonesianInupiatIranianIraqiIrishIroquoisIsraeliItalianJamaicanJapaneseJordanianKenyanKiowaKoreanLaotianLatvianLebaneseLiberianLithuanianLuxembourgerMalaysianMexicanMexican American IndianMongolianMoroccanNative HawaiianNavajoNew ZealanderNicaraguanNigerianNorthern EuropeanNorwegianOkinawanOsagePakistaniPalestinianPanamanianPennsylvania GermanPeruvianPimaPolishPortuguesePotawatomiPuebloPuerto RicanRomanianRussianSalvadoranSamoanScandinavianScotch-IrishScottishSeminoleSerbianSiouxSlavicSlovakSloveneSouth AfricanSouth AmericanSouth American IndianSpaniardSpanishSpanish American IndianSri LankanSubsaharan AfricanSudaneseSwedishSwissSyrianThaiTlingit-HaidaTonganTrinidadian and TobagonianTurkishU.S. Virgin IslanderUkrainianUruguayanVenezuelanVietnameseWelshWest IndianYugoslavianZimbabwean
Immigrant Origin (Total)
AfricaArgentinaAsiaAustraliaAustriaBahamasBangladeshBosnia and HerzegovinaBrazilBulgariaBurma / MyanmarCambodiaCameroonCanadaCaribbeanCentral AmericaChileChinaColombiaCubaDominican RepublicEastern AfricaEastern AsiaEastern EuropeEcuadorEgyptEl SalvadorEnglandEritreaEthiopiaEuropeFranceGermanyGhanaGreeceGuatemalaHondurasHong KongIndiaIndonesiaIranIraqIrelandItalyJamaicaJapanJordanKazakhstanKenyaKoreaKuwaitLaosLatin AmericaLebanonLiberiaMalaysiaMexicoMiddle AfricaMoroccoNepalNetherlandsNicaraguaNigeriaNorthern AfricaNorthern EuropeNorwayOceaniaPakistanPanamaPeruPhilippinesPolandPortugalRussiaSaudi ArabiaScotlandSingaporeSouth AfricaSouth AmericaSouth Central AsiaSouth Eastern AsiaSouthern EuropeSpainSudanSyriaTaiwanThailandTrinidad and TobagoTurkeyUkraineVenezuelaVietnamWestern AfricaWestern AsiaWestern EuropeZaireZimbabwe
Immigrant Origin (Percentage)
AfricaArgentinaAsiaAustraliaAustriaBahamasBangladeshBosnia and HerzegovinaBrazilBulgariaBurma / MyanmarCambodiaCameroonCanadaCaribbeanCentral AmericaChileChinaColombiaCubaDominican RepublicEastern AfricaEastern AsiaEastern EuropeEcuadorEgyptEl SalvadorEnglandEritreaEthiopiaEuropeFranceGermanyGhanaGreeceGuatemalaHondurasHong KongIndiaIndonesiaIranIraqIrelandItalyJamaicaJapanJordanKazakhstanKenyaKoreaKuwaitLaosLatin AmericaLebanonLiberiaMalaysiaMexicoMiddle AfricaMoroccoNepalNetherlandsNicaraguaNigeriaNorthern AfricaNorthern EuropeNorwayOceaniaPakistanPanamaPeruPhilippinesPolandPortugalRussiaSaudi ArabiaScotlandSingaporeSouth AfricaSouth AmericaSouth Central AsiaSouth Eastern AsiaSouthern EuropeSpainSudanSyriaTaiwanThailandTrinidad and TobagoTurkeyUkraineVenezuelaVietnamWestern AfricaWestern AsiaWestern EuropeZaireZimbabwe
Income
Income (Families)
Income (Households)
Poverty
Poverty (Families)
Unemployment
Employment Occupations
Employment Industries
Employer Class
Commute Time
Commute Means
School Enrollment
Education by Degree Field
Occupancy
Finances
Physical Characteristics
Oklahoma City
Compare Zip Codes
Comparison Subject

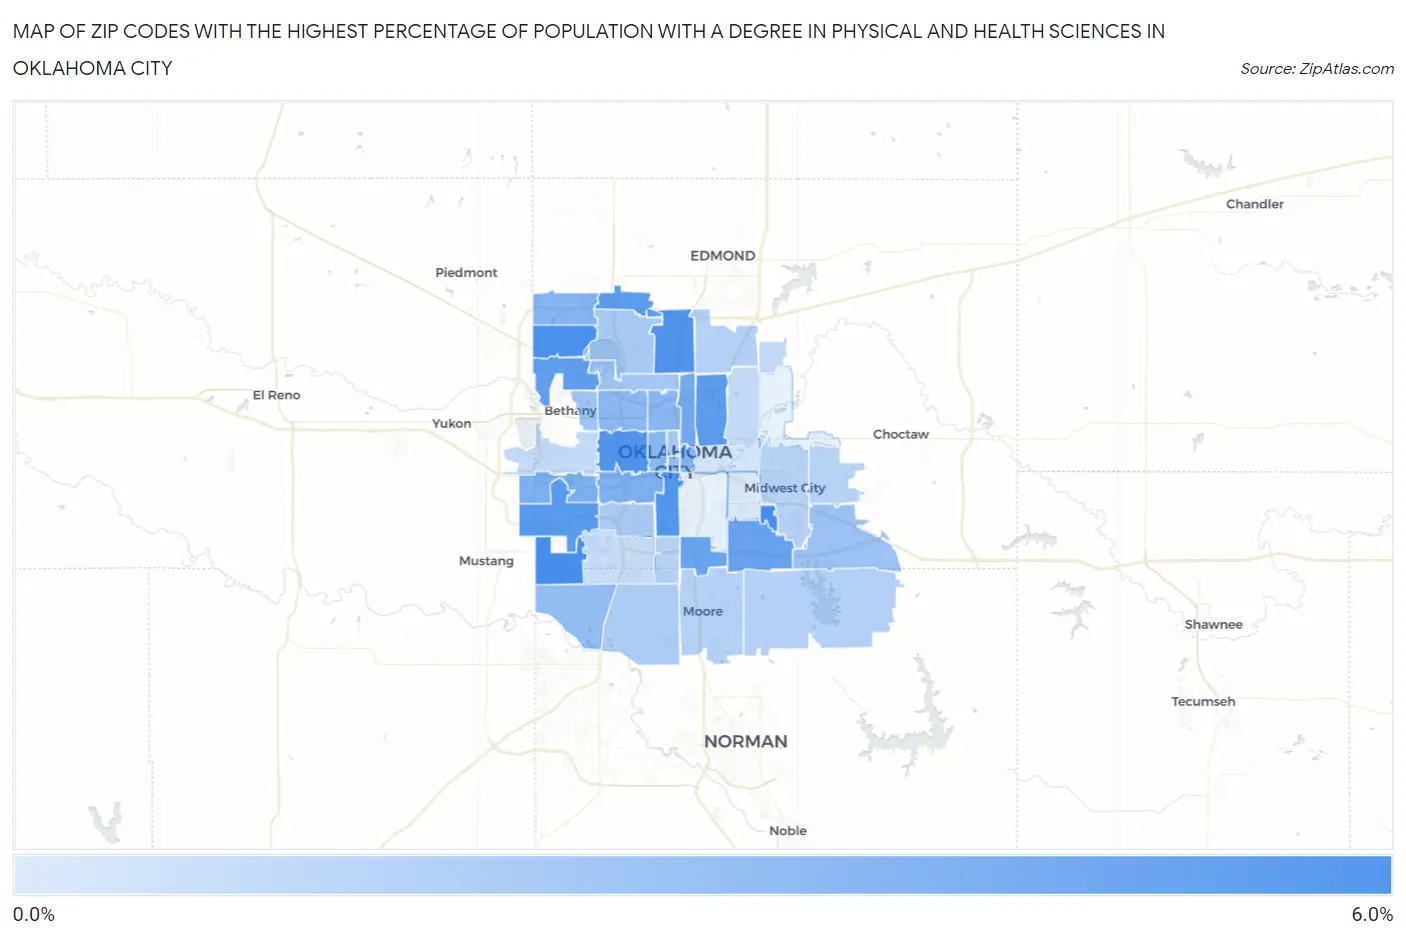
Map of Zip Codes with the Highest Percentage of Population with a Degree in Physical and Health Sciences in Oklahoma City

0.0%
6.0%
Zip Codes with the Highest Percentage of Population with a Degree in Physical and Health Sciences in Oklahoma City Map

Zip Codes with the Highest Percentage of Population with a Degree in Physical and Health Sciences in Oklahoma City, OK

Zip Code % Graduates vs State vs National
1.731455.7%3.1%(+2.64)#943.1%(+2.63)#3,528
2.731695.7%3.1%(+2.64)#953.1%(+2.63)#3,529
3.731625.5%3.1%(+2.44)#1023.1%(+2.44)#3,777
4.731075.5%3.1%(+2.38)#1043.1%(+2.38)#3,862
5.731145.5%3.1%(+2.36)#1053.1%(+2.36)#3,885
6.731095.3%3.1%(+2.24)#1093.1%(+2.24)#4,035
7.731795.1%3.1%(+2.03)#1143.1%(+2.02)#4,355
8.731345.0%3.1%(+1.94)#1163.1%(+1.94)#4,486
9.731115.0%3.1%(+1.91)#1183.1%(+1.90)#4,531
10.731324.8%3.1%(+1.71)#1283.1%(+1.71)#4,912
11.731354.5%3.1%(+1.39)#1443.1%(+1.39)#5,567
12.731494.5%3.1%(+1.38)#1463.1%(+1.37)#5,596
13.731054.1%3.1%(+0.984)#1633.1%(+0.980)#6,531
14.731283.8%3.1%(+0.693)#1793.1%(+0.688)#7,412
15.731083.7%3.1%(+0.563)#1863.1%(+0.559)#7,847
16.731423.4%3.1%(+0.335)#2003.1%(+0.331)#8,689
17.731043.4%3.1%(+0.309)#2033.1%(+0.305)#8,780
18.731183.2%3.1%(+0.143)#2133.1%(+0.138)#9,434
19.731063.2%3.1%(+0.105)#2163.1%(+0.101)#9,578
20.731123.2%3.1%(+0.086)#2203.1%(+0.082)#9,650
21.731023.0%3.1%(-0.132)#2383.1%(-0.137)#10,584
22.731732.9%3.1%(-0.199)#2443.1%(-0.203)#10,875
23.731502.6%3.1%(-0.519)#2663.1%(-0.524)#12,368
24.731222.4%3.1%(-0.706)#2823.1%(-0.710)#13,245
25.731162.3%3.1%(-0.793)#2973.1%(-0.798)#13,666
26.731032.2%3.1%(-0.891)#3013.1%(-0.896)#14,123
27.731202.1%3.1%(-0.966)#3103.1%(-0.970)#14,466
28.731192.1%3.1%(-1.01)#3143.1%(-1.01)#14,699
29.731702.0%3.1%(-1.13)#3233.1%(-1.14)#15,271
30.731311.8%3.1%(-1.33)#3373.1%(-1.34)#16,169
31.731651.7%3.1%(-1.37)#3413.1%(-1.38)#16,344
32.731601.6%3.1%(-1.48)#3493.1%(-1.49)#16,811
33.731101.6%3.1%(-1.51)#3533.1%(-1.52)#16,951
34.731391.6%3.1%(-1.54)#3563.1%(-1.55)#17,071
35.731301.5%3.1%(-1.62)#3633.1%(-1.63)#17,417
36.731511.2%3.1%(-1.88)#3773.1%(-1.88)#18,477
37.731211.1%3.1%(-1.95)#3853.1%(-1.95)#18,709
38.731271.1%3.1%(-1.97)#3883.1%(-1.98)#18,797
39.731590.99%3.1%(-2.10)#3943.1%(-2.11)#19,279
40.731170.60%3.1%(-2.49)#4133.1%(-2.50)#20,381
41.731150.23%3.1%(-2.86)#4273.1%(-2.87)#21,006

Common Questions

What are the Top 10 Zip Codes with the Highest Percentage of Population with a Degree in Physical and Health Sciences in Oklahoma City, OK?
Top 10 Zip Codes with the Highest Percentage of Population with a Degree in Physical and Health Sciences in Oklahoma City, OK are:
#1
5.7%
#2
5.7%
#3
5.5%
#4
5.5%
#5
5.5%
#6
5.3%
#7
5.1%
#8
5.0%
#9
5.0%
#10
4.8%
What zip code has the Highest Percentage of Population with a Degree in Physical and Health Sciences in Oklahoma City, OK?
73145 has the Highest Percentage of Population with a Degree in Physical and Health Sciences in Oklahoma City, OK with 5.7%.
What is the Percentage of Population with a Degree in Physical and Health Sciences in Oklahoma City, OK?
Percentage of Population with a Degree in Physical and Health Sciences in Oklahoma City is 3.1%.
What is the Percentage of Population with a Degree in Physical and Health Sciences in Oklahoma?
Percentage of Population with a Degree in Physical and Health Sciences in Oklahoma is 3.1%.
What is the Percentage of Population with a Degree in Physical and Health Sciences in the United States?
Percentage of Population with a Degree in Physical and Health Sciences in the United States is 3.1%.