Zip Codes with the Highest Percentage of Not-for-profit Organizations in Oklahoma City, OK

RELATED REPORTS & OPTIONS

Not-for-profit Organizations
Population
Families and Households
Female Fertility
Female Fertility (Unmarried)
Race (Community Size)
Race (Percentage)
Ancestry (Community Size)
AfricanAlaska NativeAlbanianAmericanApacheArabArapahoArgentineanArmenianAustralianAustrianBahamianBangladeshiBarbadianBasqueBelgianBhutaneseBlackfeetBolivianBrazilianBritishBritish West IndianBulgarianBurmeseCajunCambodianCanadianCelticCentral AmericanCentral American IndianCherokeeCheyenneChickasawChileanChippewaChoctawColombianComancheCreeCreekCroatianCubanCzechCzechoslovakianDanishDelawareDominicanDutchDutch West IndianEastern EuropeanEcuadorianEgyptianEnglishEstonianEthiopianEuropeanFijianFilipinoFinnishFrenchFrench American IndianFrench CanadianGermanGerman RussianGhanaianGreekGuamanian / ChamorroGuatemalanGuyaneseHaitianHonduranHopiHungarianIcelanderIndian (Asian)IndonesianInupiatIranianIraqiIrishIroquoisIsraeliItalianJamaicanJapaneseJordanianKenyanKiowaKoreanLaotianLatvianLebaneseLiberianLithuanianLuxembourgerMalaysianMexicanMexican American IndianMongolianMoroccanNative HawaiianNavajoNew ZealanderNicaraguanNigerianNorthern EuropeanNorwegianOkinawanOsagePakistaniPalestinianPanamanianPennsylvania GermanPeruvianPimaPolishPortuguesePotawatomiPuebloPuerto RicanRomanianRussianSalvadoranSamoanScandinavianScotch-IrishScottishSeminoleSerbianSiouxSlavicSlovakSloveneSouth AfricanSouth AmericanSouth American IndianSpaniardSpanishSpanish American IndianSri LankanSubsaharan AfricanSudaneseSwedishSwissSyrianThaiTlingit-HaidaTonganTrinidadian and TobagonianTurkishU.S. Virgin IslanderUkrainianUruguayanVenezuelanVietnameseWelshWest IndianYugoslavianZimbabwean
Ancestry (Percentage)
AfricanAlaska NativeAlbanianAmericanApacheArabArapahoArgentineanArmenianAustralianAustrianBahamianBangladeshiBarbadianBasqueBelgianBhutaneseBlackfeetBolivianBrazilianBritishBritish West IndianBulgarianBurmeseCajunCambodianCanadianCelticCentral AmericanCentral American IndianCherokeeCheyenneChickasawChileanChippewaChoctawColombianComancheCreeCreekCroatianCubanCzechCzechoslovakianDanishDelawareDominicanDutchDutch West IndianEastern EuropeanEcuadorianEgyptianEnglishEstonianEthiopianEuropeanFijianFilipinoFinnishFrenchFrench American IndianFrench CanadianGermanGerman RussianGhanaianGreekGuamanian / ChamorroGuatemalanGuyaneseHaitianHonduranHopiHungarianIcelanderIndian (Asian)IndonesianInupiatIranianIraqiIrishIroquoisIsraeliItalianJamaicanJapaneseJordanianKenyanKiowaKoreanLaotianLatvianLebaneseLiberianLithuanianLuxembourgerMalaysianMexicanMexican American IndianMongolianMoroccanNative HawaiianNavajoNew ZealanderNicaraguanNigerianNorthern EuropeanNorwegianOkinawanOsagePakistaniPalestinianPanamanianPennsylvania GermanPeruvianPimaPolishPortuguesePotawatomiPuebloPuerto RicanRomanianRussianSalvadoranSamoanScandinavianScotch-IrishScottishSeminoleSerbianSiouxSlavicSlovakSloveneSouth AfricanSouth AmericanSouth American IndianSpaniardSpanishSpanish American IndianSri LankanSubsaharan AfricanSudaneseSwedishSwissSyrianThaiTlingit-HaidaTonganTrinidadian and TobagonianTurkishU.S. Virgin IslanderUkrainianUruguayanVenezuelanVietnameseWelshWest IndianYugoslavianZimbabwean
Immigrant Origin (Total)
AfricaArgentinaAsiaAustraliaAustriaBahamasBangladeshBosnia and HerzegovinaBrazilBulgariaBurma / MyanmarCambodiaCameroonCanadaCaribbeanCentral AmericaChileChinaColombiaCubaDominican RepublicEastern AfricaEastern AsiaEastern EuropeEcuadorEgyptEl SalvadorEnglandEritreaEthiopiaEuropeFranceGermanyGhanaGreeceGuatemalaHondurasHong KongIndiaIndonesiaIranIraqIrelandItalyJamaicaJapanJordanKazakhstanKenyaKoreaKuwaitLaosLatin AmericaLebanonLiberiaMalaysiaMexicoMiddle AfricaMoroccoNepalNetherlandsNicaraguaNigeriaNorthern AfricaNorthern EuropeNorwayOceaniaPakistanPanamaPeruPhilippinesPolandPortugalRussiaSaudi ArabiaScotlandSingaporeSouth AfricaSouth AmericaSouth Central AsiaSouth Eastern AsiaSouthern EuropeSpainSudanSyriaTaiwanThailandTrinidad and TobagoTurkeyUkraineVenezuelaVietnamWestern AfricaWestern AsiaWestern EuropeZaireZimbabwe
Immigrant Origin (Percentage)
AfricaArgentinaAsiaAustraliaAustriaBahamasBangladeshBosnia and HerzegovinaBrazilBulgariaBurma / MyanmarCambodiaCameroonCanadaCaribbeanCentral AmericaChileChinaColombiaCubaDominican RepublicEastern AfricaEastern AsiaEastern EuropeEcuadorEgyptEl SalvadorEnglandEritreaEthiopiaEuropeFranceGermanyGhanaGreeceGuatemalaHondurasHong KongIndiaIndonesiaIranIraqIrelandItalyJamaicaJapanJordanKazakhstanKenyaKoreaKuwaitLaosLatin AmericaLebanonLiberiaMalaysiaMexicoMiddle AfricaMoroccoNepalNetherlandsNicaraguaNigeriaNorthern AfricaNorthern EuropeNorwayOceaniaPakistanPanamaPeruPhilippinesPolandPortugalRussiaSaudi ArabiaScotlandSingaporeSouth AfricaSouth AmericaSouth Central AsiaSouth Eastern AsiaSouthern EuropeSpainSudanSyriaTaiwanThailandTrinidad and TobagoTurkeyUkraineVenezuelaVietnamWestern AfricaWestern AsiaWestern EuropeZaireZimbabwe
Income
Income (Families)
Income (Households)
Poverty
Poverty (Families)
Unemployment
Employment Occupations
Employment Industries
Employer Class
Commute Time
Commute Means
School Enrollment
Education by Degree Field
Occupancy
Finances
Physical Characteristics
Oklahoma City
Compare Zip Codes
Comparison Subject

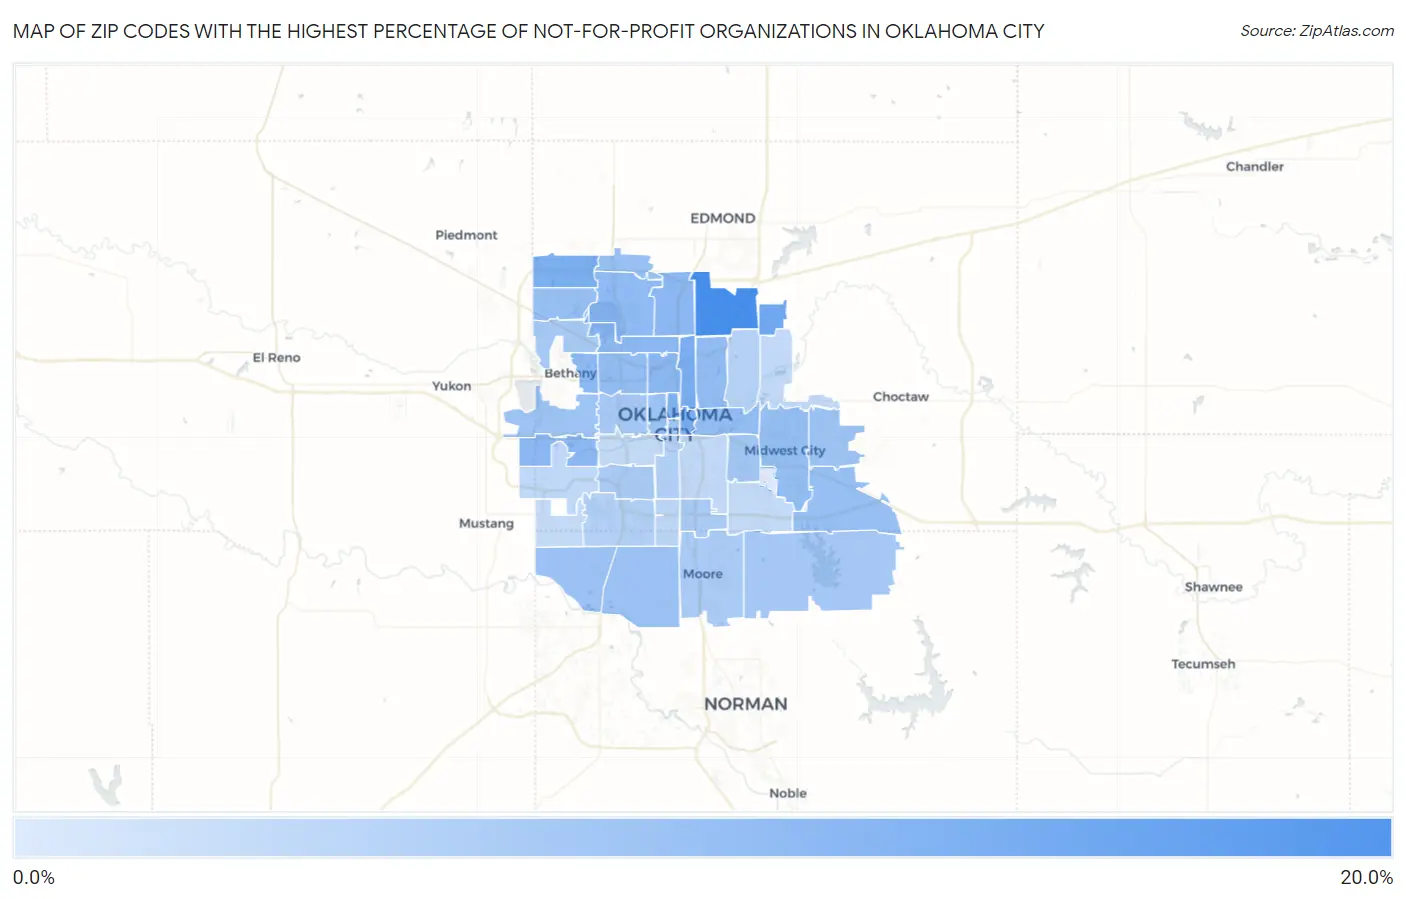
Map of Zip Codes with the Highest Percentage of Not-for-profit Organizations in Oklahoma City

0.0%
20.0%
Zip Codes with the Highest Percentage of Not-for-profit Organizations in Oklahoma City Map

Zip Codes with the Highest Percentage of Not-for-profit Organizations in Oklahoma City, OK

Zip Code % Employed in Not-for-profit vs State vs National
1.7313116.7%6.9%(+9.83)#158.4%(+8.24)#2,143
2.7315112.0%6.9%(+5.18)#368.4%(+3.59)#5,595
3.7310510.9%6.9%(+4.06)#448.4%(+2.47)#7,201
4.7314210.9%6.9%(+4.01)#458.4%(+2.43)#7,263
5.7310410.8%6.9%(+3.96)#478.4%(+2.38)#7,336
6.7310310.3%6.9%(+3.41)#548.4%(+1.82)#8,370
7.731189.1%6.9%(+2.29)#818.4%(+0.702)#10,718
8.731289.1%6.9%(+2.21)#828.4%(+0.629)#10,894
9.731149.0%6.9%(+2.11)#878.4%(+0.520)#11,144
10.731168.9%6.9%(+2.09)#888.4%(+0.504)#11,183
11.731208.9%6.9%(+2.02)#908.4%(+0.432)#11,376
12.731228.8%6.9%(+1.99)#938.4%(+0.402)#11,457
13.731118.5%6.9%(+1.65)#1028.4%(+0.065)#12,256
14.731128.3%6.9%(+1.43)#1078.4%(-0.160)#12,871
15.731178.2%6.9%(+1.37)#1108.4%(-0.219)#13,029
16.731108.1%6.9%(+1.27)#1138.4%(-0.320)#13,302
17.731507.9%6.9%(+1.03)#1208.4%(-0.561)#13,946
18.731627.8%6.9%(+0.938)#1238.4%(-0.648)#14,184
19.731347.7%6.9%(+0.846)#1328.4%(-0.740)#14,460
20.731707.6%6.9%(+0.783)#1368.4%(-0.803)#14,647
21.731737.6%6.9%(+0.700)#1408.4%(-0.886)#14,900
22.731067.3%6.9%(+0.474)#1548.4%(-1.11)#15,594
23.731307.1%6.9%(+0.248)#1708.4%(-1.34)#16,253
24.731277.0%6.9%(+0.155)#1758.4%(-1.43)#16,532
25.731156.6%6.9%(-0.277)#1988.4%(-1.86)#17,808
26.731026.6%6.9%(-0.281)#1998.4%(-1.87)#17,817
27.731076.4%6.9%(-0.436)#2128.4%(-2.02)#18,254
28.731656.3%6.9%(-0.565)#2248.4%(-2.15)#18,649
29.731326.1%6.9%(-0.737)#2328.4%(-2.32)#19,115
30.731605.8%6.9%(-1.03)#2558.4%(-2.62)#19,980
31.731495.8%6.9%(-1.05)#2568.4%(-2.63)#20,020
32.731195.8%6.9%(-1.10)#2608.4%(-2.68)#20,174
33.731095.0%6.9%(-1.88)#3088.4%(-3.47)#22,385
34.731594.9%6.9%(-1.99)#3198.4%(-3.57)#22,651
35.731214.7%6.9%(-2.13)#3308.4%(-3.71)#23,001
36.731393.9%6.9%(-2.93)#3898.4%(-4.52)#24,840
37.731793.8%6.9%(-3.04)#3978.4%(-4.63)#25,066
38.731413.5%6.9%(-3.33)#4238.4%(-4.92)#25,715
39.731293.4%6.9%(-3.44)#4338.4%(-5.02)#25,901
40.731353.3%6.9%(-3.55)#4458.4%(-5.14)#26,097
41.731083.2%6.9%(-3.64)#4508.4%(-5.22)#26,262
42.731693.2%6.9%(-3.66)#4528.4%(-5.24)#26,295
43.731450.69%6.9%(-6.17)#5818.4%(-7.75)#29,111

Common Questions

What are the Top 10 Zip Codes with the Highest Percentage of Not-for-profit Organizations in Oklahoma City, OK?
Top 10 Zip Codes with the Highest Percentage of Not-for-profit Organizations in Oklahoma City, OK are:
#1
16.7%
#2
12.0%
#3
10.9%
#4
10.9%
#5
10.8%
#6
10.3%
#7
9.1%
#8
9.1%
#9
9.0%
#10
8.9%
What zip code has the Highest Percentage of Not-for-profit Organizations in Oklahoma City, OK?
73131 has the Highest Percentage of Not-for-profit Organizations in Oklahoma City, OK with 16.7%.
What is the Percentage of Not-for-profit Organizations in Oklahoma City, OK?
Percentage of Not-for-profit Organizations in Oklahoma City is 7.3%.
What is the Percentage of Not-for-profit Organizations in Oklahoma?
Percentage of Not-for-profit Organizations in Oklahoma is 6.9%.
What is the Percentage of Not-for-profit Organizations in the United States?
Percentage of Not-for-profit Organizations in the United States is 8.4%.