Zip Codes with the Highest Percentage of Hawaiian / Pacific Population in Albuquerque, NM
RELATED REPORTS & OPTIONS
Hawaiian / Pacific
Albuquerque
Compare Zip Codes
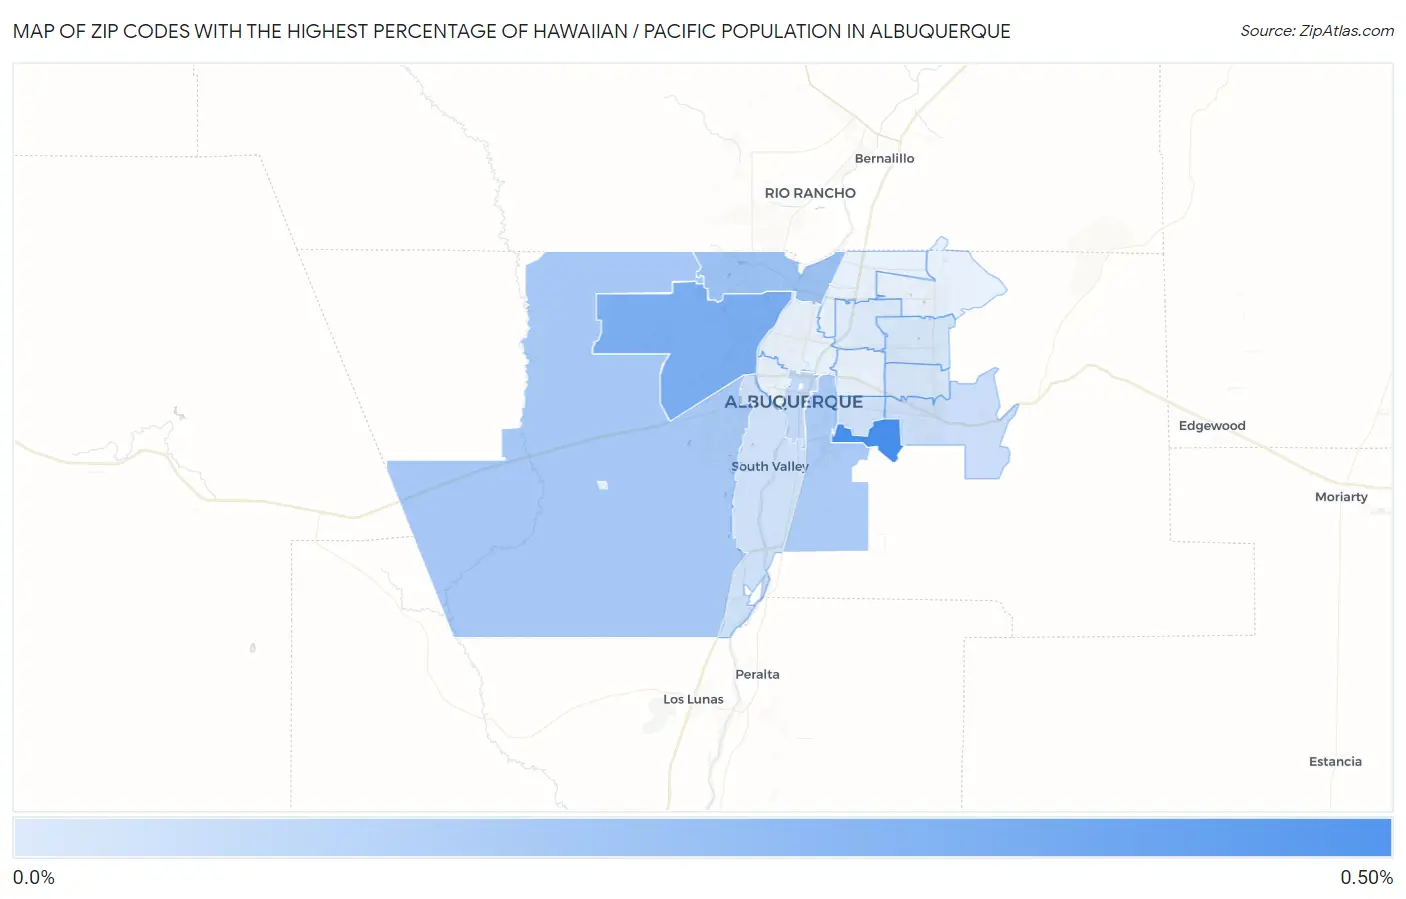
Map of Zip Codes with the Highest Percentage of Hawaiian / Pacific Population in Albuquerque
0.0099%
0.41%
Zip Codes with the Highest Percentage of Hawaiian / Pacific Population in Albuquerque, NM
| Zip Code | Hawaiian / Pacific | vs State | vs National | |
| 1. | 87116 | 0.41% | 0.088%(+0.323)#9 | 0.19%(+0.222)#1,669 |
| 2. | 87120 | 0.27% | 0.088%(+0.186)#10 | 0.19%(+0.084)#2,285 |
| 3. | 87114 | 0.18% | 0.088%(+0.095)#14 | 0.19%(-0.006)#2,958 |
| 4. | 87121 | 0.16% | 0.088%(+0.071)#18 | 0.19%(-0.030)#3,242 |
| 5. | 87106 | 0.15% | 0.088%(+0.060)#19 | 0.19%(-0.042)#3,374 |
| 6. | 87102 | 0.085% | 0.088%(-0.003)#24 | 0.19%(-0.104)#4,320 |
| 7. | 87123 | 0.060% | 0.088%(-0.028)#29 | 0.19%(-0.129)#4,862 |
| 8. | 87105 | 0.047% | 0.088%(-0.041)#33 | 0.19%(-0.142)#5,157 |
| 9. | 87108 | 0.044% | 0.088%(-0.043)#34 | 0.19%(-0.144)#5,224 |
| 10. | 87111 | 0.026% | 0.088%(-0.061)#35 | 0.19%(-0.162)#5,775 |
| 11. | 87112 | 0.026% | 0.088%(-0.062)#36 | 0.19%(-0.163)#5,805 |
| 12. | 87109 | 0.0099% | 0.088%(-0.078)#40 | 0.19%(-0.179)#6,281 |
1
Common Questions
What are the Top 10 Zip Codes with the Highest Percentage of Hawaiian / Pacific Population in Albuquerque, NM?
Top 10 Zip Codes with the Highest Percentage of Hawaiian / Pacific Population in Albuquerque, NM are:
What zip code has the Highest Percentage of Hawaiian / Pacific Population in Albuquerque, NM?
87116 has the Highest Percentage of Hawaiian / Pacific Population in Albuquerque, NM with 0.41%.
What is the Percentage of Hawaiian / Pacific Population in Albuquerque, NM?
Percentage of Hawaiian / Pacific Population in Albuquerque is 0.10%.
What is the Percentage of Hawaiian / Pacific Population in New Mexico?
Percentage of Hawaiian / Pacific Population in New Mexico is 0.088%.
What is the Percentage of Hawaiian / Pacific Population in the United States?
Percentage of Hawaiian / Pacific Population in the United States is 0.19%.