Foxholm, ND Map & Demographics
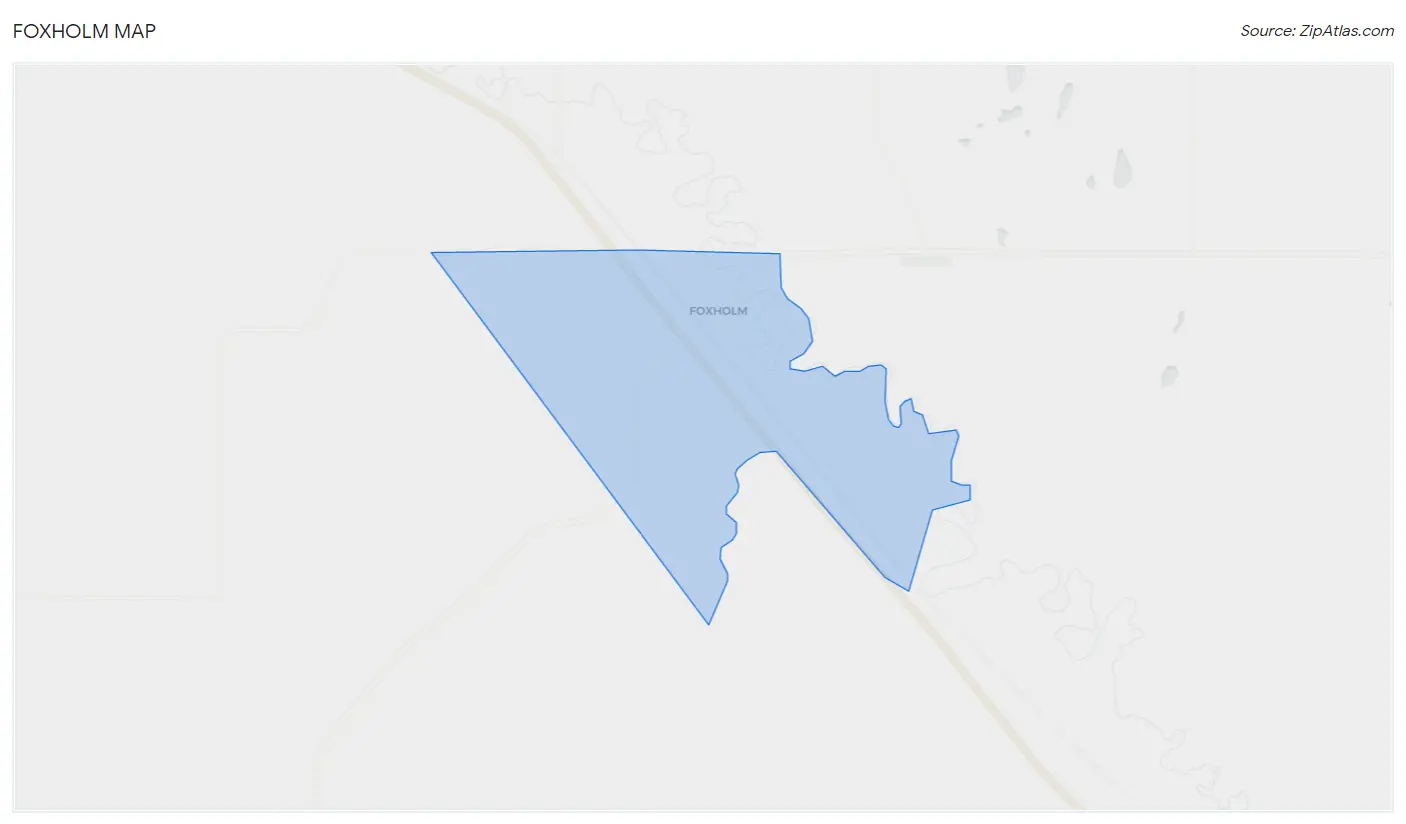
Foxholm Map
Foxholm Overview
$35,762
PER CAPITA INCOME
$103,750
AVG FAMILY INCOME
$121,250
AVG HOUSEHOLD INCOME
0.25
INEQUALITY / GINI INDEX
63
TOTAL POPULATION
30
MALE POPULATION
33
FEMALE POPULATION
90.91
MALES / 100 FEMALES
110.00
FEMALES / 100 MALES
16.5
MEDIAN AGE
3.9
AVG FAMILY SIZE
3.1
AVG HOUSEHOLD SIZE
29
LABOR FORCE [ PEOPLE ]
85.3%
PERCENT IN LABOR FORCE
Foxholm Area Codes
Income in Foxholm
Income Overview in Foxholm
Per Capita Income in Foxholm is $35,762, while median incomes of families and households are $103,750 and $121,250 respectively.
| Characteristic | Number | Measure |
| Per Capita Income | 63 | $35,762 |
| Median Family Income | 15 | $103,750 |
| Mean Family Income | 15 | $94,067 |
| Median Household Income | 20 | $121,250 |
| Mean Household Income | 20 | $117,255 |
| Income Deficit | 15 | $0 |
| Wage / Income Gap (%) | 63 | 0.00% |
| Wage / Income Gap ($) | 63 | 100.00¢ per $1 |
| Gini / Inequality Index | 63 | 0.25 |
Earnings by Sex in Foxholm
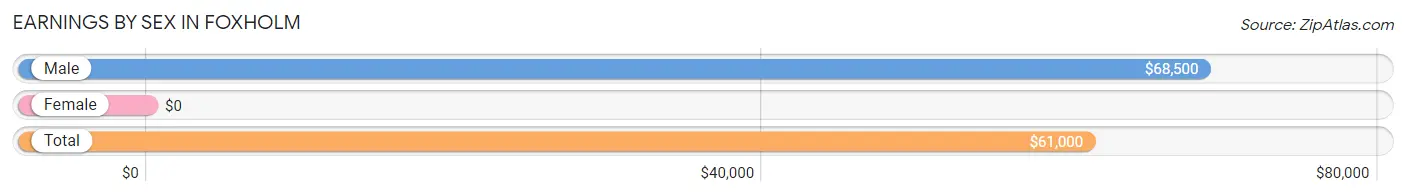
| Sex | Number | Average Earnings |
| Male | 24 (70.6%) | $68,500 |
| Female | 10 (29.4%) | $0 |
| Total | 34 (100.0%) | $61,000 |
Earnings by Sex by Income Bracket in Foxholm
The most common earnings brackets in Foxholm are $7,500 to $9,999 for men (5 | 20.8%) and $10,000 to $12,499 for women (5 | 50.0%).
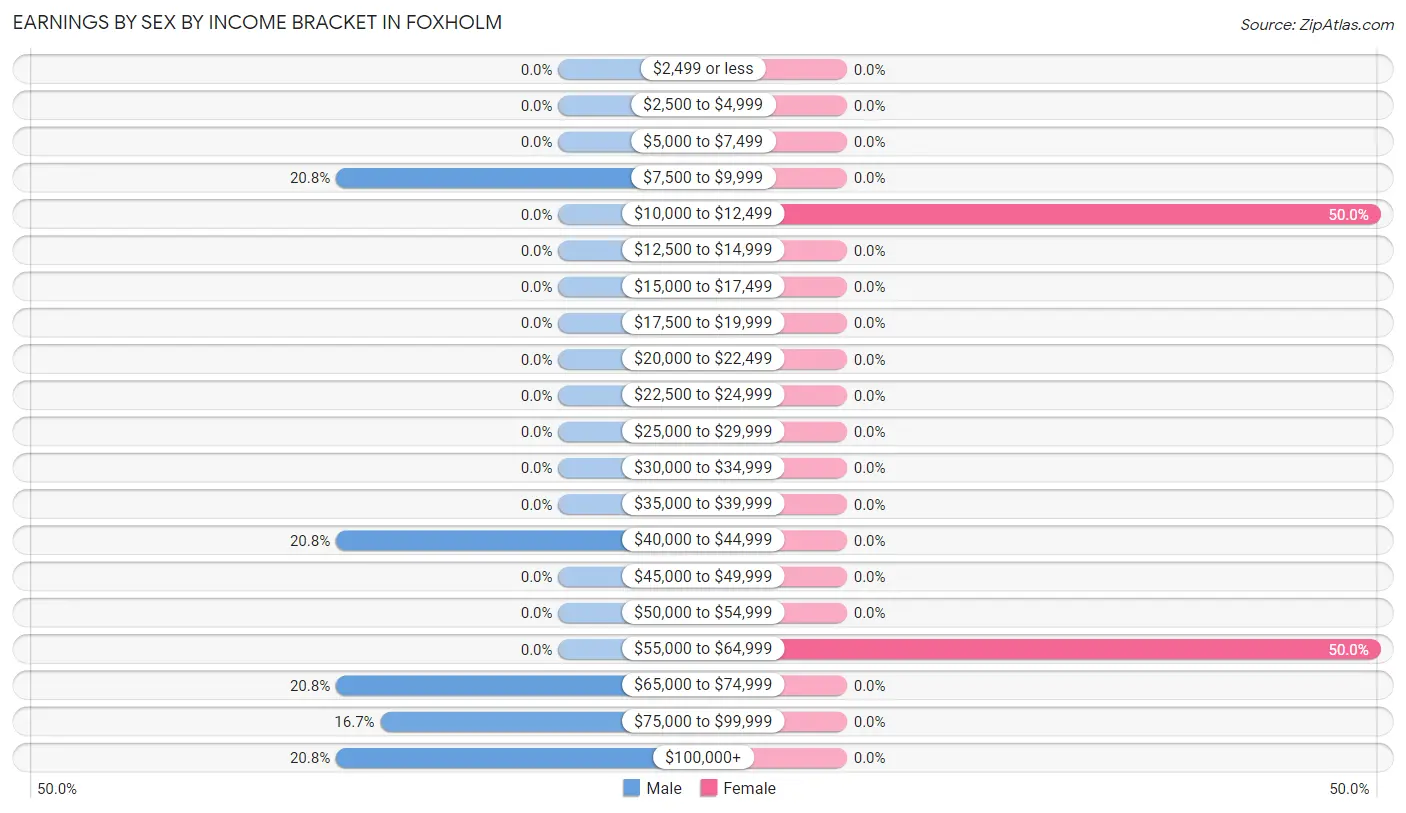
| Income | Male | Female |
| $2,499 or less | 0 (0.0%) | 0 (0.0%) |
| $2,500 to $4,999 | 0 (0.0%) | 0 (0.0%) |
| $5,000 to $7,499 | 0 (0.0%) | 0 (0.0%) |
| $7,500 to $9,999 | 5 (20.8%) | 0 (0.0%) |
| $10,000 to $12,499 | 0 (0.0%) | 5 (50.0%) |
| $12,500 to $14,999 | 0 (0.0%) | 0 (0.0%) |
| $15,000 to $17,499 | 0 (0.0%) | 0 (0.0%) |
| $17,500 to $19,999 | 0 (0.0%) | 0 (0.0%) |
| $20,000 to $22,499 | 0 (0.0%) | 0 (0.0%) |
| $22,500 to $24,999 | 0 (0.0%) | 0 (0.0%) |
| $25,000 to $29,999 | 0 (0.0%) | 0 (0.0%) |
| $30,000 to $34,999 | 0 (0.0%) | 0 (0.0%) |
| $35,000 to $39,999 | 0 (0.0%) | 0 (0.0%) |
| $40,000 to $44,999 | 5 (20.8%) | 0 (0.0%) |
| $45,000 to $49,999 | 0 (0.0%) | 0 (0.0%) |
| $50,000 to $54,999 | 0 (0.0%) | 0 (0.0%) |
| $55,000 to $64,999 | 0 (0.0%) | 5 (50.0%) |
| $65,000 to $74,999 | 5 (20.8%) | 0 (0.0%) |
| $75,000 to $99,999 | 4 (16.7%) | 0 (0.0%) |
| $100,000+ | 5 (20.8%) | 0 (0.0%) |
| Total | 24 (100.0%) | 10 (100.0%) |
Earnings by Sex by Educational Attainment in Foxholm
| Educational Attainment | Male Income | Female Income |
| Less than High School | - | - |
| High School Diploma | - | - |
| College or Associate's Degree | - | - |
| Bachelor's Degree | - | - |
| Graduate Degree | - | - |
| Total | - | - |
Family Income in Foxholm
Family Income Brackets in Foxholm
According to the Foxholm family income data, there are 10 families falling into the $100,000 to $149,999 income range, which is the most common income bracket and makes up 66.7% of all families.
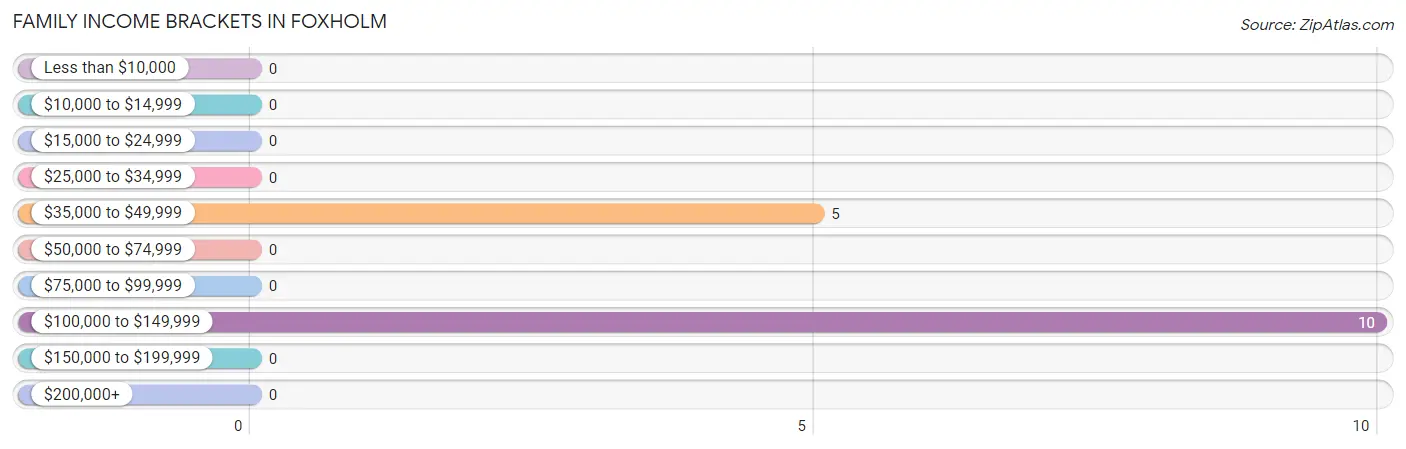
| Income Bracket | # Families | % Families |
| Less than $10,000 | 0 | 0.0% |
| $10,000 to $14,999 | 0 | 0.0% |
| $15,000 to $24,999 | 0 | 0.0% |
| $25,000 to $34,999 | 0 | 0.0% |
| $35,000 to $49,999 | 5 | 33.3% |
| $50,000 to $74,999 | 0 | 0.0% |
| $75,000 to $99,999 | 0 | 0.0% |
| $100,000 to $149,999 | 10 | 66.7% |
| $150,000 to $199,999 | 0 | 0.0% |
| $200,000+ | 0 | 0.0% |
Family Income by Famaliy Size in Foxholm
| Income Bracket | # Families | Median Income |
| 2-Person Families | 5 (33.3%) | $0 |
| 3-Person Families | 0 (0.0%) | $0 |
| 4-Person Families | 0 (0.0%) | $0 |
| 5-Person Families | 10 (66.7%) | $0 |
| 6-Person Families | 0 (0.0%) | $0 |
| 7+ Person Families | 0 (0.0%) | $0 |
| Total | 15 (100.0%) | $103,750 |
Family Income by Number of Earners in Foxholm
| Number of Earners | # Families | Median Income |
| No Earners | 0 (0.0%) | $0 |
| 1 Earner | 5 (33.3%) | $0 |
| 2 Earners | 5 (33.3%) | $0 |
| 3+ Earners | 5 (33.3%) | $0 |
| Total | 15 (100.0%) | $103,750 |
Household Income in Foxholm
Household Income Brackets in Foxholm
With 10 households falling in the category, the $100,000 to $149,999 income range is the most frequent in Foxholm, accounting for 50.0% of all households.
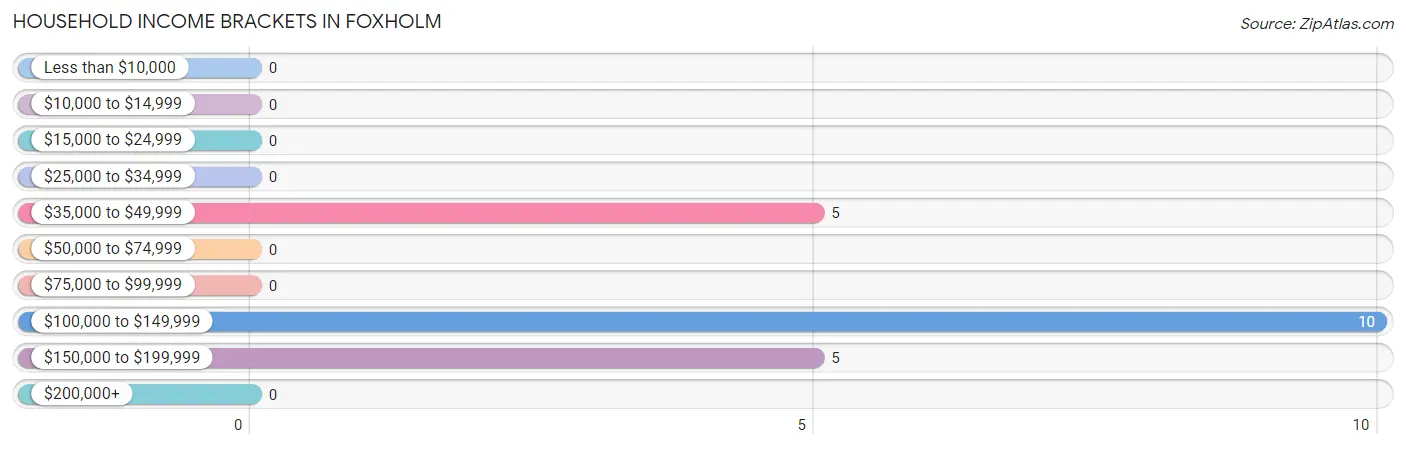
| Income Bracket | # Households | % Households |
| Less than $10,000 | 0 | 0.0% |
| $10,000 to $14,999 | 0 | 0.0% |
| $15,000 to $24,999 | 0 | 0.0% |
| $25,000 to $34,999 | 0 | 0.0% |
| $35,000 to $49,999 | 5 | 25.0% |
| $50,000 to $74,999 | 0 | 0.0% |
| $75,000 to $99,999 | 0 | 0.0% |
| $100,000 to $149,999 | 10 | 50.0% |
| $150,000 to $199,999 | 5 | 25.0% |
| $200,000+ | 0 | 0.0% |
Household Income by Householder Age in Foxholm
| Income Bracket | # Households | Median Income |
| 15 to 24 Years | 0 (0.0%) | $0 |
| 25 to 44 Years | 10 (50.0%) | $0 |
| 45 to 64 Years | 10 (50.0%) | $0 |
| 65+ Years | 0 (0.0%) | $0 |
| Total | 20 (100.0%) | $121,250 |
Poverty in Foxholm
Income Below Poverty by Sex and Age in Foxholm
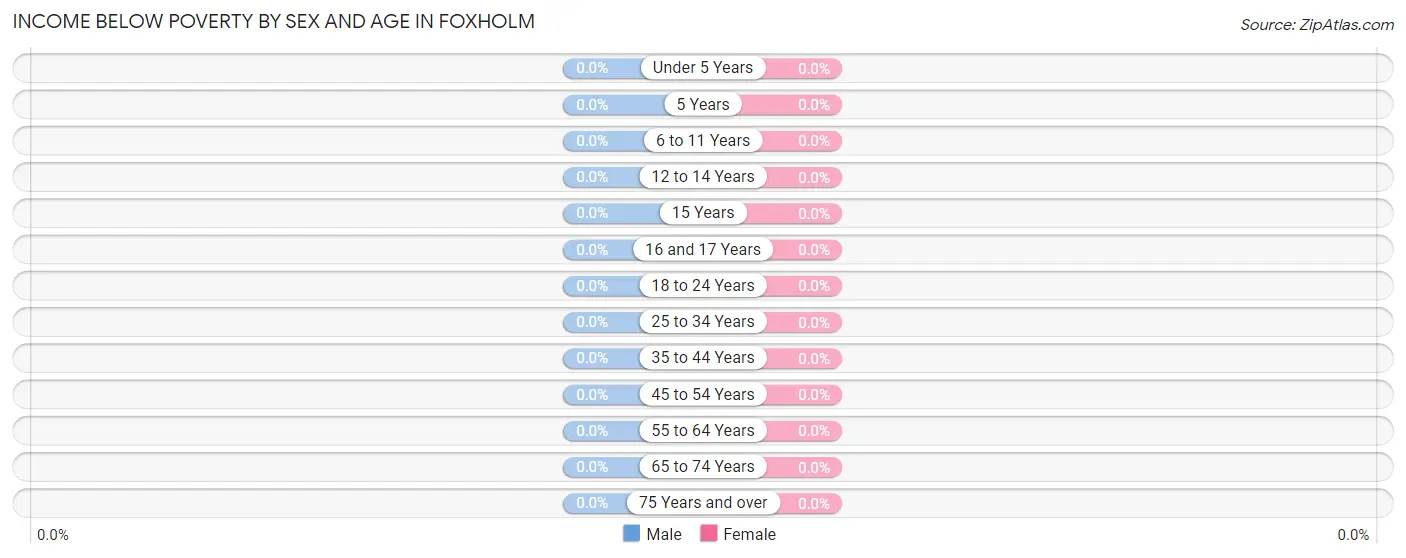
| Age Bracket | Male | Female |
| Under 5 Years | 0 (0.0%) | 0 (0.0%) |
| 5 Years | 0 (0.0%) | 0 (0.0%) |
| 6 to 11 Years | 0 (0.0%) | 0 (0.0%) |
| 12 to 14 Years | 0 (0.0%) | 0 (0.0%) |
| 15 Years | 0 (0.0%) | 0 (0.0%) |
| 16 and 17 Years | 0 (0.0%) | 0 (0.0%) |
| 18 to 24 Years | 0 (0.0%) | 0 (0.0%) |
| 25 to 34 Years | 0 (0.0%) | 0 (0.0%) |
| 35 to 44 Years | 0 (0.0%) | 0 (0.0%) |
| 45 to 54 Years | 0 (0.0%) | 0 (0.0%) |
| 55 to 64 Years | 0 (0.0%) | 0 (0.0%) |
| 65 to 74 Years | 0 (0.0%) | 0 (0.0%) |
| 75 Years and over | 0 (0.0%) | 0 (0.0%) |
| Total | 0 (0.0%) | 0 (0.0%) |
Income Above Poverty by Sex and Age in Foxholm
According to the poverty statistics in Foxholm, males aged under 5 years and females aged under 5 years are the age groups that are most secure financially, with 100.0% of males and 100.0% of females in these age groups living above the poverty line.
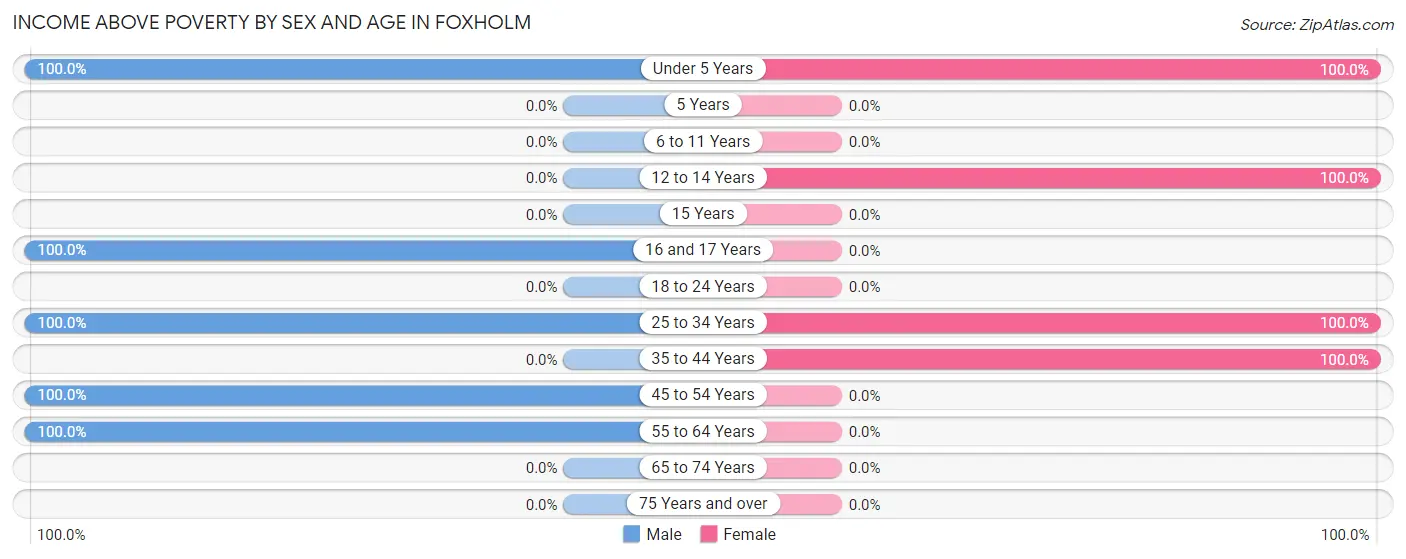
| Age Bracket | Male | Female |
| Under 5 Years | 6 (100.0%) | 8 (100.0%) |
| 5 Years | 0 (0.0%) | 0 (0.0%) |
| 6 to 11 Years | 0 (0.0%) | 0 (0.0%) |
| 12 to 14 Years | 0 (0.0%) | 15 (100.0%) |
| 15 Years | 0 (0.0%) | 0 (0.0%) |
| 16 and 17 Years | 5 (100.0%) | 0 (0.0%) |
| 18 to 24 Years | 0 (0.0%) | 0 (0.0%) |
| 25 to 34 Years | 4 (100.0%) | 5 (100.0%) |
| 35 to 44 Years | 0 (0.0%) | 5 (100.0%) |
| 45 to 54 Years | 10 (100.0%) | 0 (0.0%) |
| 55 to 64 Years | 5 (100.0%) | 0 (0.0%) |
| 65 to 74 Years | 0 (0.0%) | 0 (0.0%) |
| 75 Years and over | 0 (0.0%) | 0 (0.0%) |
| Total | 30 (100.0%) | 33 (100.0%) |
Income Below Poverty Among Married-Couple Families in Foxholm
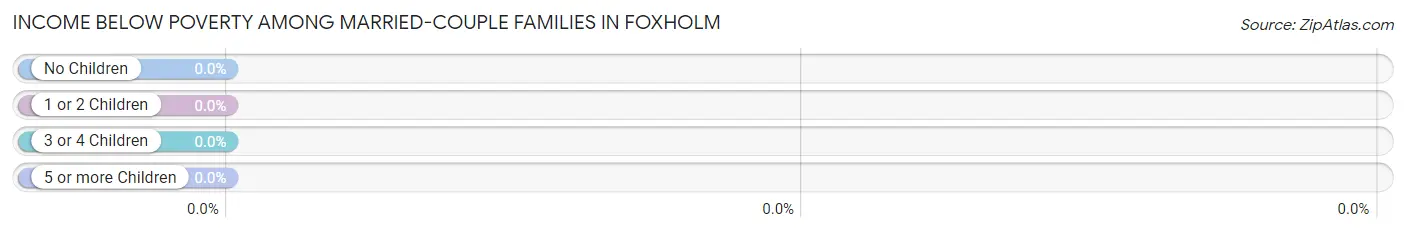
| Children | Above Poverty | Below Poverty |
| No Children | 0 (0.0%) | 0 (0.0%) |
| 1 or 2 Children | 0 (0.0%) | 0 (0.0%) |
| 3 or 4 Children | 10 (100.0%) | 0 (0.0%) |
| 5 or more Children | 0 (0.0%) | 0 (0.0%) |
| Total | 10 (100.0%) | 0 (0.0%) |
Income Below Poverty Among Single-Parent Households in Foxholm
| Children | Single Father | Single Mother |
| No Children | 0 (0.0%) | 0 (0.0%) |
| 1 or 2 Children | 0 (0.0%) | 0 (0.0%) |
| 3 or 4 Children | 0 (0.0%) | 0 (0.0%) |
| 5 or more Children | 0 (0.0%) | 0 (0.0%) |
| Total | 0 (0.0%) | 0 (0.0%) |
Income Below Poverty Among Married-Couple vs Single-Parent Households in Foxholm
| Children | Married-Couple Families | Single-Parent Households |
| No Children | 0 (0.0%) | 0 (0.0%) |
| 1 or 2 Children | 0 (0.0%) | 0 (0.0%) |
| 3 or 4 Children | 0 (0.0%) | 0 (0.0%) |
| 5 or more Children | 0 (0.0%) | 0 (0.0%) |
| Total | 0 (0.0%) | 0 (0.0%) |
Race in Foxholm
The most populous races in Foxholm are , and White / Caucasian (63 | 100.0%).
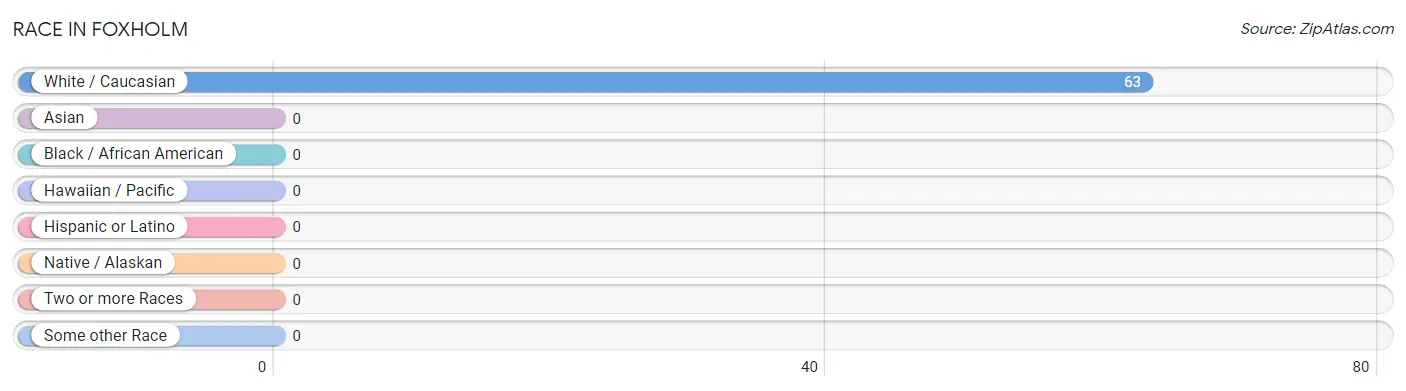
| Race | # Population | % Population |
| Asian | 0 | 0.0% |
| Black / African American | 0 | 0.0% |
| Hawaiian / Pacific | 0 | 0.0% |
| Hispanic or Latino | 0 | 0.0% |
| Native / Alaskan | 0 | 0.0% |
| White / Caucasian | 63 | 100.0% |
| Two or more Races | 0 | 0.0% |
| Some other Race | 0 | 0.0% |
| Total | 63 | 100.0% |
Ancestry in Foxholm
The most populous ancestries reported in Foxholm are American (49 | 77.8%), Norwegian (10 | 15.9%), and English (4 | 6.4%), together accounting for 100.0% of all Foxholm residents.
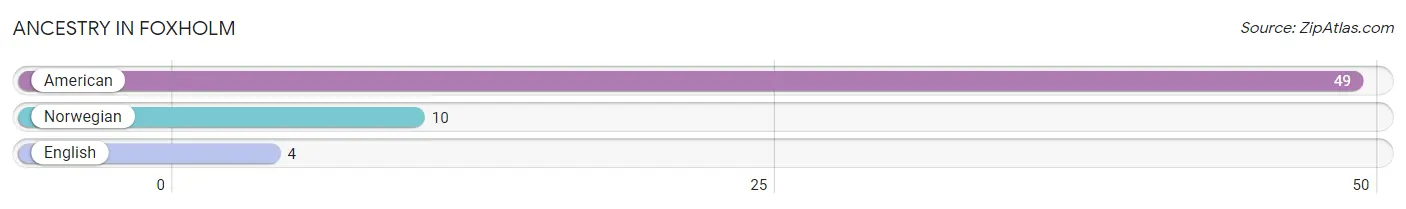
| Ancestry | # Population | % Population |
| American | 49 | 77.8% |
| English | 4 | 6.4% |
| Norwegian | 10 | 15.9% | View All 3 Rows |
Immigrants in Foxholm

| Immigration Origin | # Population | % Population | View All 0 Rows |
Sex and Age in Foxholm
Sex and Age in Foxholm
The most populous age groups in Foxholm are 45 to 49 Years (10 | 33.3%) for men and 10 to 14 Years (15 | 45.5%) for women.
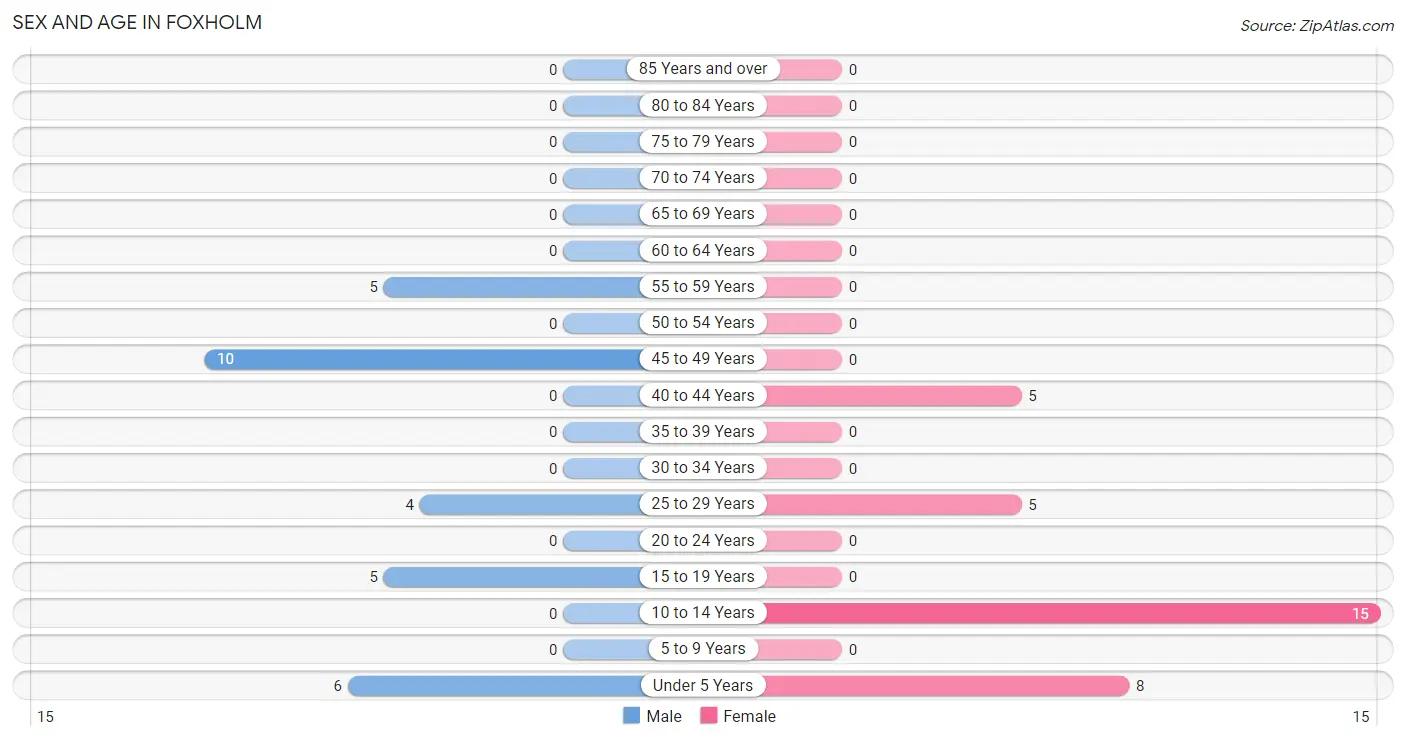
| Age Bracket | Male | Female |
| Under 5 Years | 6 (20.0%) | 8 (24.2%) |
| 5 to 9 Years | 0 (0.0%) | 0 (0.0%) |
| 10 to 14 Years | 0 (0.0%) | 15 (45.5%) |
| 15 to 19 Years | 5 (16.7%) | 0 (0.0%) |
| 20 to 24 Years | 0 (0.0%) | 0 (0.0%) |
| 25 to 29 Years | 4 (13.3%) | 5 (15.1%) |
| 30 to 34 Years | 0 (0.0%) | 0 (0.0%) |
| 35 to 39 Years | 0 (0.0%) | 0 (0.0%) |
| 40 to 44 Years | 0 (0.0%) | 5 (15.1%) |
| 45 to 49 Years | 10 (33.3%) | 0 (0.0%) |
| 50 to 54 Years | 0 (0.0%) | 0 (0.0%) |
| 55 to 59 Years | 5 (16.7%) | 0 (0.0%) |
| 60 to 64 Years | 0 (0.0%) | 0 (0.0%) |
| 65 to 69 Years | 0 (0.0%) | 0 (0.0%) |
| 70 to 74 Years | 0 (0.0%) | 0 (0.0%) |
| 75 to 79 Years | 0 (0.0%) | 0 (0.0%) |
| 80 to 84 Years | 0 (0.0%) | 0 (0.0%) |
| 85 Years and over | 0 (0.0%) | 0 (0.0%) |
| Total | 30 (100.0%) | 33 (100.0%) |
Families and Households in Foxholm
Median Family Size in Foxholm
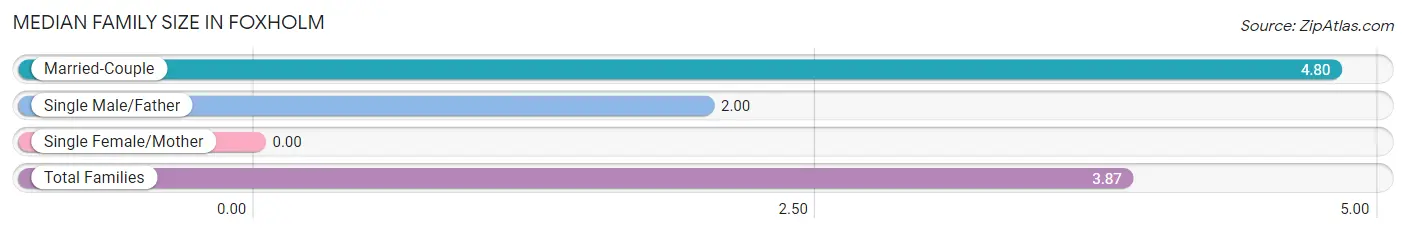
| Family Type | # Families | Family Size |
| Married-Couple | 10 (66.7%) | 4.80 |
| Single Male/Father | 5 (33.3%) | 2.00 |
| Single Female/Mother | 0 (0.0%) | - |
| Total Families | 15 (100.0%) | 3.87 |
Median Household Size in Foxholm
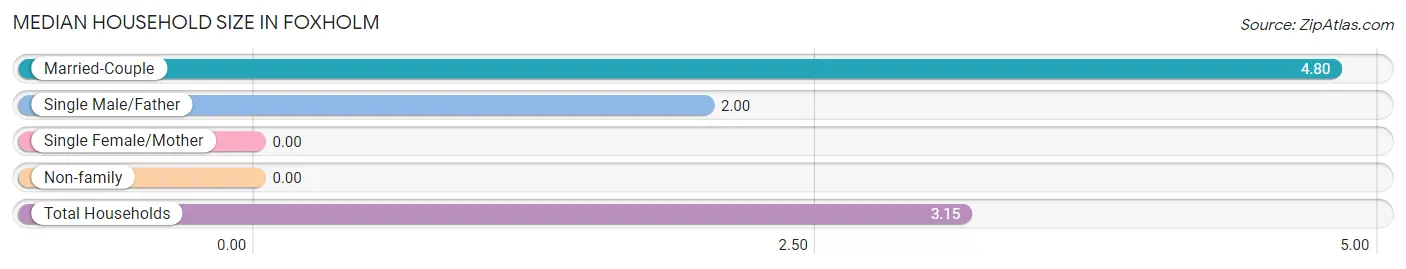
| Household Type | # Households | Household Size |
| Married-Couple | 10 (50.0%) | 4.80 |
| Single Male/Father | 5 (25.0%) | 2.00 |
| Single Female/Mother | 0 (0.0%) | - |
| Non-family | 5 (25.0%) | - |
| Total Households | 20 (100.0%) | 3.15 |
Household Size by Marriage Status in Foxholm
Out of a total of 20 households in Foxholm, 15 (75.0%) are family households, while 5 (25.0%) are nonfamily households. The most numerous type of family households are 5-person households, comprising 10, and the most common type of nonfamily households are 1-person households, comprising 5.
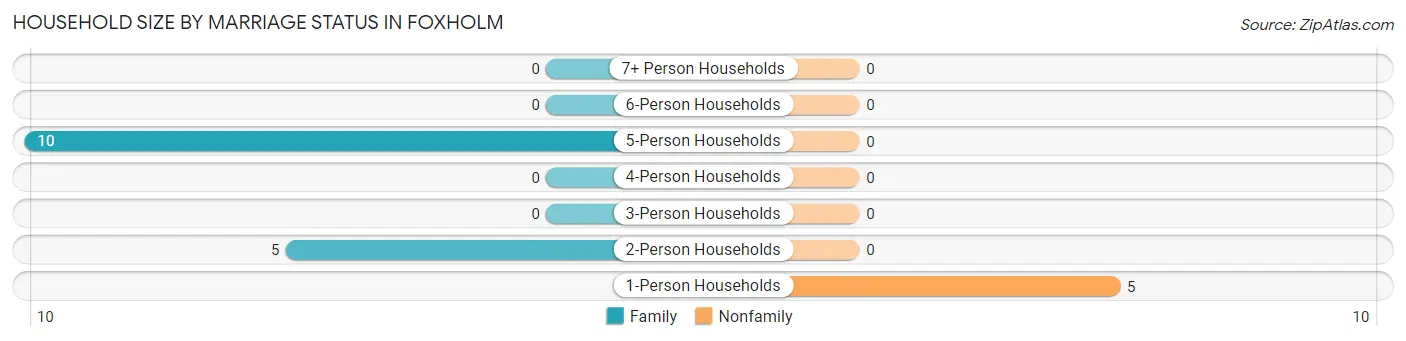
| Household Size | Family Households | Nonfamily Households |
| 1-Person Households | - | 5 (25.0%) |
| 2-Person Households | 5 (25.0%) | 0 (0.0%) |
| 3-Person Households | 0 (0.0%) | 0 (0.0%) |
| 4-Person Households | 0 (0.0%) | 0 (0.0%) |
| 5-Person Households | 10 (50.0%) | 0 (0.0%) |
| 6-Person Households | 0 (0.0%) | 0 (0.0%) |
| 7+ Person Households | 0 (0.0%) | 0 (0.0%) |
| Total | 15 (75.0%) | 5 (25.0%) |
Female Fertility in Foxholm
Fertility by Age in Foxholm
Average fertility rate in Foxholm is 500.0 births per 1,000 women. Women in the age bracket of 20 to 34 years have the highest fertility rate with 1,000.0 births per 1,000 women. Women in the age bracket of 20 to 34 years acount for 100.0% of all women with births.
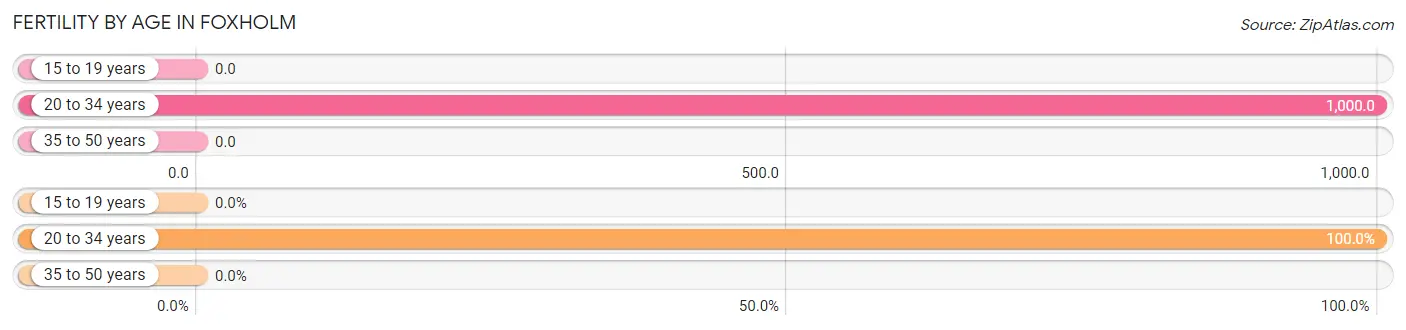
| Age Bracket | Women with Births | Births / 1,000 Women |
| 15 to 19 years | 0 (0.0%) | 0.0 |
| 20 to 34 years | 5 (100.0%) | 1,000.0 |
| 35 to 50 years | 0 (0.0%) | 0.0 |
| Total | 5 (100.0%) | 500.0 |
Fertility by Age by Marriage Status in Foxholm
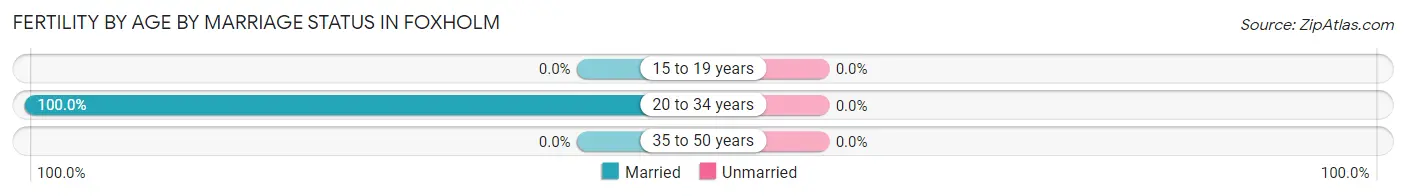
| Age Bracket | Married | Unmarried |
| 15 to 19 years | 0 (0.0%) | 0 (0.0%) |
| 20 to 34 years | 5 (100.0%) | 0 (0.0%) |
| 35 to 50 years | 0 (0.0%) | 0 (0.0%) |
| Total | 5 (100.0%) | 0 (0.0%) |
Fertility by Education in Foxholm
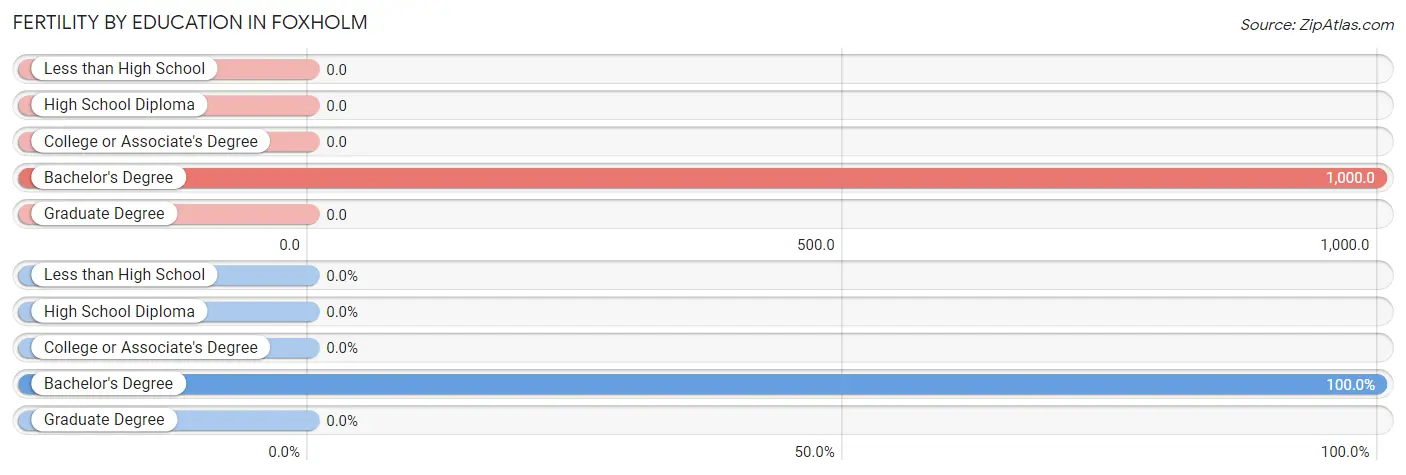
| Educational Attainment | Women with Births | Births / 1,000 Women |
| Less than High School | 0 (0.0%) | 0.0 |
| High School Diploma | 0 (0.0%) | 0.0 |
| College or Associate's Degree | 0 (0.0%) | 0.0 |
| Bachelor's Degree | 5 (100.0%) | 1,000.0 |
| Graduate Degree | 0 (0.0%) | 0.0 |
| Total | 5 (100.0%) | 500.0 |
Fertility by Education by Marriage Status in Foxholm
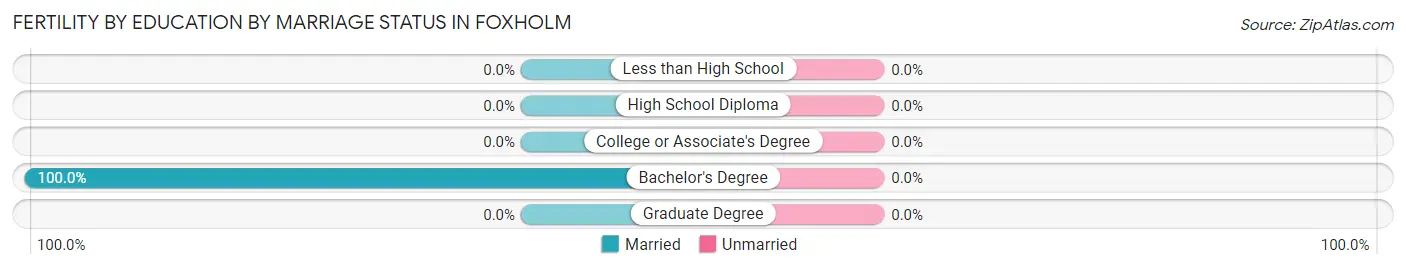
| Educational Attainment | Married | Unmarried |
| Less than High School | 0 (0.0%) | 0 (0.0%) |
| High School Diploma | 0 (0.0%) | 0 (0.0%) |
| College or Associate's Degree | 0 (0.0%) | 0 (0.0%) |
| Bachelor's Degree | 5 (100.0%) | 0 (0.0%) |
| Graduate Degree | 0 (0.0%) | 0 (0.0%) |
| Total | 5 (100.0%) | 0 (0.0%) |
Employment Characteristics in Foxholm
Employment by Class of Employer in Foxholm
Among the 29 employed individuals in Foxholm, self-employed (not incorporated) (10 | 34.5%), not-for-profit organizations (5 | 17.2%), and state government employees (5 | 17.2%) make up the most common classes of employment.
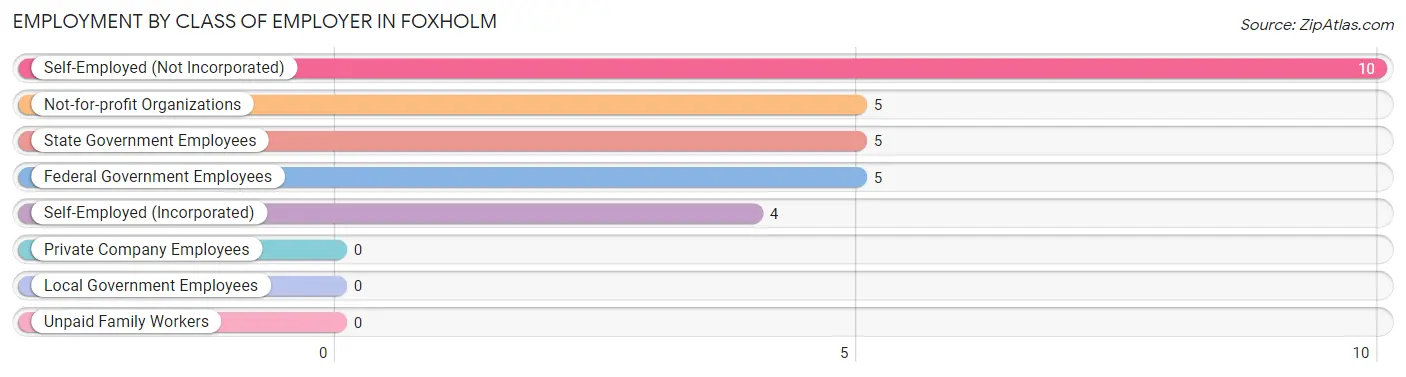
| Employer Class | # Employees | % Employees |
| Private Company Employees | 0 | 0.0% |
| Self-Employed (Incorporated) | 4 | 13.8% |
| Self-Employed (Not Incorporated) | 10 | 34.5% |
| Not-for-profit Organizations | 5 | 17.2% |
| Local Government Employees | 0 | 0.0% |
| State Government Employees | 5 | 17.2% |
| Federal Government Employees | 5 | 17.2% |
| Unpaid Family Workers | 0 | 0.0% |
| Total | 29 | 100.0% |
Employment Status by Age in Foxholm
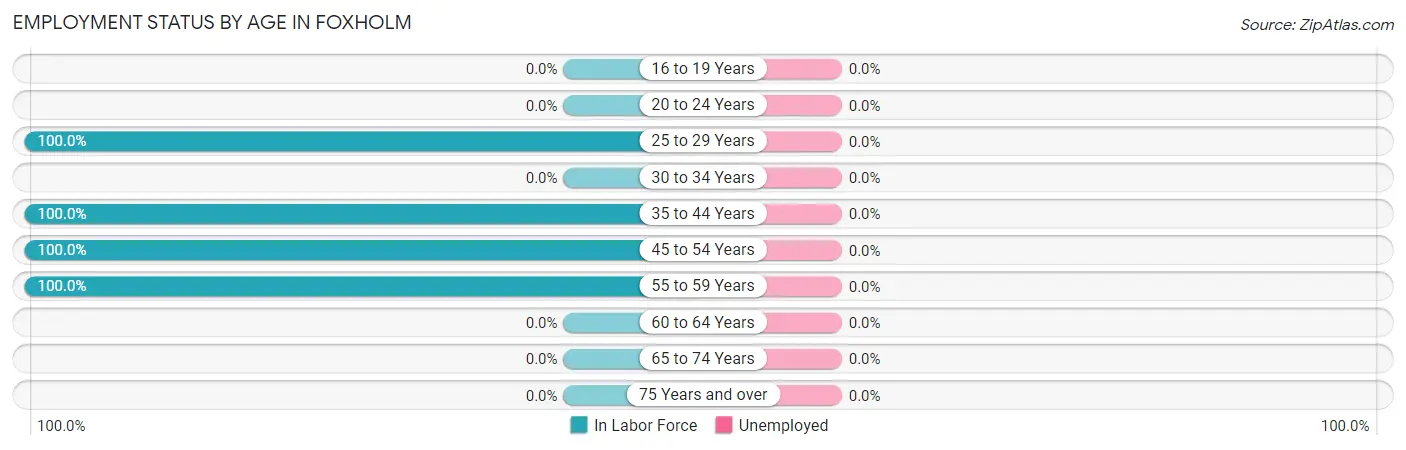
| Age Bracket | In Labor Force | Unemployed |
| 16 to 19 Years | 0 (0.0%) | 0 (0.0%) |
| 20 to 24 Years | 0 (0.0%) | 0 (0.0%) |
| 25 to 29 Years | 9 (100.0%) | 0 (0.0%) |
| 30 to 34 Years | 0 (0.0%) | 0 (0.0%) |
| 35 to 44 Years | 5 (100.0%) | 0 (0.0%) |
| 45 to 54 Years | 10 (100.0%) | 0 (0.0%) |
| 55 to 59 Years | 5 (100.0%) | 0 (0.0%) |
| 60 to 64 Years | 0 (0.0%) | 0 (0.0%) |
| 65 to 74 Years | 0 (0.0%) | 0 (0.0%) |
| 75 Years and over | 0 (0.0%) | 0 (0.0%) |
| Total | 29 (85.3%) | 0 (0.0%) |
Employment Status by Educational Attainment in Foxholm
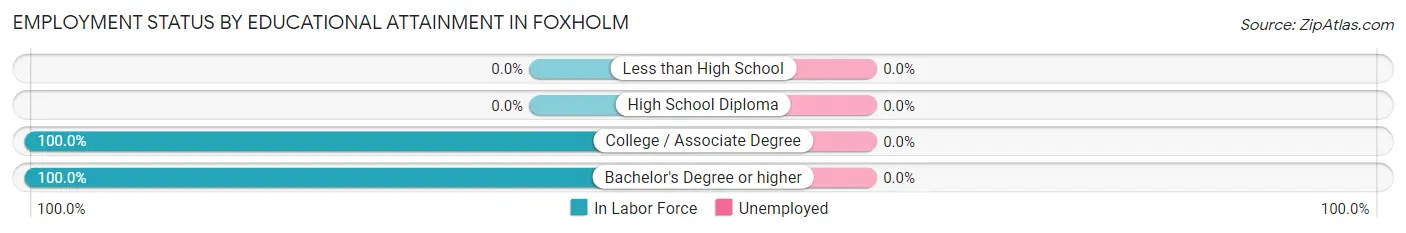
| Educational Attainment | In Labor Force | Unemployed |
| Less than High School | 0 (0.0%) | 0 (0.0%) |
| High School Diploma | 0 (0.0%) | 0 (0.0%) |
| College / Associate Degree | 15 (100.0%) | 0 (0.0%) |
| Bachelor's Degree or higher | 14 (100.0%) | 0 (0.0%) |
| Total | 29 (100.0%) | 0 (0.0%) |
Employment Occupations by Sex in Foxholm
Management, Business, Science and Arts Occupations
The most common Management, Business, Science and Arts occupations in Foxholm are Community & Social Service (15 | 51.7%), Education, Arts & Media (5 | 17.2%), Education Instruction & Library (5 | 17.2%), and Arts, Media & Entertainment (5 | 17.2%).
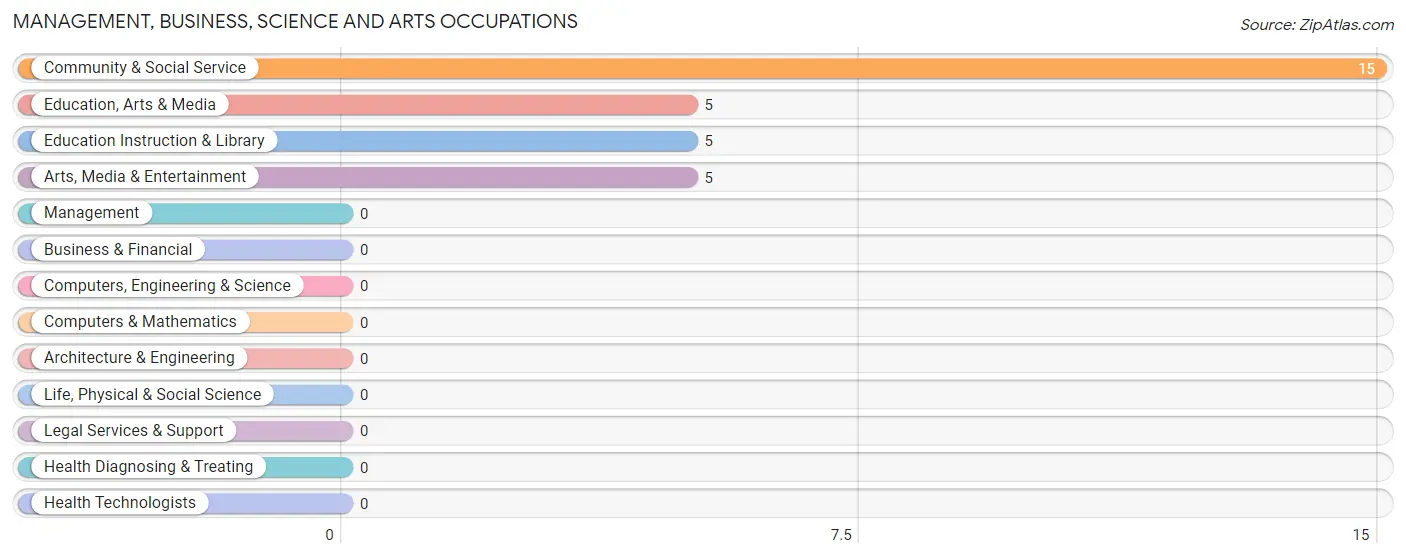
Management, Business, Science and Arts Occupations by Sex
Within the Management, Business, Science and Arts occupations in Foxholm, the most male-oriented occupations are Arts, Media & Entertainment (100.0%), and Community & Social Service (33.3%), while the most female-oriented occupations are Education, Arts & Media (100.0%), Education Instruction & Library (100.0%), and Community & Social Service (66.7%).
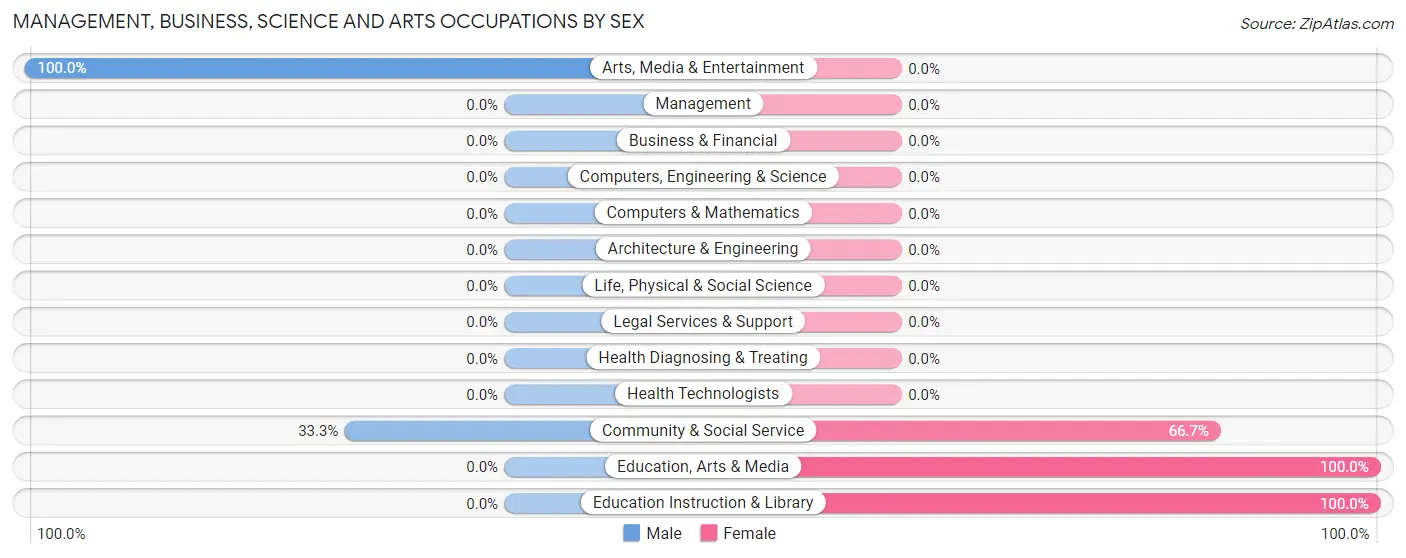
| Occupation | Male | Female |
| Management | 0 (0.0%) | 0 (0.0%) |
| Business & Financial | 0 (0.0%) | 0 (0.0%) |
| Computers, Engineering & Science | 0 (0.0%) | 0 (0.0%) |
| Computers & Mathematics | 0 (0.0%) | 0 (0.0%) |
| Architecture & Engineering | 0 (0.0%) | 0 (0.0%) |
| Life, Physical & Social Science | 0 (0.0%) | 0 (0.0%) |
| Community & Social Service | 5 (33.3%) | 10 (66.7%) |
| Education, Arts & Media | 0 (0.0%) | 5 (100.0%) |
| Legal Services & Support | 0 (0.0%) | 0 (0.0%) |
| Education Instruction & Library | 0 (0.0%) | 5 (100.0%) |
| Arts, Media & Entertainment | 5 (100.0%) | 0 (0.0%) |
| Health Diagnosing & Treating | 0 (0.0%) | 0 (0.0%) |
| Health Technologists | 0 (0.0%) | 0 (0.0%) |
| Total (Category) | 5 (33.3%) | 10 (66.7%) |
| Total (Overall) | 19 (65.5%) | 10 (34.5%) |
Services Occupations
Services Occupations by Sex
| Occupation | Male | Female |
| Healthcare Support | 0 (0.0%) | 0 (0.0%) |
| Security & Protection | 0 (0.0%) | 0 (0.0%) |
| Firefighting & Prevention | 0 (0.0%) | 0 (0.0%) |
| Law Enforcement | 0 (0.0%) | 0 (0.0%) |
| Food Preparation & Serving | 0 (0.0%) | 0 (0.0%) |
| Cleaning & Maintenance | 0 (0.0%) | 0 (0.0%) |
| Personal Care & Service | 0 (0.0%) | 0 (0.0%) |
| Total (Category) | 0 (0.0%) | 0 (0.0%) |
| Total (Overall) | 19 (65.5%) | 10 (34.5%) |
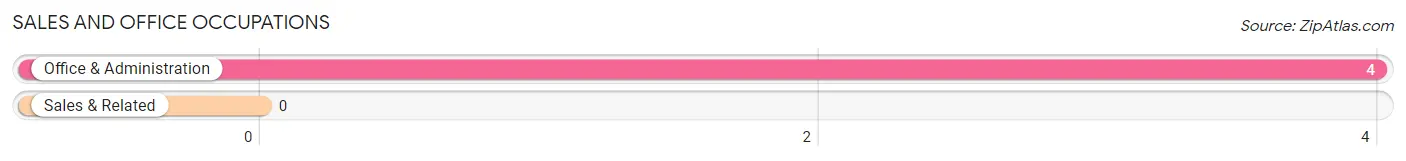
Sales and Office Occupations
The most common Sales and Office occupations in Foxholm are , and Office & Administration (4 | 13.8%).
Sales and Office Occupations by Sex
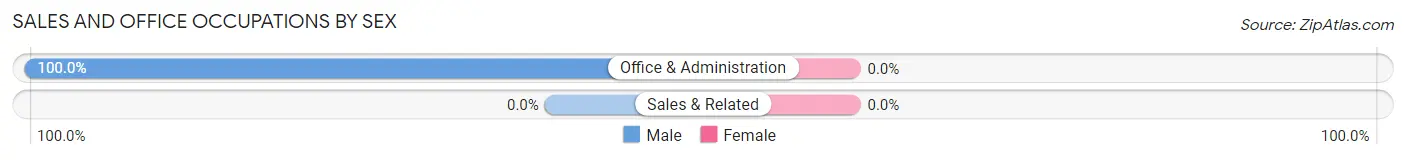
| Occupation | Male | Female |
| Sales & Related | 0 (0.0%) | 0 (0.0%) |
| Office & Administration | 4 (100.0%) | 0 (0.0%) |
| Total (Category) | 4 (100.0%) | 0 (0.0%) |
| Total (Overall) | 19 (65.5%) | 10 (34.5%) |
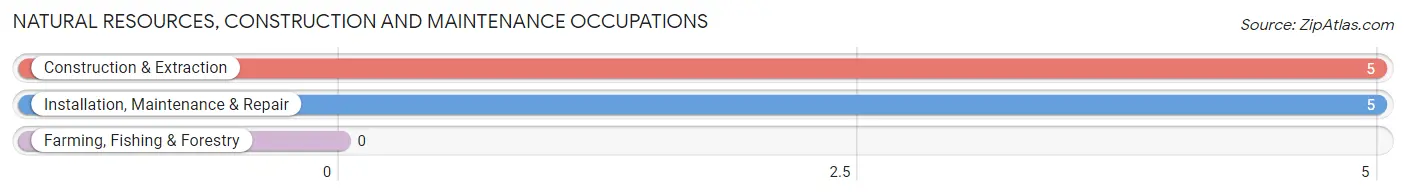
Natural Resources, Construction and Maintenance Occupations
The most common Natural Resources, Construction and Maintenance occupations in Foxholm are Construction & Extraction (5 | 17.2%), and Installation, Maintenance & Repair (5 | 17.2%).
Natural Resources, Construction and Maintenance Occupations by Sex
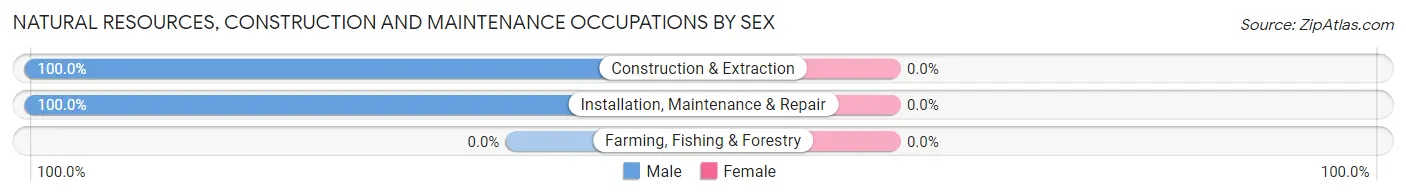
| Occupation | Male | Female |
| Farming, Fishing & Forestry | 0 (0.0%) | 0 (0.0%) |
| Construction & Extraction | 5 (100.0%) | 0 (0.0%) |
| Installation, Maintenance & Repair | 5 (100.0%) | 0 (0.0%) |
| Total (Category) | 10 (100.0%) | 0 (0.0%) |
| Total (Overall) | 19 (65.5%) | 10 (34.5%) |
Production, Transportation and Moving Occupations
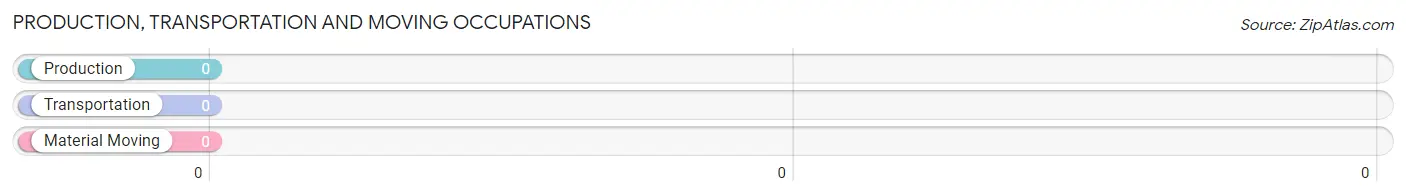
Production, Transportation and Moving Occupations by Sex
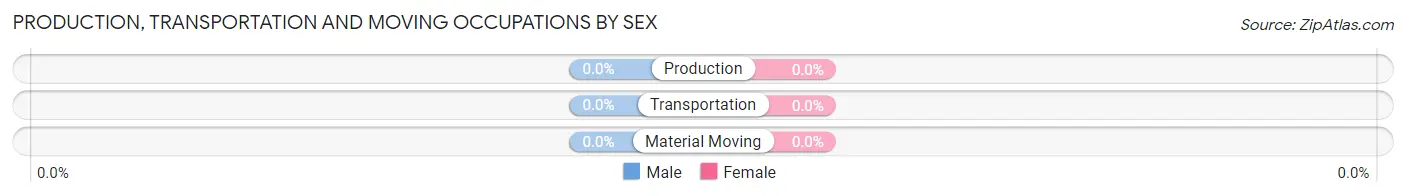
| Occupation | Male | Female |
| Production | 0 (0.0%) | 0 (0.0%) |
| Transportation | 0 (0.0%) | 0 (0.0%) |
| Material Moving | 0 (0.0%) | 0 (0.0%) |
| Total (Category) | 0 (0.0%) | 0 (0.0%) |
| Total (Overall) | 19 (65.5%) | 10 (34.5%) |
Employment Industries by Sex in Foxholm
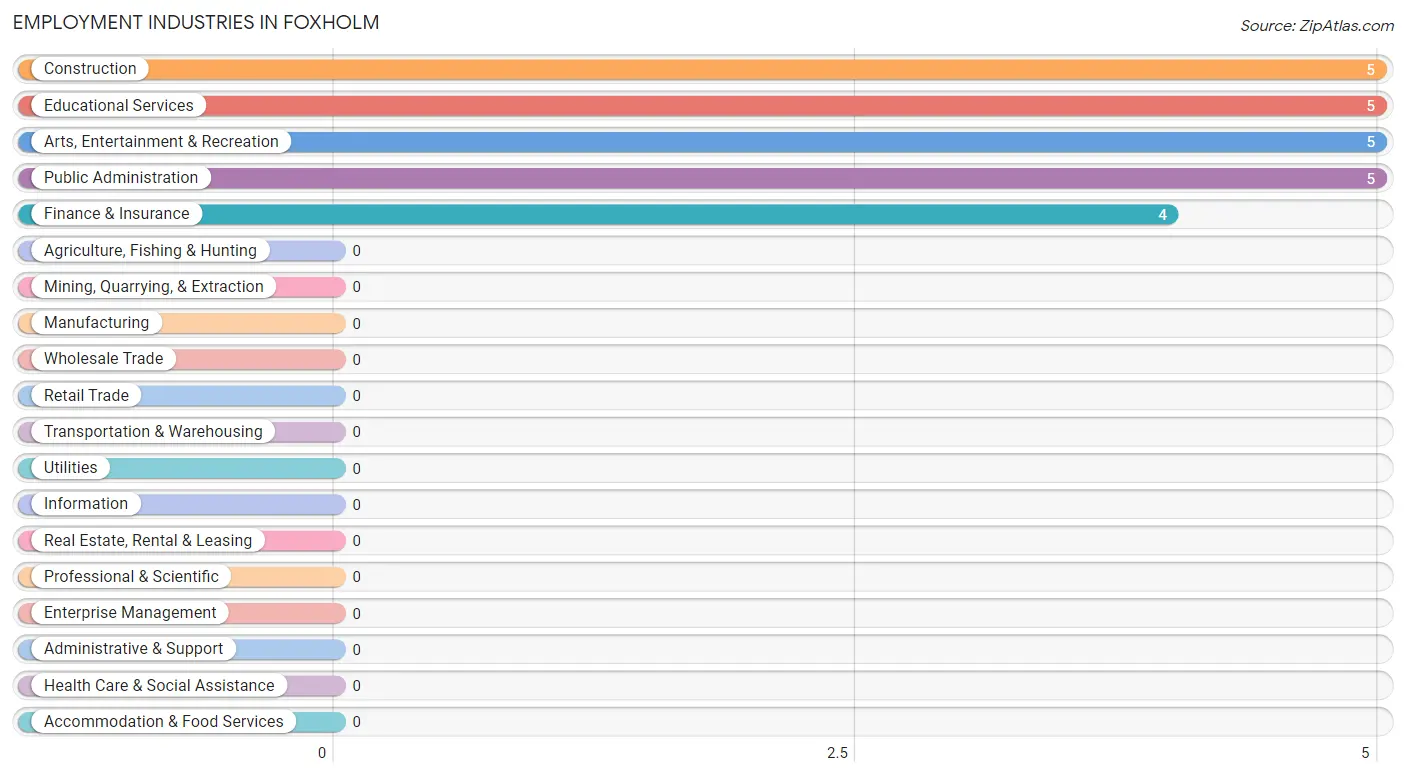
Employment Industries in Foxholm
The major employment industries in Foxholm include Construction (5 | 17.2%), Educational Services (5 | 17.2%), Arts, Entertainment & Recreation (5 | 17.2%), Public Administration (5 | 17.2%), and Finance & Insurance (4 | 13.8%).
Employment Industries by Sex in Foxholm
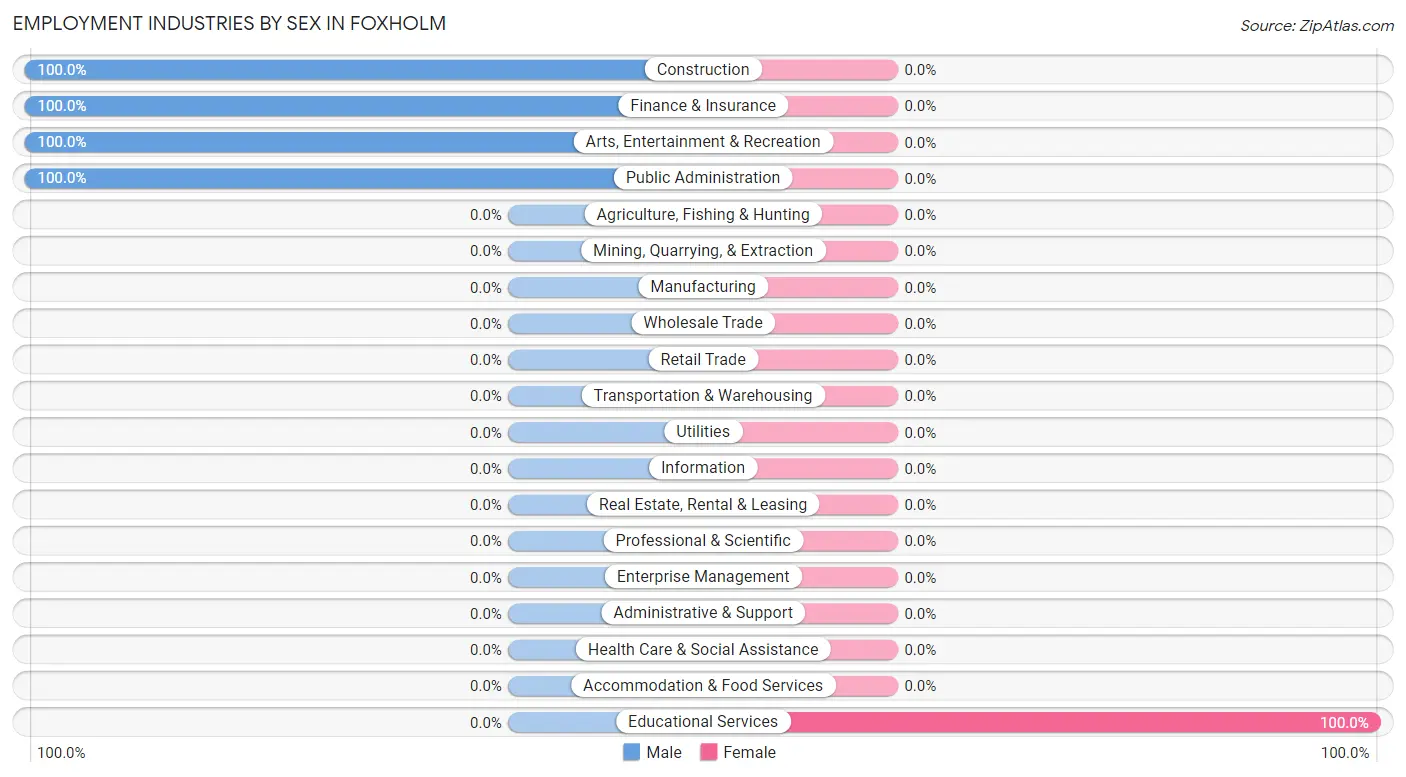
| Industry | Male | Female |
| Agriculture, Fishing & Hunting | 0 (0.0%) | 0 (0.0%) |
| Mining, Quarrying, & Extraction | 0 (0.0%) | 0 (0.0%) |
| Construction | 5 (100.0%) | 0 (0.0%) |
| Manufacturing | 0 (0.0%) | 0 (0.0%) |
| Wholesale Trade | 0 (0.0%) | 0 (0.0%) |
| Retail Trade | 0 (0.0%) | 0 (0.0%) |
| Transportation & Warehousing | 0 (0.0%) | 0 (0.0%) |
| Utilities | 0 (0.0%) | 0 (0.0%) |
| Information | 0 (0.0%) | 0 (0.0%) |
| Finance & Insurance | 4 (100.0%) | 0 (0.0%) |
| Real Estate, Rental & Leasing | 0 (0.0%) | 0 (0.0%) |
| Professional & Scientific | 0 (0.0%) | 0 (0.0%) |
| Enterprise Management | 0 (0.0%) | 0 (0.0%) |
| Administrative & Support | 0 (0.0%) | 0 (0.0%) |
| Educational Services | 0 (0.0%) | 5 (100.0%) |
| Health Care & Social Assistance | 0 (0.0%) | 0 (0.0%) |
| Arts, Entertainment & Recreation | 5 (100.0%) | 0 (0.0%) |
| Accommodation & Food Services | 0 (0.0%) | 0 (0.0%) |
| Public Administration | 5 (100.0%) | 0 (0.0%) |
| Total | 19 (65.5%) | 10 (34.5%) |
Education in Foxholm
School Enrollment in Foxholm
The most common levels of schooling among the 24 students in Foxholm are middle school (15 | 62.5%), high school (5 | 20.8%), and nursery / preschool (4 | 16.7%).
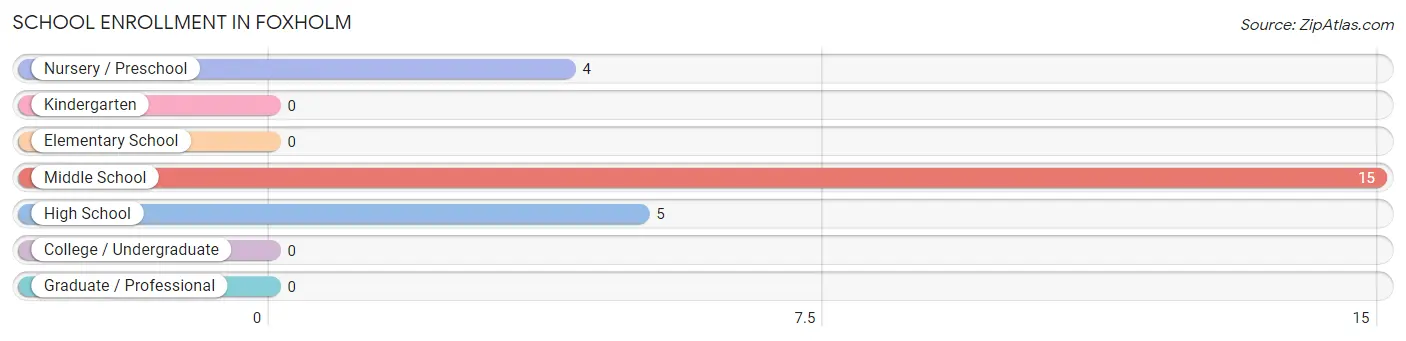
| School Level | # Students | % Students |
| Nursery / Preschool | 4 | 16.7% |
| Kindergarten | 0 | 0.0% |
| Elementary School | 0 | 0.0% |
| Middle School | 15 | 62.5% |
| High School | 5 | 20.8% |
| College / Undergraduate | 0 | 0.0% |
| Graduate / Professional | 0 | 0.0% |
| Total | 24 | 100.0% |
School Enrollment by Age by Funding Source in Foxholm
Out of a total of 24 students who are enrolled in schools in Foxholm, 4 (16.7%) attend a private institution, while the remaining 20 (83.3%) are enrolled in public schools. The age group of 3 to 4 year olds has the highest likelihood of being enrolled in private schools, with 4 (100.0% in the age bracket) enrolled. Conversely, the age group of 10 to 14 year olds has the lowest likelihood of being enrolled in a private school, with 15 (100.0% in the age bracket) attending a public institution.
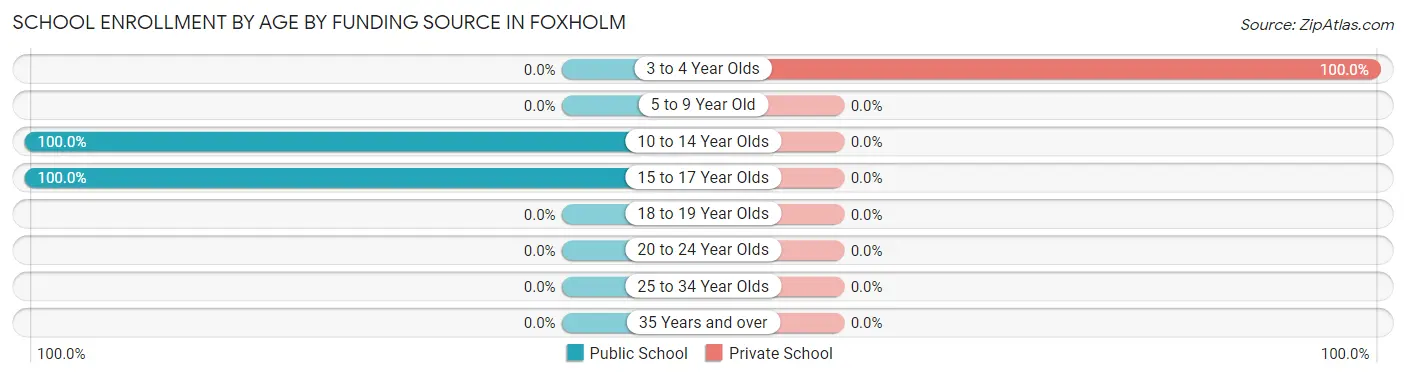
| Age Bracket | Public School | Private School |
| 3 to 4 Year Olds | 0 (0.0%) | 4 (100.0%) |
| 5 to 9 Year Old | 0 (0.0%) | 0 (0.0%) |
| 10 to 14 Year Olds | 15 (100.0%) | 0 (0.0%) |
| 15 to 17 Year Olds | 5 (100.0%) | 0 (0.0%) |
| 18 to 19 Year Olds | 0 (0.0%) | 0 (0.0%) |
| 20 to 24 Year Olds | 0 (0.0%) | 0 (0.0%) |
| 25 to 34 Year Olds | 0 (0.0%) | 0 (0.0%) |
| 35 Years and over | 0 (0.0%) | 0 (0.0%) |
| Total | 20 (83.3%) | 4 (16.7%) |
Educational Attainment by Field of Study in Foxholm
Education (5 | 35.7%), arts & humanities (5 | 35.7%), and business (4 | 28.6%) are the most common fields of study among 14 individuals in Foxholm who have obtained a bachelor's degree or higher.
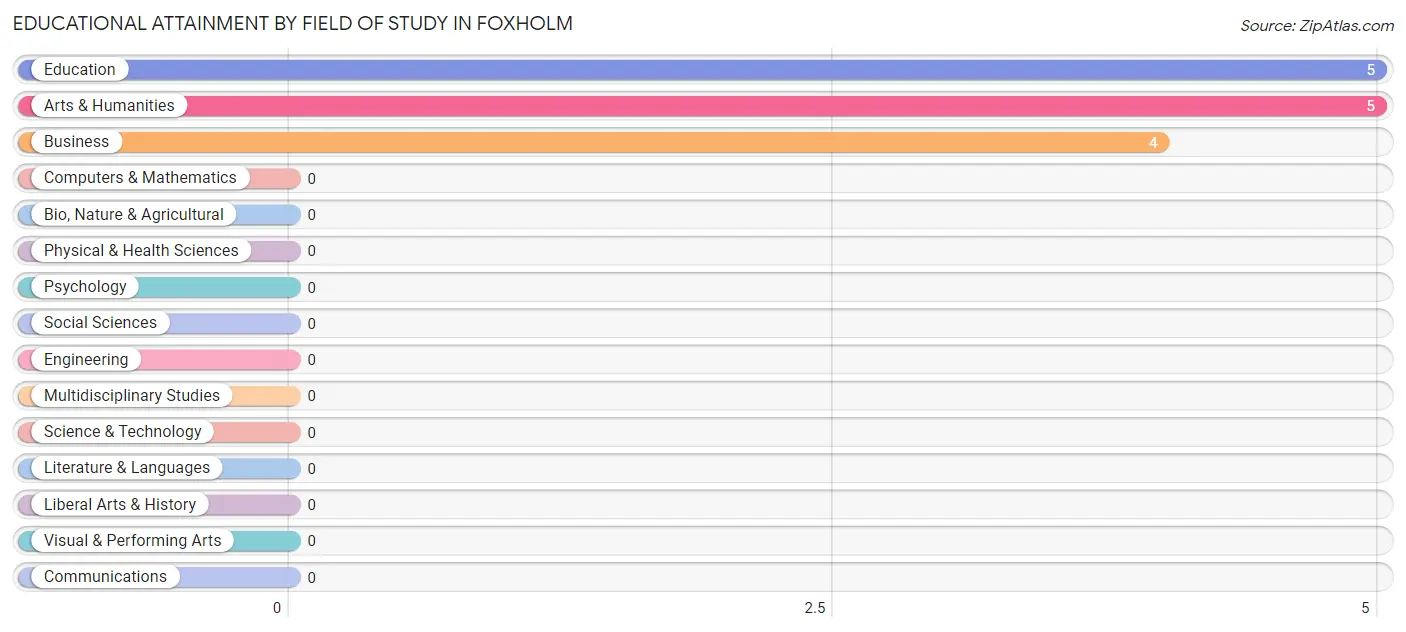
| Field of Study | # Graduates | % Graduates |
| Computers & Mathematics | 0 | 0.0% |
| Bio, Nature & Agricultural | 0 | 0.0% |
| Physical & Health Sciences | 0 | 0.0% |
| Psychology | 0 | 0.0% |
| Social Sciences | 0 | 0.0% |
| Engineering | 0 | 0.0% |
| Multidisciplinary Studies | 0 | 0.0% |
| Science & Technology | 0 | 0.0% |
| Business | 4 | 28.6% |
| Education | 5 | 35.7% |
| Literature & Languages | 0 | 0.0% |
| Liberal Arts & History | 0 | 0.0% |
| Visual & Performing Arts | 0 | 0.0% |
| Communications | 0 | 0.0% |
| Arts & Humanities | 5 | 35.7% |
| Total | 14 | 100.0% |
Transportation & Commute in Foxholm
Vehicle Availability by Sex in Foxholm
The most prevalent vehicle ownership categories in Foxholm are males with 2 vehicles (9, accounting for 47.4%) and females with 2 vehicles (5, making up 90.0%).
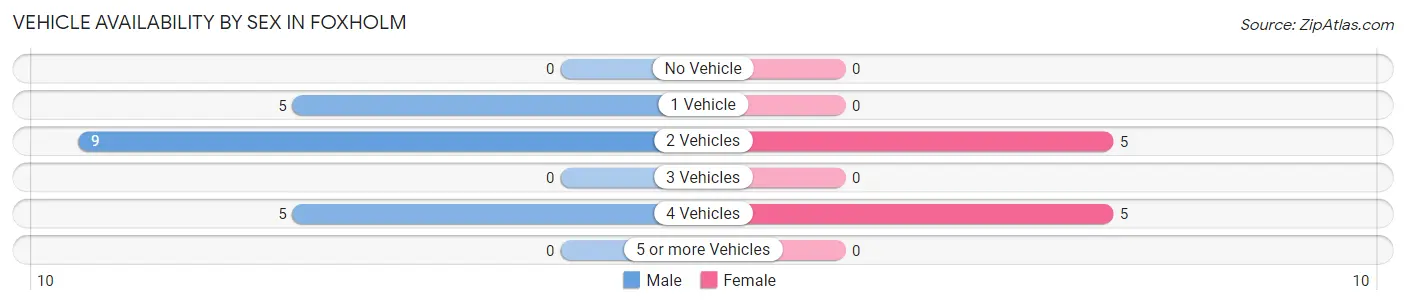
| Vehicles Available | Male | Female |
| No Vehicle | 0 (0.0%) | 0 (0.0%) |
| 1 Vehicle | 5 (26.3%) | 0 (0.0%) |
| 2 Vehicles | 9 (47.4%) | 5 (50.0%) |
| 3 Vehicles | 0 (0.0%) | 0 (0.0%) |
| 4 Vehicles | 5 (26.3%) | 5 (50.0%) |
| 5 or more Vehicles | 0 (0.0%) | 0 (0.0%) |
| Total | 19 (100.0%) | 10 (100.0%) |
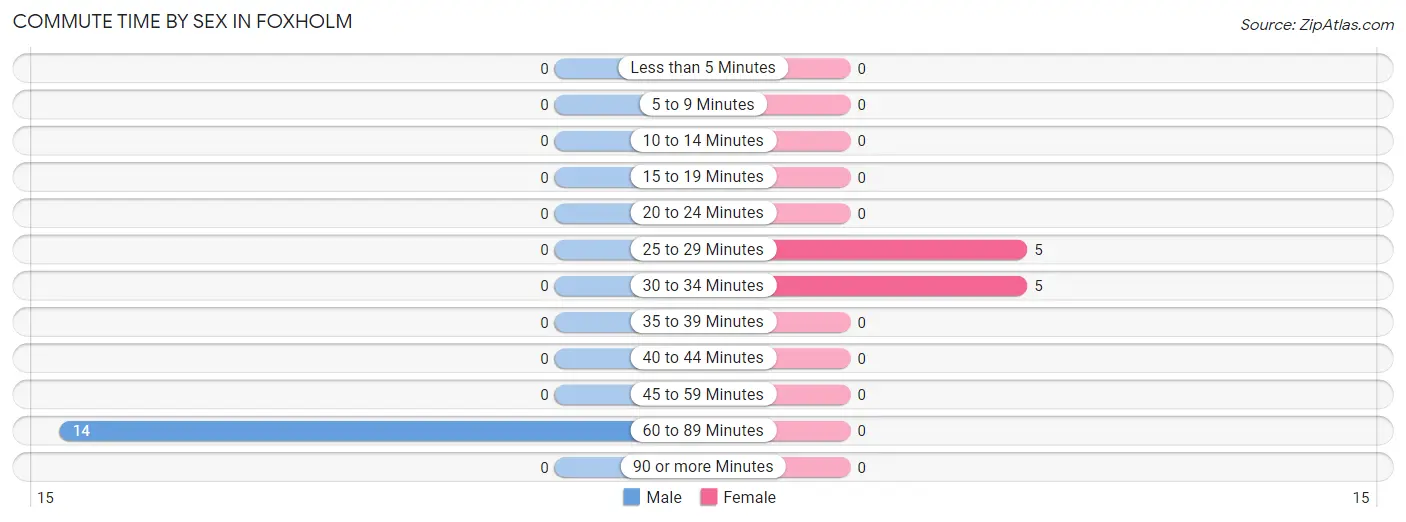
Commute Time in Foxholm
The most frequently occuring commute durations in Foxholm are 60 to 89 minutes (14 commuters, 58.3%), 25 to 29 minutes (5 commuters, 20.8%), and 30 to 34 minutes (5 commuters, 20.8%).
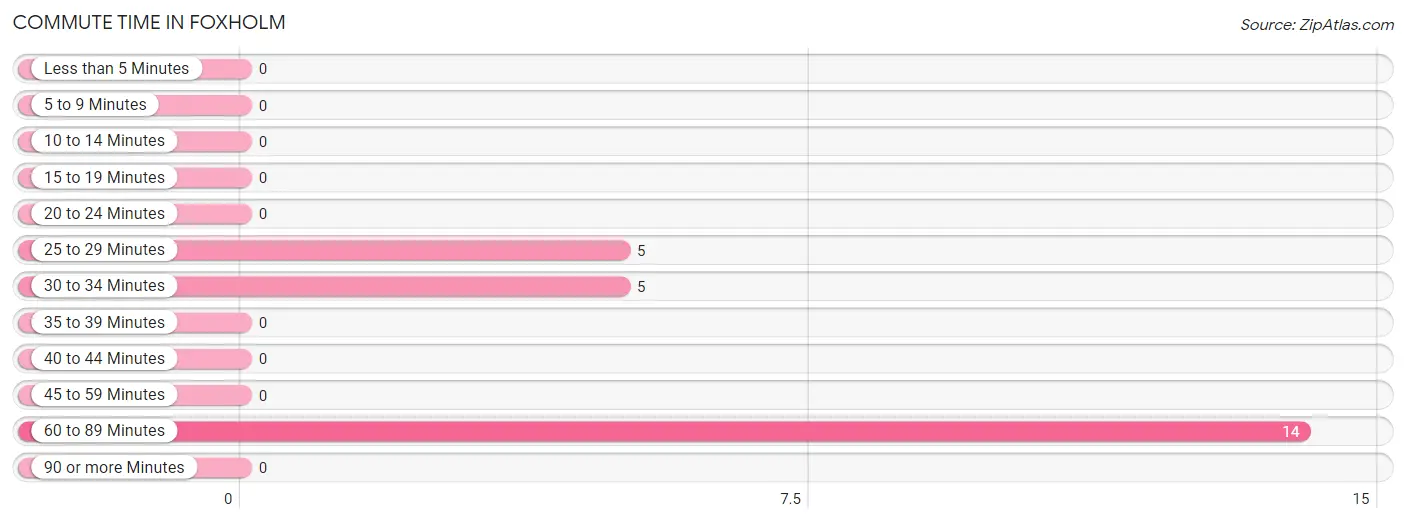
| Commute Time | # Commuters | % Commuters |
| Less than 5 Minutes | 0 | 0.0% |
| 5 to 9 Minutes | 0 | 0.0% |
| 10 to 14 Minutes | 0 | 0.0% |
| 15 to 19 Minutes | 0 | 0.0% |
| 20 to 24 Minutes | 0 | 0.0% |
| 25 to 29 Minutes | 5 | 20.8% |
| 30 to 34 Minutes | 5 | 20.8% |
| 35 to 39 Minutes | 0 | 0.0% |
| 40 to 44 Minutes | 0 | 0.0% |
| 45 to 59 Minutes | 0 | 0.0% |
| 60 to 89 Minutes | 14 | 58.3% |
| 90 or more Minutes | 0 | 0.0% |
Commute Time by Sex in Foxholm
The most common commute times in Foxholm are 60 to 89 minutes (14 commuters, 100.0%) for males and 25 to 29 minutes (5 commuters, 50.0%) for females.
| Commute Time | Male | Female |
| Less than 5 Minutes | 0 (0.0%) | 0 (0.0%) |
| 5 to 9 Minutes | 0 (0.0%) | 0 (0.0%) |
| 10 to 14 Minutes | 0 (0.0%) | 0 (0.0%) |
| 15 to 19 Minutes | 0 (0.0%) | 0 (0.0%) |
| 20 to 24 Minutes | 0 (0.0%) | 0 (0.0%) |
| 25 to 29 Minutes | 0 (0.0%) | 5 (50.0%) |
| 30 to 34 Minutes | 0 (0.0%) | 5 (50.0%) |
| 35 to 39 Minutes | 0 (0.0%) | 0 (0.0%) |
| 40 to 44 Minutes | 0 (0.0%) | 0 (0.0%) |
| 45 to 59 Minutes | 0 (0.0%) | 0 (0.0%) |
| 60 to 89 Minutes | 14 (100.0%) | 0 (0.0%) |
| 90 or more Minutes | 0 (0.0%) | 0 (0.0%) |
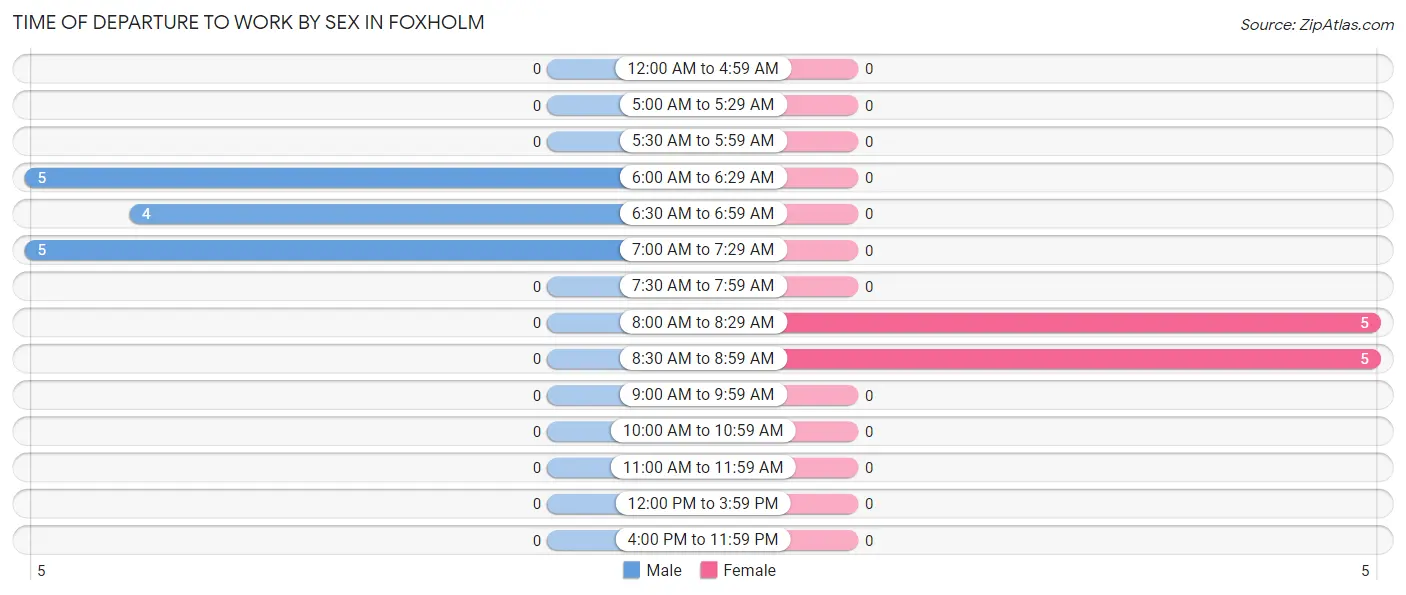
Time of Departure to Work by Sex in Foxholm
The most frequent times of departure to work in Foxholm are 6:00 AM to 6:29 AM (5, 35.7%) for males and 8:00 AM to 8:29 AM (5, 50.0%) for females.
| Time of Departure | Male | Female |
| 12:00 AM to 4:59 AM | 0 (0.0%) | 0 (0.0%) |
| 5:00 AM to 5:29 AM | 0 (0.0%) | 0 (0.0%) |
| 5:30 AM to 5:59 AM | 0 (0.0%) | 0 (0.0%) |
| 6:00 AM to 6:29 AM | 5 (35.7%) | 0 (0.0%) |
| 6:30 AM to 6:59 AM | 4 (28.6%) | 0 (0.0%) |
| 7:00 AM to 7:29 AM | 5 (35.7%) | 0 (0.0%) |
| 7:30 AM to 7:59 AM | 0 (0.0%) | 0 (0.0%) |
| 8:00 AM to 8:29 AM | 0 (0.0%) | 5 (50.0%) |
| 8:30 AM to 8:59 AM | 0 (0.0%) | 5 (50.0%) |
| 9:00 AM to 9:59 AM | 0 (0.0%) | 0 (0.0%) |
| 10:00 AM to 10:59 AM | 0 (0.0%) | 0 (0.0%) |
| 11:00 AM to 11:59 AM | 0 (0.0%) | 0 (0.0%) |
| 12:00 PM to 3:59 PM | 0 (0.0%) | 0 (0.0%) |
| 4:00 PM to 11:59 PM | 0 (0.0%) | 0 (0.0%) |
| Total | 14 (100.0%) | 10 (100.0%) |
Housing Occupancy in Foxholm
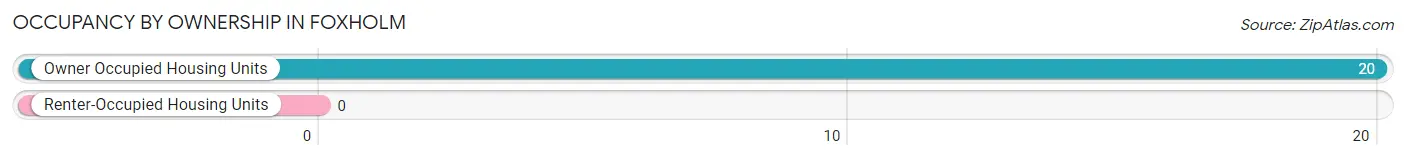
Occupancy by Ownership in Foxholm
Of the total 20 dwellings in Foxholm, owner-occupied units account for 20 (100.0%), while renter-occupied units make up 0 (0.0%).
| Occupancy | # Housing Units | % Housing Units |
| Owner Occupied Housing Units | 20 | 100.0% |
| Renter-Occupied Housing Units | 0 | 0.0% |
| Total Occupied Housing Units | 20 | 100.0% |
Occupancy by Household Size in Foxholm
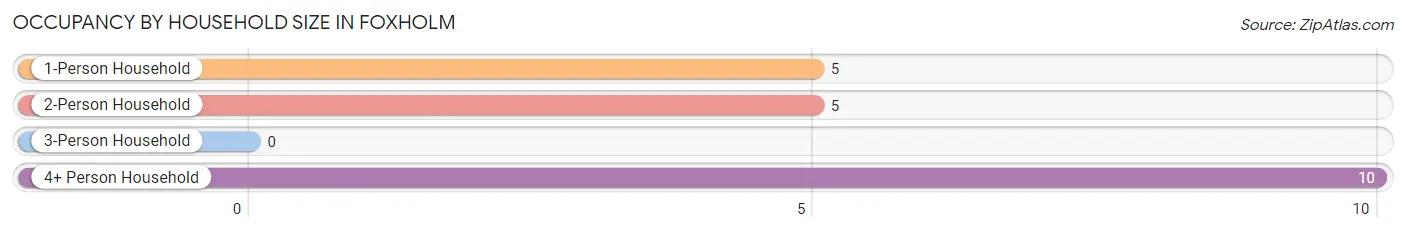
| Household Size | # Housing Units | % Housing Units |
| 1-Person Household | 5 | 25.0% |
| 2-Person Household | 5 | 25.0% |
| 3-Person Household | 0 | 0.0% |
| 4+ Person Household | 10 | 50.0% |
| Total Housing Units | 20 | 100.0% |
Occupancy by Ownership by Household Size in Foxholm
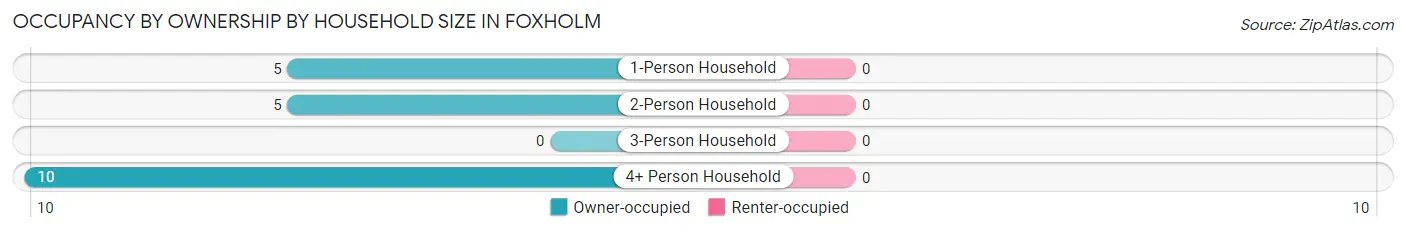
| Household Size | Owner-occupied | Renter-occupied |
| 1-Person Household | 5 (100.0%) | 0 (0.0%) |
| 2-Person Household | 5 (100.0%) | 0 (0.0%) |
| 3-Person Household | 0 (0.0%) | 0 (0.0%) |
| 4+ Person Household | 10 (100.0%) | 0 (0.0%) |
| Total Housing Units | 20 (100.0%) | 0 (0.0%) |
Occupancy by Educational Attainment in Foxholm
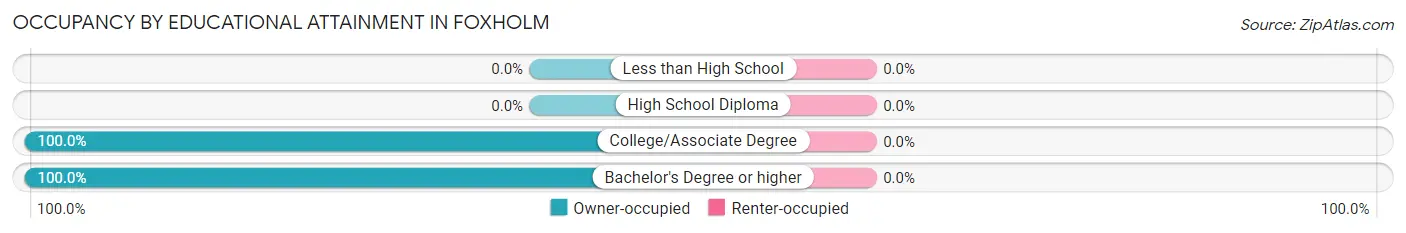
| Household Size | Owner-occupied | Renter-occupied |
| Less than High School | 0 (0.0%) | 0 (0.0%) |
| High School Diploma | 0 (0.0%) | 0 (0.0%) |
| College/Associate Degree | 10 (100.0%) | 0 (0.0%) |
| Bachelor's Degree or higher | 10 (100.0%) | 0 (0.0%) |
Occupancy by Age of Householder in Foxholm
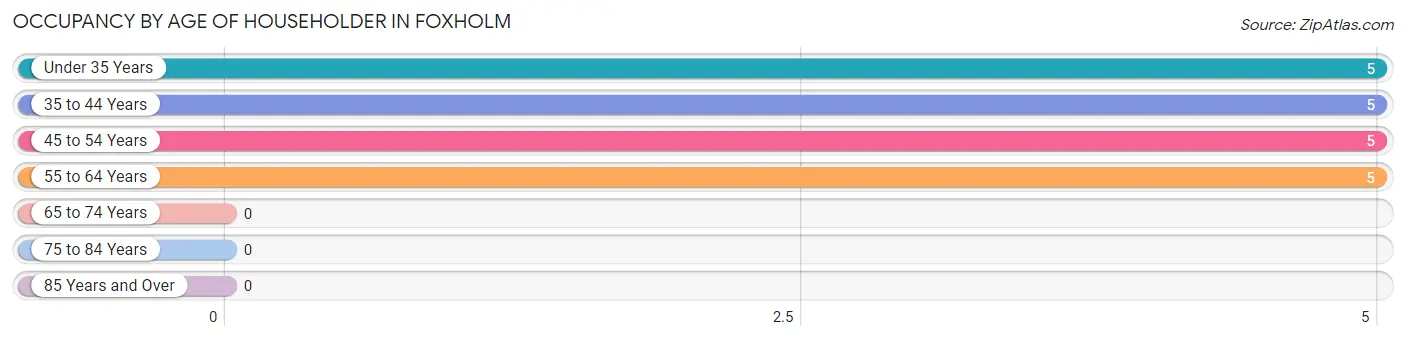
| Age Bracket | # Households | % Households |
| Under 35 Years | 5 | 25.0% |
| 35 to 44 Years | 5 | 25.0% |
| 45 to 54 Years | 5 | 25.0% |
| 55 to 64 Years | 5 | 25.0% |
| 65 to 74 Years | 0 | 0.0% |
| 75 to 84 Years | 0 | 0.0% |
| 85 Years and Over | 0 | 0.0% |
| Total | 20 | 100.0% |
Housing Finances in Foxholm
Median Income by Occupancy in Foxholm
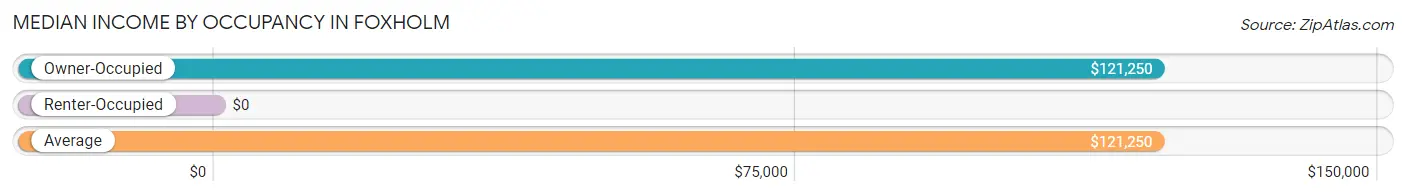
| Occupancy Type | # Households | Median Income |
| Owner-Occupied | 20 (100.0%) | $121,250 |
| Renter-Occupied | 0 (0.0%) | $0 |
| Average | 20 (100.0%) | $121,250 |
Occupancy by Householder Income Bracket in Foxholm
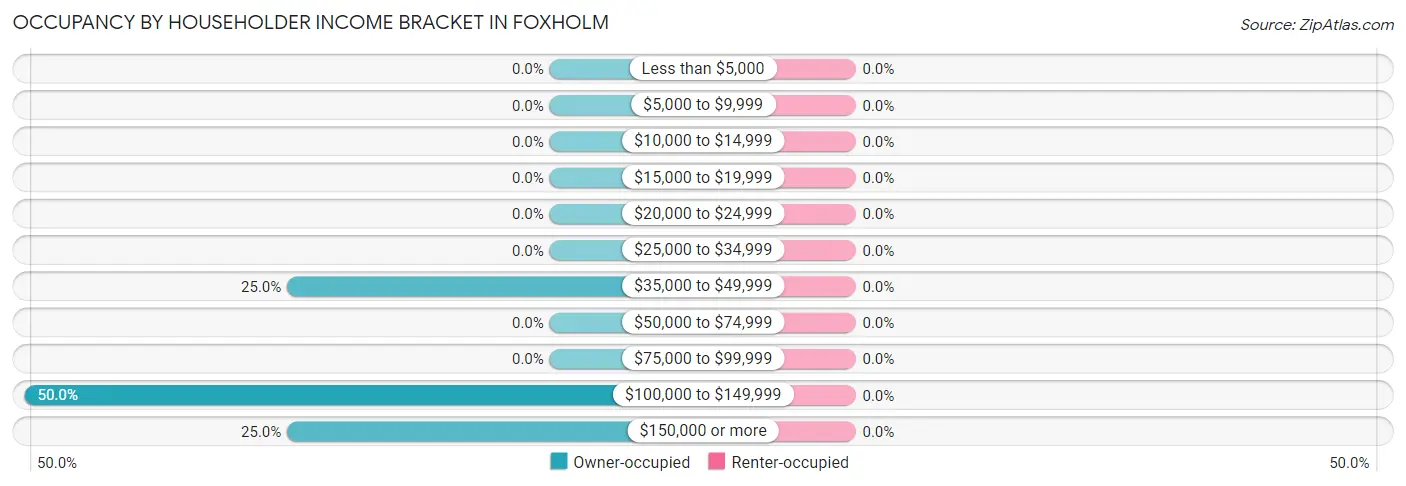
| Income Bracket | Owner-occupied | Renter-occupied |
| Less than $5,000 | 0 (0.0%) | 0 (0.0%) |
| $5,000 to $9,999 | 0 (0.0%) | 0 (0.0%) |
| $10,000 to $14,999 | 0 (0.0%) | 0 (0.0%) |
| $15,000 to $19,999 | 0 (0.0%) | 0 (0.0%) |
| $20,000 to $24,999 | 0 (0.0%) | 0 (0.0%) |
| $25,000 to $34,999 | 0 (0.0%) | 0 (0.0%) |
| $35,000 to $49,999 | 5 (25.0%) | 0 (0.0%) |
| $50,000 to $74,999 | 0 (0.0%) | 0 (0.0%) |
| $75,000 to $99,999 | 0 (0.0%) | 0 (0.0%) |
| $100,000 to $149,999 | 10 (50.0%) | 0 (0.0%) |
| $150,000 or more | 5 (25.0%) | 0 (0.0%) |
| Total | 20 (100.0%) | 0 (0.0%) |
Monthly Housing Cost Tiers in Foxholm
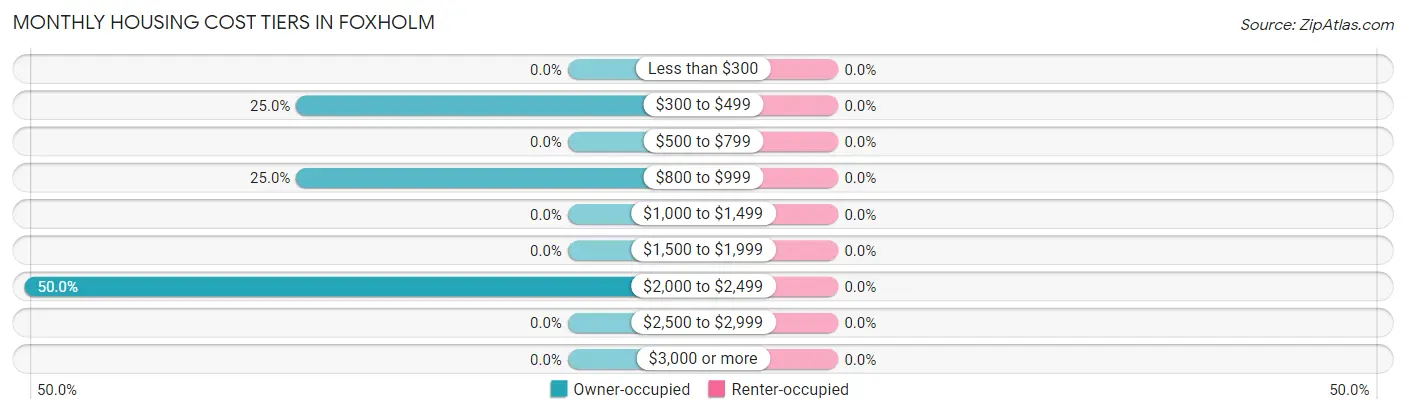
| Monthly Cost | Owner-occupied | Renter-occupied |
| Less than $300 | 0 (0.0%) | 0 (0.0%) |
| $300 to $499 | 5 (25.0%) | 0 (0.0%) |
| $500 to $799 | 0 (0.0%) | 0 (0.0%) |
| $800 to $999 | 5 (25.0%) | 0 (0.0%) |
| $1,000 to $1,499 | 0 (0.0%) | 0 (0.0%) |
| $1,500 to $1,999 | 0 (0.0%) | 0 (0.0%) |
| $2,000 to $2,499 | 10 (50.0%) | 0 (0.0%) |
| $2,500 to $2,999 | 0 (0.0%) | 0 (0.0%) |
| $3,000 or more | 0 (0.0%) | 0 (0.0%) |
| Total | 20 (100.0%) | 0 (0.0%) |
Physical Housing Characteristics in Foxholm
Housing Structures in Foxholm
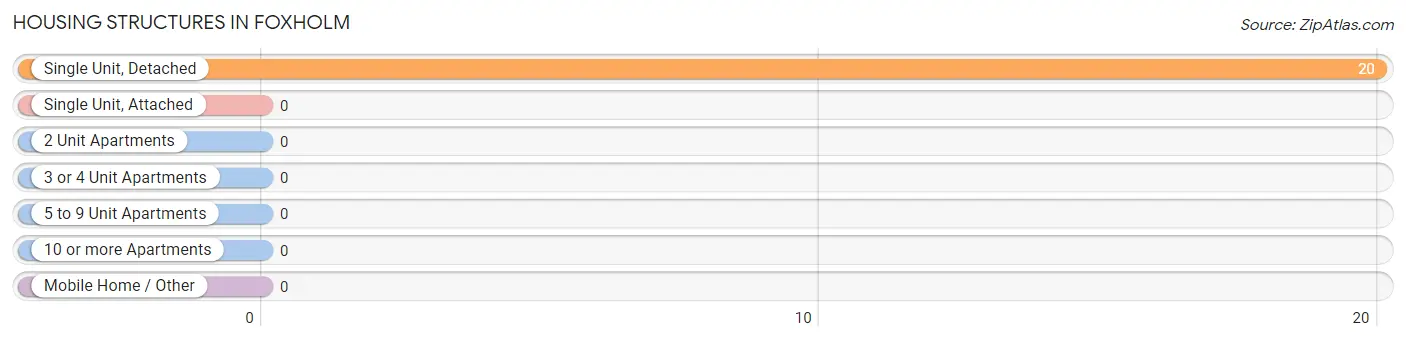
| Structure Type | # Housing Units | % Housing Units |
| Single Unit, Detached | 20 | 100.0% |
| Single Unit, Attached | 0 | 0.0% |
| 2 Unit Apartments | 0 | 0.0% |
| 3 or 4 Unit Apartments | 0 | 0.0% |
| 5 to 9 Unit Apartments | 0 | 0.0% |
| 10 or more Apartments | 0 | 0.0% |
| Mobile Home / Other | 0 | 0.0% |
| Total | 20 | 100.0% |
Housing Structures by Occupancy in Foxholm
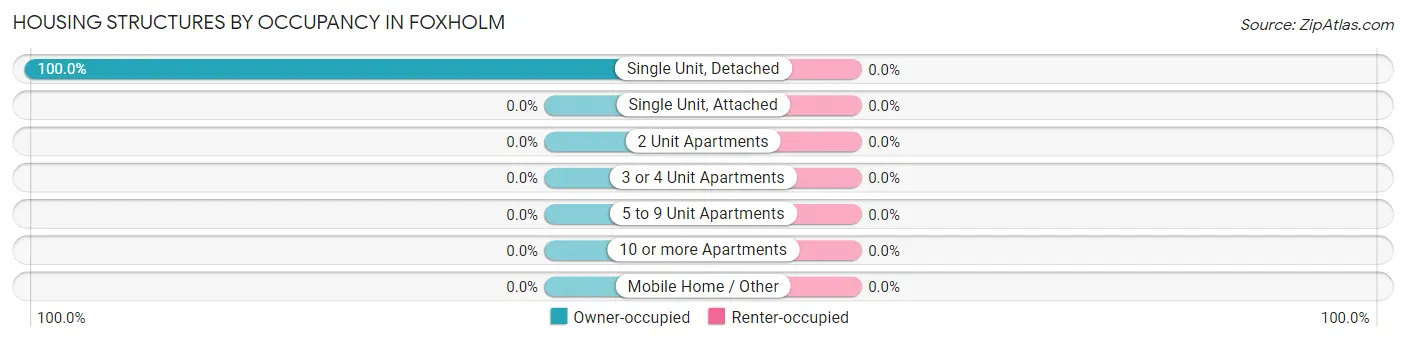
| Structure Type | Owner-occupied | Renter-occupied |
| Single Unit, Detached | 20 (100.0%) | 0 (0.0%) |
| Single Unit, Attached | 0 (0.0%) | 0 (0.0%) |
| 2 Unit Apartments | 0 (0.0%) | 0 (0.0%) |
| 3 or 4 Unit Apartments | 0 (0.0%) | 0 (0.0%) |
| 5 to 9 Unit Apartments | 0 (0.0%) | 0 (0.0%) |
| 10 or more Apartments | 0 (0.0%) | 0 (0.0%) |
| Mobile Home / Other | 0 (0.0%) | 0 (0.0%) |
| Total | 20 (100.0%) | 0 (0.0%) |
Housing Structures by Number of Rooms in Foxholm
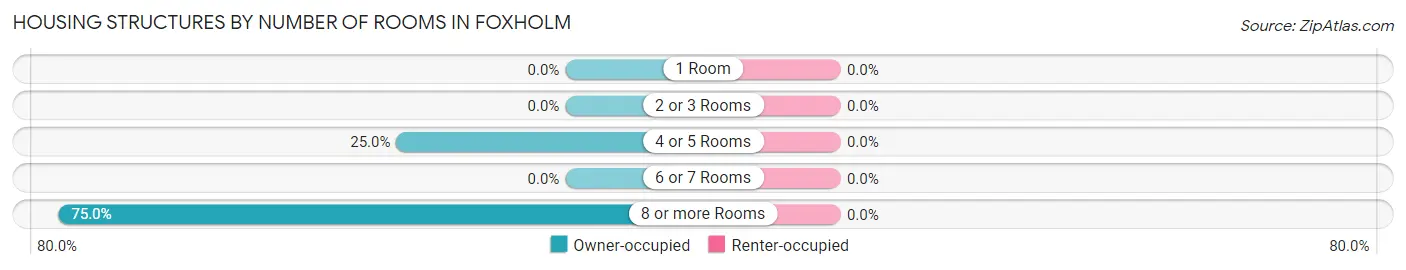
| Number of Rooms | Owner-occupied | Renter-occupied |
| 1 Room | 0 (0.0%) | 0 (0.0%) |
| 2 or 3 Rooms | 0 (0.0%) | 0 (0.0%) |
| 4 or 5 Rooms | 5 (25.0%) | 0 (0.0%) |
| 6 or 7 Rooms | 0 (0.0%) | 0 (0.0%) |
| 8 or more Rooms | 15 (75.0%) | 0 (0.0%) |
| Total | 20 (100.0%) | 0 (0.0%) |
Housing Structure by Heating Type in Foxholm
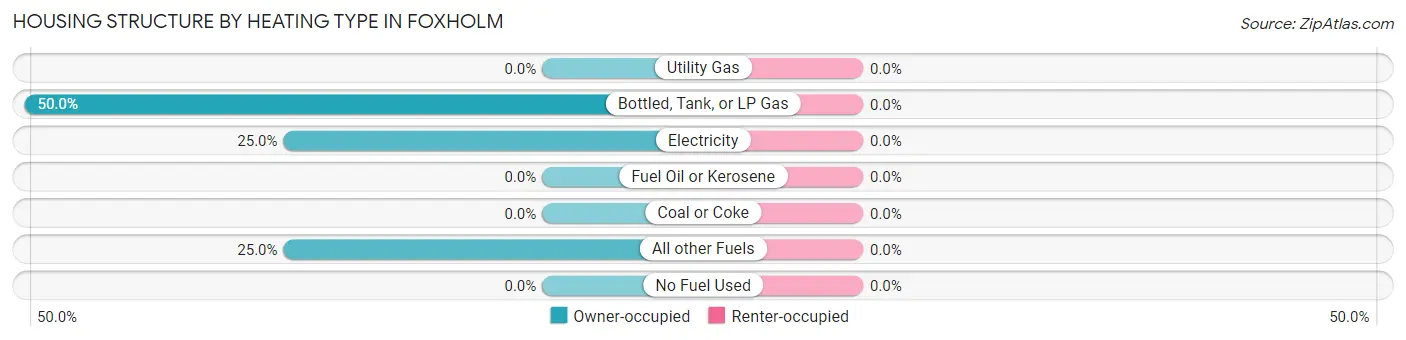
| Heating Type | Owner-occupied | Renter-occupied |
| Utility Gas | 0 (0.0%) | 0 (0.0%) |
| Bottled, Tank, or LP Gas | 10 (50.0%) | 0 (0.0%) |
| Electricity | 5 (25.0%) | 0 (0.0%) |
| Fuel Oil or Kerosene | 0 (0.0%) | 0 (0.0%) |
| Coal or Coke | 0 (0.0%) | 0 (0.0%) |
| All other Fuels | 5 (25.0%) | 0 (0.0%) |
| No Fuel Used | 0 (0.0%) | 0 (0.0%) |
| Total | 20 (100.0%) | 0 (0.0%) |
Household Vehicle Usage in Foxholm
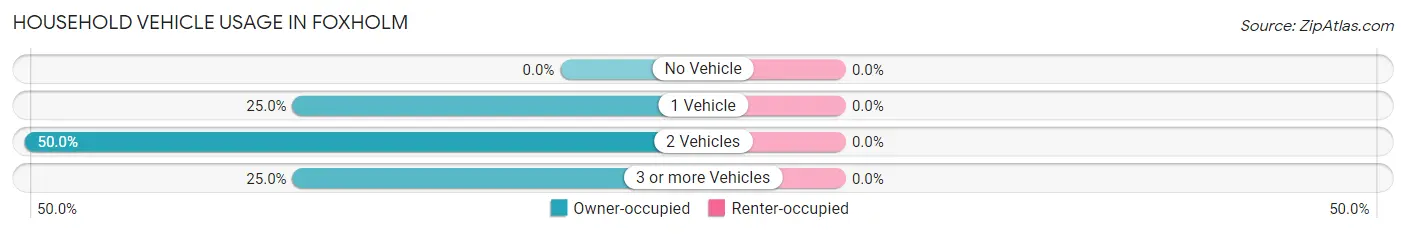
| Vehicles per Household | Owner-occupied | Renter-occupied |
| No Vehicle | 0 (0.0%) | 0 (0.0%) |
| 1 Vehicle | 5 (25.0%) | 0 (0.0%) |
| 2 Vehicles | 10 (50.0%) | 0 (0.0%) |
| 3 or more Vehicles | 5 (25.0%) | 0 (0.0%) |
| Total | 20 (100.0%) | 0 (0.0%) |
Real Estate & Mortgages in Foxholm
Real Estate and Mortgage Overview in Foxholm
| Characteristic | Without Mortgage | With Mortgage |
| Housing Units | 5 | 15 |
| Median Property Value | - | - |
| Median Household Income | - | - |
| Monthly Housing Costs | - | - |
| Real Estate Taxes | - | - |
Property Value by Mortgage Status in Foxholm
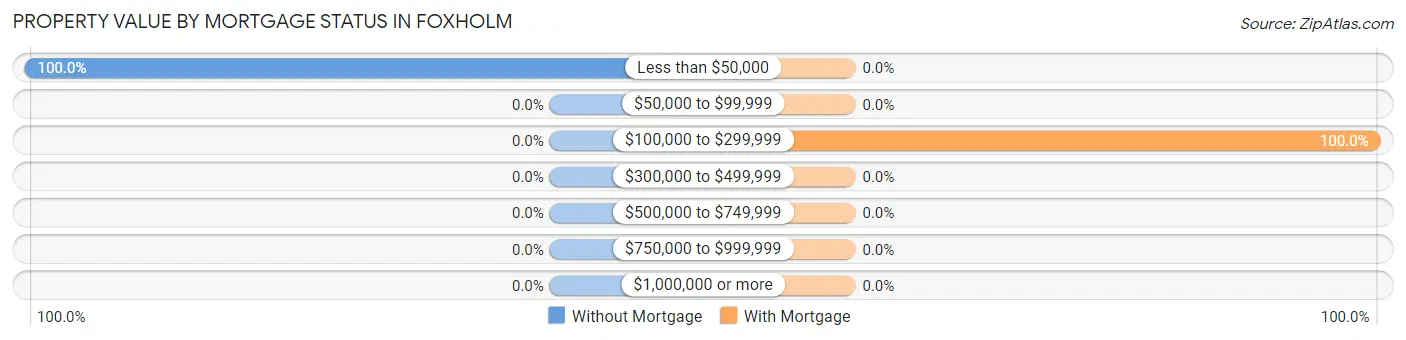
| Property Value | Without Mortgage | With Mortgage |
| Less than $50,000 | 5 (100.0%) | 0 (0.0%) |
| $50,000 to $99,999 | 0 (0.0%) | 0 (0.0%) |
| $100,000 to $299,999 | 0 (0.0%) | 15 (100.0%) |
| $300,000 to $499,999 | 0 (0.0%) | 0 (0.0%) |
| $500,000 to $749,999 | 0 (0.0%) | 0 (0.0%) |
| $750,000 to $999,999 | 0 (0.0%) | 0 (0.0%) |
| $1,000,000 or more | 0 (0.0%) | 0 (0.0%) |
| Total | 5 (100.0%) | 15 (100.0%) |
Household Income by Mortgage Status in Foxholm
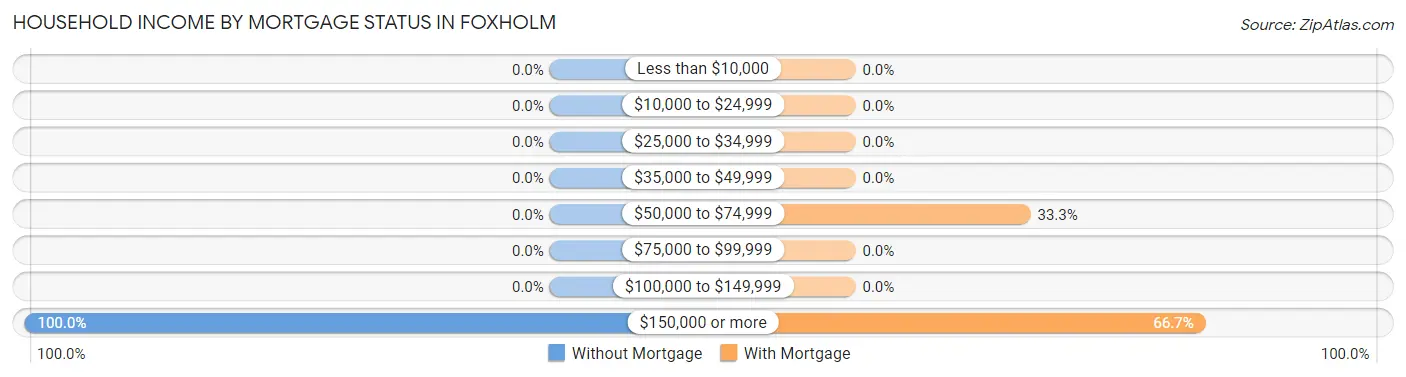
| Household Income | Without Mortgage | With Mortgage |
| Less than $10,000 | 0 (0.0%) | 0 (0.0%) |
| $10,000 to $24,999 | 0 (0.0%) | 0 (0.0%) |
| $25,000 to $34,999 | 0 (0.0%) | 0 (0.0%) |
| $35,000 to $49,999 | 0 (0.0%) | 0 (0.0%) |
| $50,000 to $74,999 | 0 (0.0%) | 5 (33.3%) |
| $75,000 to $99,999 | 0 (0.0%) | 0 (0.0%) |
| $100,000 to $149,999 | 0 (0.0%) | 0 (0.0%) |
| $150,000 or more | 5 (100.0%) | 10 (66.7%) |
| Total | 5 (100.0%) | 15 (100.0%) |
Property Value to Household Income Ratio in Foxholm
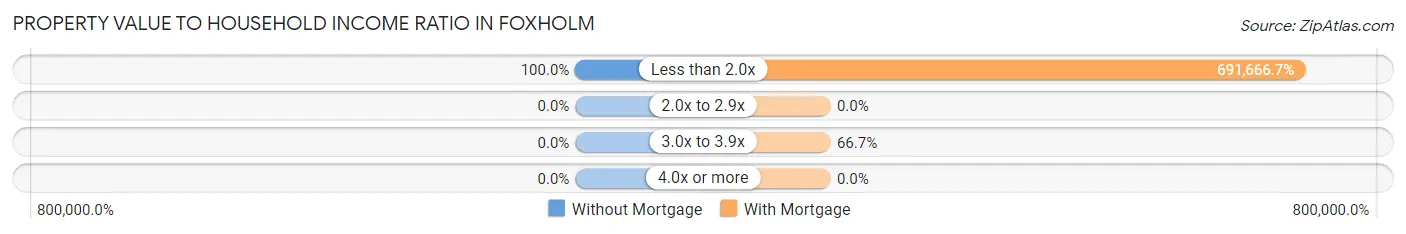
| Value-to-Income Ratio | Without Mortgage | With Mortgage |
| Less than 2.0x | 5 (100.0%) | 103,750 (691,666.7%) |
| 2.0x to 2.9x | 0 (0.0%) | 0 (0.0%) |
| 3.0x to 3.9x | 0 (0.0%) | 10 (66.7%) |
| 4.0x or more | 0 (0.0%) | 0 (0.0%) |
| Total | 5 (100.0%) | 15 (100.0%) |
Real Estate Taxes by Mortgage Status in Foxholm
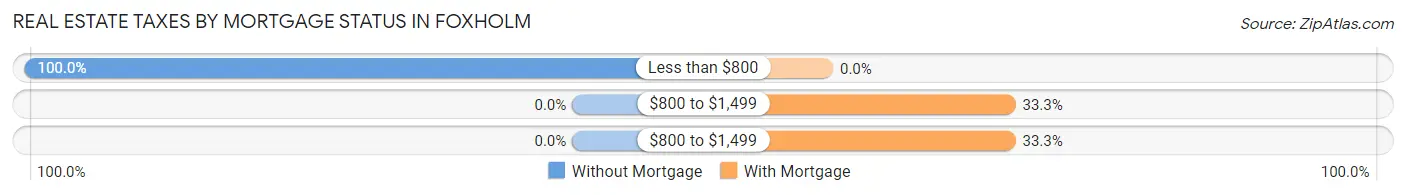
| Property Taxes | Without Mortgage | With Mortgage |
| Less than $800 | 5 (100.0%) | 0 (0.0%) |
| $800 to $1,499 | 0 (0.0%) | 5 (33.3%) |
| $800 to $1,499 | 0 (0.0%) | 5 (33.3%) |
| Total | 5 (100.0%) | 15 (100.0%) |
Health & Disability in Foxholm
Health Insurance Coverage by Age in Foxholm
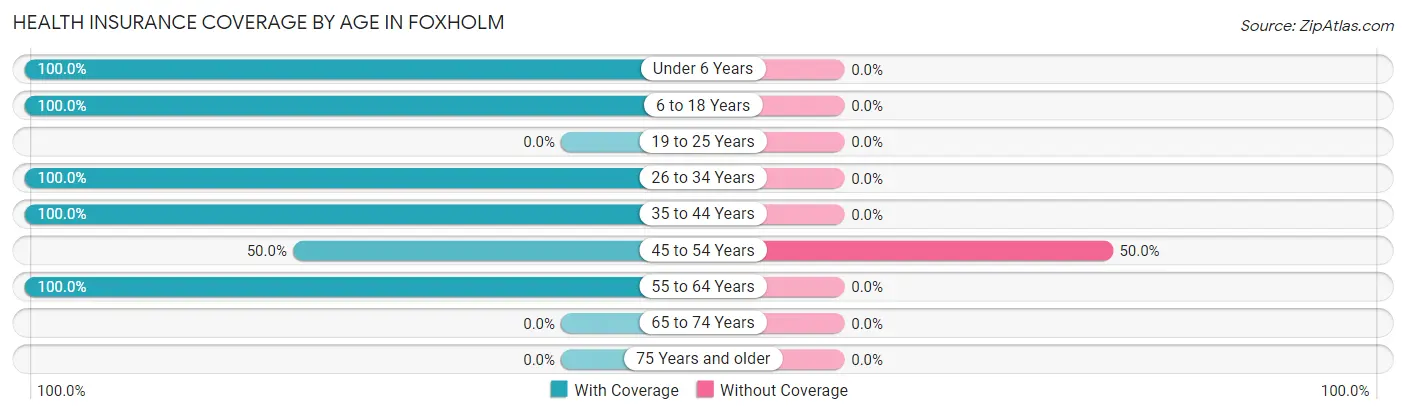
| Age Bracket | With Coverage | Without Coverage |
| Under 6 Years | 14 (100.0%) | 0 (0.0%) |
| 6 to 18 Years | 20 (100.0%) | 0 (0.0%) |
| 19 to 25 Years | 0 (0.0%) | 0 (0.0%) |
| 26 to 34 Years | 9 (100.0%) | 0 (0.0%) |
| 35 to 44 Years | 5 (100.0%) | 0 (0.0%) |
| 45 to 54 Years | 5 (50.0%) | 5 (50.0%) |
| 55 to 64 Years | 5 (100.0%) | 0 (0.0%) |
| 65 to 74 Years | 0 (0.0%) | 0 (0.0%) |
| 75 Years and older | 0 (0.0%) | 0 (0.0%) |
| Total | 58 (92.1%) | 5 (7.9%) |
Health Insurance Coverage by Citizenship Status in Foxholm
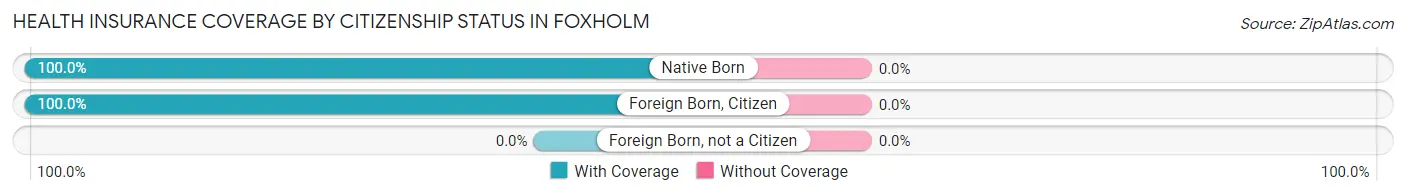
| Citizenship Status | With Coverage | Without Coverage |
| Native Born | 14 (100.0%) | 0 (0.0%) |
| Foreign Born, Citizen | 20 (100.0%) | 0 (0.0%) |
| Foreign Born, not a Citizen | 0 (0.0%) | 0 (0.0%) |
Health Insurance Coverage by Household Income in Foxholm
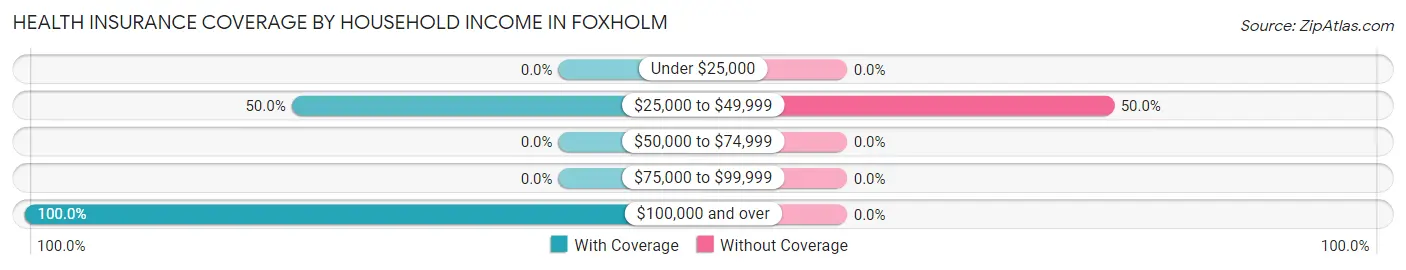
| Household Income | With Coverage | Without Coverage |
| Under $25,000 | 0 (0.0%) | 0 (0.0%) |
| $25,000 to $49,999 | 5 (50.0%) | 5 (50.0%) |
| $50,000 to $74,999 | 0 (0.0%) | 0 (0.0%) |
| $75,000 to $99,999 | 0 (0.0%) | 0 (0.0%) |
| $100,000 and over | 53 (100.0%) | 0 (0.0%) |
Public vs Private Health Insurance Coverage by Age in Foxholm
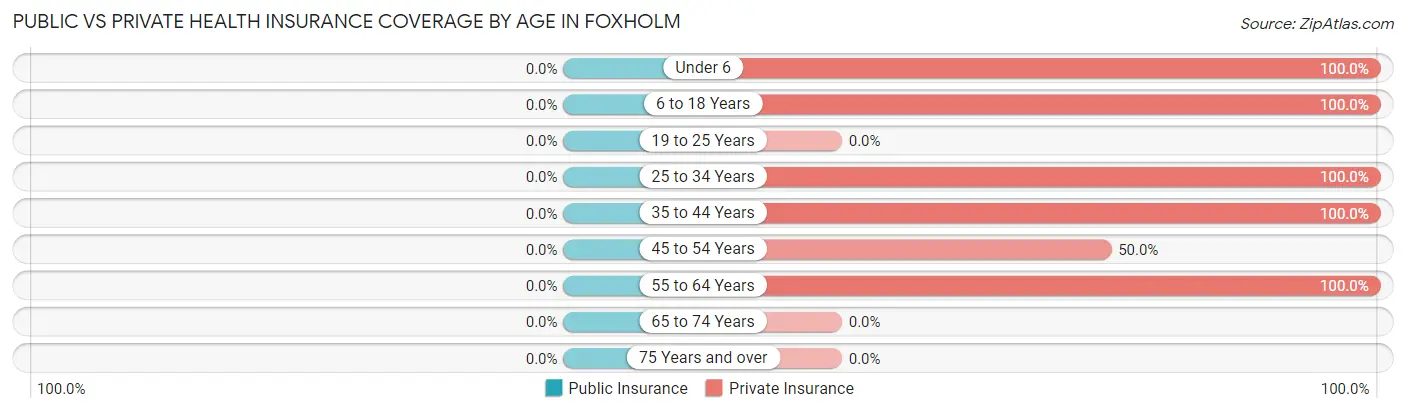
| Age Bracket | Public Insurance | Private Insurance |
| Under 6 | 0 (0.0%) | 14 (100.0%) |
| 6 to 18 Years | 0 (0.0%) | 20 (100.0%) |
| 19 to 25 Years | 0 (0.0%) | 0 (0.0%) |
| 25 to 34 Years | 0 (0.0%) | 9 (100.0%) |
| 35 to 44 Years | 0 (0.0%) | 5 (100.0%) |
| 45 to 54 Years | 0 (0.0%) | 5 (50.0%) |
| 55 to 64 Years | 0 (0.0%) | 5 (100.0%) |
| 65 to 74 Years | 0 (0.0%) | 0 (0.0%) |
| 75 Years and over | 0 (0.0%) | 0 (0.0%) |
| Total | 0 (0.0%) | 58 (92.1%) |
Disability Status by Sex by Age in Foxholm
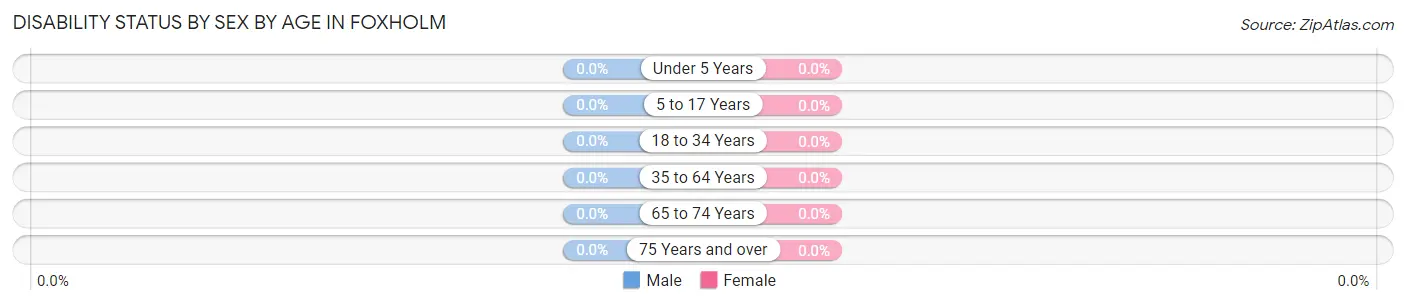
| Age Bracket | Male | Female |
| Under 5 Years | 0 (0.0%) | 0 (0.0%) |
| 5 to 17 Years | 0 (0.0%) | 0 (0.0%) |
| 18 to 34 Years | 0 (0.0%) | 0 (0.0%) |
| 35 to 64 Years | 0 (0.0%) | 0 (0.0%) |
| 65 to 74 Years | 0 (0.0%) | 0 (0.0%) |
| 75 Years and over | 0 (0.0%) | 0 (0.0%) |
Disability Class by Sex by Age in Foxholm
Disability Class: Hearing Difficulty
| Age Bracket | Male | Female |
| Under 5 Years | 0 (0.0%) | 0 (0.0%) |
| 5 to 17 Years | 0 (0.0%) | 0 (0.0%) |
| 18 to 34 Years | 0 (0.0%) | 0 (0.0%) |
| 35 to 64 Years | 0 (0.0%) | 0 (0.0%) |
| 65 to 74 Years | 0 (0.0%) | 0 (0.0%) |
| 75 Years and over | 0 (0.0%) | 0 (0.0%) |
Disability Class: Vision Difficulty
| Age Bracket | Male | Female |
| Under 5 Years | 0 (0.0%) | 0 (0.0%) |
| 5 to 17 Years | 0 (0.0%) | 0 (0.0%) |
| 18 to 34 Years | 0 (0.0%) | 0 (0.0%) |
| 35 to 64 Years | 0 (0.0%) | 0 (0.0%) |
| 65 to 74 Years | 0 (0.0%) | 0 (0.0%) |
| 75 Years and over | 0 (0.0%) | 0 (0.0%) |
Disability Class: Cognitive Difficulty
| Age Bracket | Male | Female |
| 5 to 17 Years | 0 (0.0%) | 0 (0.0%) |
| 18 to 34 Years | 0 (0.0%) | 0 (0.0%) |
| 35 to 64 Years | 0 (0.0%) | 0 (0.0%) |
| 65 to 74 Years | 0 (0.0%) | 0 (0.0%) |
| 75 Years and over | 0 (0.0%) | 0 (0.0%) |
Disability Class: Ambulatory Difficulty
| Age Bracket | Male | Female |
| 5 to 17 Years | 0 (0.0%) | 0 (0.0%) |
| 18 to 34 Years | 0 (0.0%) | 0 (0.0%) |
| 35 to 64 Years | 0 (0.0%) | 0 (0.0%) |
| 65 to 74 Years | 0 (0.0%) | 0 (0.0%) |
| 75 Years and over | 0 (0.0%) | 0 (0.0%) |
Disability Class: Self-Care Difficulty
| Age Bracket | Male | Female |
| 5 to 17 Years | 0 (0.0%) | 0 (0.0%) |
| 18 to 34 Years | 0 (0.0%) | 0 (0.0%) |
| 35 to 64 Years | 0 (0.0%) | 0 (0.0%) |
| 65 to 74 Years | 0 (0.0%) | 0 (0.0%) |
| 75 Years and over | 0 (0.0%) | 0 (0.0%) |
Technology Access in Foxholm
Computing Device Access in Foxholm
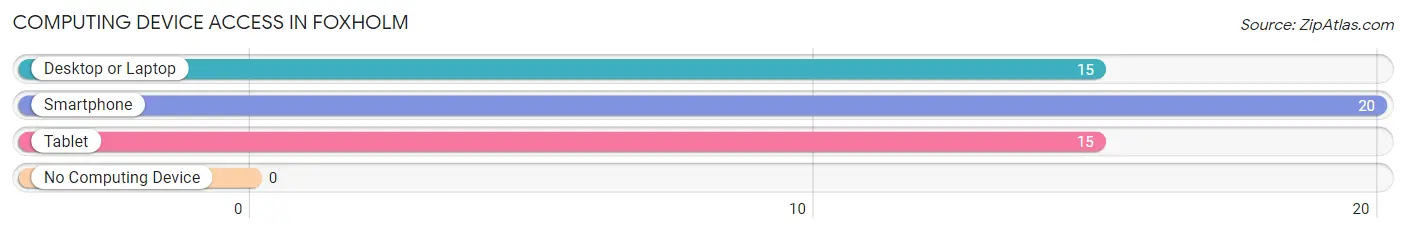
| Device Type | # Households | % Households |
| Desktop or Laptop | 15 | 75.0% |
| Smartphone | 20 | 100.0% |
| Tablet | 15 | 75.0% |
| No Computing Device | 0 | 0.0% |
| Total | 20 | 100.0% |
Internet Access in Foxholm
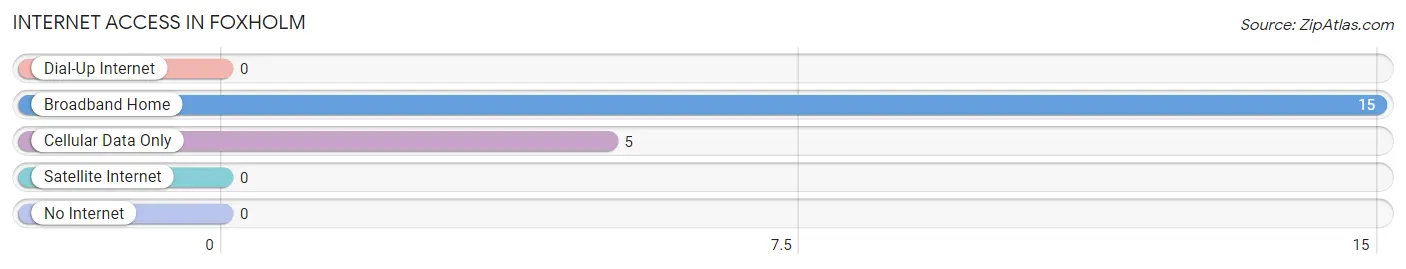
| Internet Type | # Households | % Households |
| Dial-Up Internet | 0 | 0.0% |
| Broadband Home | 15 | 75.0% |
| Cellular Data Only | 5 | 25.0% |
| Satellite Internet | 0 | 0.0% |
| No Internet | 0 | 0.0% |
| Total | 20 | 100.0% |
Foxholm Summary
History
Foxholm is a small town located in the state of North Dakota, United States. It is situated in the southeastern corner of the state, near the border with Minnesota. The town was founded in 1883 by a group of Norwegian immigrants who had come to the area in search of a better life. The town was named after the Foxholm family, who were among the first settlers.
The town was initially a farming community, with the majority of the population engaged in agricultural activities. However, in the early 1900s, the town began to diversify its economy, with the establishment of a number of small businesses. These included a general store, a blacksmith shop, a sawmill, and a creamery.
In the 1920s, the town experienced a period of growth, with the construction of a number of new buildings, including a school, a bank, and a post office. This period of growth was short-lived, however, as the Great Depression hit the town hard. Many of the businesses closed, and the population declined.
In the 1950s, the town began to experience a resurgence, with the construction of a new school and the opening of a number of new businesses. This period of growth was short-lived, however, as the town experienced a decline in population in the 1960s and 1970s.
Geography
Foxholm is located in the southeastern corner of North Dakota, near the border with Minnesota. The town is situated in the Red River Valley, a flat, fertile region of the state. The town is located on the banks of the Red River, which provides a source of irrigation for the surrounding farmland.
The town is located in an area of rolling hills and prairies, with the nearest major city being Fargo, located about 50 miles to the north. The town is located in an area of moderate climate, with hot summers and cold winters.
Economy
The economy of Foxholm is largely based on agriculture. The town is located in an area of fertile farmland, and the majority of the population is engaged in agricultural activities. The town is also home to a number of small businesses, including a general store, a blacksmith shop, a sawmill, and a creamery.
The town is also home to a number of manufacturing businesses, including a furniture factory and a plastics factory. The town is also home to a number of service-based businesses, including a number of restaurants and bars.
Demographics
As of the 2010 census, the population of Foxholm was 1,092. The town has a population that is predominantly white, with a small minority of African Americans and Native Americans. The median age of the population is 44.7 years, and the median household income is $41,944. The town has a poverty rate of 11.3%, which is slightly higher than the national average.
Common Questions
What is Per Capita Income in Foxholm?
Per Capita income in Foxholm is $35,762.
What is the Median Family Income in Foxholm?
Median Family Income in Foxholm is $103,750.
What is the Median Household income in Foxholm?
Median Household Income in Foxholm is $121,250.
What is Inequality or Gini Index in Foxholm?
Inequality or Gini Index in Foxholm is 0.25.
What is the Total Population of Foxholm?
Total Population of Foxholm is 63.
What is the Total Male Population of Foxholm?
Total Male Population of Foxholm is 30.
What is the Total Female Population of Foxholm?
Total Female Population of Foxholm is 33.
What is the Ratio of Males per 100 Females in Foxholm?
There are 90.91 Males per 100 Females in Foxholm.
What is the Ratio of Females per 100 Males in Foxholm?
There are 110.00 Females per 100 Males in Foxholm.
What is the Median Population Age in Foxholm?
Median Population Age in Foxholm is 16.5 Years.
What is the Average Family Size in Foxholm
Average Family Size in Foxholm is 3.9 People.
What is the Average Household Size in Foxholm
Average Household Size in Foxholm is 3.1 People.
How Large is the Labor Force in Foxholm?
There are 29 People in the Labor Forcein in Foxholm.
What is the Percentage of People in the Labor Force in Foxholm?
85.3% of People are in the Labor Force in Foxholm.