Sampson County, NC Map & Demographics
Sampson County Map
Sampson County Overview
$25,969
PER CAPITA INCOME
$63,607
AVG FAMILY INCOME
$49,963
AVG HOUSEHOLD INCOME
20.5%
WAGE / INCOME GAP [ % ]
79.5¢/ $1
WAGE / INCOME GAP [ $ ]
$11,041
FAMILY INCOME DEFICIT
0.46
INEQUALITY / GINI INDEX
59,317
TOTAL POPULATION
29,674
MALE POPULATION
29,643
FEMALE POPULATION
100.10
MALES / 100 FEMALES
99.90
FEMALES / 100 MALES
39.6
MEDIAN AGE
3.3
AVG FAMILY SIZE
2.7
AVG HOUSEHOLD SIZE
26,461
LABOR FORCE [ PEOPLE ]
56.7%
PERCENT IN LABOR FORCE
5.7%
UNEMPLOYMENT RATE
Sampson County Area Codes
Income in Sampson County
Income Overview in Sampson County
Per Capita Income in Sampson County is $25,969, while median incomes of families and households are $63,607 and $49,963 respectively.
| Characteristic | Number | Measure |
| Per Capita Income | 59,317 | $25,969 |
| Median Family Income | 14,919 | $63,607 |
| Mean Family Income | 14,919 | $80,123 |
| Median Household Income | 21,395 | $49,963 |
| Mean Household Income | 21,395 | $67,874 |
| Income Deficit | 14,919 | $11,041 |
| Wage / Income Gap (%) | 59,317 | 20.50% |
| Wage / Income Gap ($) | 59,317 | 79.50¢ per $1 |
| Gini / Inequality Index | 59,317 | 0.46 |
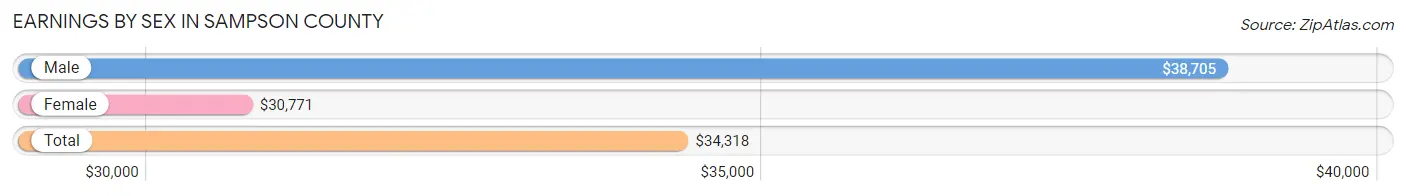
Earnings by Sex in Sampson County
Average Earnings in Sampson County are $34,318, $38,705 for men and $30,771 for women, a difference of 20.5%.
| Sex | Number | Average Earnings |
| Male | 15,241 (56.1%) | $38,705 |
| Female | 11,927 (43.9%) | $30,771 |
| Total | 27,168 (100.0%) | $34,318 |
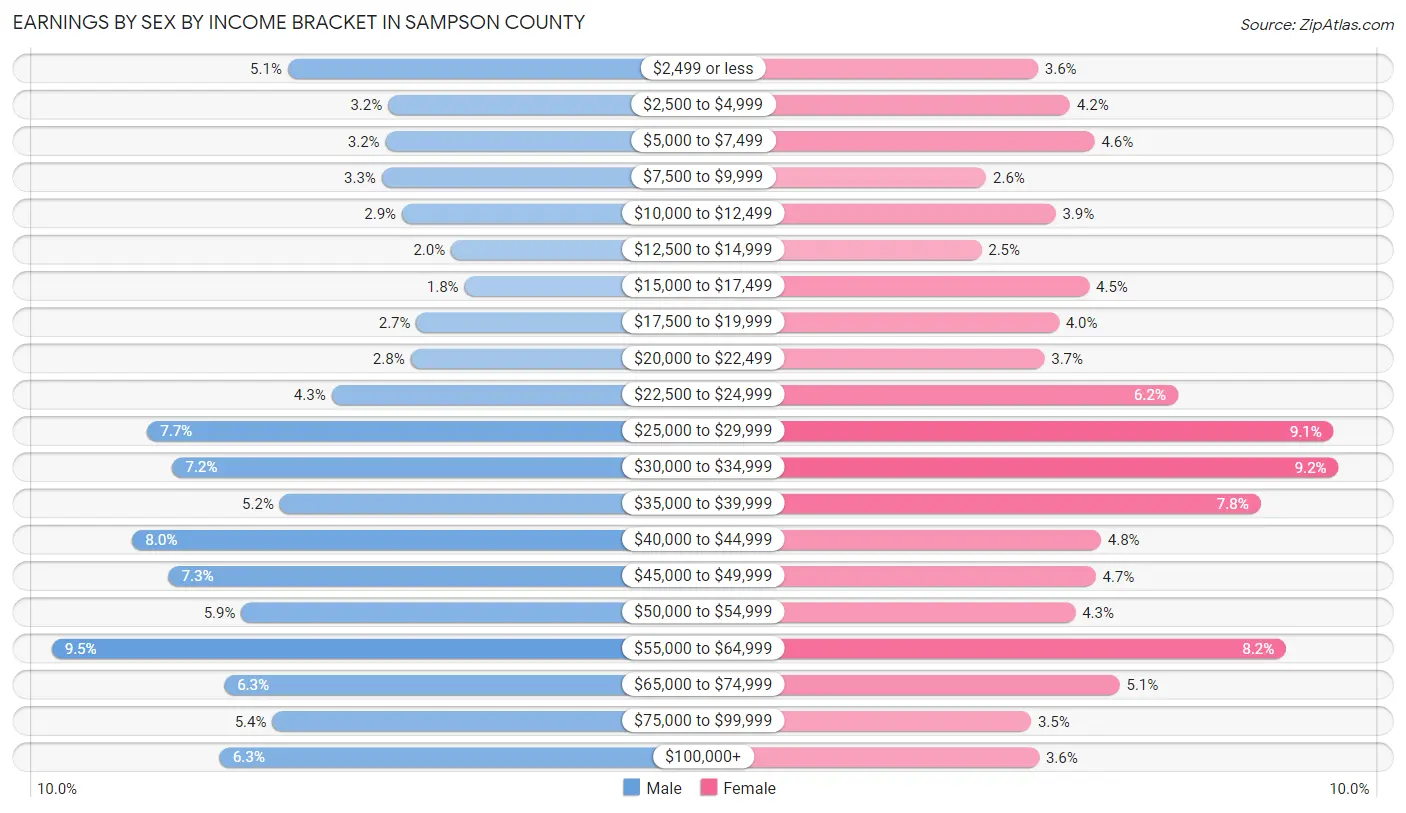
Earnings by Sex by Income Bracket in Sampson County
The most common earnings brackets in Sampson County are $55,000 to $64,999 for men (1,446 | 9.5%) and $30,000 to $34,999 for women (1,099 | 9.2%).
| Income | Male | Female |
| $2,499 or less | 772 (5.1%) | 427 (3.6%) |
| $2,500 to $4,999 | 486 (3.2%) | 498 (4.2%) |
| $5,000 to $7,499 | 494 (3.2%) | 553 (4.6%) |
| $7,500 to $9,999 | 505 (3.3%) | 311 (2.6%) |
| $10,000 to $12,499 | 447 (2.9%) | 466 (3.9%) |
| $12,500 to $14,999 | 306 (2.0%) | 300 (2.5%) |
| $15,000 to $17,499 | 269 (1.8%) | 541 (4.5%) |
| $17,500 to $19,999 | 405 (2.7%) | 473 (4.0%) |
| $20,000 to $22,499 | 422 (2.8%) | 441 (3.7%) |
| $22,500 to $24,999 | 648 (4.3%) | 739 (6.2%) |
| $25,000 to $29,999 | 1,173 (7.7%) | 1,088 (9.1%) |
| $30,000 to $34,999 | 1,102 (7.2%) | 1,099 (9.2%) |
| $35,000 to $39,999 | 795 (5.2%) | 924 (7.7%) |
| $40,000 to $44,999 | 1,216 (8.0%) | 568 (4.8%) |
| $45,000 to $49,999 | 1,112 (7.3%) | 556 (4.7%) |
| $50,000 to $54,999 | 906 (5.9%) | 510 (4.3%) |
| $55,000 to $64,999 | 1,446 (9.5%) | 982 (8.2%) |
| $65,000 to $74,999 | 954 (6.3%) | 610 (5.1%) |
| $75,000 to $99,999 | 817 (5.4%) | 412 (3.5%) |
| $100,000+ | 966 (6.3%) | 429 (3.6%) |
| Total | 15,241 (100.0%) | 11,927 (100.0%) |
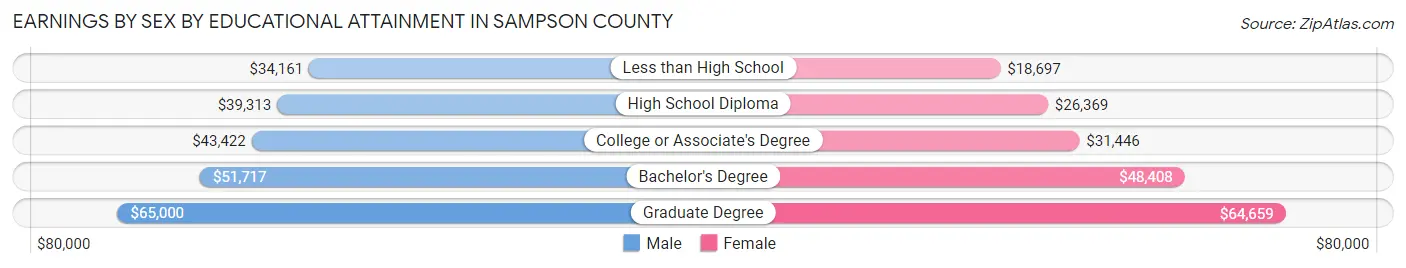
Earnings by Sex by Educational Attainment in Sampson County
Average earnings in Sampson County are $41,859 for men and $33,797 for women, a difference of 19.3%. Men with an educational attainment of graduate degree enjoy the highest average annual earnings of $65,000, while those with less than high school education earn the least with $34,161. Women with an educational attainment of graduate degree earn the most with the average annual earnings of $64,659, while those with less than high school education have the smallest earnings of $18,697.
| Educational Attainment | Male Income | Female Income |
| Less than High School | $34,161 | $18,697 |
| High School Diploma | $39,313 | $26,369 |
| College or Associate's Degree | $43,422 | $31,446 |
| Bachelor's Degree | $51,717 | $48,408 |
| Graduate Degree | $65,000 | $64,659 |
| Total | $41,859 | $33,797 |
Family Income in Sampson County
Family Income Brackets in Sampson County
According to the Sampson County family income data, there are 3,103 families falling into the $50,000 to $74,999 income range, which is the most common income bracket and makes up 20.8% of all families. Conversely, the $10,000 to $14,999 income bracket is the least frequent group with only 507 families (3.4%) belonging to this category.
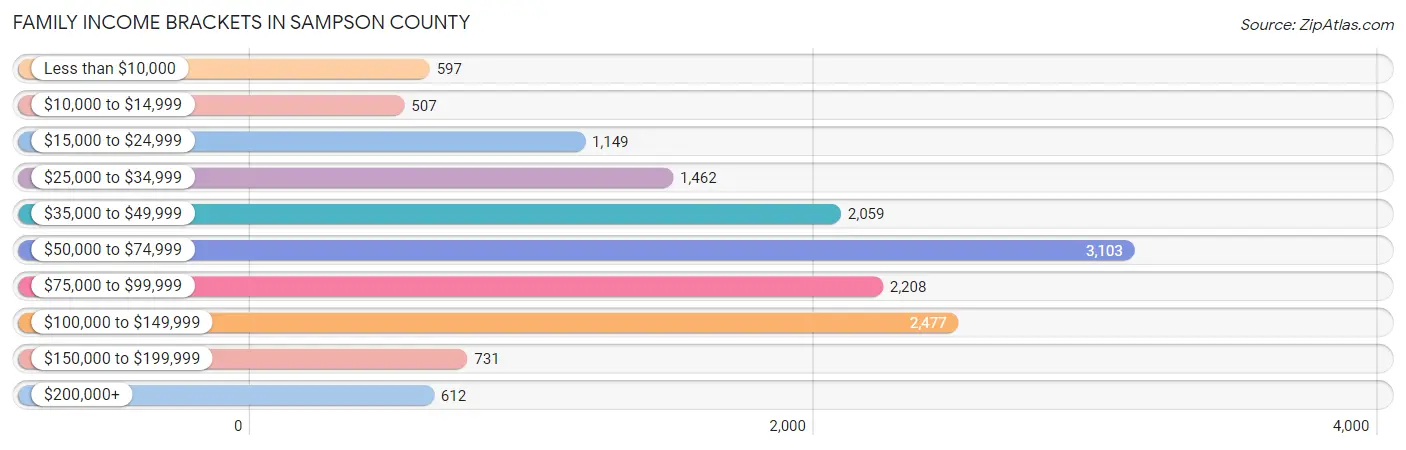
| Income Bracket | # Families | % Families |
| Less than $10,000 | 597 | 4.0% |
| $10,000 to $14,999 | 507 | 3.4% |
| $15,000 to $24,999 | 1,149 | 7.7% |
| $25,000 to $34,999 | 1,462 | 9.8% |
| $35,000 to $49,999 | 2,059 | 13.8% |
| $50,000 to $74,999 | 3,103 | 20.8% |
| $75,000 to $99,999 | 2,208 | 14.8% |
| $100,000 to $149,999 | 2,477 | 16.6% |
| $150,000 to $199,999 | 731 | 4.9% |
| $200,000+ | 612 | 4.1% |
Family Income by Famaliy Size in Sampson County
4-person families (2,053 | 13.8%) account for the highest median family income in Sampson County with $74,732 per family, while 2-person families (8,050 | 54.0%) have the highest median income of $28,068 per family member.

| Income Bracket | # Families | Median Income |
| 2-Person Families | 8,050 (54.0%) | $56,135 |
| 3-Person Families | 2,925 (19.6%) | $68,948 |
| 4-Person Families | 2,053 (13.8%) | $74,732 |
| 5-Person Families | 1,244 (8.3%) | $68,650 |
| 6-Person Families | 305 (2.0%) | $63,125 |
| 7+ Person Families | 342 (2.3%) | $0 |
| Total | 14,919 (100.0%) | $63,607 |
Family Income by Number of Earners in Sampson County
The median family income in Sampson County is $63,607, with families comprising 3+ earners (1,045) having the highest median family income of $109,609, while families with no earners (2,795) have the lowest median family income of $34,948, accounting for 7.0% and 18.7% of families, respectively.
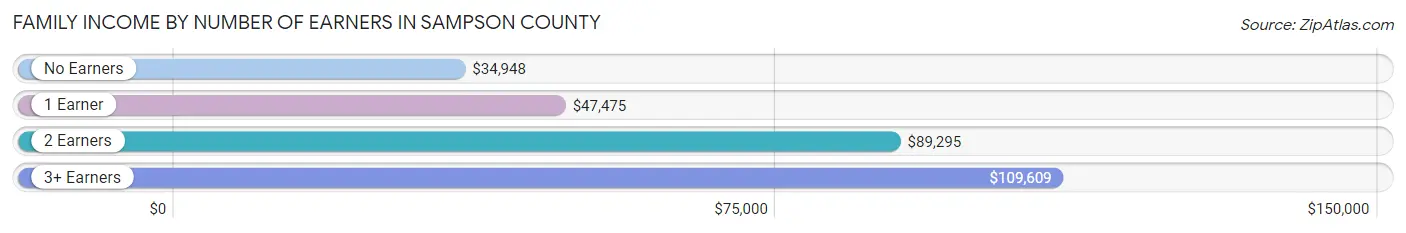
| Number of Earners | # Families | Median Income |
| No Earners | 2,795 (18.7%) | $34,948 |
| 1 Earner | 5,348 (35.8%) | $47,475 |
| 2 Earners | 5,731 (38.4%) | $89,295 |
| 3+ Earners | 1,045 (7.0%) | $109,609 |
| Total | 14,919 (100.0%) | $63,607 |
Household Income in Sampson County
Household Income Brackets in Sampson County
With 3,830 households falling in the category, the $50,000 to $74,999 income range is the most frequent in Sampson County, accounting for 17.9% of all households. In contrast, only 685 households (3.2%) fall into the $200,000+ income bracket, making it the least populous group.
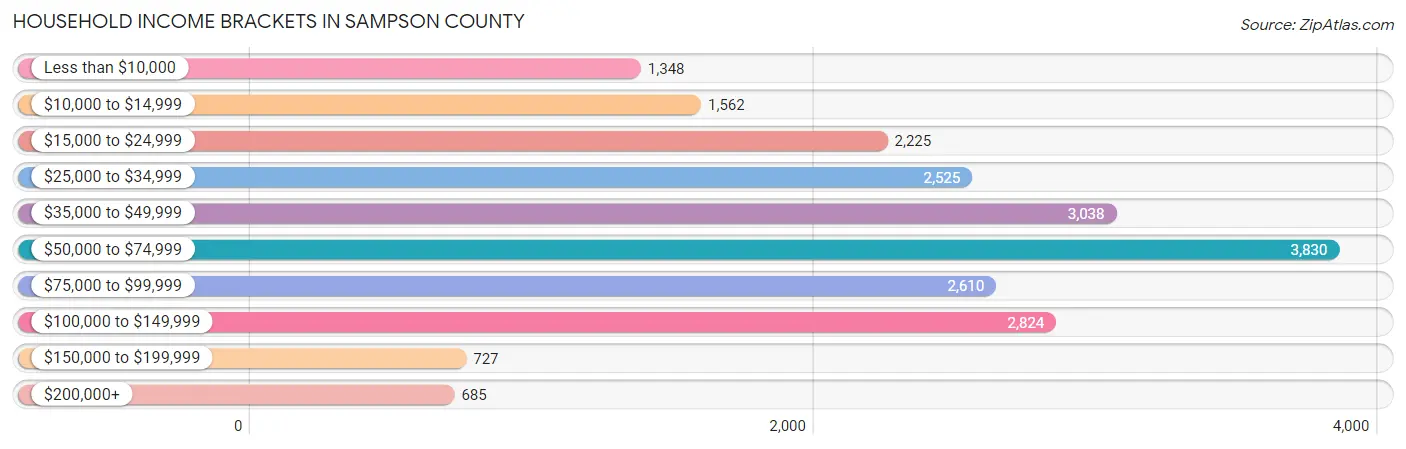
| Income Bracket | # Households | % Households |
| Less than $10,000 | 1,348 | 6.3% |
| $10,000 to $14,999 | 1,562 | 7.3% |
| $15,000 to $24,999 | 2,225 | 10.4% |
| $25,000 to $34,999 | 2,525 | 11.8% |
| $35,000 to $49,999 | 3,038 | 14.2% |
| $50,000 to $74,999 | 3,830 | 17.9% |
| $75,000 to $99,999 | 2,610 | 12.2% |
| $100,000 to $149,999 | 2,824 | 13.2% |
| $150,000 to $199,999 | 727 | 3.4% |
| $200,000+ | 685 | 3.2% |
Household Income by Householder Age in Sampson County
The median household income in Sampson County is $49,963, with the highest median household income of $58,033 found in the 45 to 64 years age bracket for the primary householder. A total of 8,570 households (40.1%) fall into this category. Meanwhile, the 65+ years age bracket for the primary householder has the lowest median household income of $37,415, with 6,541 households (30.6%) in this group.
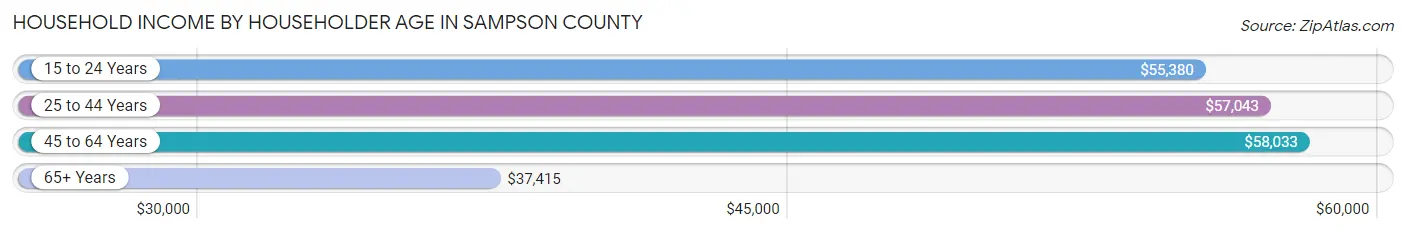
| Income Bracket | # Households | Median Income |
| 15 to 24 Years | 619 (2.9%) | $55,380 |
| 25 to 44 Years | 5,665 (26.5%) | $57,043 |
| 45 to 64 Years | 8,570 (40.1%) | $58,033 |
| 65+ Years | 6,541 (30.6%) | $37,415 |
| Total | 21,395 (100.0%) | $49,963 |
Poverty in Sampson County
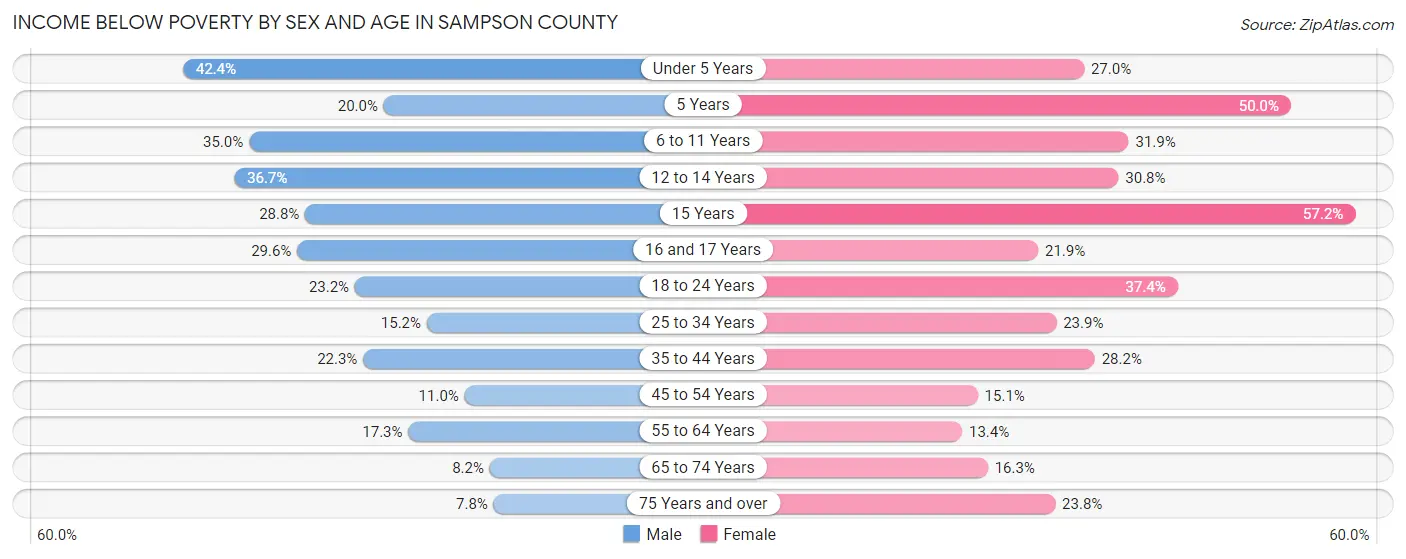
Income Below Poverty by Sex and Age in Sampson County
With 20.4% poverty level for males and 24.1% for females among the residents of Sampson County, under 5 year old males and 15 year old females are the most vulnerable to poverty, with 804 males (42.4%) and 271 females (57.2%) in their respective age groups living below the poverty level.
| Age Bracket | Male | Female |
| Under 5 Years | 804 (42.4%) | 465 (27.0%) |
| 5 Years | 91 (20.0%) | 208 (50.0%) |
| 6 to 11 Years | 810 (35.0%) | 751 (31.9%) |
| 12 to 14 Years | 484 (36.7%) | 328 (30.8%) |
| 15 Years | 92 (28.7%) | 271 (57.2%) |
| 16 and 17 Years | 292 (29.6%) | 160 (21.9%) |
| 18 to 24 Years | 622 (23.2%) | 928 (37.4%) |
| 25 to 34 Years | 517 (15.2%) | 792 (23.9%) |
| 35 to 44 Years | 744 (22.3%) | 959 (28.2%) |
| 45 to 54 Years | 429 (11.0%) | 548 (15.1%) |
| 55 to 64 Years | 659 (17.3%) | 492 (13.4%) |
| 65 to 74 Years | 229 (8.2%) | 592 (16.3%) |
| 75 Years and over | 133 (7.8%) | 559 (23.8%) |
| Total | 5,906 (20.4%) | 7,053 (24.1%) |
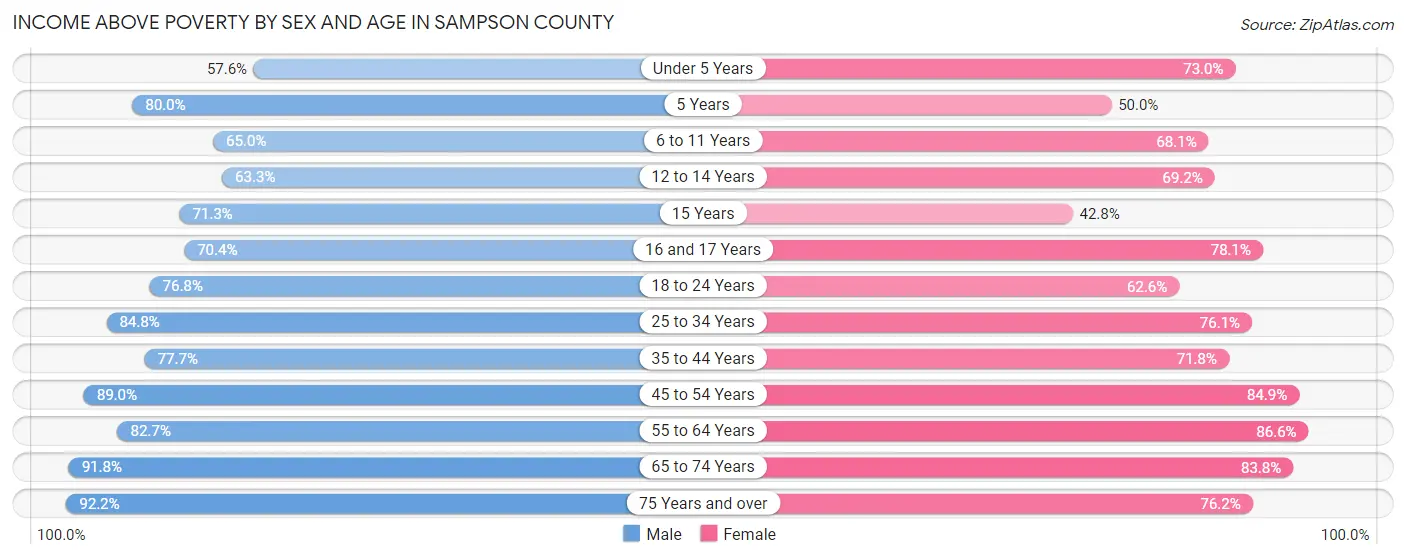
Income Above Poverty by Sex and Age in Sampson County
According to the poverty statistics in Sampson County, males aged 75 years and over and females aged 55 to 64 years are the age groups that are most secure financially, with 92.2% of males and 86.6% of females in these age groups living above the poverty line.
| Age Bracket | Male | Female |
| Under 5 Years | 1,093 (57.6%) | 1,259 (73.0%) |
| 5 Years | 364 (80.0%) | 208 (50.0%) |
| 6 to 11 Years | 1,504 (65.0%) | 1,600 (68.1%) |
| 12 to 14 Years | 836 (63.3%) | 737 (69.2%) |
| 15 Years | 228 (71.3%) | 203 (42.8%) |
| 16 and 17 Years | 693 (70.4%) | 572 (78.1%) |
| 18 to 24 Years | 2,058 (76.8%) | 1,553 (62.6%) |
| 25 to 34 Years | 2,885 (84.8%) | 2,525 (76.1%) |
| 35 to 44 Years | 2,594 (77.7%) | 2,445 (71.8%) |
| 45 to 54 Years | 3,474 (89.0%) | 3,073 (84.9%) |
| 55 to 64 Years | 3,158 (82.7%) | 3,183 (86.6%) |
| 65 to 74 Years | 2,566 (91.8%) | 3,051 (83.8%) |
| 75 Years and over | 1,580 (92.2%) | 1,794 (76.2%) |
| Total | 23,033 (79.6%) | 22,203 (75.9%) |
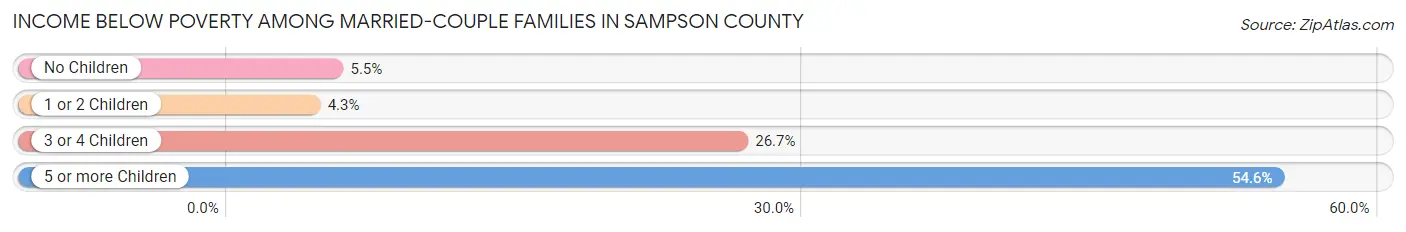
Income Below Poverty Among Married-Couple Families in Sampson County
The poverty statistics for married-couple families in Sampson County show that 7.3% or 757 of the total 10,432 families live below the poverty line. Families with 5 or more children have the highest poverty rate of 54.6%, comprising of 59 families. On the other hand, families with 1 or 2 children have the lowest poverty rate of 4.3%, which includes 124 families.
| Children | Above Poverty | Below Poverty |
| No Children | 6,311 (94.5%) | 368 (5.5%) |
| 1 or 2 Children | 2,748 (95.7%) | 124 (4.3%) |
| 3 or 4 Children | 567 (73.4%) | 206 (26.7%) |
| 5 or more Children | 49 (45.4%) | 59 (54.6%) |
| Total | 9,675 (92.7%) | 757 (7.3%) |
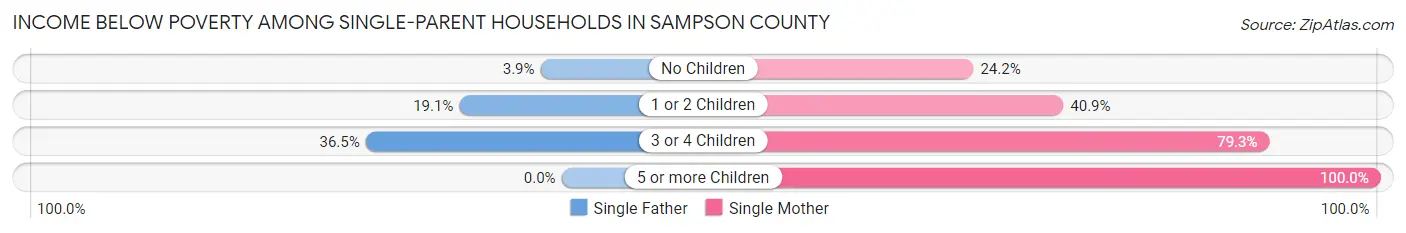
Income Below Poverty Among Single-Parent Households in Sampson County
According to the poverty data in Sampson County, 15.7% or 254 single-father households and 41.1% or 1,182 single-mother households are living below the poverty line. Among single-father households, those with 3 or 4 children have the highest poverty rate, with 81 households (36.5%) experiencing poverty. Likewise, among single-mother households, those with 5 or more children have the highest poverty rate, with 107 households (100.0%) falling below the poverty line.
| Children | Single Father | Single Mother |
| No Children | 24 (3.9%) | 296 (24.2%) |
| 1 or 2 Children | 149 (19.1%) | 473 (40.9%) |
| 3 or 4 Children | 81 (36.5%) | 306 (79.3%) |
| 5 or more Children | 0 (0.0%) | 107 (100.0%) |
| Total | 254 (15.7%) | 1,182 (41.1%) |
Income Below Poverty Among Married-Couple vs Single-Parent Households in Sampson County
The poverty data for Sampson County shows that 757 of the married-couple family households (7.3%) and 1,436 of the single-parent households (32.0%) are living below the poverty level. Within the married-couple family households, those with 5 or more children have the highest poverty rate, with 59 households (54.6%) falling below the poverty line. Among the single-parent households, those with 5 or more children have the highest poverty rate, with 107 household (100.0%) living below poverty.
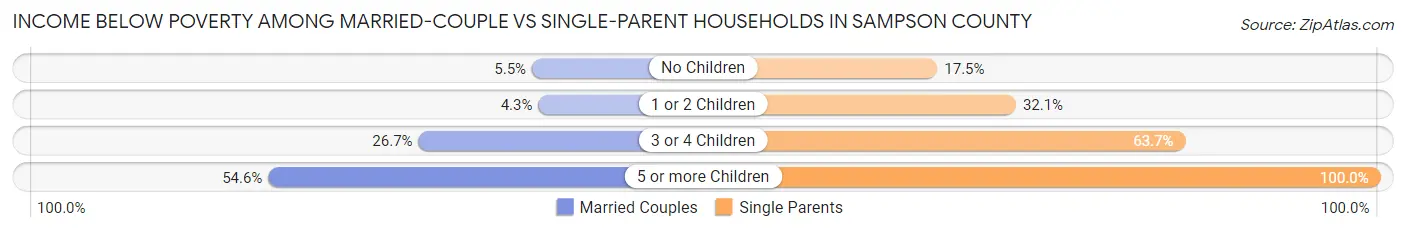
| Children | Married-Couple Families | Single-Parent Households |
| No Children | 368 (5.5%) | 320 (17.4%) |
| 1 or 2 Children | 124 (4.3%) | 622 (32.1%) |
| 3 or 4 Children | 206 (26.7%) | 387 (63.6%) |
| 5 or more Children | 59 (54.6%) | 107 (100.0%) |
| Total | 757 (7.3%) | 1,436 (32.0%) |
Race in Sampson County
The most populous races in Sampson County are White / Caucasian (33,200 | 56.0%), Black / African American (14,931 | 25.2%), and Hispanic or Latino (12,462 | 21.0%).
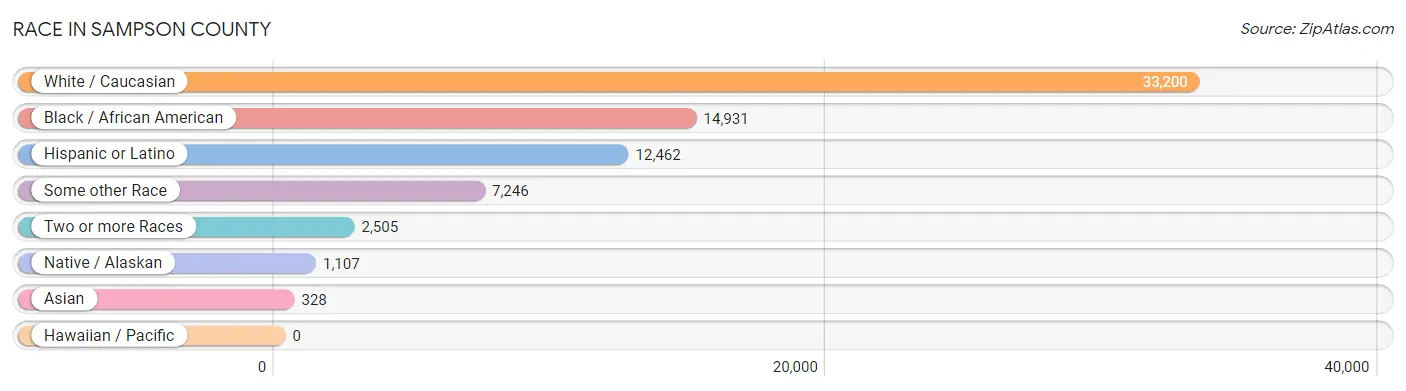
| Race | # Population | % Population |
| Asian | 328 | 0.5% |
| Black / African American | 14,931 | 25.2% |
| Hawaiian / Pacific | 0 | 0.0% |
| Hispanic or Latino | 12,462 | 21.0% |
| Native / Alaskan | 1,107 | 1.9% |
| White / Caucasian | 33,200 | 56.0% |
| Two or more Races | 2,505 | 4.2% |
| Some other Race | 7,246 | 12.2% |
| Total | 59,317 | 100.0% |
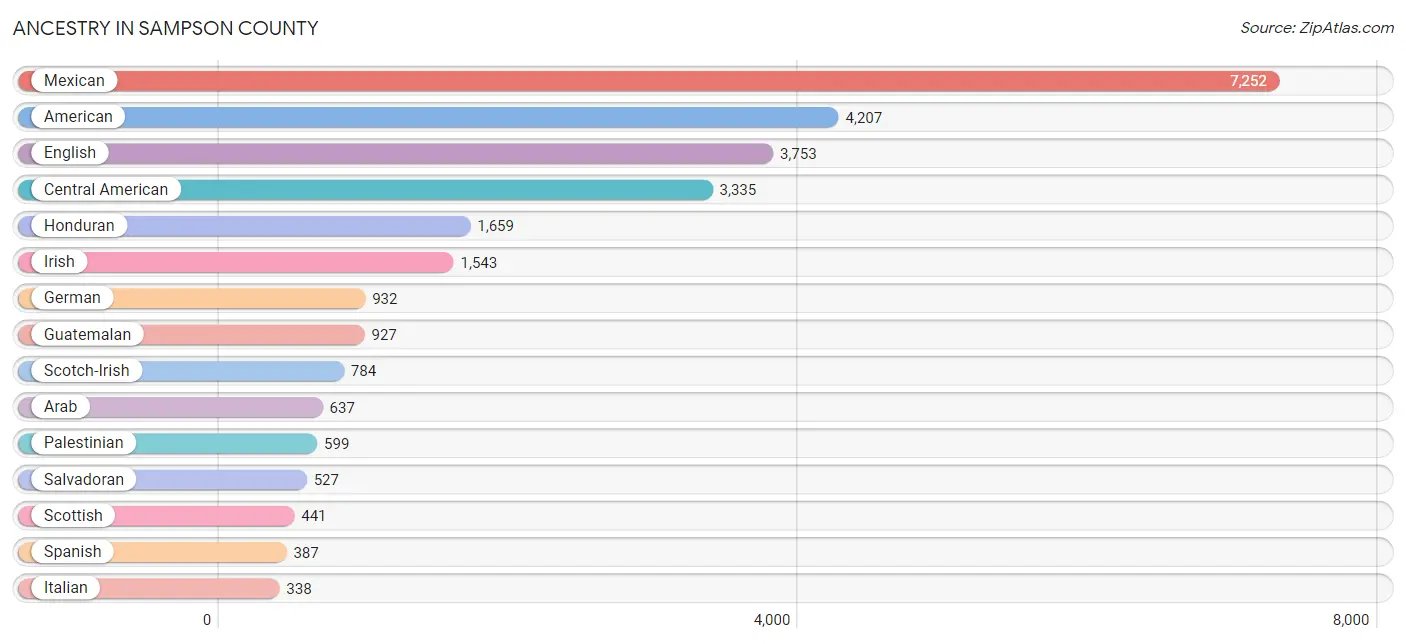
Ancestry in Sampson County
The most populous ancestries reported in Sampson County are Mexican (7,252 | 12.2%), American (4,207 | 7.1%), English (3,753 | 6.3%), Central American (3,335 | 5.6%), and Honduran (1,659 | 2.8%), together accounting for 34.1% of all Sampson County residents.
| Ancestry | # Population | % Population |
| African | 118 | 0.2% |
| American | 4,207 | 7.1% |
| Arab | 637 | 1.1% |
| Austrian | 17 | 0.0% |
| Belgian | 2 | 0.0% |
| Bhutanese | 46 | 0.1% |
| Blackfeet | 23 | 0.0% |
| British | 100 | 0.2% |
| British West Indian | 7 | 0.0% |
| Burmese | 55 | 0.1% |
| Canadian | 8 | 0.0% |
| Central American | 3,335 | 5.6% |
| Central American Indian | 187 | 0.3% |
| Cherokee | 264 | 0.4% |
| Chilean | 161 | 0.3% |
| Colombian | 87 | 0.2% |
| Costa Rican | 20 | 0.0% |
| Cuban | 134 | 0.2% |
| Czech | 12 | 0.0% |
| Czechoslovakian | 6 | 0.0% |
| Danish | 44 | 0.1% |
| Dominican | 145 | 0.2% |
| Dutch | 97 | 0.2% |
| Eastern European | 3 | 0.0% |
| Ecuadorian | 2 | 0.0% |
| English | 3,753 | 6.3% |
| Ethiopian | 1 | 0.0% |
| European | 240 | 0.4% |
| Finnish | 25 | 0.0% |
| French | 256 | 0.4% |
| French Canadian | 26 | 0.0% |
| German | 932 | 1.6% |
| Greek | 7 | 0.0% |
| Guatemalan | 927 | 1.6% |
| Guyanese | 19 | 0.0% |
| Haitian | 59 | 0.1% |
| Honduran | 1,659 | 2.8% |
| Hungarian | 29 | 0.1% |
| Indian (Asian) | 33 | 0.1% |
| Irish | 1,543 | 2.6% |
| Italian | 338 | 0.6% |
| Jamaican | 10 | 0.0% |
| Korean | 21 | 0.0% |
| Lebanese | 14 | 0.0% |
| Lithuanian | 46 | 0.1% |
| Lumbee | 256 | 0.4% |
| Mexican | 7,252 | 12.2% |
| Mexican American Indian | 64 | 0.1% |
| Nicaraguan | 63 | 0.1% |
| Nigerian | 34 | 0.1% |
| Northern European | 27 | 0.1% |
| Norwegian | 73 | 0.1% |
| Pakistani | 12 | 0.0% |
| Palestinian | 599 | 1.0% |
| Peruvian | 18 | 0.0% |
| Polish | 195 | 0.3% |
| Portuguese | 52 | 0.1% |
| Puerto Rican | 223 | 0.4% |
| Salvadoran | 527 | 0.9% |
| Scandinavian | 10 | 0.0% |
| Scotch-Irish | 784 | 1.3% |
| Scottish | 441 | 0.7% |
| Shoshone | 49 | 0.1% |
| Sioux | 29 | 0.1% |
| Slovak | 2 | 0.0% |
| South American | 293 | 0.5% |
| Spaniard | 20 | 0.0% |
| Spanish | 387 | 0.6% |
| Sri Lankan | 178 | 0.3% |
| Subsaharan African | 153 | 0.3% |
| Swedish | 29 | 0.1% |
| Swiss | 6 | 0.0% |
| Syrian | 10 | 0.0% |
| Thai | 73 | 0.1% |
| Trinidadian and Tobagonian | 49 | 0.1% |
| Venezuelan | 25 | 0.0% |
| Welsh | 93 | 0.2% |
| West Indian | 18 | 0.0% | View All 78 Rows |
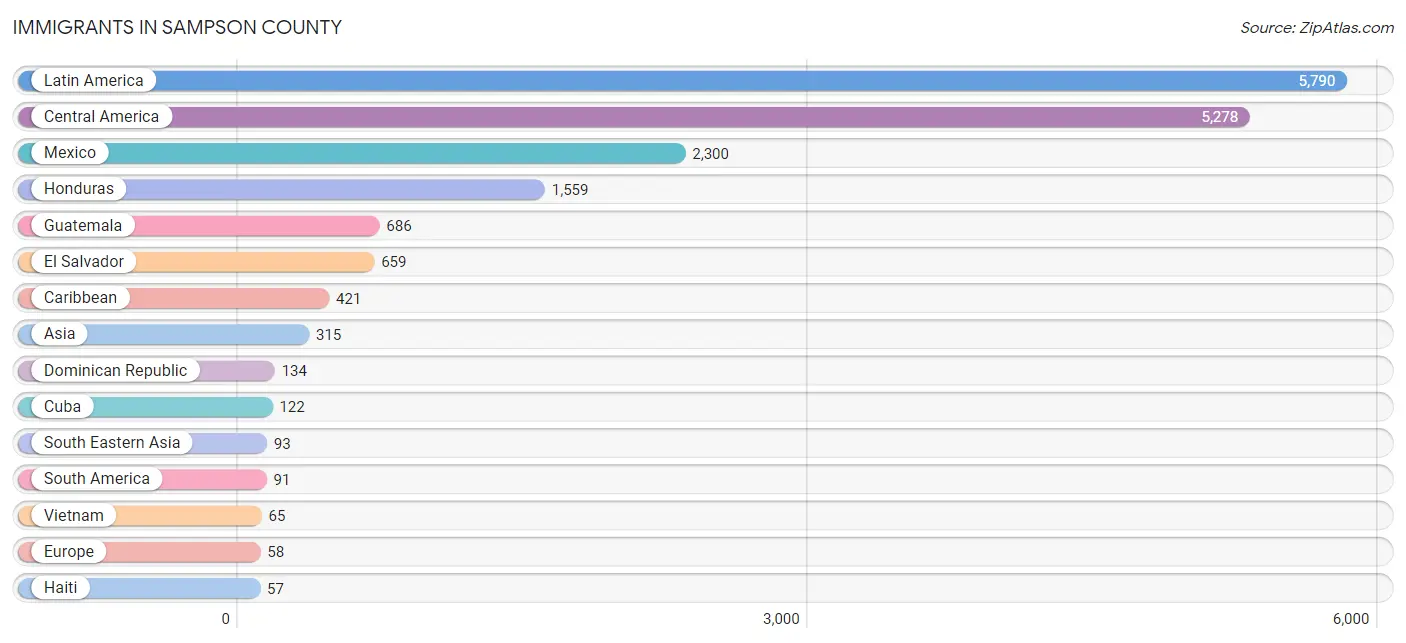
Immigrants in Sampson County
The most numerous immigrant groups reported in Sampson County came from Latin America (5,790 | 9.8%), Central America (5,278 | 8.9%), Mexico (2,300 | 3.9%), Honduras (1,559 | 2.6%), and Guatemala (686 | 1.2%), together accounting for 26.3% of all Sampson County residents.
| Immigration Origin | # Population | % Population |
| Africa | 21 | 0.0% |
| Asia | 315 | 0.5% |
| Azores | 22 | 0.0% |
| Barbados | 16 | 0.0% |
| Brazil | 3 | 0.0% |
| Caribbean | 421 | 0.7% |
| Central America | 5,278 | 8.9% |
| China | 11 | 0.0% |
| Colombia | 35 | 0.1% |
| Costa Rica | 20 | 0.0% |
| Cuba | 122 | 0.2% |
| Dominican Republic | 134 | 0.2% |
| Eastern Africa | 12 | 0.0% |
| Eastern Asia | 21 | 0.0% |
| Ecuador | 2 | 0.0% |
| El Salvador | 659 | 1.1% |
| Ethiopia | 1 | 0.0% |
| Europe | 58 | 0.1% |
| France | 3 | 0.0% |
| Germany | 15 | 0.0% |
| Ghana | 6 | 0.0% |
| Grenada | 7 | 0.0% |
| Guatemala | 686 | 1.2% |
| Guyana | 19 | 0.0% |
| Haiti | 57 | 0.1% |
| Honduras | 1,559 | 2.6% |
| India | 49 | 0.1% |
| Italy | 3 | 0.0% |
| Jamaica | 50 | 0.1% |
| Japan | 2 | 0.0% |
| Korea | 8 | 0.0% |
| Latin America | 5,790 | 9.8% |
| Mexico | 2,300 | 3.9% |
| Nepal | 7 | 0.0% |
| Nicaragua | 54 | 0.1% |
| Northern Europe | 15 | 0.0% |
| Peru | 12 | 0.0% |
| Philippines | 16 | 0.0% |
| Portugal | 22 | 0.0% |
| South Africa | 3 | 0.0% |
| South America | 91 | 0.2% |
| South Central Asia | 56 | 0.1% |
| South Eastern Asia | 93 | 0.2% |
| Southern Europe | 25 | 0.0% |
| Taiwan | 2 | 0.0% |
| Thailand | 12 | 0.0% |
| Trinidad and Tobago | 35 | 0.1% |
| Venezuela | 20 | 0.0% |
| Vietnam | 65 | 0.1% |
| Western Africa | 6 | 0.0% |
| Western Asia | 9 | 0.0% |
| Western Europe | 18 | 0.0% |
| Yemen | 9 | 0.0% | View All 53 Rows |
Sex and Age in Sampson County
Sex and Age in Sampson County
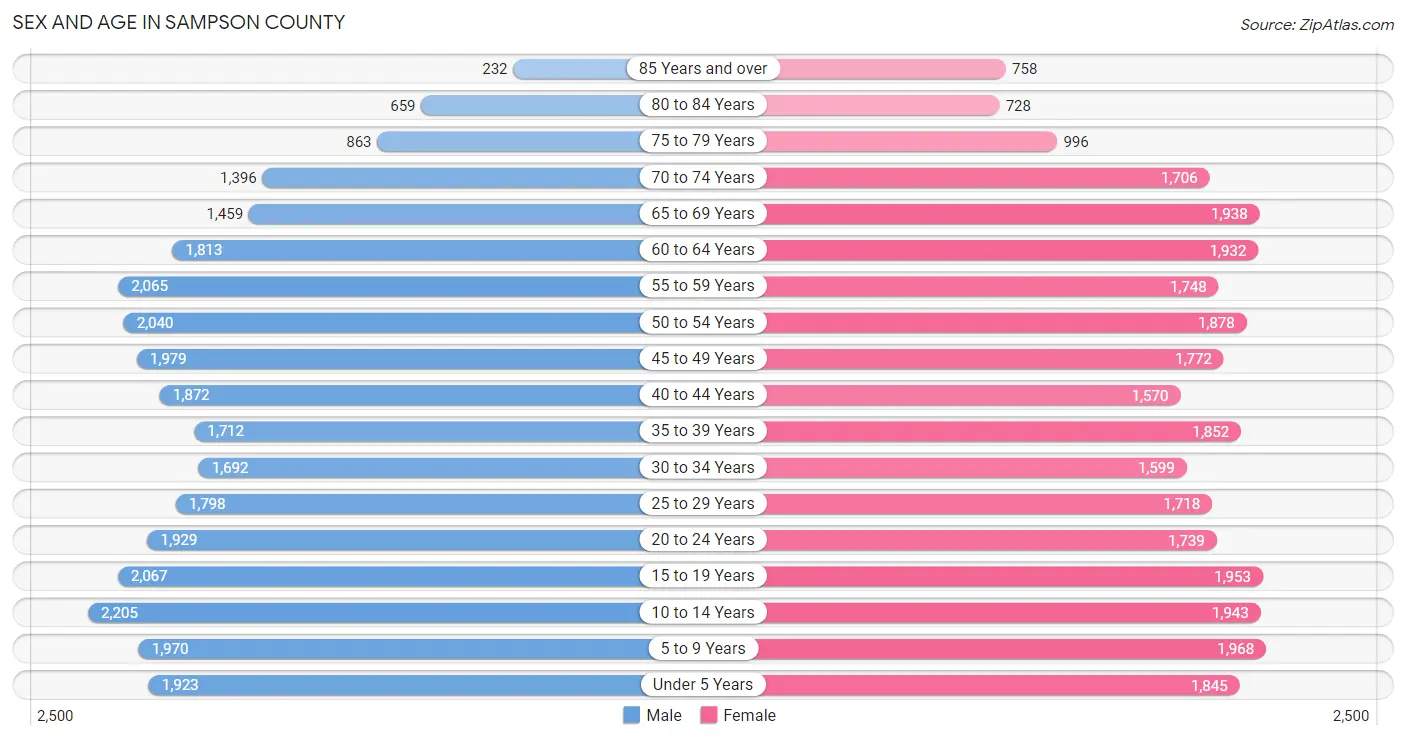
The most populous age groups in Sampson County are 10 to 14 Years (2,205 | 7.4%) for men and 5 to 9 Years (1,968 | 6.6%) for women.
| Age Bracket | Male | Female |
| Under 5 Years | 1,923 (6.5%) | 1,845 (6.2%) |
| 5 to 9 Years | 1,970 (6.6%) | 1,968 (6.6%) |
| 10 to 14 Years | 2,205 (7.4%) | 1,943 (6.6%) |
| 15 to 19 Years | 2,067 (7.0%) | 1,953 (6.6%) |
| 20 to 24 Years | 1,929 (6.5%) | 1,739 (5.9%) |
| 25 to 29 Years | 1,798 (6.1%) | 1,718 (5.8%) |
| 30 to 34 Years | 1,692 (5.7%) | 1,599 (5.4%) |
| 35 to 39 Years | 1,712 (5.8%) | 1,852 (6.2%) |
| 40 to 44 Years | 1,872 (6.3%) | 1,570 (5.3%) |
| 45 to 49 Years | 1,979 (6.7%) | 1,772 (6.0%) |
| 50 to 54 Years | 2,040 (6.9%) | 1,878 (6.3%) |
| 55 to 59 Years | 2,065 (7.0%) | 1,748 (5.9%) |
| 60 to 64 Years | 1,813 (6.1%) | 1,932 (6.5%) |
| 65 to 69 Years | 1,459 (4.9%) | 1,938 (6.5%) |
| 70 to 74 Years | 1,396 (4.7%) | 1,706 (5.8%) |
| 75 to 79 Years | 863 (2.9%) | 996 (3.4%) |
| 80 to 84 Years | 659 (2.2%) | 728 (2.5%) |
| 85 Years and over | 232 (0.8%) | 758 (2.6%) |
| Total | 29,674 (100.0%) | 29,643 (100.0%) |
Families and Households in Sampson County
Median Family Size in Sampson County
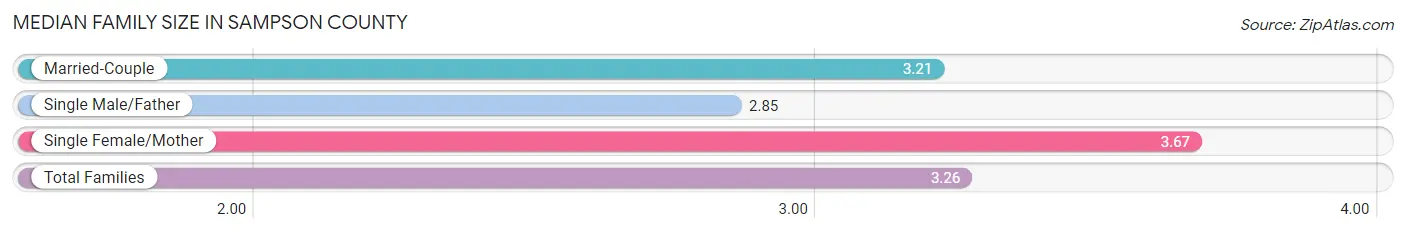
The median family size in Sampson County is 3.26 persons per family, with single female/mother families (2,873 | 19.3%) accounting for the largest median family size of 3.67 persons per family. On the other hand, single male/father families (1,614 | 10.8%) represent the smallest median family size with 2.85 persons per family.
| Family Type | # Families | Family Size |
| Married-Couple | 10,432 (69.9%) | 3.21 |
| Single Male/Father | 1,614 (10.8%) | 2.85 |
| Single Female/Mother | 2,873 (19.3%) | 3.67 |
| Total Families | 14,919 (100.0%) | 3.26 |
Median Household Size in Sampson County
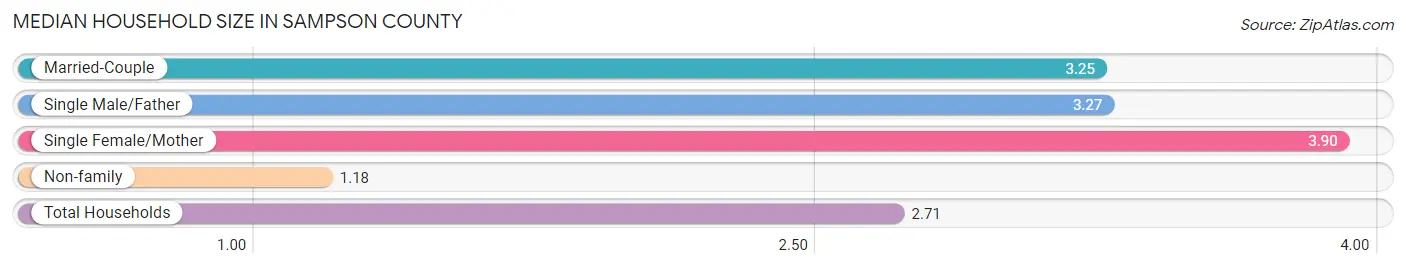
The median household size in Sampson County is 2.71 persons per household, with single female/mother households (2,873 | 13.4%) accounting for the largest median household size of 3.9 persons per household. non-family households (6,476 | 30.3%) represent the smallest median household size with 1.18 persons per household.
| Household Type | # Households | Household Size |
| Married-Couple | 10,432 (48.8%) | 3.25 |
| Single Male/Father | 1,614 (7.5%) | 3.27 |
| Single Female/Mother | 2,873 (13.4%) | 3.90 |
| Non-family | 6,476 (30.3%) | 1.18 |
| Total Households | 21,395 (100.0%) | 2.71 |
Household Size by Marriage Status in Sampson County
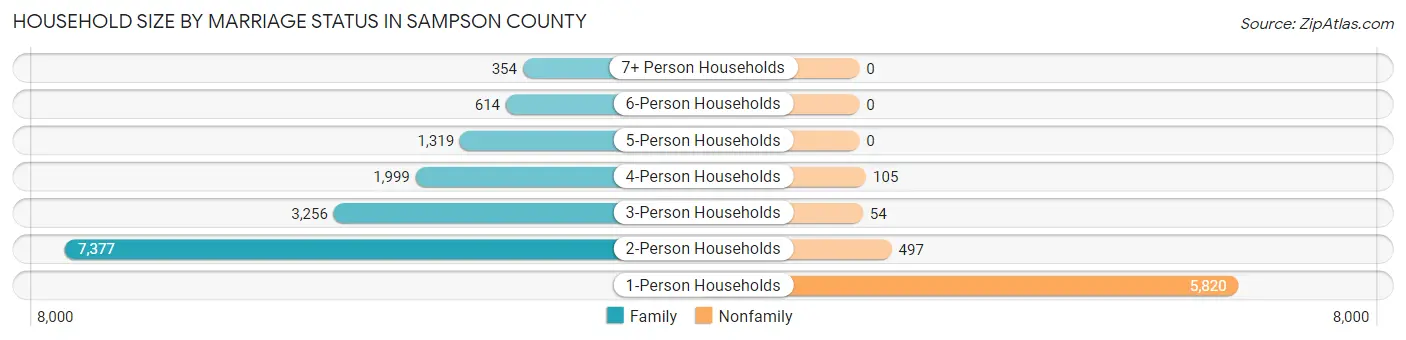
Out of a total of 21,395 households in Sampson County, 14,919 (69.7%) are family households, while 6,476 (30.3%) are nonfamily households. The most numerous type of family households are 2-person households, comprising 7,377, and the most common type of nonfamily households are 1-person households, comprising 5,820.
| Household Size | Family Households | Nonfamily Households |
| 1-Person Households | - | 5,820 (27.2%) |
| 2-Person Households | 7,377 (34.5%) | 497 (2.3%) |
| 3-Person Households | 3,256 (15.2%) | 54 (0.3%) |
| 4-Person Households | 1,999 (9.3%) | 105 (0.5%) |
| 5-Person Households | 1,319 (6.2%) | 0 (0.0%) |
| 6-Person Households | 614 (2.9%) | 0 (0.0%) |
| 7+ Person Households | 354 (1.7%) | 0 (0.0%) |
| Total | 14,919 (69.7%) | 6,476 (30.3%) |
Female Fertility in Sampson County
Fertility by Age in Sampson County
Average fertility rate in Sampson County is 66.0 births per 1,000 women. Women in the age bracket of 20 to 34 years have the highest fertility rate with 126.0 births per 1,000 women. Women in the age bracket of 20 to 34 years acount for 76.6% of all women with births.
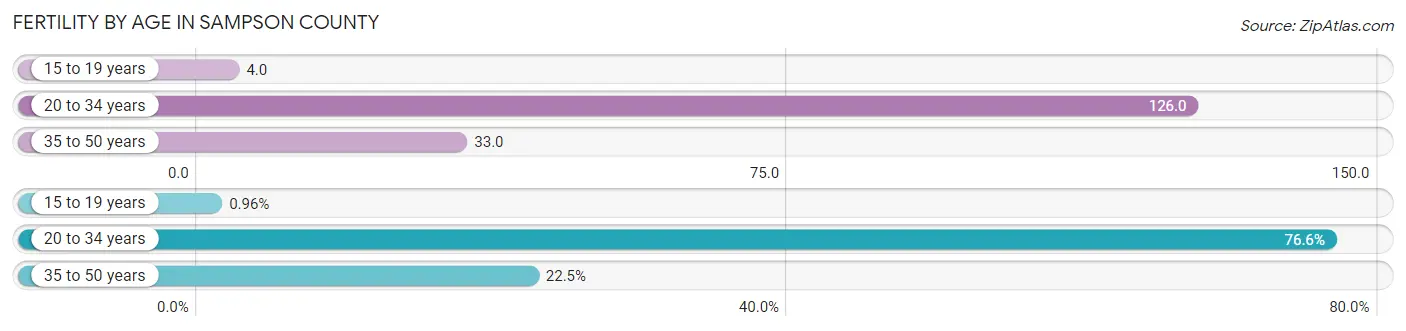
| Age Bracket | Women with Births | Births / 1,000 Women |
| 15 to 19 years | 8 (1.0%) | 4.0 |
| 20 to 34 years | 638 (76.6%) | 126.0 |
| 35 to 50 years | 187 (22.5%) | 33.0 |
| Total | 833 (100.0%) | 66.0 |
Fertility by Age by Marriage Status in Sampson County
38.2% of women with births (833) in Sampson County are married. The highest percentage of unmarried women with births falls into 15 to 19 years age bracket with 100.0% of them unmarried at the time of birth, while the lowest percentage of unmarried women with births belong to 35 to 50 years age bracket with 30.5% of them unmarried.
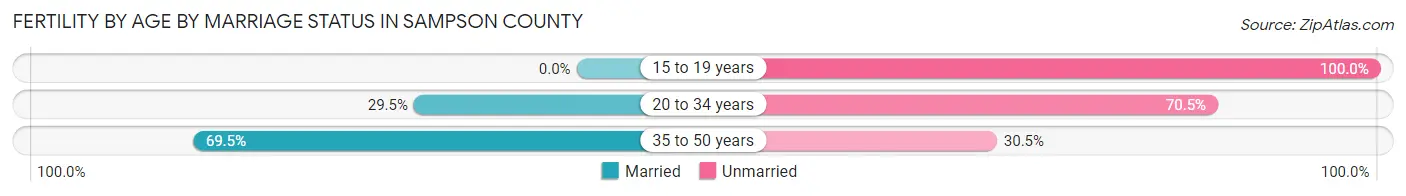
| Age Bracket | Married | Unmarried |
| 15 to 19 years | 0 (0.0%) | 8 (100.0%) |
| 20 to 34 years | 188 (29.5%) | 450 (70.5%) |
| 35 to 50 years | 130 (69.5%) | 57 (30.5%) |
| Total | 318 (38.2%) | 515 (61.8%) |
Fertility by Education in Sampson County
Average fertility rate in Sampson County is 66.0 births per 1,000 women. Women with the education attainment of high school diploma have the highest fertility rate of 152.0 births per 1,000 women, while women with the education attainment of graduate degree have the lowest fertility at 17.0 births per 1,000 women. Women with the education attainment of high school diploma represent 55.7% of all women with births.
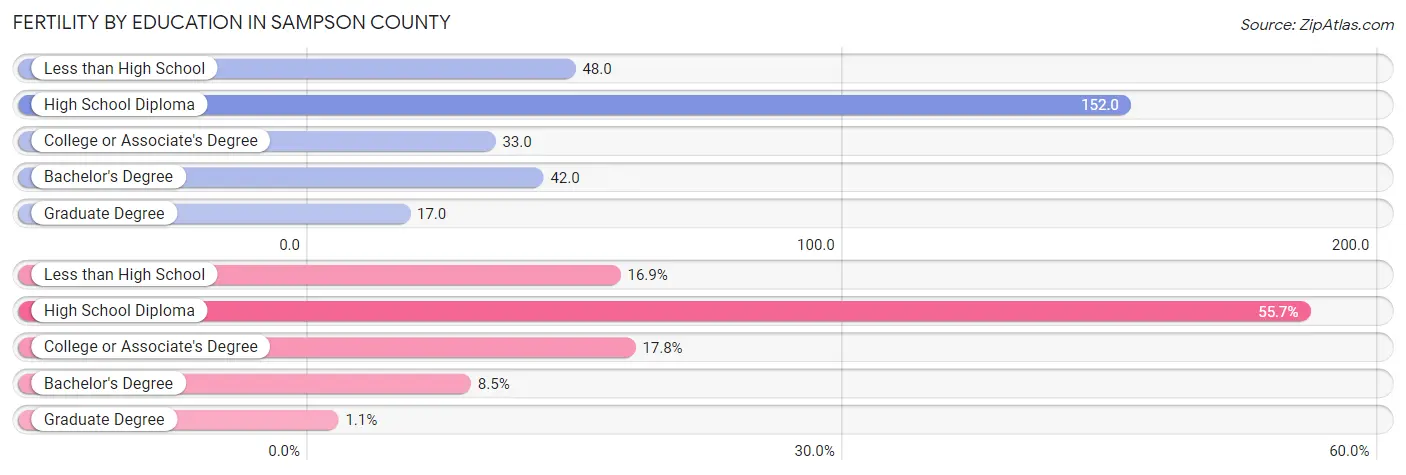
| Educational Attainment | Women with Births | Births / 1,000 Women |
| Less than High School | 141 (16.9%) | 48.0 |
| High School Diploma | 464 (55.7%) | 152.0 |
| College or Associate's Degree | 148 (17.8%) | 33.0 |
| Bachelor's Degree | 71 (8.5%) | 42.0 |
| Graduate Degree | 9 (1.1%) | 17.0 |
| Total | 833 (100.0%) | 66.0 |
Fertility by Education by Marriage Status in Sampson County
61.8% of women with births in Sampson County are unmarried. Women with the educational attainment of bachelor's degree are most likely to be married with 91.5% of them married at childbirth, while women with the educational attainment of high school diploma are least likely to be married with 76.9% of them unmarried at childbirth.
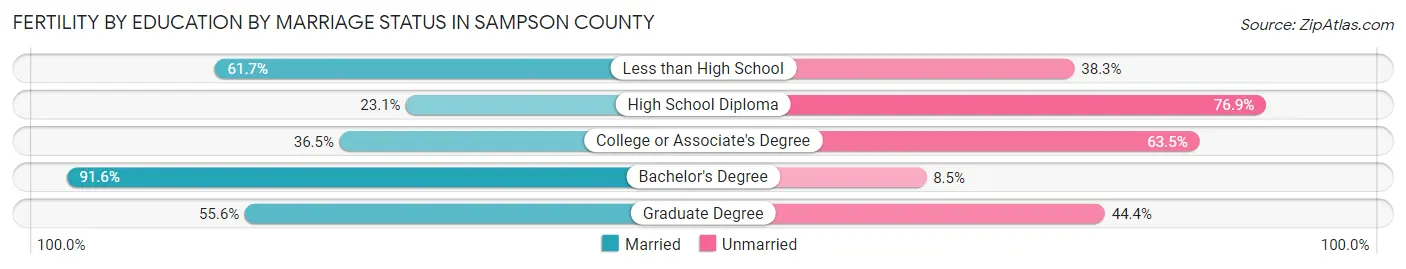
| Educational Attainment | Married | Unmarried |
| Less than High School | 87 (61.7%) | 54 (38.3%) |
| High School Diploma | 107 (23.1%) | 357 (76.9%) |
| College or Associate's Degree | 54 (36.5%) | 94 (63.5%) |
| Bachelor's Degree | 65 (91.5%) | 6 (8.5%) |
| Graduate Degree | 5 (55.6%) | 4 (44.4%) |
| Total | 318 (38.2%) | 515 (61.8%) |
Employment Characteristics in Sampson County
Employment by Class of Employer in Sampson County
Among the 24,170 employed individuals in Sampson County, private company employees (14,502 | 60.0%), self-employed (incorporated) (2,571 | 10.6%), and local government employees (1,754 | 7.3%) make up the most common classes of employment.
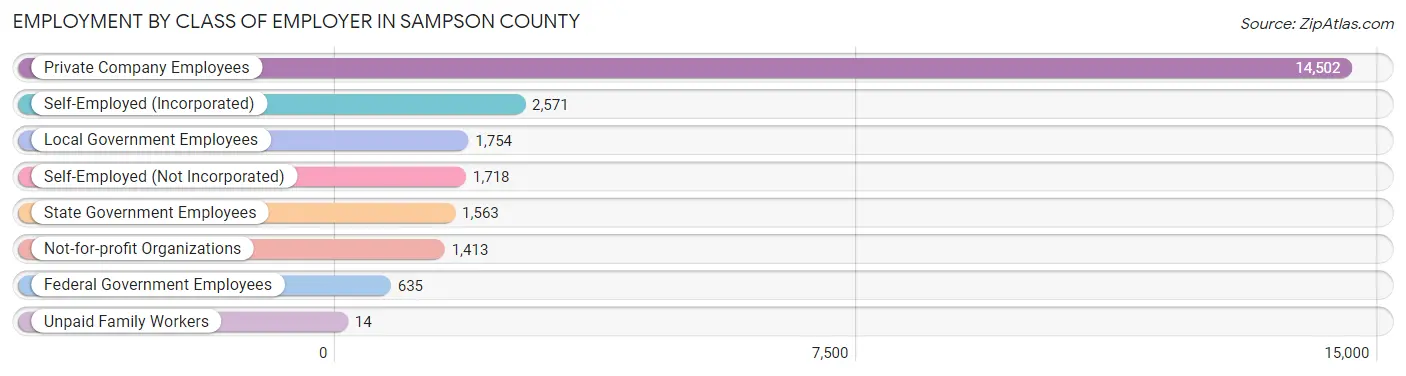
| Employer Class | # Employees | % Employees |
| Private Company Employees | 14,502 | 60.0% |
| Self-Employed (Incorporated) | 2,571 | 10.6% |
| Self-Employed (Not Incorporated) | 1,718 | 7.1% |
| Not-for-profit Organizations | 1,413 | 5.9% |
| Local Government Employees | 1,754 | 7.3% |
| State Government Employees | 1,563 | 6.5% |
| Federal Government Employees | 635 | 2.6% |
| Unpaid Family Workers | 14 | 0.1% |
| Total | 24,170 | 100.0% |
Employment Status by Age in Sampson County
According to the labor force statistics for Sampson County, out of the total population over 16 years of age (46,668), 56.7% or 26,461 individuals are in the labor force, with 5.7% or 1,508 of them unemployed. The age group with the highest labor force participation rate is 30 to 34 years, with 79.8% or 2,626 individuals in the labor force. Within the labor force, the 20 to 24 years age range has the highest percentage of unemployed individuals, with 14.3% or 390 of them being unemployed.
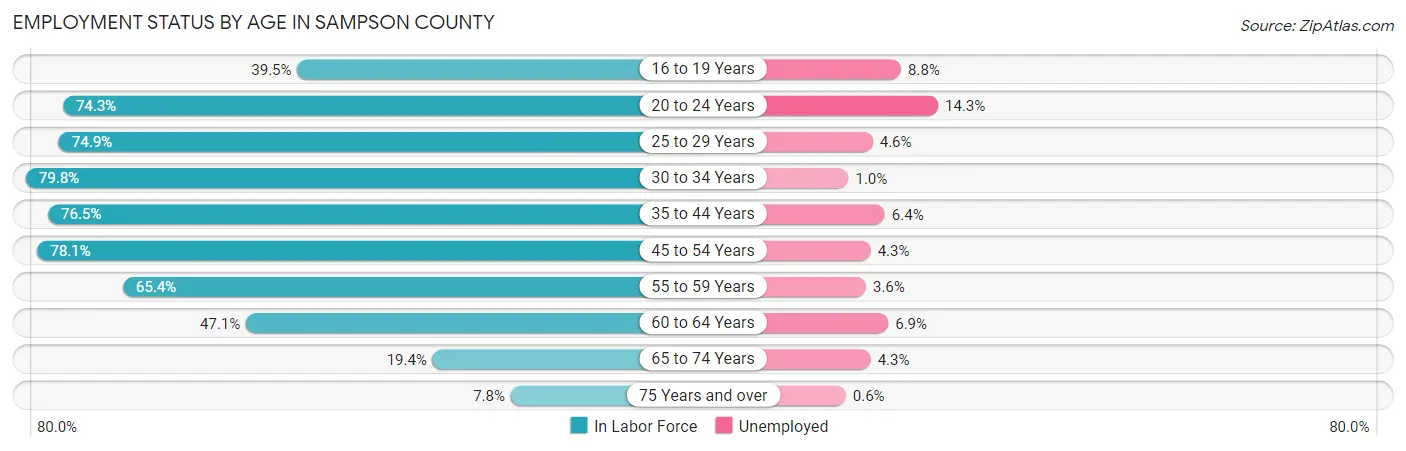
| Age Bracket | In Labor Force | Unemployed |
| 16 to 19 Years | 1,274 (39.5%) | 112 (8.8%) |
| 20 to 24 Years | 2,725 (74.3%) | 390 (14.3%) |
| 25 to 29 Years | 2,633 (74.9%) | 121 (4.6%) |
| 30 to 34 Years | 2,626 (79.8%) | 26 (1.0%) |
| 35 to 44 Years | 5,360 (76.5%) | 343 (6.4%) |
| 45 to 54 Years | 5,989 (78.1%) | 258 (4.3%) |
| 55 to 59 Years | 2,494 (65.4%) | 90 (3.6%) |
| 60 to 64 Years | 1,764 (47.1%) | 122 (6.9%) |
| 65 to 74 Years | 1,261 (19.4%) | 54 (4.3%) |
| 75 Years and over | 330 (7.8%) | 2 (0.6%) |
| Total | 26,461 (56.7%) | 1,508 (5.7%) |
Employment Status by Educational Attainment in Sampson County
According to labor force statistics for Sampson County, 71.9% of individuals (20,880) out of the total population between 25 and 64 years of age (29,040) are in the labor force, with 4.6% or 960 of them being unemployed. The group with the highest labor force participation rate are those with the educational attainment of bachelor's degree or higher, with 90.8% or 4,101 individuals in the labor force. Within the labor force, individuals with high school diploma education have the highest percentage of unemployment, with 6.2% or 417 of them being unemployed.
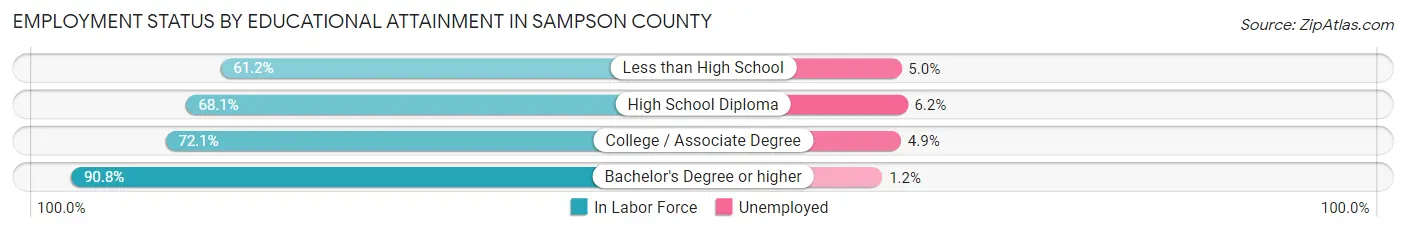
| Educational Attainment | In Labor Force | Unemployed |
| Less than High School | 2,947 (61.2%) | 241 (5.0%) |
| High School Diploma | 6,721 (68.1%) | 612 (6.2%) |
| College / Associate Degree | 7,092 (72.1%) | 482 (4.9%) |
| Bachelor's Degree or higher | 4,101 (90.8%) | 54 (1.2%) |
| Total | 20,880 (71.9%) | 1,336 (4.6%) |
Employment Occupations by Sex in Sampson County
Management, Business, Science and Arts Occupations
The most common Management, Business, Science and Arts occupations in Sampson County are Management (2,300 | 9.3%), Community & Social Service (2,167 | 8.7%), Education Instruction & Library (1,536 | 6.2%), Health Diagnosing & Treating (1,525 | 6.1%), and Health Technologists (1,132 | 4.6%).
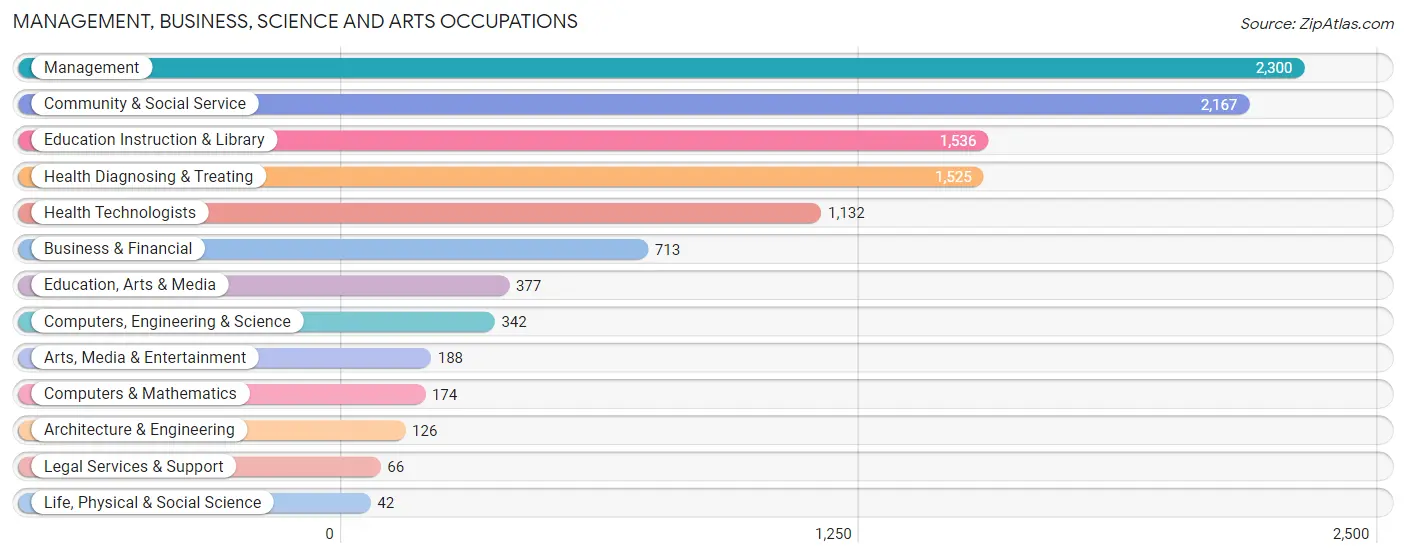
Management, Business, Science and Arts Occupations by Sex
Within the Management, Business, Science and Arts occupations in Sampson County, the most male-oriented occupations are Life, Physical & Social Science (100.0%), Architecture & Engineering (85.7%), and Computers, Engineering & Science (81.3%), while the most female-oriented occupations are Legal Services & Support (92.4%), Health Diagnosing & Treating (89.2%), and Health Technologists (87.2%).
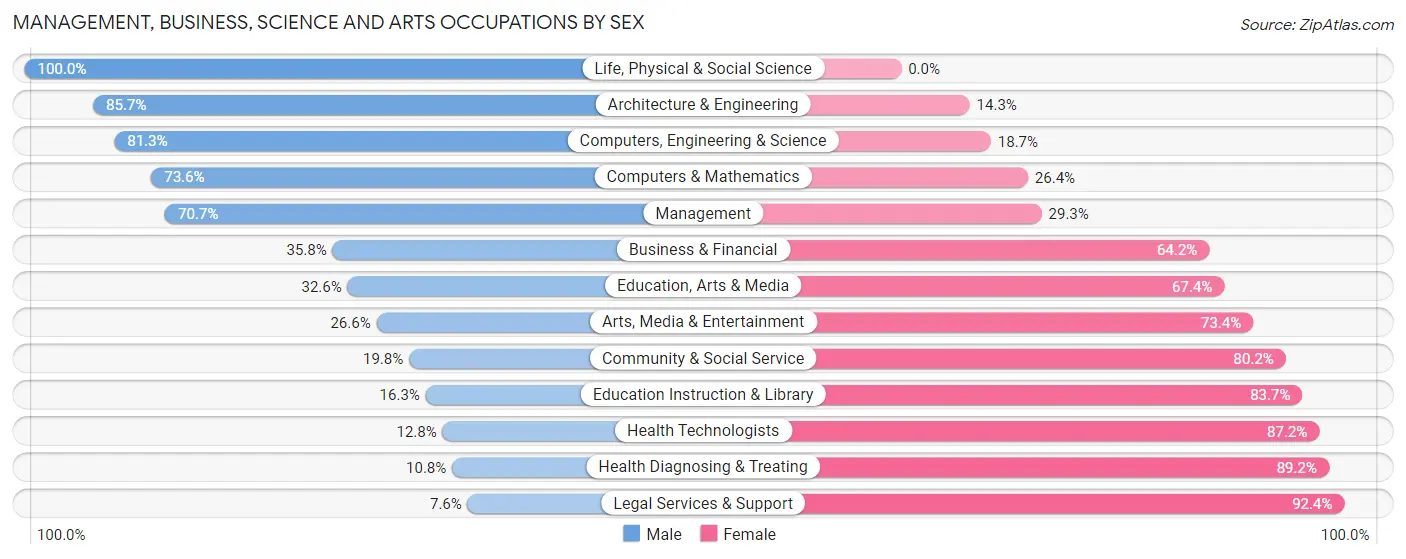
| Occupation | Male | Female |
| Management | 1,626 (70.7%) | 674 (29.3%) |
| Business & Financial | 255 (35.8%) | 458 (64.2%) |
| Computers, Engineering & Science | 278 (81.3%) | 64 (18.7%) |
| Computers & Mathematics | 128 (73.6%) | 46 (26.4%) |
| Architecture & Engineering | 108 (85.7%) | 18 (14.3%) |
| Life, Physical & Social Science | 42 (100.0%) | 0 (0.0%) |
| Community & Social Service | 429 (19.8%) | 1,738 (80.2%) |
| Education, Arts & Media | 123 (32.6%) | 254 (67.4%) |
| Legal Services & Support | 5 (7.6%) | 61 (92.4%) |
| Education Instruction & Library | 251 (16.3%) | 1,285 (83.7%) |
| Arts, Media & Entertainment | 50 (26.6%) | 138 (73.4%) |
| Health Diagnosing & Treating | 165 (10.8%) | 1,360 (89.2%) |
| Health Technologists | 145 (12.8%) | 987 (87.2%) |
| Total (Category) | 2,753 (39.1%) | 4,294 (60.9%) |
| Total (Overall) | 13,706 (55.3%) | 11,093 (44.7%) |
Services Occupations
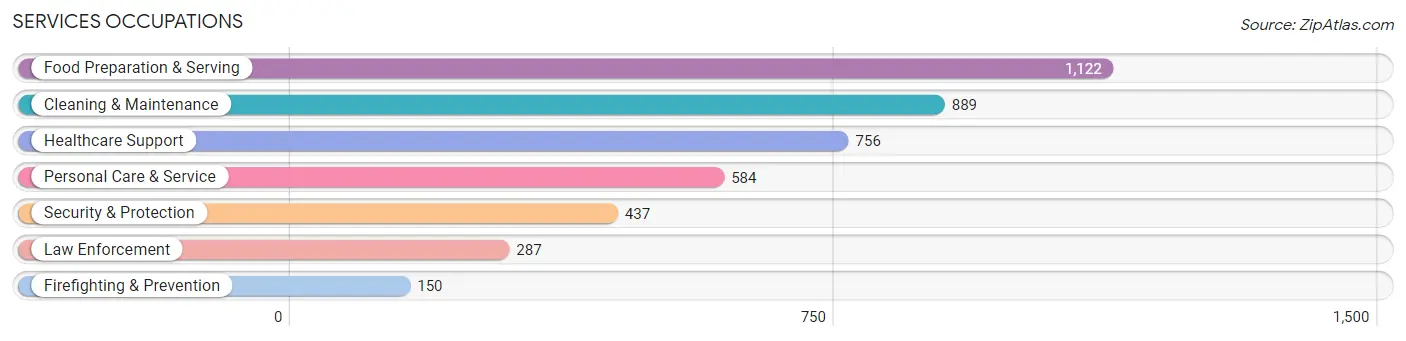
The most common Services occupations in Sampson County are Food Preparation & Serving (1,122 | 4.5%), Cleaning & Maintenance (889 | 3.6%), Healthcare Support (756 | 3.0%), Personal Care & Service (584 | 2.4%), and Security & Protection (437 | 1.8%).
Services Occupations by Sex
Within the Services occupations in Sampson County, the most male-oriented occupations are Firefighting & Prevention (78.7%), Security & Protection (75.7%), and Law Enforcement (74.2%), while the most female-oriented occupations are Healthcare Support (88.2%), Food Preparation & Serving (63.3%), and Personal Care & Service (60.3%).
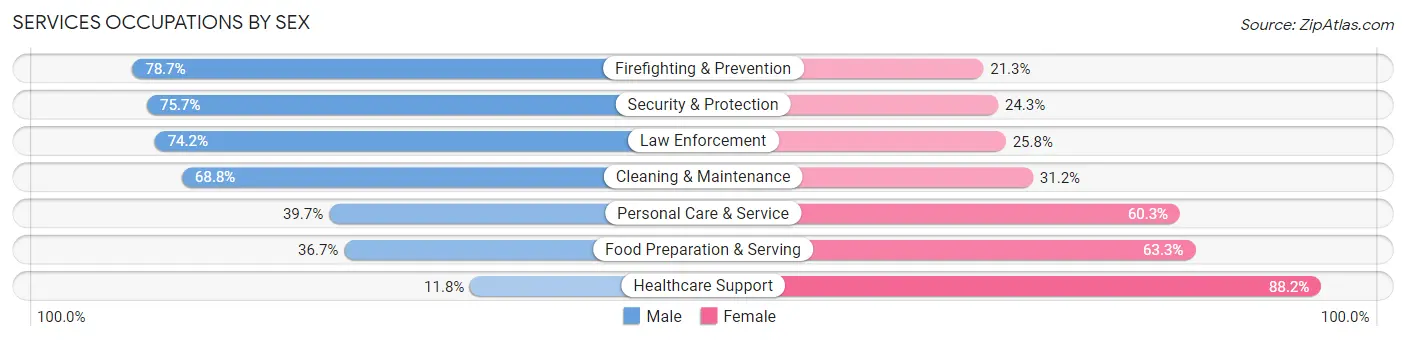
| Occupation | Male | Female |
| Healthcare Support | 89 (11.8%) | 667 (88.2%) |
| Security & Protection | 331 (75.7%) | 106 (24.3%) |
| Firefighting & Prevention | 118 (78.7%) | 32 (21.3%) |
| Law Enforcement | 213 (74.2%) | 74 (25.8%) |
| Food Preparation & Serving | 412 (36.7%) | 710 (63.3%) |
| Cleaning & Maintenance | 612 (68.8%) | 277 (31.2%) |
| Personal Care & Service | 232 (39.7%) | 352 (60.3%) |
| Total (Category) | 1,676 (44.2%) | 2,112 (55.8%) |
| Total (Overall) | 13,706 (55.3%) | 11,093 (44.7%) |
Sales and Office Occupations
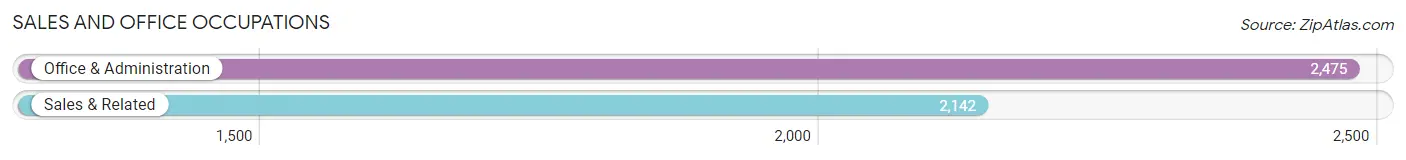
The most common Sales and Office occupations in Sampson County are Office & Administration (2,475 | 10.0%), and Sales & Related (2,142 | 8.6%).
Sales and Office Occupations by Sex
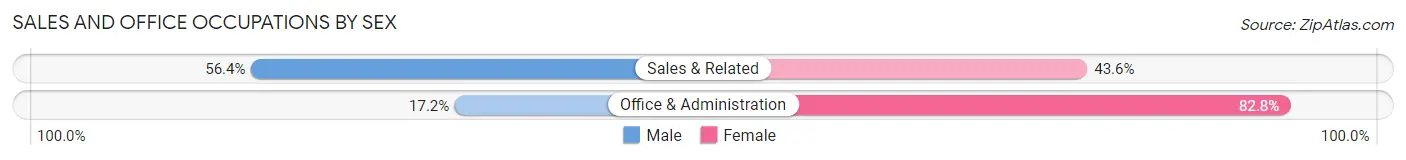
| Occupation | Male | Female |
| Sales & Related | 1,208 (56.4%) | 934 (43.6%) |
| Office & Administration | 426 (17.2%) | 2,049 (82.8%) |
| Total (Category) | 1,634 (35.4%) | 2,983 (64.6%) |
| Total (Overall) | 13,706 (55.3%) | 11,093 (44.7%) |
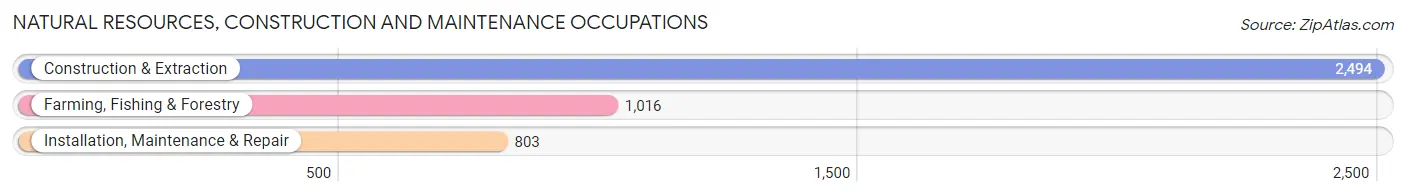
Natural Resources, Construction and Maintenance Occupations
The most common Natural Resources, Construction and Maintenance occupations in Sampson County are Construction & Extraction (2,494 | 10.1%), Farming, Fishing & Forestry (1,016 | 4.1%), and Installation, Maintenance & Repair (803 | 3.2%).
Natural Resources, Construction and Maintenance Occupations by Sex
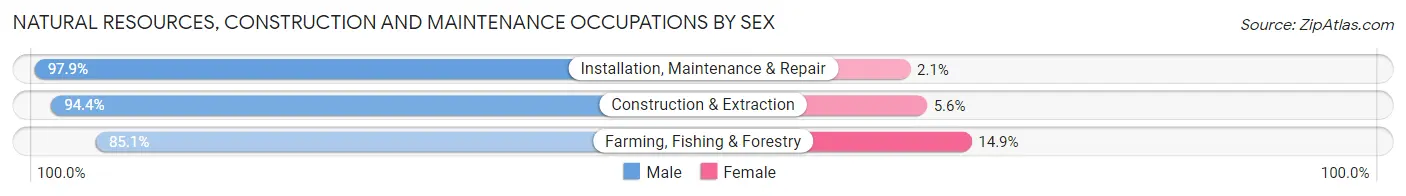
| Occupation | Male | Female |
| Farming, Fishing & Forestry | 865 (85.1%) | 151 (14.9%) |
| Construction & Extraction | 2,355 (94.4%) | 139 (5.6%) |
| Installation, Maintenance & Repair | 786 (97.9%) | 17 (2.1%) |
| Total (Category) | 4,006 (92.9%) | 307 (7.1%) |
| Total (Overall) | 13,706 (55.3%) | 11,093 (44.7%) |
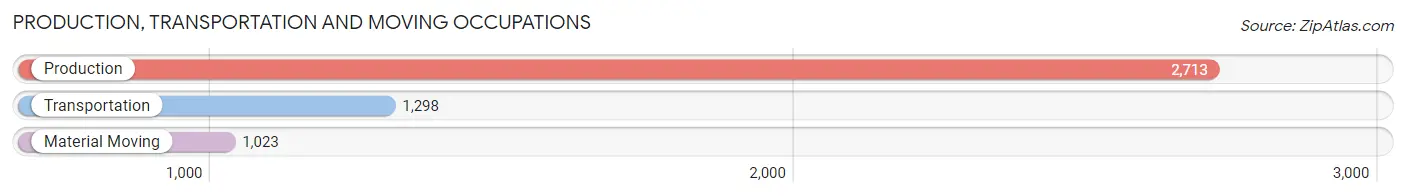
Production, Transportation and Moving Occupations
The most common Production, Transportation and Moving occupations in Sampson County are Production (2,713 | 10.9%), Transportation (1,298 | 5.2%), and Material Moving (1,023 | 4.1%).
Production, Transportation and Moving Occupations by Sex
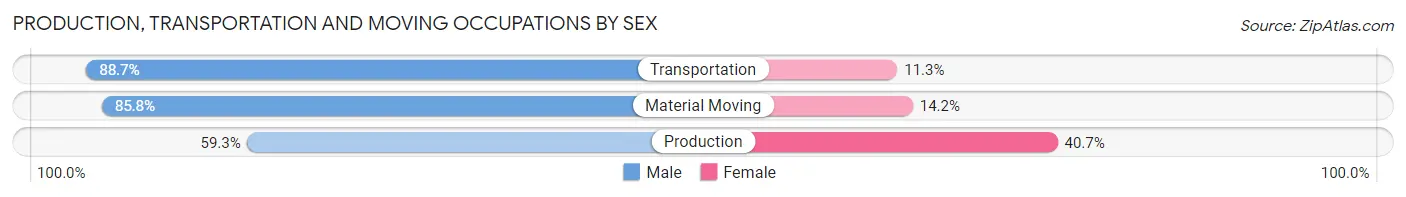
| Occupation | Male | Female |
| Production | 1,608 (59.3%) | 1,105 (40.7%) |
| Transportation | 1,151 (88.7%) | 147 (11.3%) |
| Material Moving | 878 (85.8%) | 145 (14.2%) |
| Total (Category) | 3,637 (72.3%) | 1,397 (27.8%) |
| Total (Overall) | 13,706 (55.3%) | 11,093 (44.7%) |
Employment Industries by Sex in Sampson County
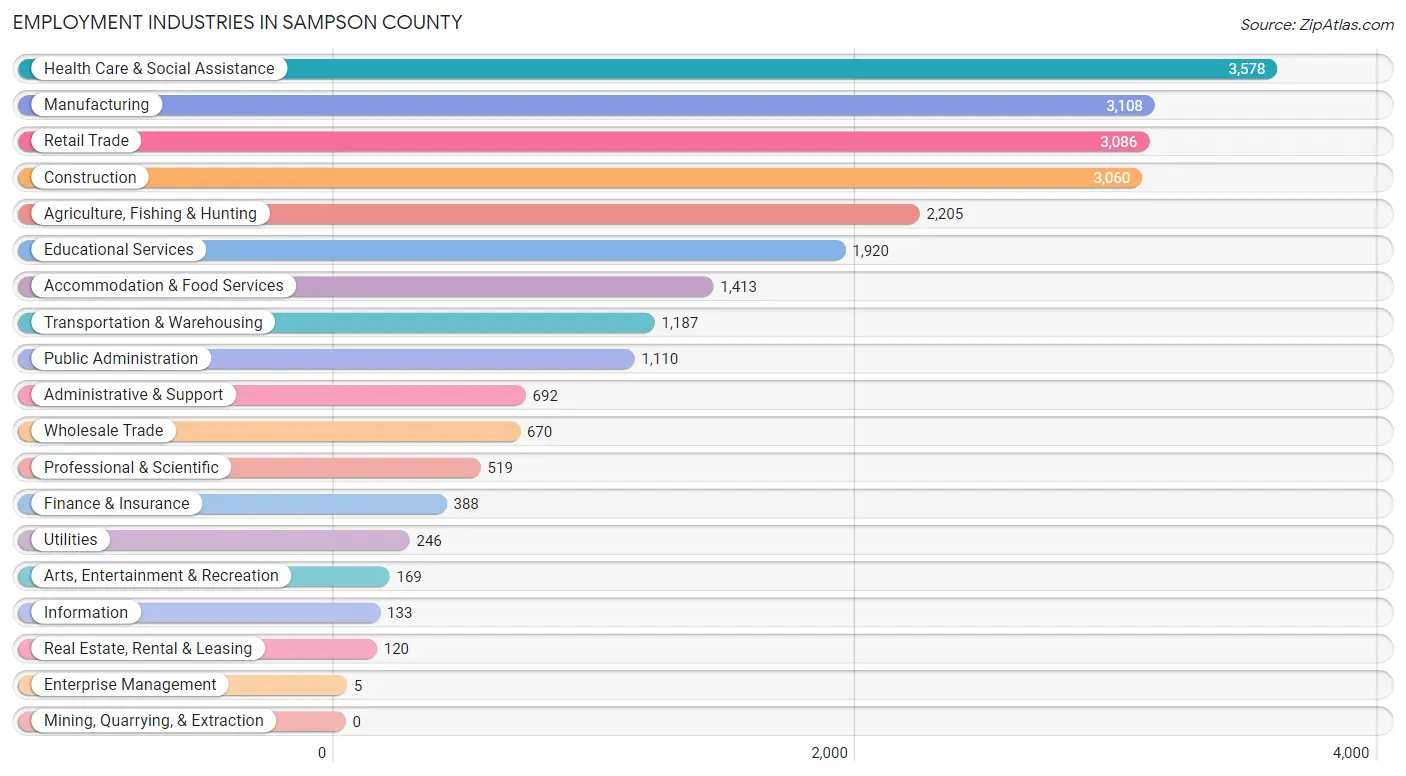
Employment Industries in Sampson County
The major employment industries in Sampson County include Health Care & Social Assistance (3,578 | 14.4%), Manufacturing (3,108 | 12.5%), Retail Trade (3,086 | 12.4%), Construction (3,060 | 12.3%), and Agriculture, Fishing & Hunting (2,205 | 8.9%).
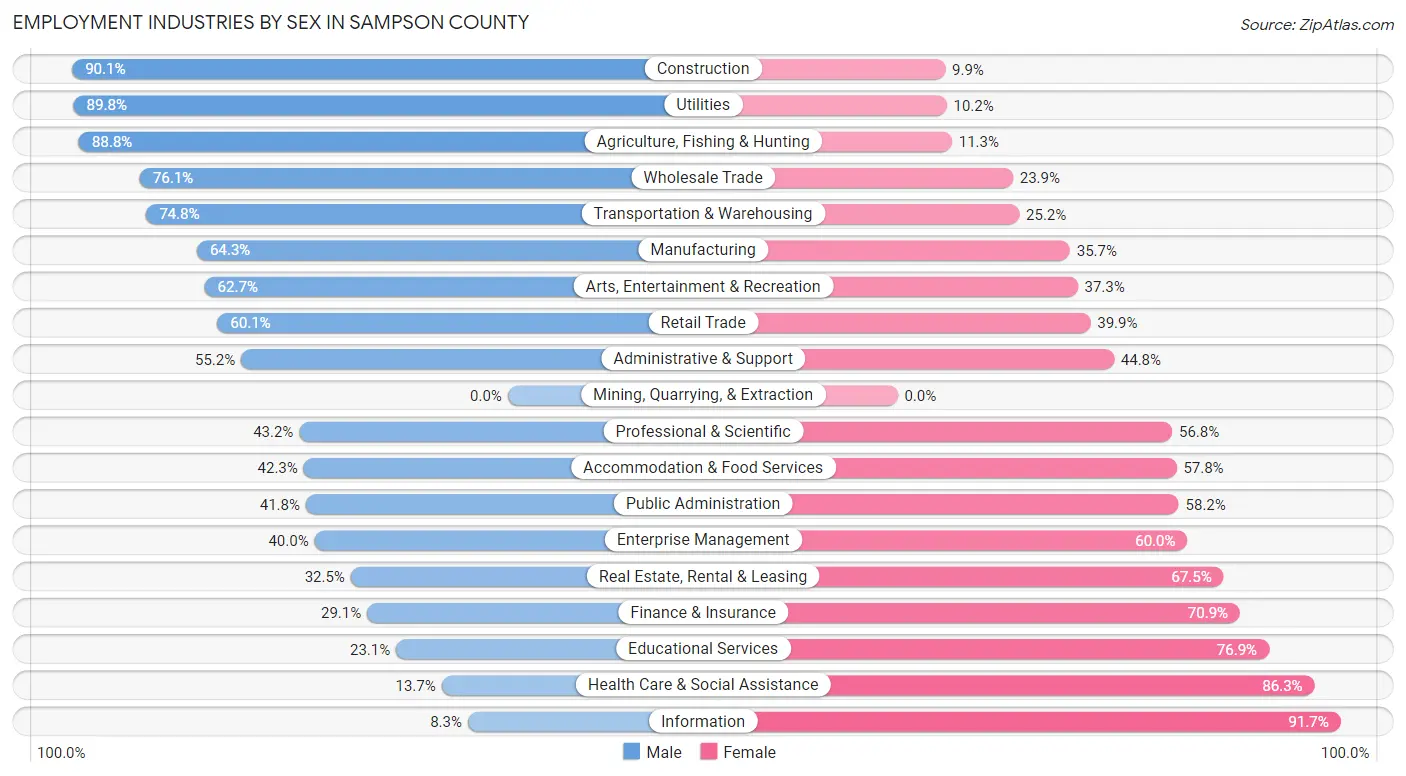
Employment Industries by Sex in Sampson County
The Sampson County industries that see more men than women are Construction (90.1%), Utilities (89.8%), and Agriculture, Fishing & Hunting (88.7%), whereas the industries that tend to have a higher number of women are Information (91.7%), Health Care & Social Assistance (86.3%), and Educational Services (76.9%).
| Industry | Male | Female |
| Agriculture, Fishing & Hunting | 1,957 (88.7%) | 248 (11.3%) |
| Mining, Quarrying, & Extraction | 0 (0.0%) | 0 (0.0%) |
| Construction | 2,758 (90.1%) | 302 (9.9%) |
| Manufacturing | 1,999 (64.3%) | 1,109 (35.7%) |
| Wholesale Trade | 510 (76.1%) | 160 (23.9%) |
| Retail Trade | 1,854 (60.1%) | 1,232 (39.9%) |
| Transportation & Warehousing | 888 (74.8%) | 299 (25.2%) |
| Utilities | 221 (89.8%) | 25 (10.2%) |
| Information | 11 (8.3%) | 122 (91.7%) |
| Finance & Insurance | 113 (29.1%) | 275 (70.9%) |
| Real Estate, Rental & Leasing | 39 (32.5%) | 81 (67.5%) |
| Professional & Scientific | 224 (43.2%) | 295 (56.8%) |
| Enterprise Management | 2 (40.0%) | 3 (60.0%) |
| Administrative & Support | 382 (55.2%) | 310 (44.8%) |
| Educational Services | 444 (23.1%) | 1,476 (76.9%) |
| Health Care & Social Assistance | 490 (13.7%) | 3,088 (86.3%) |
| Arts, Entertainment & Recreation | 106 (62.7%) | 63 (37.3%) |
| Accommodation & Food Services | 597 (42.2%) | 816 (57.8%) |
| Public Administration | 464 (41.8%) | 646 (58.2%) |
| Total | 13,706 (55.3%) | 11,093 (44.7%) |
Education in Sampson County
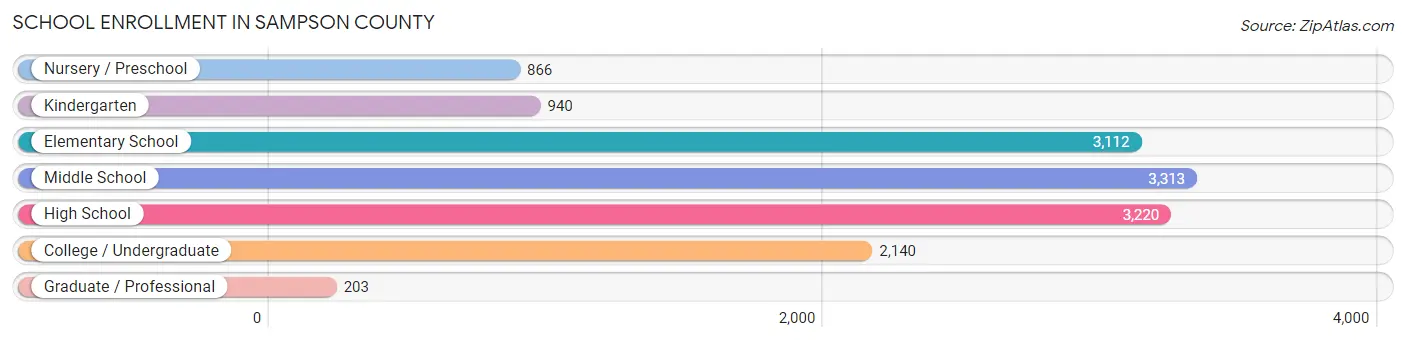
School Enrollment in Sampson County
The most common levels of schooling among the 13,794 students in Sampson County are middle school (3,313 | 24.0%), high school (3,220 | 23.3%), and elementary school (3,112 | 22.6%).
| School Level | # Students | % Students |
| Nursery / Preschool | 866 | 6.3% |
| Kindergarten | 940 | 6.8% |
| Elementary School | 3,112 | 22.6% |
| Middle School | 3,313 | 24.0% |
| High School | 3,220 | 23.3% |
| College / Undergraduate | 2,140 | 15.5% |
| Graduate / Professional | 203 | 1.5% |
| Total | 13,794 | 100.0% |
School Enrollment by Age by Funding Source in Sampson County
Out of a total of 13,794 students who are enrolled in schools in Sampson County, 1,352 (9.8%) attend a private institution, while the remaining 12,442 (90.2%) are enrolled in public schools. The age group of 20 to 24 year olds has the highest likelihood of being enrolled in private schools, with 274 (27.5% in the age bracket) enrolled. Conversely, the age group of 15 to 17 year olds has the lowest likelihood of being enrolled in a private school, with 2,337 (96.3% in the age bracket) attending a public institution.
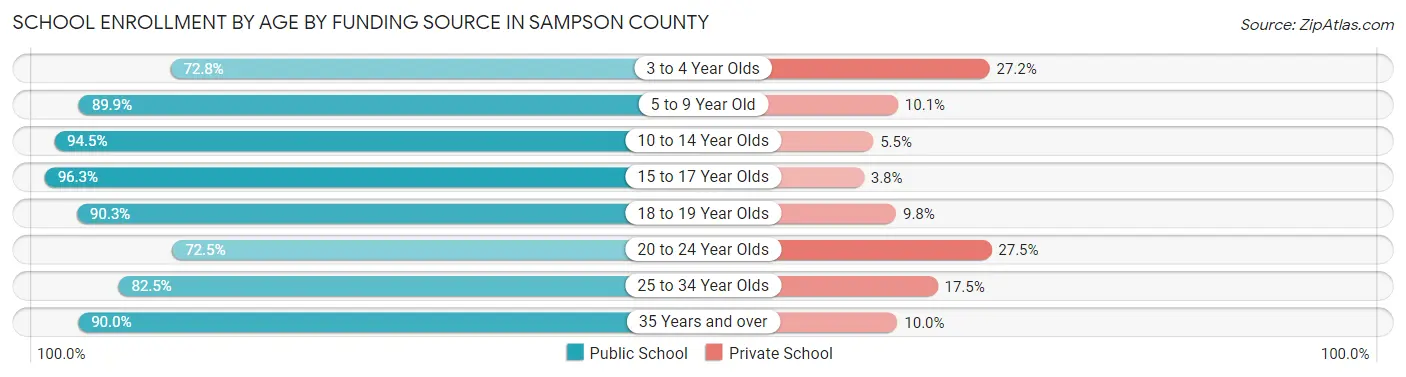
| Age Bracket | Public School | Private School |
| 3 to 4 Year Olds | 461 (72.8%) | 172 (27.2%) |
| 5 to 9 Year Old | 3,408 (89.9%) | 383 (10.1%) |
| 10 to 14 Year Olds | 3,901 (94.5%) | 227 (5.5%) |
| 15 to 17 Year Olds | 2,337 (96.3%) | 91 (3.7%) |
| 18 to 19 Year Olds | 805 (90.2%) | 87 (9.8%) |
| 20 to 24 Year Olds | 722 (72.5%) | 274 (27.5%) |
| 25 to 34 Year Olds | 335 (82.5%) | 71 (17.5%) |
| 35 Years and over | 468 (90.0%) | 52 (10.0%) |
| Total | 12,442 (90.2%) | 1,352 (9.8%) |
Educational Attainment by Field of Study in Sampson County
Business (1,428 | 22.6%), education (1,330 | 21.0%), science & technology (903 | 14.3%), arts & humanities (474 | 7.5%), and psychology (371 | 5.9%) are the most common fields of study among 6,324 individuals in Sampson County who have obtained a bachelor's degree or higher.
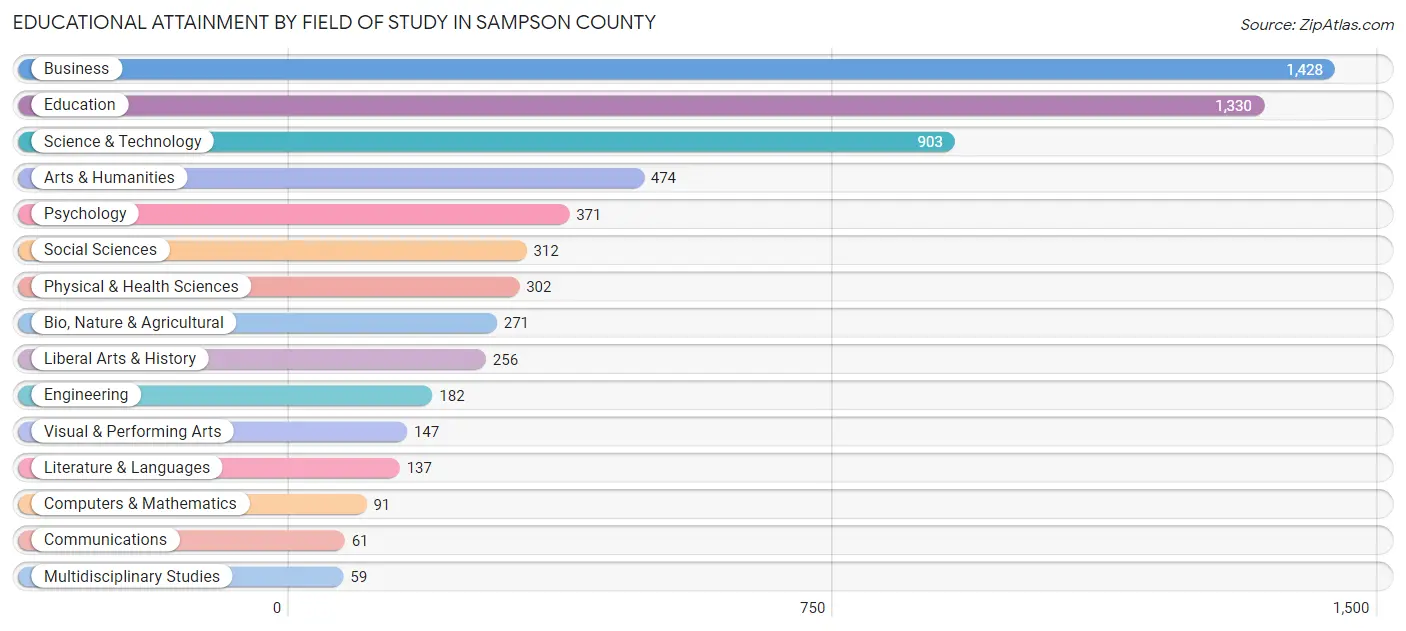
| Field of Study | # Graduates | % Graduates |
| Computers & Mathematics | 91 | 1.4% |
| Bio, Nature & Agricultural | 271 | 4.3% |
| Physical & Health Sciences | 302 | 4.8% |
| Psychology | 371 | 5.9% |
| Social Sciences | 312 | 4.9% |
| Engineering | 182 | 2.9% |
| Multidisciplinary Studies | 59 | 0.9% |
| Science & Technology | 903 | 14.3% |
| Business | 1,428 | 22.6% |
| Education | 1,330 | 21.0% |
| Literature & Languages | 137 | 2.2% |
| Liberal Arts & History | 256 | 4.1% |
| Visual & Performing Arts | 147 | 2.3% |
| Communications | 61 | 1.0% |
| Arts & Humanities | 474 | 7.5% |
| Total | 6,324 | 100.0% |
Transportation & Commute in Sampson County
Vehicle Availability by Sex in Sampson County
The most prevalent vehicle ownership categories in Sampson County are males with 2 vehicles (4,813, accounting for 36.1%) and females with 2 vehicles (3,365, making up 45.2%).
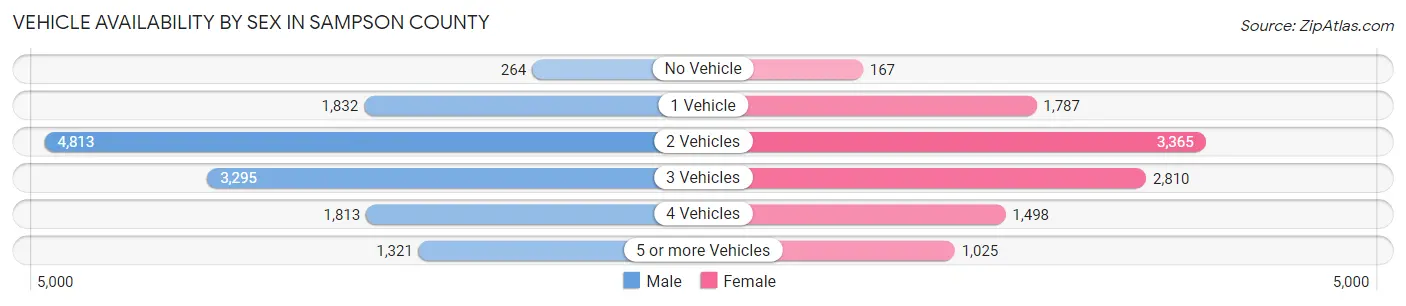
| Vehicles Available | Male | Female |
| No Vehicle | 264 (2.0%) | 167 (1.6%) |
| 1 Vehicle | 1,832 (13.7%) | 1,787 (16.8%) |
| 2 Vehicles | 4,813 (36.1%) | 3,365 (31.6%) |
| 3 Vehicles | 3,295 (24.7%) | 2,810 (26.4%) |
| 4 Vehicles | 1,813 (13.6%) | 1,498 (14.1%) |
| 5 or more Vehicles | 1,321 (9.9%) | 1,025 (9.6%) |
| Total | 13,338 (100.0%) | 10,652 (100.0%) |
Commute Time in Sampson County
The most frequently occuring commute durations in Sampson County are 10 to 14 minutes (3,182 commuters, 13.7%), 15 to 19 minutes (3,048 commuters, 13.1%), and 20 to 24 minutes (2,917 commuters, 12.5%).
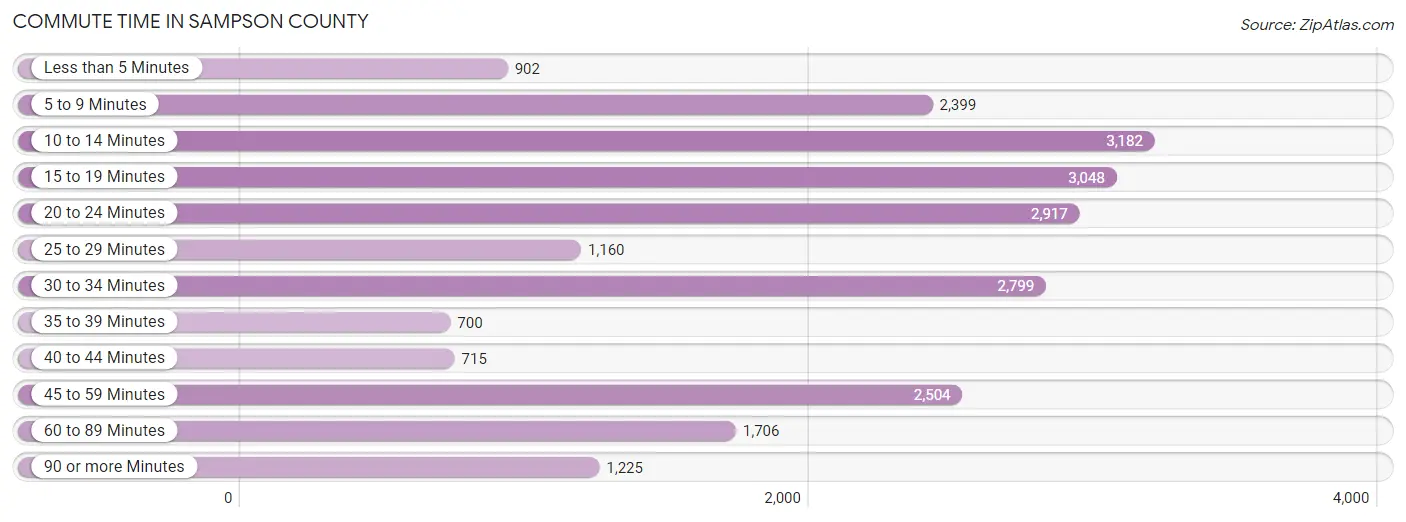
| Commute Time | # Commuters | % Commuters |
| Less than 5 Minutes | 902 | 3.9% |
| 5 to 9 Minutes | 2,399 | 10.3% |
| 10 to 14 Minutes | 3,182 | 13.7% |
| 15 to 19 Minutes | 3,048 | 13.1% |
| 20 to 24 Minutes | 2,917 | 12.5% |
| 25 to 29 Minutes | 1,160 | 5.0% |
| 30 to 34 Minutes | 2,799 | 12.0% |
| 35 to 39 Minutes | 700 | 3.0% |
| 40 to 44 Minutes | 715 | 3.1% |
| 45 to 59 Minutes | 2,504 | 10.8% |
| 60 to 89 Minutes | 1,706 | 7.3% |
| 90 or more Minutes | 1,225 | 5.3% |
Commute Time by Sex in Sampson County
The most common commute times in Sampson County are 10 to 14 minutes (1,832 commuters, 14.0%) for males and 15 to 19 minutes (1,566 commuters, 15.4%) for females.
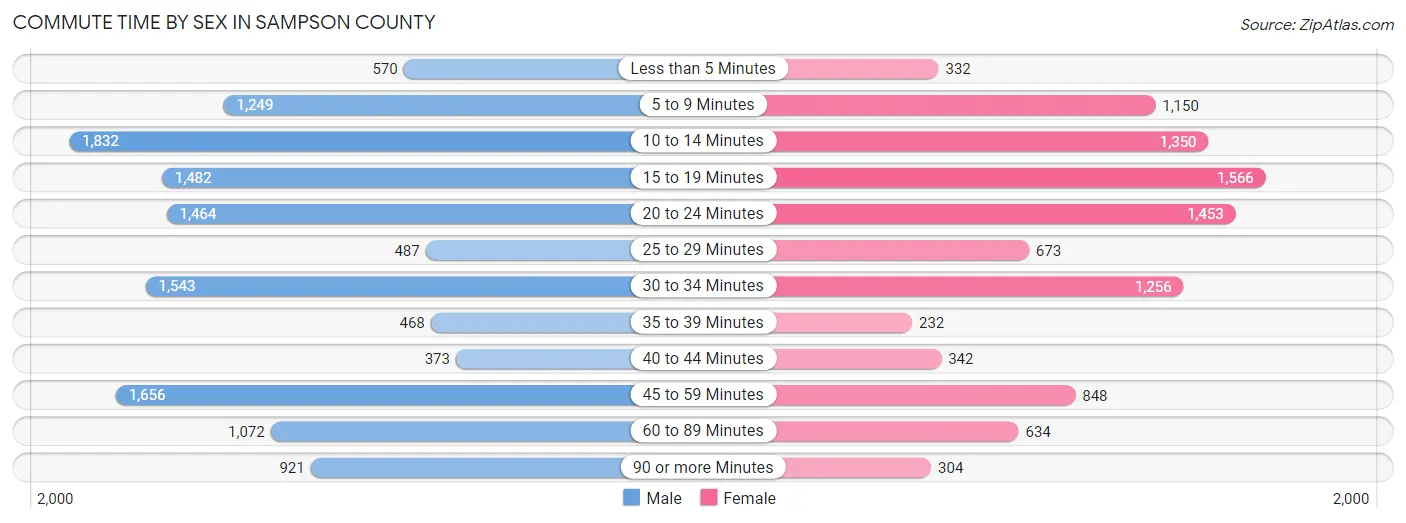
| Commute Time | Male | Female |
| Less than 5 Minutes | 570 (4.3%) | 332 (3.3%) |
| 5 to 9 Minutes | 1,249 (9.5%) | 1,150 (11.3%) |
| 10 to 14 Minutes | 1,832 (14.0%) | 1,350 (13.3%) |
| 15 to 19 Minutes | 1,482 (11.3%) | 1,566 (15.4%) |
| 20 to 24 Minutes | 1,464 (11.2%) | 1,453 (14.3%) |
| 25 to 29 Minutes | 487 (3.7%) | 673 (6.6%) |
| 30 to 34 Minutes | 1,543 (11.8%) | 1,256 (12.4%) |
| 35 to 39 Minutes | 468 (3.6%) | 232 (2.3%) |
| 40 to 44 Minutes | 373 (2.8%) | 342 (3.4%) |
| 45 to 59 Minutes | 1,656 (12.6%) | 848 (8.4%) |
| 60 to 89 Minutes | 1,072 (8.2%) | 634 (6.2%) |
| 90 or more Minutes | 921 (7.0%) | 304 (3.0%) |
Time of Departure to Work by Sex in Sampson County
The most frequent times of departure to work in Sampson County are 6:00 AM to 6:29 AM (2,223, 17.0%) for males and 7:00 AM to 7:29 AM (1,964, 19.4%) for females.
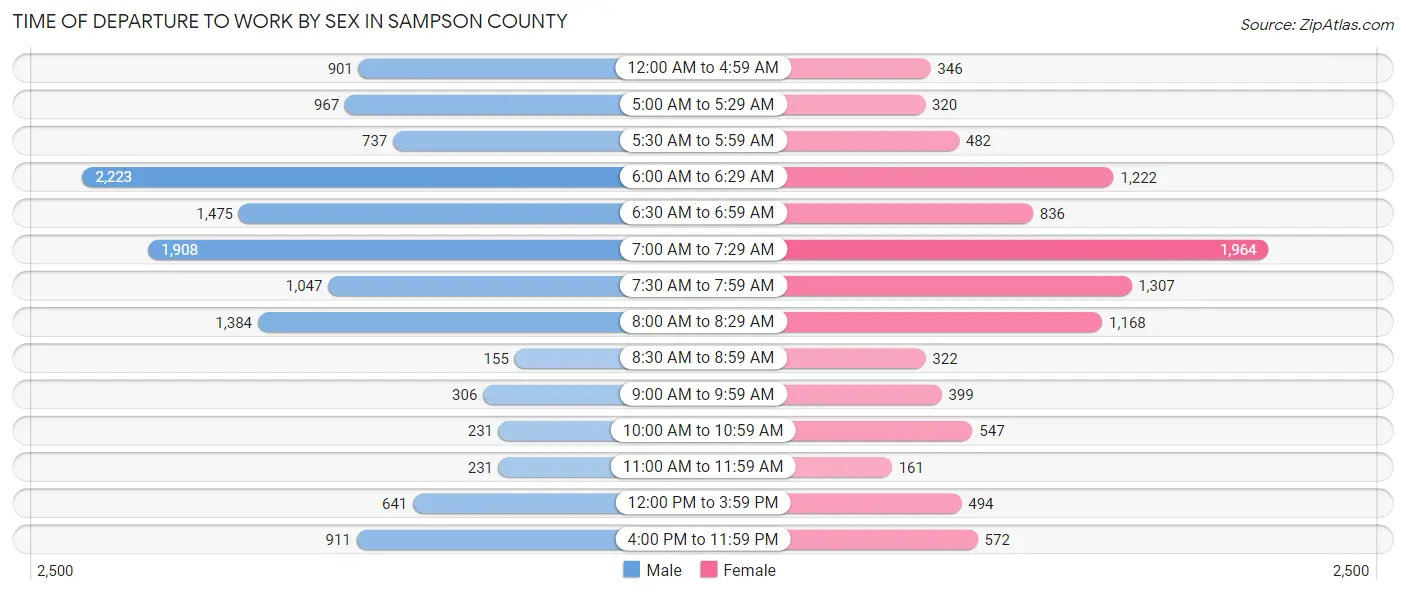
| Time of Departure | Male | Female |
| 12:00 AM to 4:59 AM | 901 (6.9%) | 346 (3.4%) |
| 5:00 AM to 5:29 AM | 967 (7.4%) | 320 (3.2%) |
| 5:30 AM to 5:59 AM | 737 (5.6%) | 482 (4.8%) |
| 6:00 AM to 6:29 AM | 2,223 (17.0%) | 1,222 (12.0%) |
| 6:30 AM to 6:59 AM | 1,475 (11.2%) | 836 (8.2%) |
| 7:00 AM to 7:29 AM | 1,908 (14.5%) | 1,964 (19.4%) |
| 7:30 AM to 7:59 AM | 1,047 (8.0%) | 1,307 (12.9%) |
| 8:00 AM to 8:29 AM | 1,384 (10.5%) | 1,168 (11.5%) |
| 8:30 AM to 8:59 AM | 155 (1.2%) | 322 (3.2%) |
| 9:00 AM to 9:59 AM | 306 (2.3%) | 399 (3.9%) |
| 10:00 AM to 10:59 AM | 231 (1.8%) | 547 (5.4%) |
| 11:00 AM to 11:59 AM | 231 (1.8%) | 161 (1.6%) |
| 12:00 PM to 3:59 PM | 641 (4.9%) | 494 (4.9%) |
| 4:00 PM to 11:59 PM | 911 (7.0%) | 572 (5.6%) |
| Total | 13,117 (100.0%) | 10,140 (100.0%) |
Housing Occupancy in Sampson County
Occupancy by Ownership in Sampson County
Of the total 21,395 dwellings in Sampson County, owner-occupied units account for 15,663 (73.2%), while renter-occupied units make up 5,732 (26.8%).
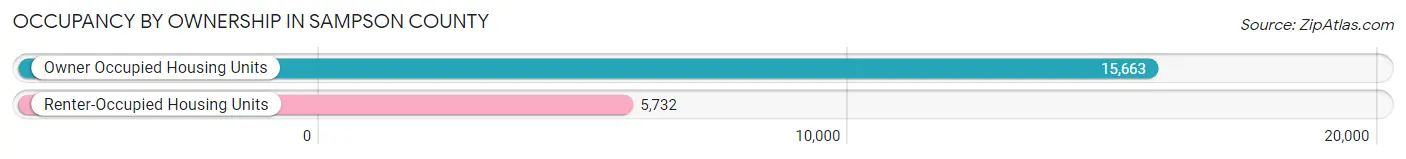
| Occupancy | # Housing Units | % Housing Units |
| Owner Occupied Housing Units | 15,663 | 73.2% |
| Renter-Occupied Housing Units | 5,732 | 26.8% |
| Total Occupied Housing Units | 21,395 | 100.0% |
Occupancy by Household Size in Sampson County
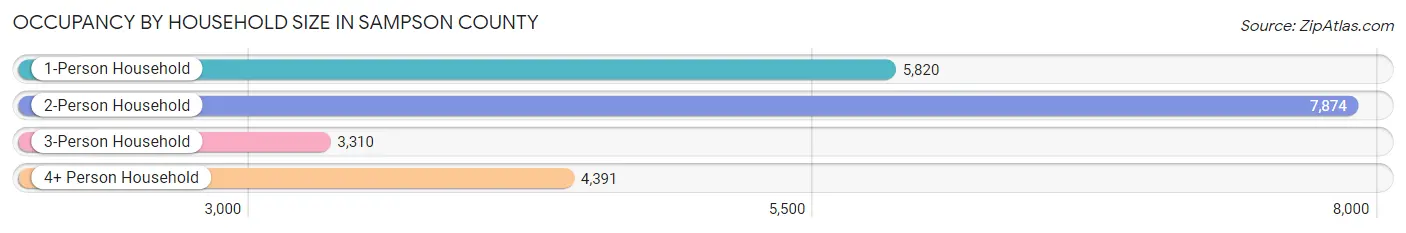
| Household Size | # Housing Units | % Housing Units |
| 1-Person Household | 5,820 | 27.2% |
| 2-Person Household | 7,874 | 36.8% |
| 3-Person Household | 3,310 | 15.5% |
| 4+ Person Household | 4,391 | 20.5% |
| Total Housing Units | 21,395 | 100.0% |
Occupancy by Ownership by Household Size in Sampson County
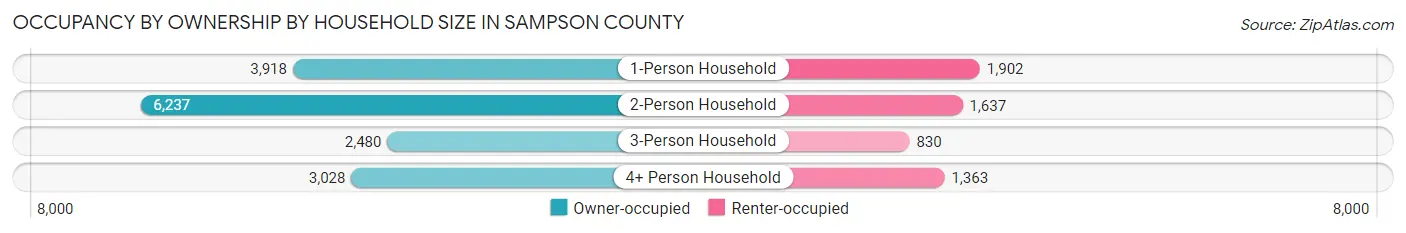
| Household Size | Owner-occupied | Renter-occupied |
| 1-Person Household | 3,918 (67.3%) | 1,902 (32.7%) |
| 2-Person Household | 6,237 (79.2%) | 1,637 (20.8%) |
| 3-Person Household | 2,480 (74.9%) | 830 (25.1%) |
| 4+ Person Household | 3,028 (69.0%) | 1,363 (31.0%) |
| Total Housing Units | 15,663 (73.2%) | 5,732 (26.8%) |
Occupancy by Educational Attainment in Sampson County
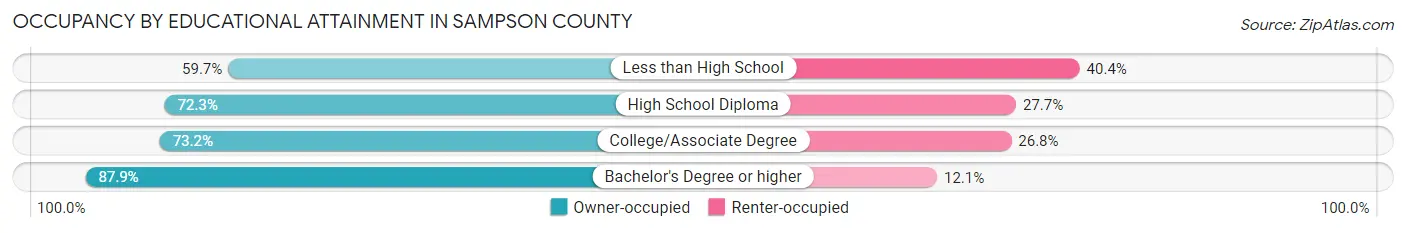
| Household Size | Owner-occupied | Renter-occupied |
| Less than High School | 1,900 (59.7%) | 1,285 (40.4%) |
| High School Diploma | 5,072 (72.3%) | 1,947 (27.7%) |
| College/Associate Degree | 5,711 (73.2%) | 2,091 (26.8%) |
| Bachelor's Degree or higher | 2,980 (87.9%) | 409 (12.1%) |
Occupancy by Age of Householder in Sampson County
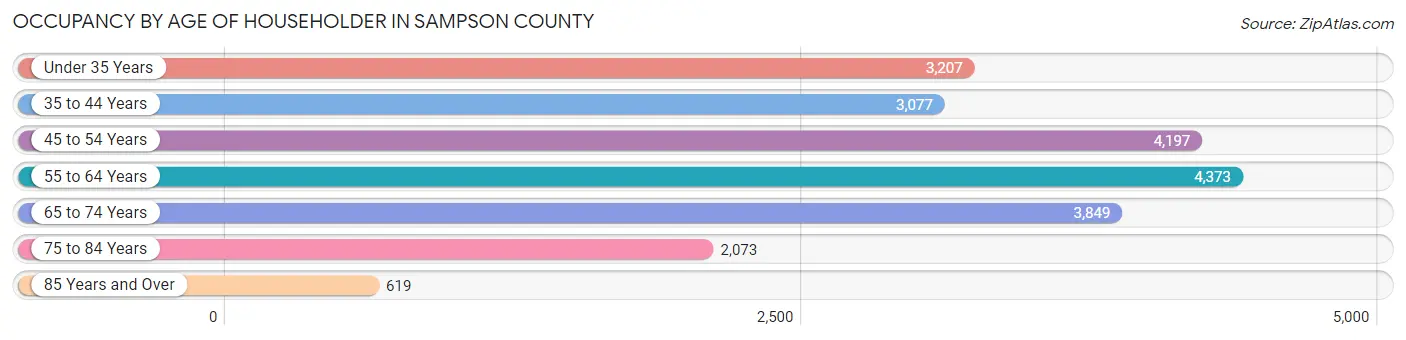
| Age Bracket | # Households | % Households |
| Under 35 Years | 3,207 | 15.0% |
| 35 to 44 Years | 3,077 | 14.4% |
| 45 to 54 Years | 4,197 | 19.6% |
| 55 to 64 Years | 4,373 | 20.4% |
| 65 to 74 Years | 3,849 | 18.0% |
| 75 to 84 Years | 2,073 | 9.7% |
| 85 Years and Over | 619 | 2.9% |
| Total | 21,395 | 100.0% |
Housing Finances in Sampson County
Median Income by Occupancy in Sampson County
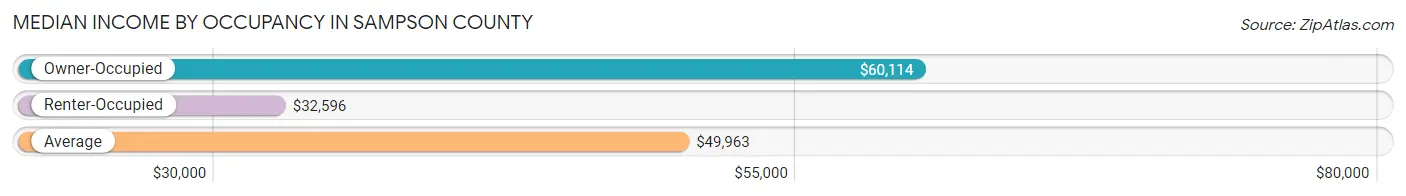
| Occupancy Type | # Households | Median Income |
| Owner-Occupied | 15,663 (73.2%) | $60,114 |
| Renter-Occupied | 5,732 (26.8%) | $32,596 |
| Average | 21,395 (100.0%) | $49,963 |
Occupancy by Householder Income Bracket in Sampson County
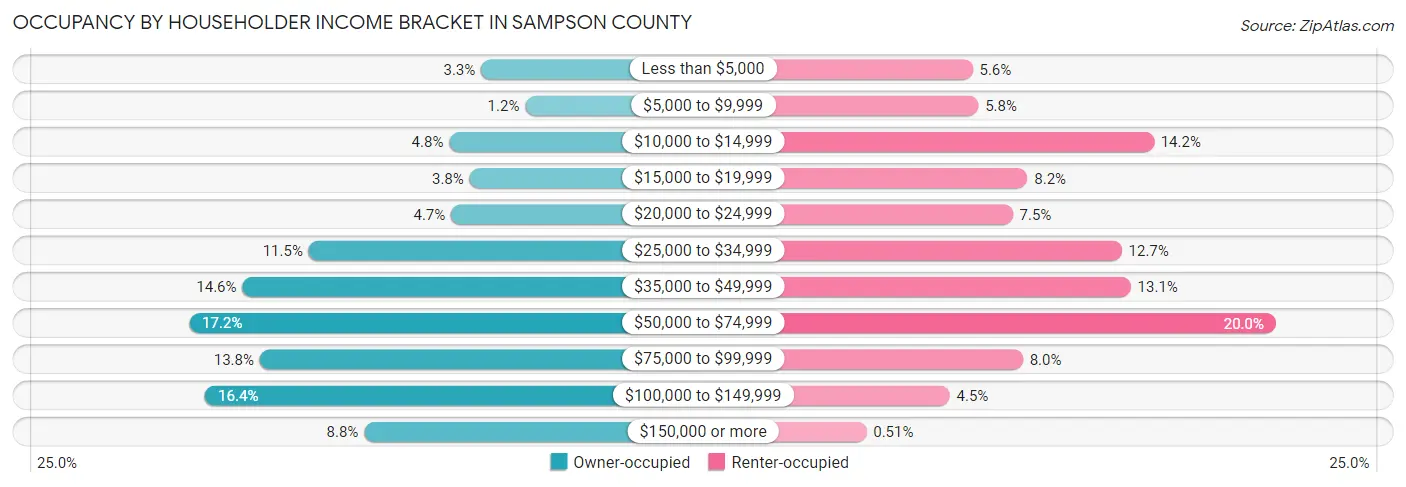
| Income Bracket | Owner-occupied | Renter-occupied |
| Less than $5,000 | 510 (3.3%) | 319 (5.6%) |
| $5,000 to $9,999 | 182 (1.2%) | 335 (5.8%) |
| $10,000 to $14,999 | 749 (4.8%) | 814 (14.2%) |
| $15,000 to $19,999 | 597 (3.8%) | 469 (8.2%) |
| $20,000 to $24,999 | 735 (4.7%) | 429 (7.5%) |
| $25,000 to $34,999 | 1,796 (11.5%) | 726 (12.7%) |
| $35,000 to $49,999 | 2,292 (14.6%) | 751 (13.1%) |
| $50,000 to $74,999 | 2,690 (17.2%) | 1,147 (20.0%) |
| $75,000 to $99,999 | 2,161 (13.8%) | 456 (8.0%) |
| $100,000 to $149,999 | 2,568 (16.4%) | 257 (4.5%) |
| $150,000 or more | 1,383 (8.8%) | 29 (0.5%) |
| Total | 15,663 (100.0%) | 5,732 (100.0%) |
Monthly Housing Cost Tiers in Sampson County
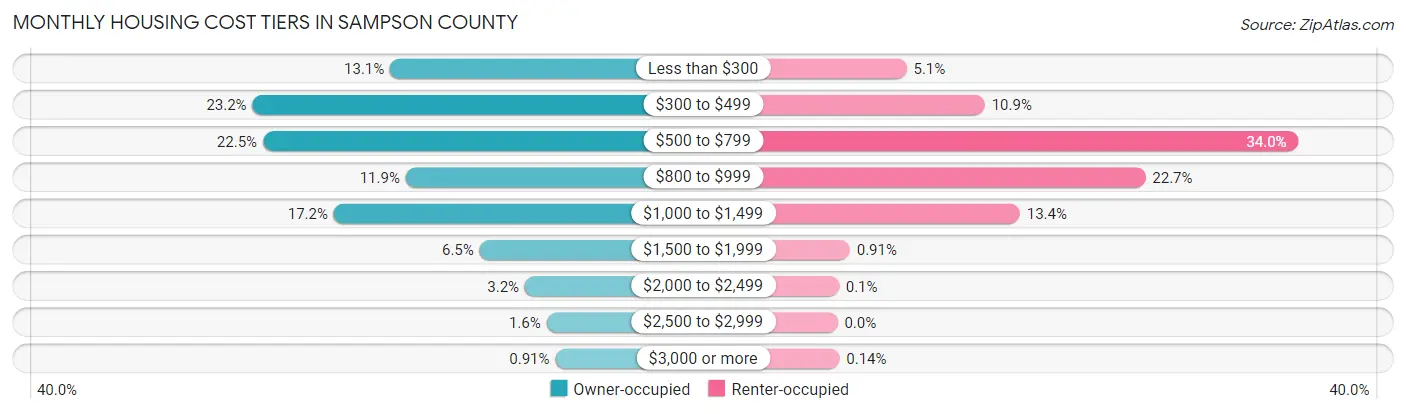
| Monthly Cost | Owner-occupied | Renter-occupied |
| Less than $300 | 2,048 (13.1%) | 292 (5.1%) |
| $300 to $499 | 3,637 (23.2%) | 622 (10.8%) |
| $500 to $799 | 3,516 (22.5%) | 1,946 (34.0%) |
| $800 to $999 | 1,868 (11.9%) | 1,300 (22.7%) |
| $1,000 to $1,499 | 2,698 (17.2%) | 770 (13.4%) |
| $1,500 to $1,999 | 1,016 (6.5%) | 52 (0.9%) |
| $2,000 to $2,499 | 493 (3.2%) | 6 (0.1%) |
| $2,500 to $2,999 | 244 (1.6%) | 0 (0.0%) |
| $3,000 or more | 143 (0.9%) | 8 (0.1%) |
| Total | 15,663 (100.0%) | 5,732 (100.0%) |
Physical Housing Characteristics in Sampson County
Housing Structures in Sampson County
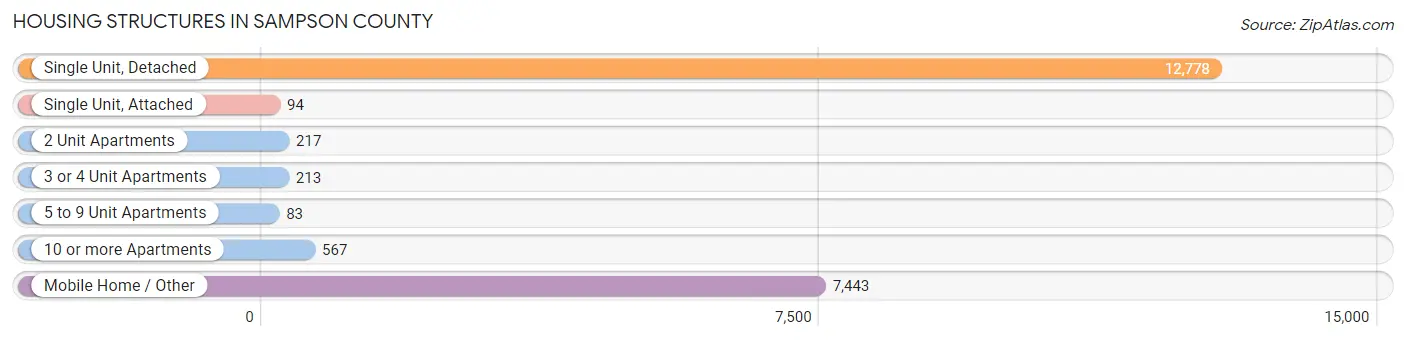
| Structure Type | # Housing Units | % Housing Units |
| Single Unit, Detached | 12,778 | 59.7% |
| Single Unit, Attached | 94 | 0.4% |
| 2 Unit Apartments | 217 | 1.0% |
| 3 or 4 Unit Apartments | 213 | 1.0% |
| 5 to 9 Unit Apartments | 83 | 0.4% |
| 10 or more Apartments | 567 | 2.6% |
| Mobile Home / Other | 7,443 | 34.8% |
| Total | 21,395 | 100.0% |
Housing Structures by Occupancy in Sampson County
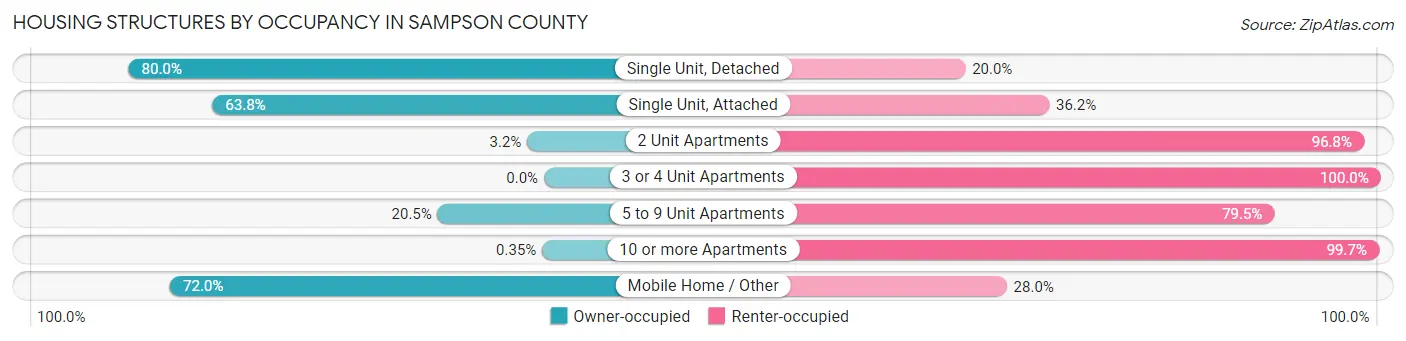
| Structure Type | Owner-occupied | Renter-occupied |
| Single Unit, Detached | 10,219 (80.0%) | 2,559 (20.0%) |
| Single Unit, Attached | 60 (63.8%) | 34 (36.2%) |
| 2 Unit Apartments | 7 (3.2%) | 210 (96.8%) |
| 3 or 4 Unit Apartments | 0 (0.0%) | 213 (100.0%) |
| 5 to 9 Unit Apartments | 17 (20.5%) | 66 (79.5%) |
| 10 or more Apartments | 2 (0.4%) | 565 (99.7%) |
| Mobile Home / Other | 5,358 (72.0%) | 2,085 (28.0%) |
| Total | 15,663 (73.2%) | 5,732 (26.8%) |
Housing Structures by Number of Rooms in Sampson County
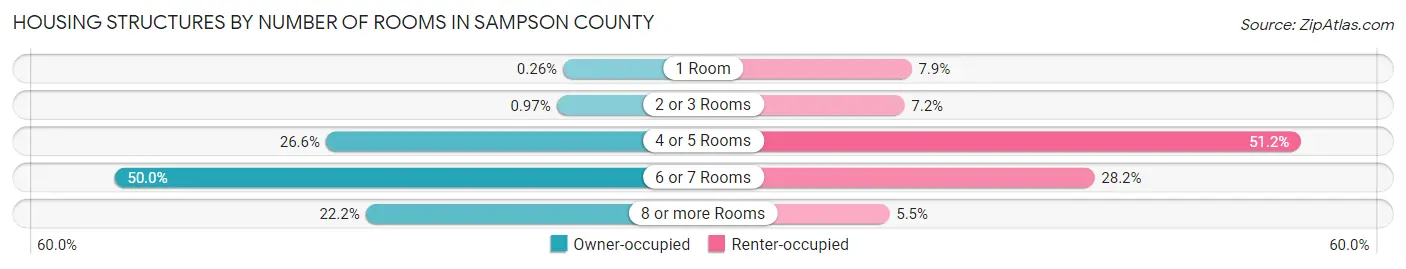
| Number of Rooms | Owner-occupied | Renter-occupied |
| 1 Room | 40 (0.3%) | 455 (7.9%) |
| 2 or 3 Rooms | 152 (1.0%) | 410 (7.1%) |
| 4 or 5 Rooms | 4,161 (26.6%) | 2,934 (51.2%) |
| 6 or 7 Rooms | 7,837 (50.0%) | 1,619 (28.2%) |
| 8 or more Rooms | 3,473 (22.2%) | 314 (5.5%) |
| Total | 15,663 (100.0%) | 5,732 (100.0%) |
Housing Structure by Heating Type in Sampson County
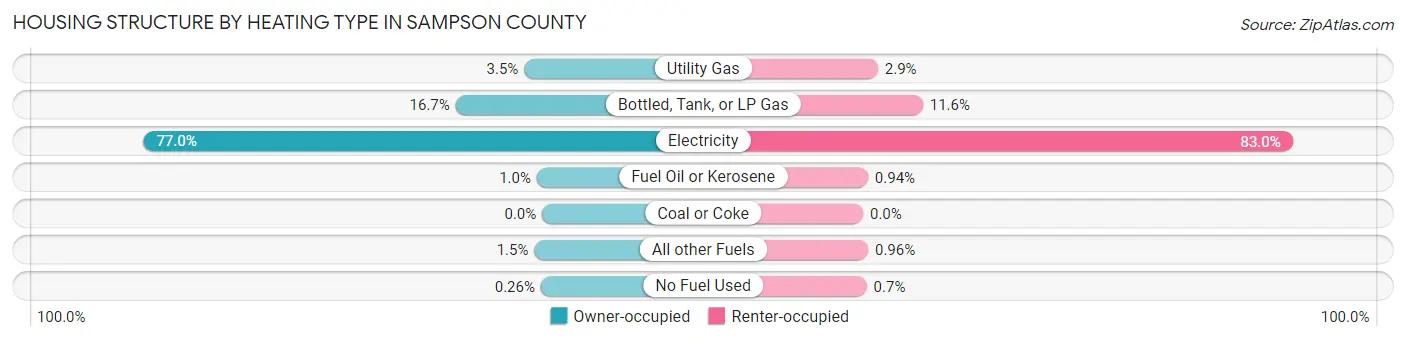
| Heating Type | Owner-occupied | Renter-occupied |
| Utility Gas | 542 (3.5%) | 164 (2.9%) |
| Bottled, Tank, or LP Gas | 2,621 (16.7%) | 662 (11.6%) |
| Electricity | 12,063 (77.0%) | 4,757 (83.0%) |
| Fuel Oil or Kerosene | 160 (1.0%) | 54 (0.9%) |
| Coal or Coke | 0 (0.0%) | 0 (0.0%) |
| All other Fuels | 236 (1.5%) | 55 (1.0%) |
| No Fuel Used | 41 (0.3%) | 40 (0.7%) |
| Total | 15,663 (100.0%) | 5,732 (100.0%) |
Household Vehicle Usage in Sampson County
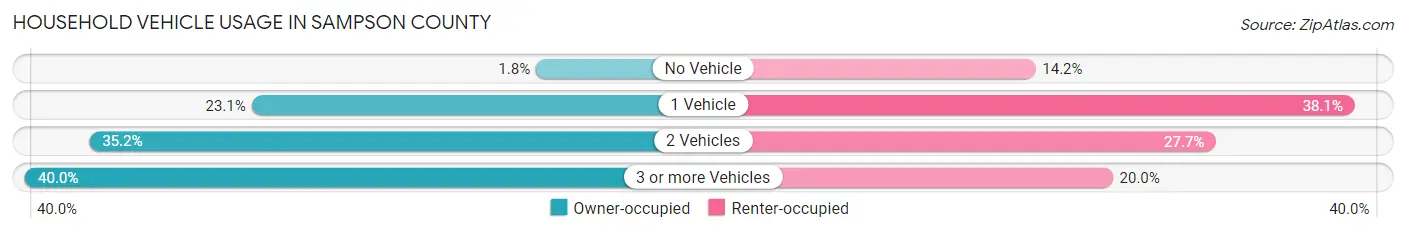
| Vehicles per Household | Owner-occupied | Renter-occupied |
| No Vehicle | 284 (1.8%) | 815 (14.2%) |
| 1 Vehicle | 3,611 (23.1%) | 2,182 (38.1%) |
| 2 Vehicles | 5,509 (35.2%) | 1,589 (27.7%) |
| 3 or more Vehicles | 6,259 (40.0%) | 1,146 (20.0%) |
| Total | 15,663 (100.0%) | 5,732 (100.0%) |
Real Estate & Mortgages in Sampson County
Real Estate and Mortgage Overview in Sampson County
| Characteristic | Without Mortgage | With Mortgage |
| Housing Units | 8,822 | 6,841 |
| Median Property Value | $101,100 | $139,700 |
| Median Household Income | $47,433 | $857 |
| Monthly Housing Costs | $427 | $143 |
| Real Estate Taxes | $846 | $173 |
Property Value by Mortgage Status in Sampson County
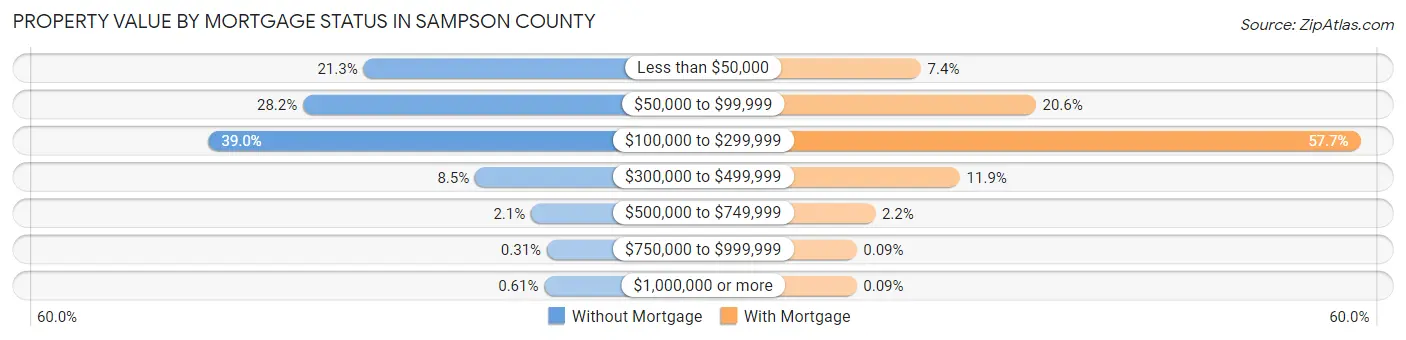
| Property Value | Without Mortgage | With Mortgage |
| Less than $50,000 | 1,876 (21.3%) | 509 (7.4%) |
| $50,000 to $99,999 | 2,486 (28.2%) | 1,407 (20.6%) |
| $100,000 to $299,999 | 3,440 (39.0%) | 3,947 (57.7%) |
| $300,000 to $499,999 | 752 (8.5%) | 814 (11.9%) |
| $500,000 to $749,999 | 187 (2.1%) | 152 (2.2%) |
| $750,000 to $999,999 | 27 (0.3%) | 6 (0.1%) |
| $1,000,000 or more | 54 (0.6%) | 6 (0.1%) |
| Total | 8,822 (100.0%) | 6,841 (100.0%) |
Household Income by Mortgage Status in Sampson County
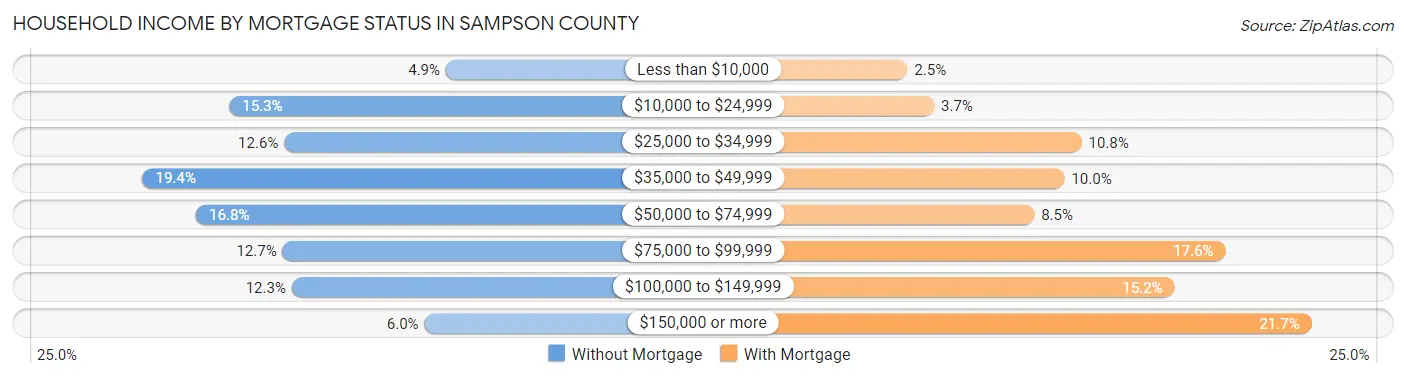
| Household Income | Without Mortgage | With Mortgage |
| Less than $10,000 | 436 (4.9%) | 169 (2.5%) |
| $10,000 to $24,999 | 1,345 (15.2%) | 256 (3.7%) |
| $25,000 to $34,999 | 1,115 (12.6%) | 736 (10.8%) |
| $35,000 to $49,999 | 1,710 (19.4%) | 681 (10.0%) |
| $50,000 to $74,999 | 1,485 (16.8%) | 582 (8.5%) |
| $75,000 to $99,999 | 1,122 (12.7%) | 1,205 (17.6%) |
| $100,000 to $149,999 | 1,083 (12.3%) | 1,039 (15.2%) |
| $150,000 or more | 526 (6.0%) | 1,485 (21.7%) |
| Total | 8,822 (100.0%) | 6,841 (100.0%) |
Property Value to Household Income Ratio in Sampson County
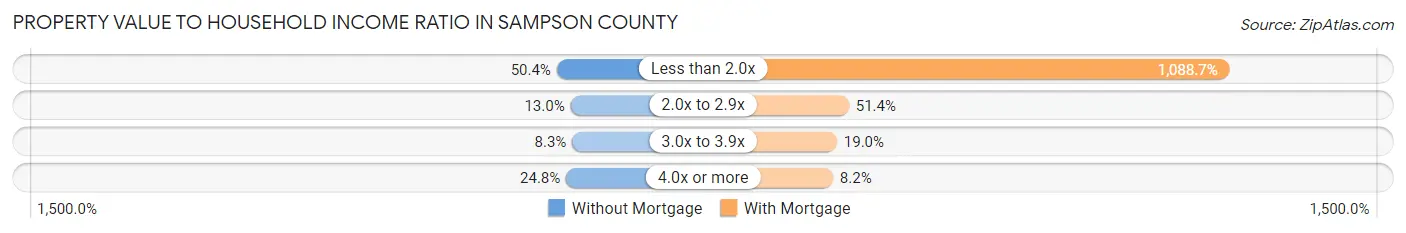
| Value-to-Income Ratio | Without Mortgage | With Mortgage |
| Less than 2.0x | 4,450 (50.4%) | 74,478 (1,088.7%) |
| 2.0x to 2.9x | 1,143 (13.0%) | 3,514 (51.4%) |
| 3.0x to 3.9x | 729 (8.3%) | 1,298 (19.0%) |
| 4.0x or more | 2,189 (24.8%) | 560 (8.2%) |
| Total | 8,822 (100.0%) | 6,841 (100.0%) |
Real Estate Taxes by Mortgage Status in Sampson County
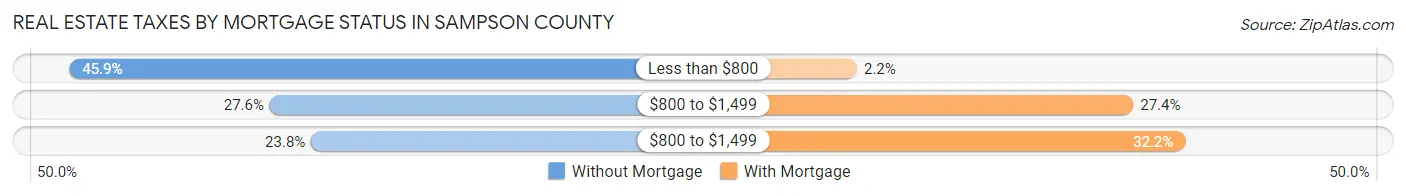
| Property Taxes | Without Mortgage | With Mortgage |
| Less than $800 | 4,051 (45.9%) | 150 (2.2%) |
| $800 to $1,499 | 2,436 (27.6%) | 1,876 (27.4%) |
| $800 to $1,499 | 2,102 (23.8%) | 2,201 (32.2%) |
| Total | 8,822 (100.0%) | 6,841 (100.0%) |
Health & Disability in Sampson County
Health Insurance Coverage by Age in Sampson County
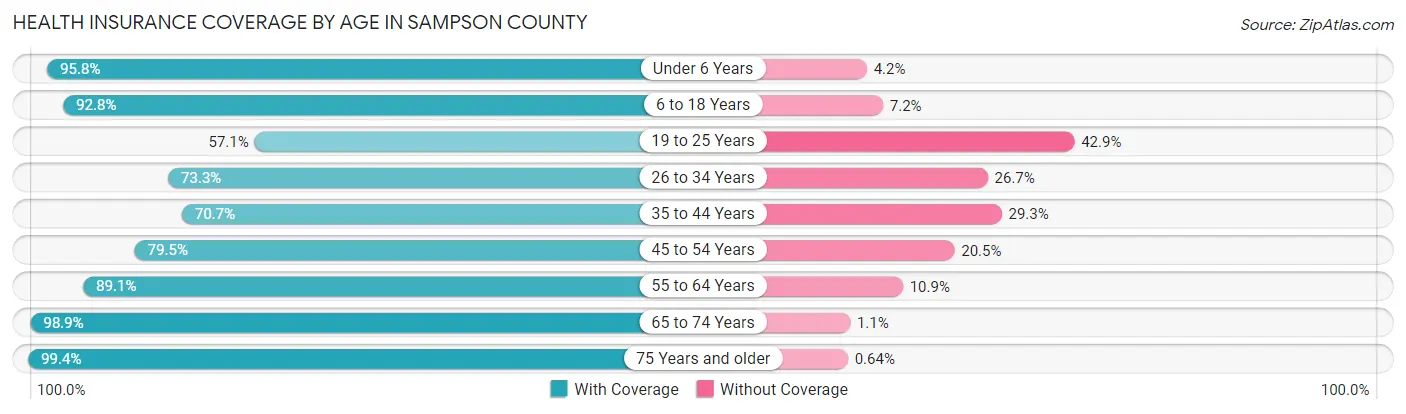
| Age Bracket | With Coverage | Without Coverage |
| Under 6 Years | 4,445 (95.8%) | 194 (4.2%) |
| 6 to 18 Years | 9,593 (92.8%) | 743 (7.2%) |
| 19 to 25 Years | 3,000 (57.1%) | 2,252 (42.9%) |
| 26 to 34 Years | 4,391 (73.3%) | 1,602 (26.7%) |
| 35 to 44 Years | 4,758 (70.7%) | 1,974 (29.3%) |
| 45 to 54 Years | 5,915 (79.5%) | 1,526 (20.5%) |
| 55 to 64 Years | 6,643 (89.1%) | 813 (10.9%) |
| 65 to 74 Years | 6,370 (98.9%) | 68 (1.1%) |
| 75 Years and older | 4,040 (99.4%) | 26 (0.6%) |
| Total | 49,155 (84.2%) | 9,198 (15.8%) |
Health Insurance Coverage by Citizenship Status in Sampson County
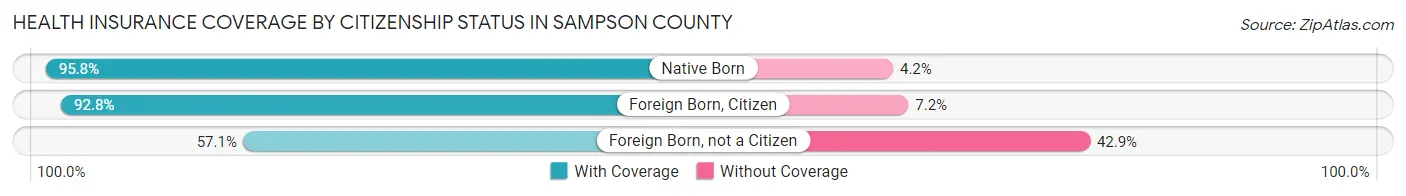
| Citizenship Status | With Coverage | Without Coverage |
| Native Born | 4,445 (95.8%) | 194 (4.2%) |
| Foreign Born, Citizen | 9,593 (92.8%) | 743 (7.2%) |
| Foreign Born, not a Citizen | 3,000 (57.1%) | 2,252 (42.9%) |
Health Insurance Coverage by Household Income in Sampson County
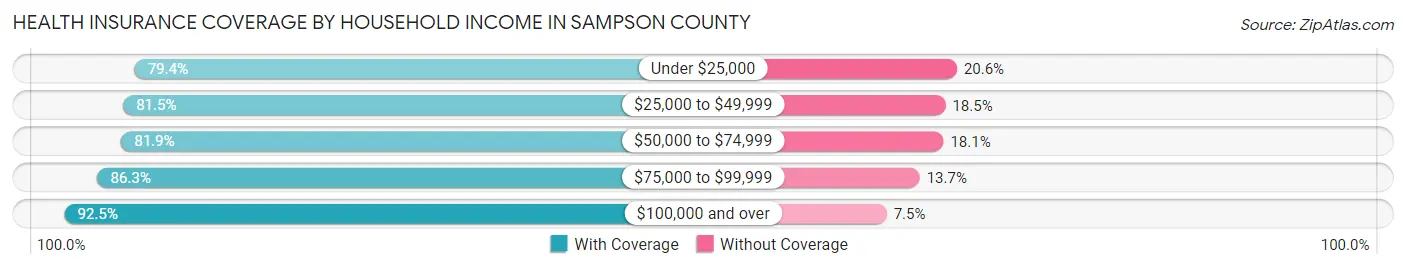
| Household Income | With Coverage | Without Coverage |
| Under $25,000 | 8,241 (79.4%) | 2,143 (20.6%) |
| $25,000 to $49,999 | 11,358 (81.5%) | 2,577 (18.5%) |
| $50,000 to $74,999 | 10,148 (81.9%) | 2,245 (18.1%) |
| $75,000 to $99,999 | 6,844 (86.3%) | 1,083 (13.7%) |
| $100,000 and over | 12,252 (92.5%) | 990 (7.5%) |
Public vs Private Health Insurance Coverage by Age in Sampson County
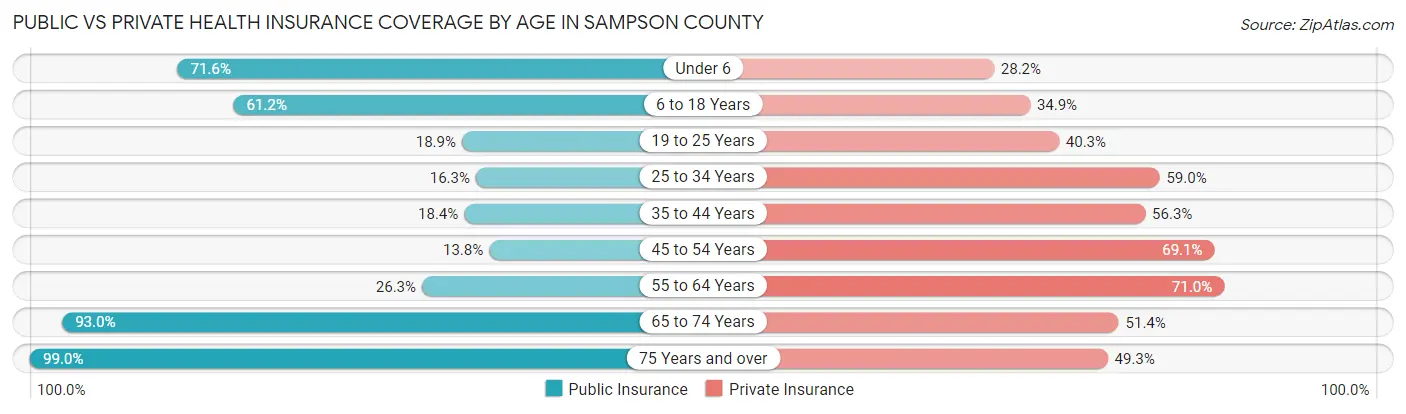
| Age Bracket | Public Insurance | Private Insurance |
| Under 6 | 3,322 (71.6%) | 1,309 (28.2%) |
| 6 to 18 Years | 6,328 (61.2%) | 3,609 (34.9%) |
| 19 to 25 Years | 990 (18.9%) | 2,116 (40.3%) |
| 25 to 34 Years | 974 (16.3%) | 3,534 (59.0%) |
| 35 to 44 Years | 1,240 (18.4%) | 3,791 (56.3%) |
| 45 to 54 Years | 1,026 (13.8%) | 5,145 (69.1%) |
| 55 to 64 Years | 1,958 (26.3%) | 5,291 (71.0%) |
| 65 to 74 Years | 5,988 (93.0%) | 3,308 (51.4%) |
| 75 Years and over | 4,024 (99.0%) | 2,006 (49.3%) |
| Total | 25,850 (44.3%) | 30,109 (51.6%) |
Disability Status by Sex by Age in Sampson County
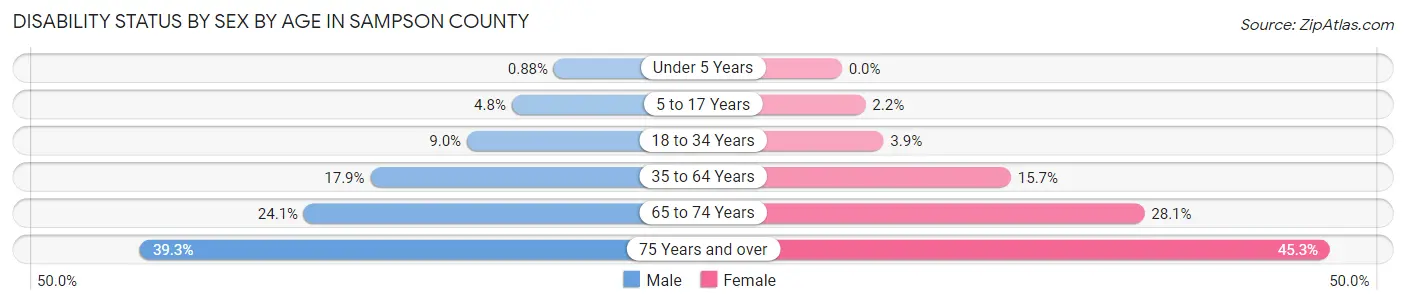
| Age Bracket | Male | Female |
| Under 5 Years | 17 (0.9%) | 0 (0.0%) |
| 5 to 17 Years | 262 (4.8%) | 112 (2.2%) |
| 18 to 34 Years | 543 (8.9%) | 224 (3.9%) |
| 35 to 64 Years | 1,957 (17.9%) | 1,679 (15.7%) |
| 65 to 74 Years | 673 (24.1%) | 1,023 (28.1%) |
| 75 Years and over | 673 (39.3%) | 1,066 (45.3%) |
Disability Class by Sex by Age in Sampson County
Disability Class: Hearing Difficulty
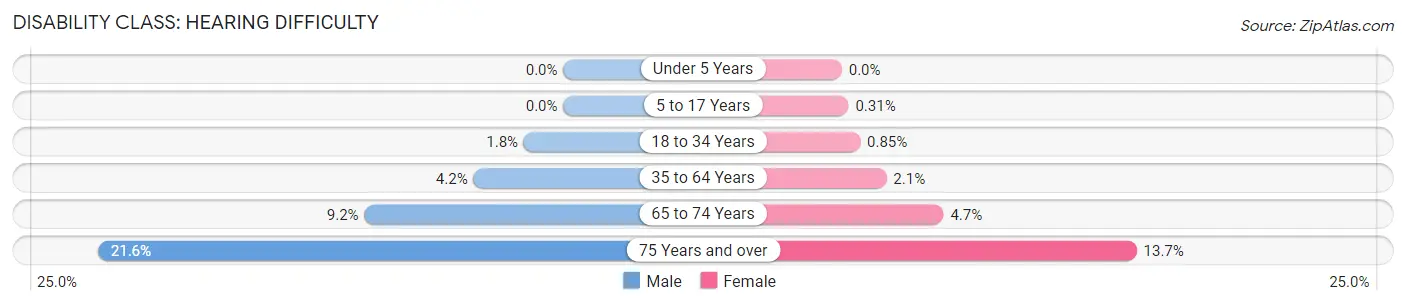
| Age Bracket | Male | Female |
| Under 5 Years | 0 (0.0%) | 0 (0.0%) |
| 5 to 17 Years | 0 (0.0%) | 16 (0.3%) |
| 18 to 34 Years | 111 (1.8%) | 49 (0.9%) |
| 35 to 64 Years | 456 (4.2%) | 221 (2.1%) |
| 65 to 74 Years | 258 (9.2%) | 172 (4.7%) |
| 75 Years and over | 370 (21.6%) | 322 (13.7%) |
Disability Class: Vision Difficulty
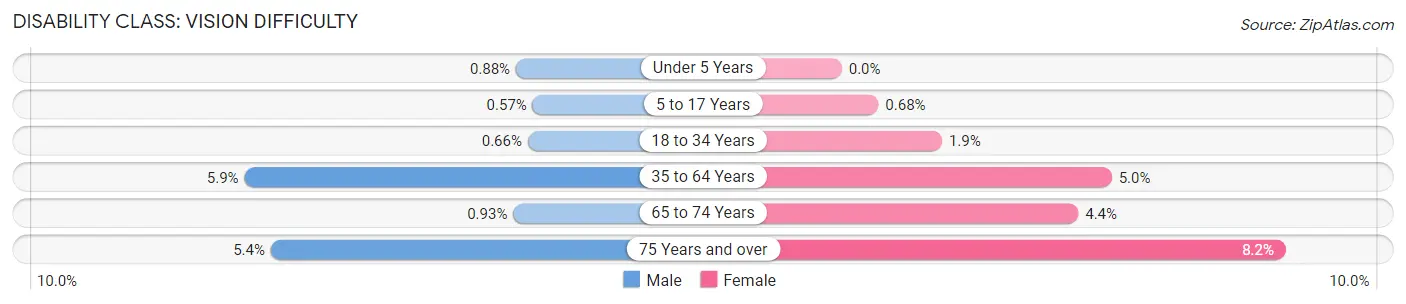
| Age Bracket | Male | Female |
| Under 5 Years | 17 (0.9%) | 0 (0.0%) |
| 5 to 17 Years | 31 (0.6%) | 35 (0.7%) |
| 18 to 34 Years | 40 (0.7%) | 108 (1.9%) |
| 35 to 64 Years | 647 (5.9%) | 536 (5.0%) |
| 65 to 74 Years | 26 (0.9%) | 160 (4.4%) |
| 75 Years and over | 93 (5.4%) | 194 (8.2%) |
Disability Class: Cognitive Difficulty
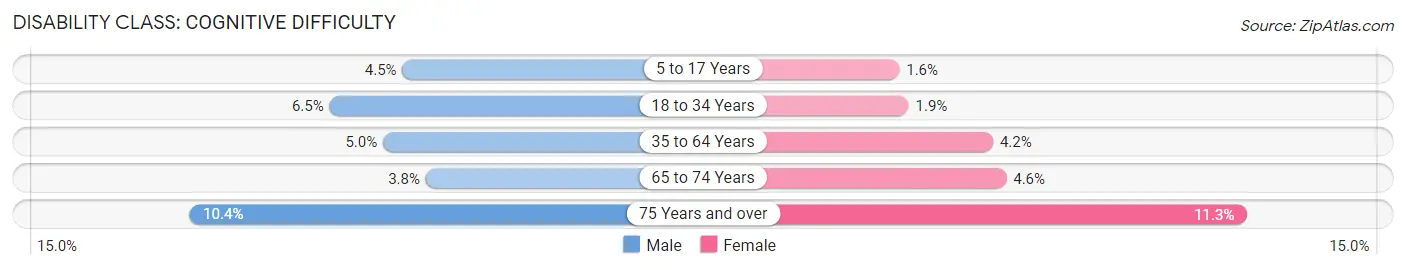
| Age Bracket | Male | Female |
| 5 to 17 Years | 245 (4.5%) | 82 (1.6%) |
| 18 to 34 Years | 395 (6.5%) | 108 (1.9%) |
| 35 to 64 Years | 549 (5.0%) | 451 (4.2%) |
| 65 to 74 Years | 107 (3.8%) | 167 (4.6%) |
| 75 Years and over | 178 (10.4%) | 265 (11.3%) |
Disability Class: Ambulatory Difficulty
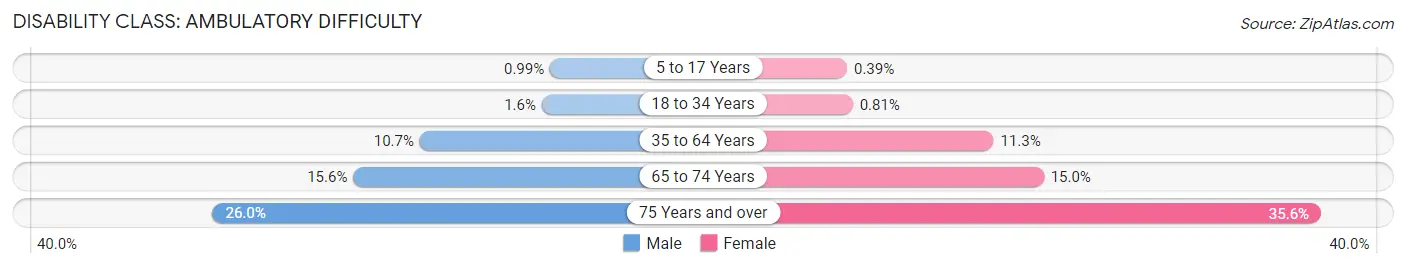
| Age Bracket | Male | Female |
| 5 to 17 Years | 54 (1.0%) | 20 (0.4%) |
| 18 to 34 Years | 97 (1.6%) | 47 (0.8%) |
| 35 to 64 Years | 1,165 (10.7%) | 1,206 (11.3%) |
| 65 to 74 Years | 436 (15.6%) | 546 (15.0%) |
| 75 Years and over | 446 (26.0%) | 837 (35.6%) |
Disability Class: Self-Care Difficulty
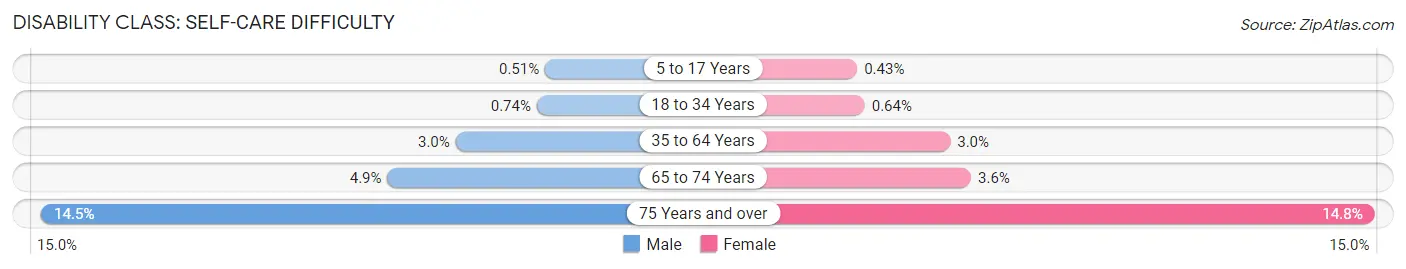
| Age Bracket | Male | Female |
| 5 to 17 Years | 28 (0.5%) | 22 (0.4%) |
| 18 to 34 Years | 45 (0.7%) | 37 (0.6%) |
| 35 to 64 Years | 328 (3.0%) | 323 (3.0%) |
| 65 to 74 Years | 137 (4.9%) | 131 (3.6%) |
| 75 Years and over | 249 (14.5%) | 349 (14.8%) |
Technology Access in Sampson County
Computing Device Access in Sampson County
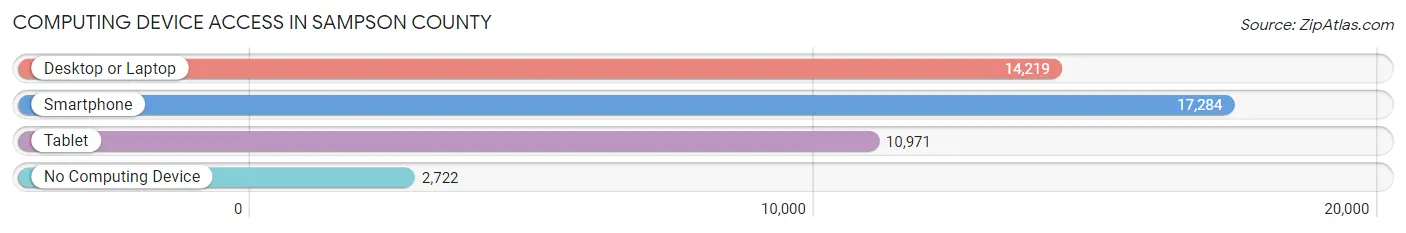
| Device Type | # Households | % Households |
| Desktop or Laptop | 14,219 | 66.5% |
| Smartphone | 17,284 | 80.8% |
| Tablet | 10,971 | 51.3% |
| No Computing Device | 2,722 | 12.7% |
| Total | 21,395 | 100.0% |
Internet Access in Sampson County
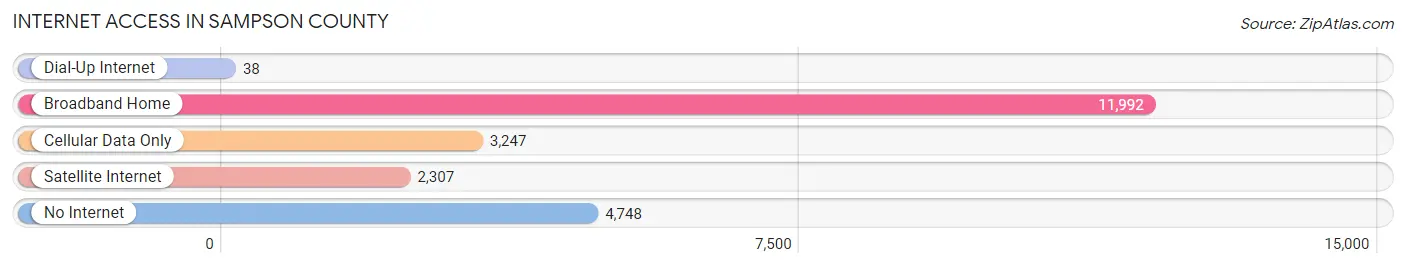
| Internet Type | # Households | % Households |
| Dial-Up Internet | 38 | 0.2% |
| Broadband Home | 11,992 | 56.0% |
| Cellular Data Only | 3,247 | 15.2% |
| Satellite Internet | 2,307 | 10.8% |
| No Internet | 4,748 | 22.2% |
| Total | 21,395 | 100.0% |
Sampson County Summary
Sampson County is located in the southeastern part of North Carolina, and is part of the Coastal Plain region. It is bordered by Duplin County to the north, Johnston County to the east, Wayne County to the south, and Cumberland County to the west. The county seat is Clinton, and the county is named for John Sampson, a Revolutionary War hero.
History
Sampson County was formed in 1784 from Duplin County. It was named for John Sampson, a Revolutionary War hero who was killed in the Battle of Stono Ferry in South Carolina. The county was originally part of the New Hanover Precinct, which was established in 1729. The county was divided into two townships in 1787, and the first court was held in 1789.
The county was largely agricultural in the 19th century, with cotton, corn, and tobacco being the main crops. The county was also home to several sawmills and gristmills. The Wilmington and Weldon Railroad was built through the county in 1840, and the county was connected to the Atlantic Coast Line Railroad in 1891.
The county was home to several Civil War battles, including the Battle of Averasboro in 1865. The county was also home to several Confederate camps, including Camp Mangum and Camp MacRae.
Geography
Sampson County is located in the southeastern part of North Carolina, and is part of the Coastal Plain region. It is bordered by Duplin County to the north, Johnston County to the east, Wayne County to the south, and Cumberland County to the west. The county has a total area of 545 square miles, of which 543 square miles is land and 2 square miles is water.
The county is mostly flat, with some rolling hills in the northern part of the county. The Black River runs through the county, and there are several small lakes and ponds. The county is home to several state parks, including Raven Rock State Park and Cliffs of the Neuse State Park.
Economy
Sampson County has a diverse economy, with agriculture, manufacturing, and tourism being the main industries. The county is home to several large poultry farms, and is one of the top producers of poultry in the state. The county is also home to several manufacturing companies, including a furniture manufacturer and a plastics manufacturer.
Tourism is also an important part of the economy, with several state parks and historic sites in the county. The county is also home to several festivals and events, including the Sampson County Fair and the Clinton Tobacco Festival.
Demographics
As of the 2010 census, Sampson County had a population of 63,431. The population was 53.3% White, 39.7% African American, 0.5% Native American, 1.2% Asian, 0.1% Pacific Islander, 3.2% from other races, and 2.1% from two or more races. Hispanic or Latino of any race were 6.2% of the population.
The median income for a household in the county was $35,945, and the median income for a family was $43,945. The per capita income for the county was $17,845. About 17.3% of the population was below the poverty line.
Common Questions
What is Per Capita Income in Sampson County?
Per Capita income in Sampson County is $25,969.
What is the Median Family Income in Sampson County?
Median Family Income in Sampson County is $63,607.
What is the Median Household income in Sampson County?
Median Household Income in Sampson County is $49,963.
What is Income or Wage Gap in Sampson County?
Income or Wage Gap in Sampson County is 20.5%.
Women in Sampson County earn 79.5 cents for every dollar earned by a man.
What is Family Income Deficit in Sampson County?
Family Income Deficit in Sampson County is $11,041.
Families that are below poverty line in Sampson County earn $11,041 less on average than the poverty threshold level.
What is Inequality or Gini Index in Sampson County?
Inequality or Gini Index in Sampson County is 0.46.
What is the Total Population of Sampson County?
Total Population of Sampson County is 59,317.
What is the Total Male Population of Sampson County?
Total Male Population of Sampson County is 29,674.
What is the Total Female Population of Sampson County?
Total Female Population of Sampson County is 29,643.
What is the Ratio of Males per 100 Females in Sampson County?
There are 100.10 Males per 100 Females in Sampson County.
What is the Ratio of Females per 100 Males in Sampson County?
There are 99.90 Females per 100 Males in Sampson County.
What is the Median Population Age in Sampson County?
Median Population Age in Sampson County is 39.6 Years.
What is the Average Family Size in Sampson County
Average Family Size in Sampson County is 3.3 People.
What is the Average Household Size in Sampson County
Average Household Size in Sampson County is 2.7 People.
How Large is the Labor Force in Sampson County?
There are 26,461 People in the Labor Forcein in Sampson County.
What is the Percentage of People in the Labor Force in Sampson County?
56.7% of People are in the Labor Force in Sampson County.
What is the Unemployment Rate in Sampson County?
Unemployment Rate in Sampson County is 5.7%.