Richmond County, NC Map & Demographics
Richmond County Map
Richmond County Overview
$24,416
PER CAPITA INCOME
$58,611
AVG FAMILY INCOME
$42,354
AVG HOUSEHOLD INCOME
27.4%
WAGE / INCOME GAP [ % ]
72.6¢/ $1
WAGE / INCOME GAP [ $ ]
$12,202
FAMILY INCOME DEFICIT
0.47
INEQUALITY / GINI INDEX
43,149
TOTAL POPULATION
21,082
MALE POPULATION
22,067
FEMALE POPULATION
95.54
MALES / 100 FEMALES
104.67
FEMALES / 100 MALES
40.1
MEDIAN AGE
3.2
AVG FAMILY SIZE
2.5
AVG HOUSEHOLD SIZE
19,914
LABOR FORCE [ PEOPLE ]
57.9%
PERCENT IN LABOR FORCE
9.6%
UNEMPLOYMENT RATE
Richmond County Area Codes
Income in Richmond County
Income Overview in Richmond County
Per Capita Income in Richmond County is $24,416, while median incomes of families and households are $58,611 and $42,354 respectively.
| Characteristic | Number | Measure |
| Per Capita Income | 43,149 | $24,416 |
| Median Family Income | 10,425 | $58,611 |
| Mean Family Income | 10,425 | $69,280 |
| Median Household Income | 16,605 | $42,354 |
| Mean Household Income | 16,605 | $58,581 |
| Income Deficit | 10,425 | $12,202 |
| Wage / Income Gap (%) | 43,149 | 27.37% |
| Wage / Income Gap ($) | 43,149 | 72.63¢ per $1 |
| Gini / Inequality Index | 43,149 | 0.47 |
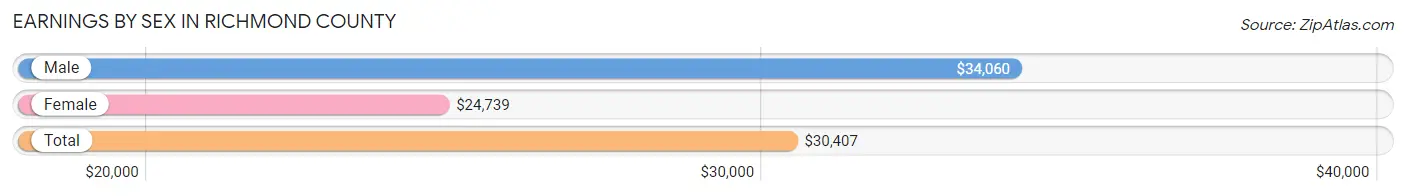
Earnings by Sex in Richmond County
Average Earnings in Richmond County are $30,407, $34,060 for men and $24,739 for women, a difference of 27.4%.
| Sex | Number | Average Earnings |
| Male | 10,405 (51.6%) | $34,060 |
| Female | 9,756 (48.4%) | $24,739 |
| Total | 20,161 (100.0%) | $30,407 |
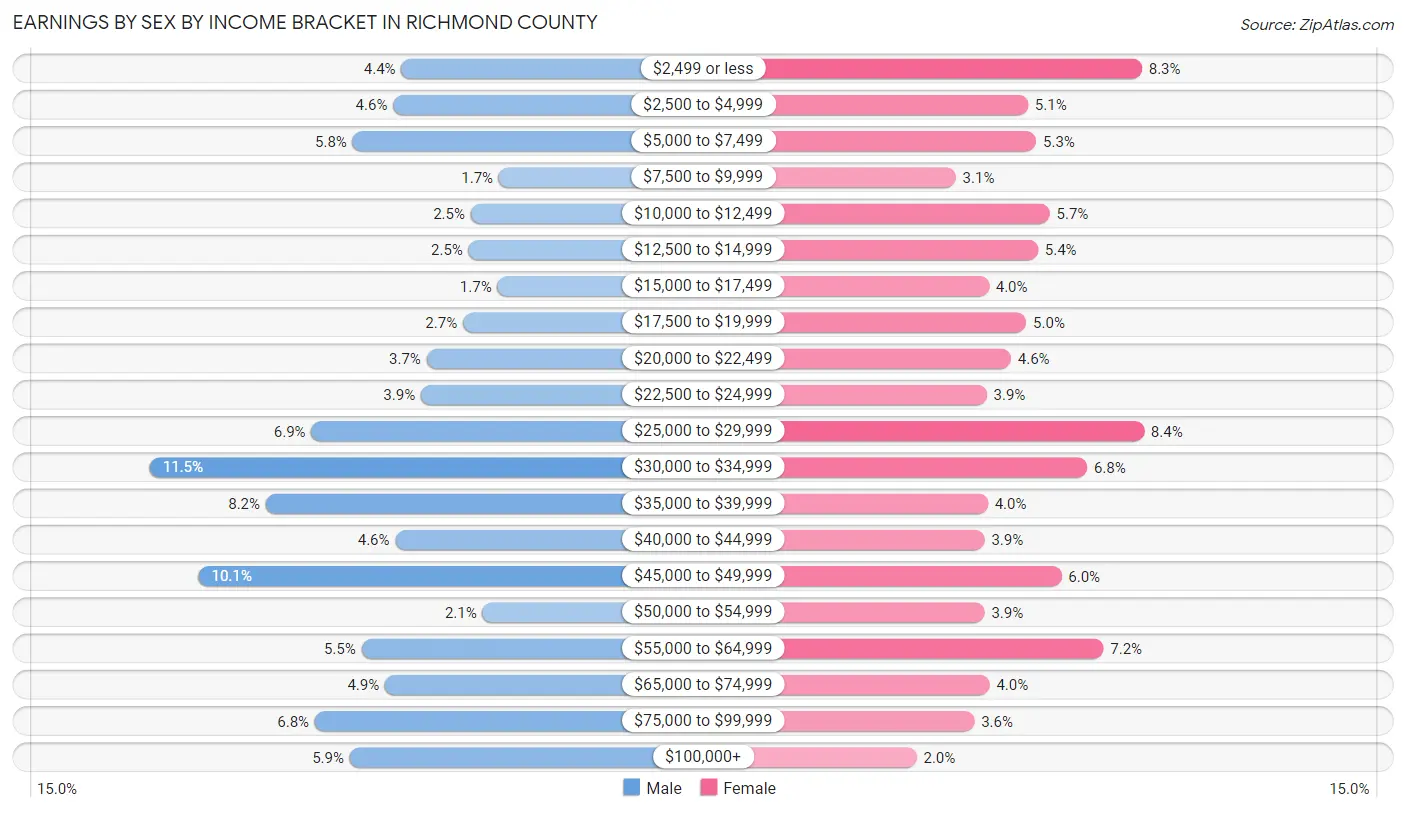
Earnings by Sex by Income Bracket in Richmond County
The most common earnings brackets in Richmond County are $30,000 to $34,999 for men (1,194 | 11.5%) and $25,000 to $29,999 for women (815 | 8.4%).
| Income | Male | Female |
| $2,499 or less | 459 (4.4%) | 809 (8.3%) |
| $2,500 to $4,999 | 483 (4.6%) | 497 (5.1%) |
| $5,000 to $7,499 | 601 (5.8%) | 519 (5.3%) |
| $7,500 to $9,999 | 174 (1.7%) | 299 (3.1%) |
| $10,000 to $12,499 | 256 (2.5%) | 556 (5.7%) |
| $12,500 to $14,999 | 262 (2.5%) | 524 (5.4%) |
| $15,000 to $17,499 | 178 (1.7%) | 389 (4.0%) |
| $17,500 to $19,999 | 279 (2.7%) | 492 (5.0%) |
| $20,000 to $22,499 | 385 (3.7%) | 450 (4.6%) |
| $22,500 to $24,999 | 402 (3.9%) | 383 (3.9%) |
| $25,000 to $29,999 | 722 (6.9%) | 815 (8.4%) |
| $30,000 to $34,999 | 1,194 (11.5%) | 659 (6.8%) |
| $35,000 to $39,999 | 855 (8.2%) | 386 (4.0%) |
| $40,000 to $44,999 | 477 (4.6%) | 378 (3.9%) |
| $45,000 to $49,999 | 1,052 (10.1%) | 588 (6.0%) |
| $50,000 to $54,999 | 222 (2.1%) | 378 (3.9%) |
| $55,000 to $64,999 | 575 (5.5%) | 703 (7.2%) |
| $65,000 to $74,999 | 507 (4.9%) | 391 (4.0%) |
| $75,000 to $99,999 | 712 (6.8%) | 349 (3.6%) |
| $100,000+ | 610 (5.9%) | 191 (2.0%) |
| Total | 10,405 (100.0%) | 9,756 (100.0%) |
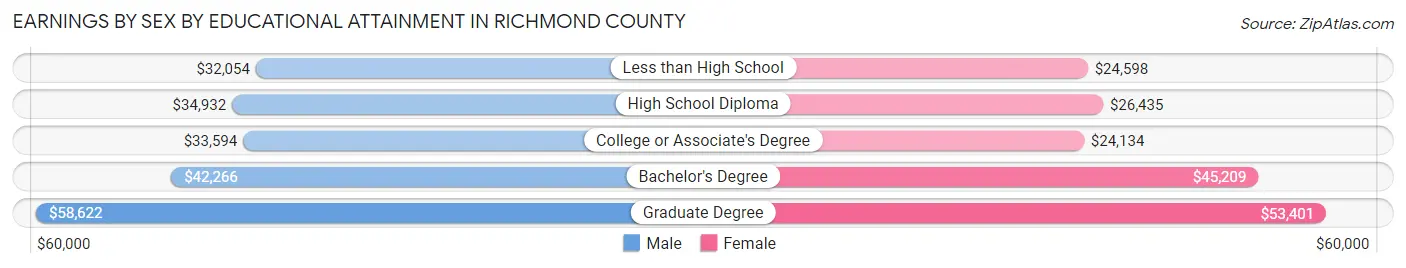
Earnings by Sex by Educational Attainment in Richmond County
Average earnings in Richmond County are $36,430 for men and $29,133 for women, a difference of 20.0%. Men with an educational attainment of graduate degree enjoy the highest average annual earnings of $58,622, while those with less than high school education earn the least with $32,054. Women with an educational attainment of graduate degree earn the most with the average annual earnings of $53,401, while those with college or associate's degree education have the smallest earnings of $24,134.
| Educational Attainment | Male Income | Female Income |
| Less than High School | $32,054 | $24,598 |
| High School Diploma | $34,932 | $26,435 |
| College or Associate's Degree | $33,594 | $24,134 |
| Bachelor's Degree | $42,266 | $45,209 |
| Graduate Degree | $58,622 | $53,401 |
| Total | $36,430 | $29,133 |
Family Income in Richmond County
Family Income Brackets in Richmond County
According to the Richmond County family income data, there are 2,085 families falling into the $50,000 to $74,999 income range, which is the most common income bracket and makes up 20.0% of all families. Conversely, the $200,000+ income bracket is the least frequent group with only 302 families (2.9%) belonging to this category.
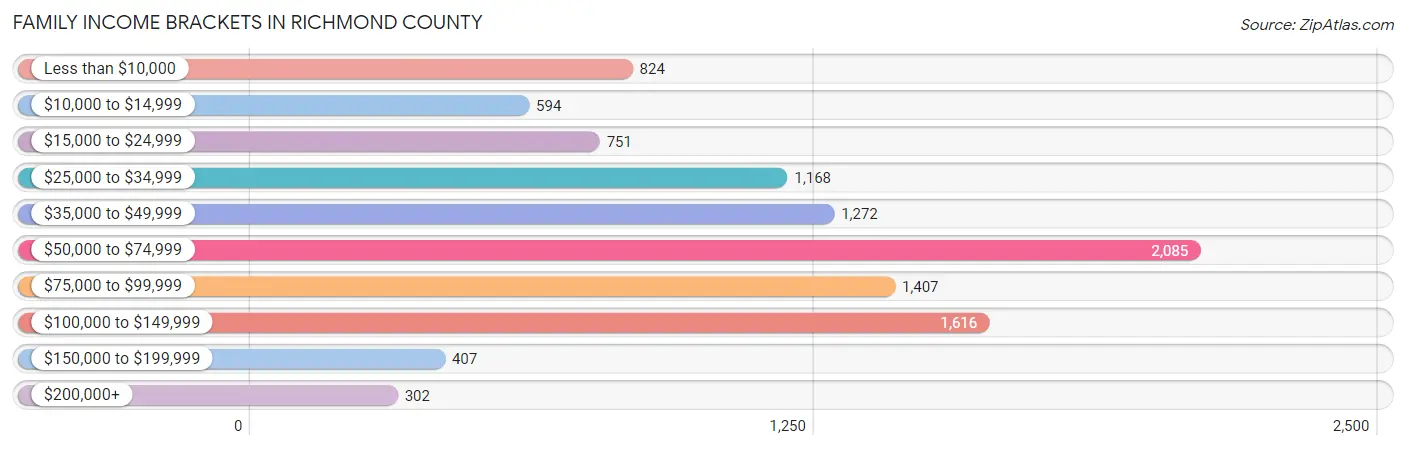
| Income Bracket | # Families | % Families |
| Less than $10,000 | 824 | 7.9% |
| $10,000 to $14,999 | 594 | 5.7% |
| $15,000 to $24,999 | 751 | 7.2% |
| $25,000 to $34,999 | 1,168 | 11.2% |
| $35,000 to $49,999 | 1,272 | 12.2% |
| $50,000 to $74,999 | 2,085 | 20.0% |
| $75,000 to $99,999 | 1,407 | 13.5% |
| $100,000 to $149,999 | 1,616 | 15.5% |
| $150,000 to $199,999 | 407 | 3.9% |
| $200,000+ | 302 | 2.9% |
Family Income by Famaliy Size in Richmond County
5-person families (706 | 6.8%) account for the highest median family income in Richmond County with $64,315 per family, while 2-person families (5,218 | 50.0%) have the highest median income of $28,720 per family member.
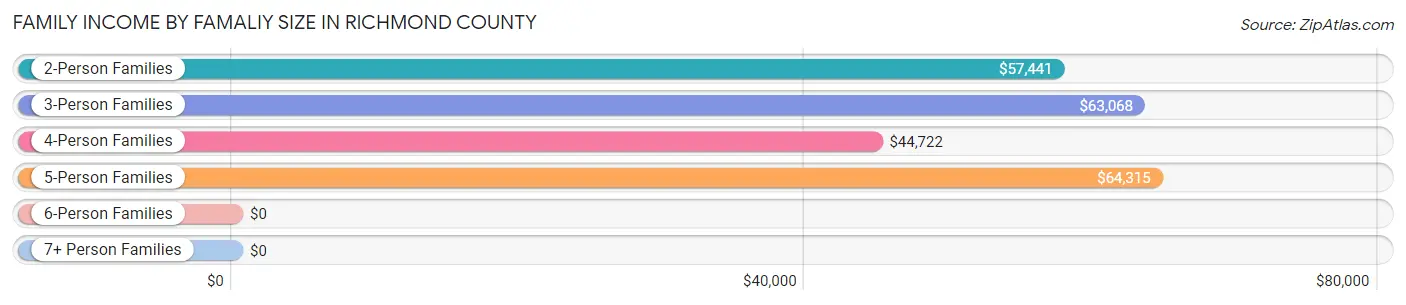
| Income Bracket | # Families | Median Income |
| 2-Person Families | 5,218 (50.0%) | $57,441 |
| 3-Person Families | 2,574 (24.7%) | $63,068 |
| 4-Person Families | 1,708 (16.4%) | $44,722 |
| 5-Person Families | 706 (6.8%) | $64,315 |
| 6-Person Families | 168 (1.6%) | $0 |
| 7+ Person Families | 51 (0.5%) | $0 |
| Total | 10,425 (100.0%) | $58,611 |
Family Income by Number of Earners in Richmond County
The median family income in Richmond County is $58,611, with families comprising 3+ earners (791) having the highest median family income of $104,052, while families with no earners (2,067) have the lowest median family income of $31,393, accounting for 7.6% and 19.8% of families, respectively.
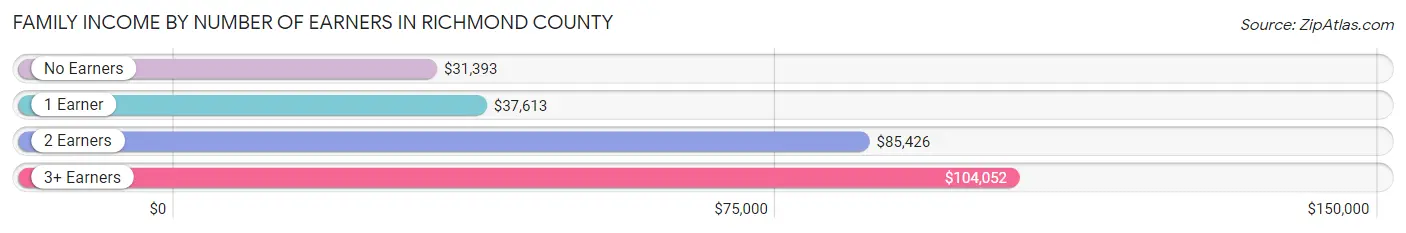
| Number of Earners | # Families | Median Income |
| No Earners | 2,067 (19.8%) | $31,393 |
| 1 Earner | 4,029 (38.7%) | $37,613 |
| 2 Earners | 3,538 (33.9%) | $85,426 |
| 3+ Earners | 791 (7.6%) | $104,052 |
| Total | 10,425 (100.0%) | $58,611 |
Household Income in Richmond County
Household Income Brackets in Richmond County
With 2,972 households falling in the category, the $50,000 to $74,999 income range is the most frequent in Richmond County, accounting for 17.9% of all households. In contrast, only 365 households (2.2%) fall into the $200,000+ income bracket, making it the least populous group.
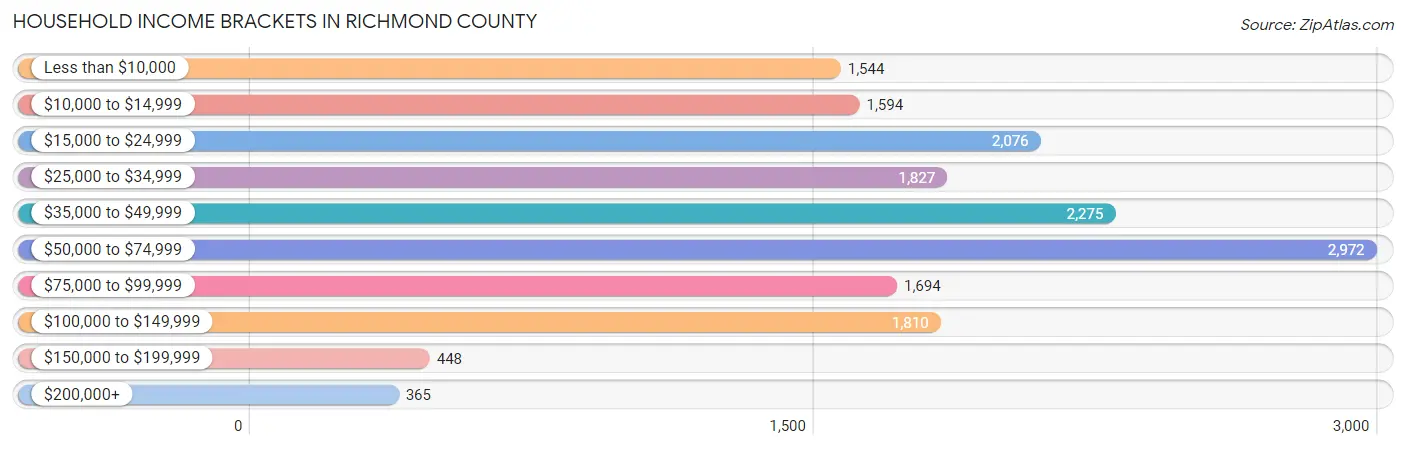
| Income Bracket | # Households | % Households |
| Less than $10,000 | 1,544 | 9.3% |
| $10,000 to $14,999 | 1,594 | 9.6% |
| $15,000 to $24,999 | 2,076 | 12.5% |
| $25,000 to $34,999 | 1,827 | 11.0% |
| $35,000 to $49,999 | 2,275 | 13.7% |
| $50,000 to $74,999 | 2,972 | 17.9% |
| $75,000 to $99,999 | 1,694 | 10.2% |
| $100,000 to $149,999 | 1,810 | 10.9% |
| $150,000 to $199,999 | 448 | 2.7% |
| $200,000+ | 365 | 2.2% |
Household Income by Householder Age in Richmond County
The median household income in Richmond County is $42,354, with the highest median household income of $54,773 found in the 45 to 64 years age bracket for the primary householder. A total of 6,374 households (38.4%) fall into this category. Meanwhile, the 15 to 24 years age bracket for the primary householder has the lowest median household income of $17,364, with 459 households (2.8%) in this group.
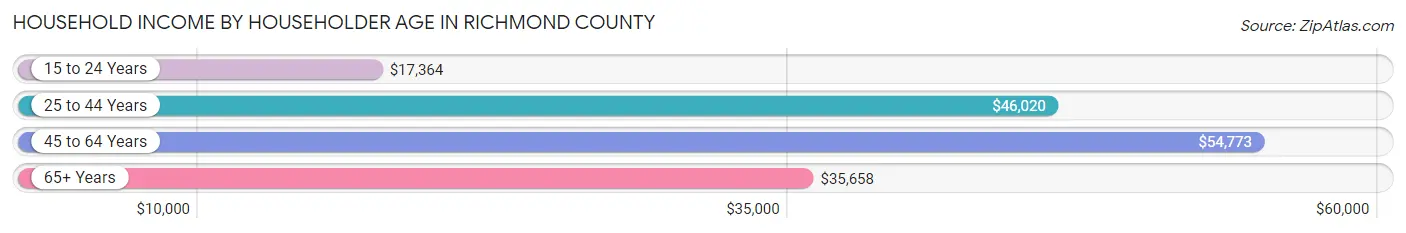
| Income Bracket | # Households | Median Income |
| 15 to 24 Years | 459 (2.8%) | $17,364 |
| 25 to 44 Years | 4,853 (29.2%) | $46,020 |
| 45 to 64 Years | 6,374 (38.4%) | $54,773 |
| 65+ Years | 4,919 (29.6%) | $35,658 |
| Total | 16,605 (100.0%) | $42,354 |
Poverty in Richmond County
Income Below Poverty by Sex and Age in Richmond County
With 21.8% poverty level for males and 24.1% for females among the residents of Richmond County, 5 year old males and 15 year old females are the most vulnerable to poverty, with 144 males (78.3%) and 155 females (50.0%) in their respective age groups living below the poverty level.
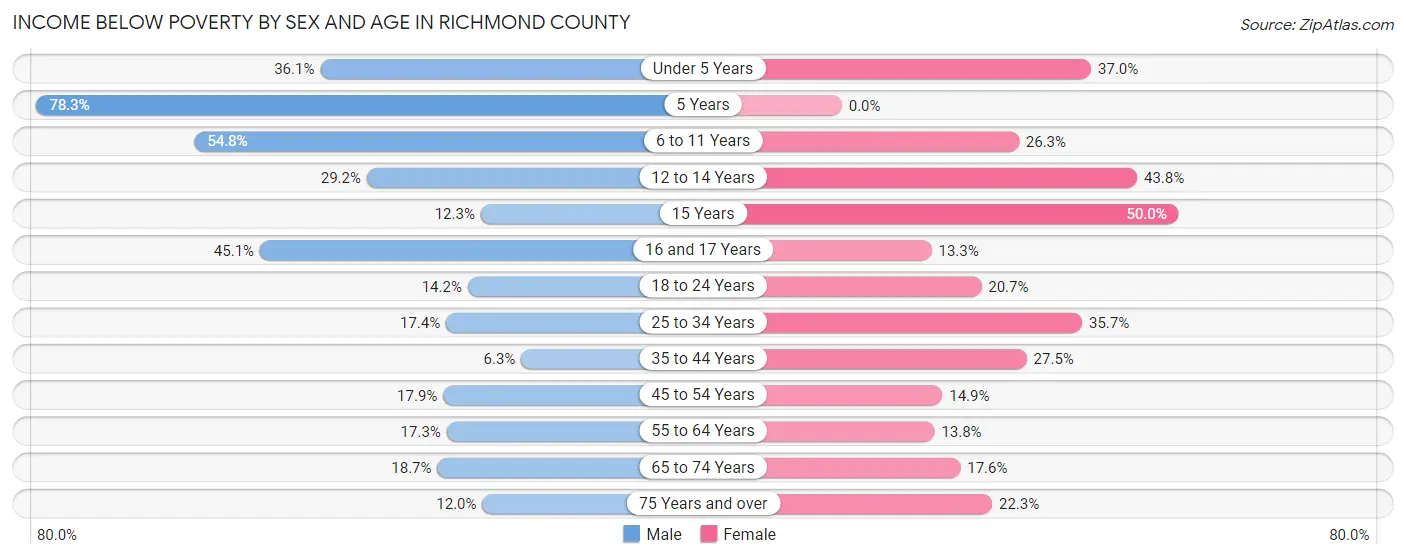
| Age Bracket | Male | Female |
| Under 5 Years | 439 (36.1%) | 485 (37.0%) |
| 5 Years | 144 (78.3%) | 0 (0.0%) |
| 6 to 11 Years | 967 (54.8%) | 383 (26.3%) |
| 12 to 14 Years | 263 (29.2%) | 473 (43.8%) |
| 15 Years | 34 (12.3%) | 155 (50.0%) |
| 16 and 17 Years | 251 (45.1%) | 96 (13.3%) |
| 18 to 24 Years | 273 (14.2%) | 334 (20.7%) |
| 25 to 34 Years | 381 (17.4%) | 1,006 (35.7%) |
| 35 to 44 Years | 152 (6.3%) | 694 (27.5%) |
| 45 to 54 Years | 462 (17.8%) | 406 (14.9%) |
| 55 to 64 Years | 474 (17.3%) | 401 (13.8%) |
| 65 to 74 Years | 400 (18.7%) | 438 (17.6%) |
| 75 Years and over | 142 (12.0%) | 378 (22.3%) |
| Total | 4,382 (21.8%) | 5,249 (24.1%) |
Income Above Poverty by Sex and Age in Richmond County
According to the poverty statistics in Richmond County, males aged 35 to 44 years and females aged 5 years are the age groups that are most secure financially, with 93.7% of males and 100.0% of females in these age groups living above the poverty line.
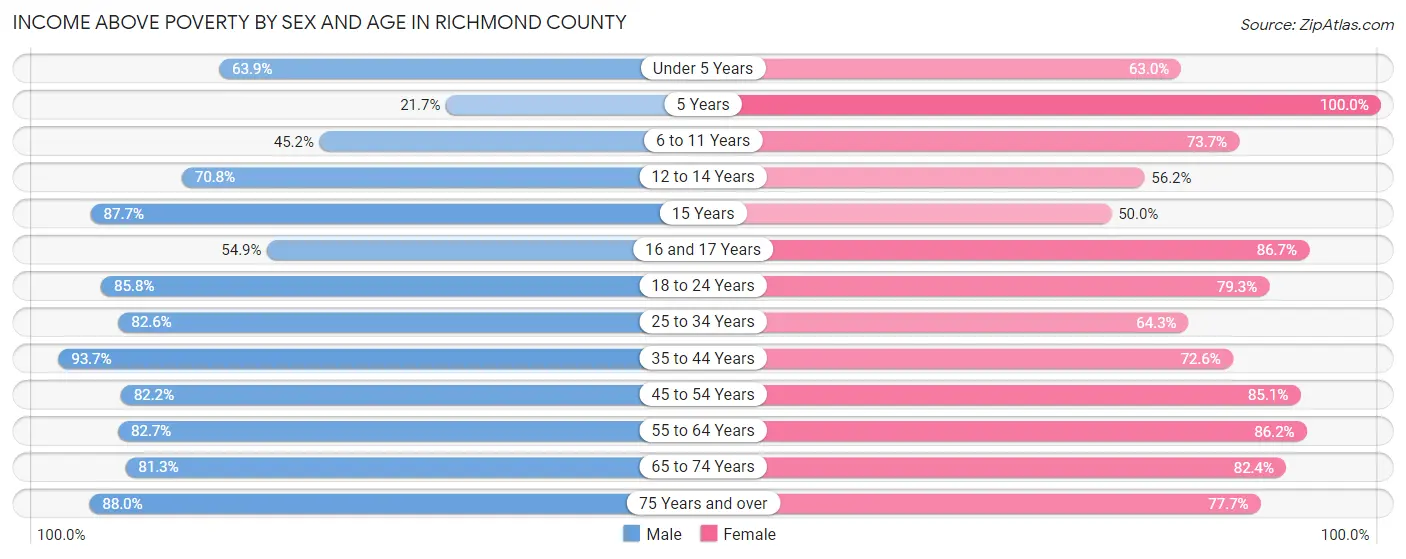
| Age Bracket | Male | Female |
| Under 5 Years | 777 (63.9%) | 825 (63.0%) |
| 5 Years | 40 (21.7%) | 125 (100.0%) |
| 6 to 11 Years | 798 (45.2%) | 1,074 (73.7%) |
| 12 to 14 Years | 638 (70.8%) | 606 (56.2%) |
| 15 Years | 243 (87.7%) | 155 (50.0%) |
| 16 and 17 Years | 306 (54.9%) | 624 (86.7%) |
| 18 to 24 Years | 1,649 (85.8%) | 1,279 (79.3%) |
| 25 to 34 Years | 1,806 (82.6%) | 1,814 (64.3%) |
| 35 to 44 Years | 2,276 (93.7%) | 1,834 (72.6%) |
| 45 to 54 Years | 2,126 (82.2%) | 2,313 (85.1%) |
| 55 to 64 Years | 2,261 (82.7%) | 2,513 (86.2%) |
| 65 to 74 Years | 1,738 (81.3%) | 2,050 (82.4%) |
| 75 Years and over | 1,038 (88.0%) | 1,316 (77.7%) |
| Total | 15,696 (78.2%) | 16,528 (75.9%) |
Income Below Poverty Among Married-Couple Families in Richmond County
The poverty statistics for married-couple families in Richmond County show that 3.5% or 217 of the total 6,296 families live below the poverty line. Families with 3 or 4 children have the highest poverty rate of 8.0%, comprising of 24 families. On the other hand, families with 5 or more children have the lowest poverty rate of 0.0%, which includes 0 families.
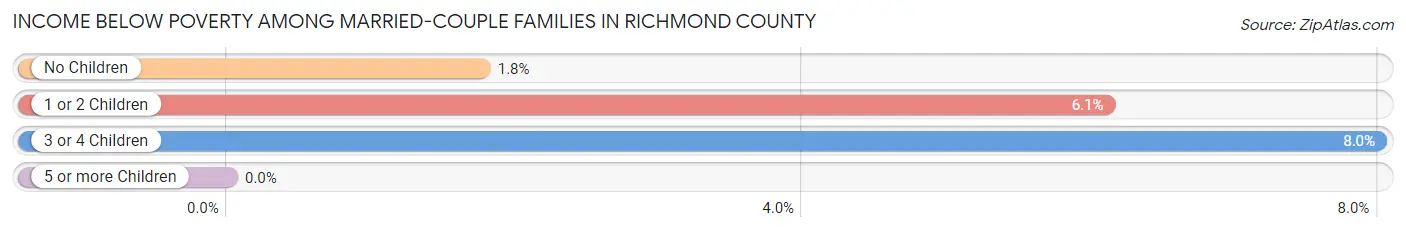
| Children | Above Poverty | Below Poverty |
| No Children | 3,852 (98.2%) | 69 (1.8%) |
| 1 or 2 Children | 1,907 (93.9%) | 124 (6.1%) |
| 3 or 4 Children | 276 (92.0%) | 24 (8.0%) |
| 5 or more Children | 44 (100.0%) | 0 (0.0%) |
| Total | 6,079 (96.6%) | 217 (3.5%) |
Income Below Poverty Among Single-Parent Households in Richmond County
According to the poverty data in Richmond County, 24.2% or 250 single-father households and 49.0% or 1,516 single-mother households are living below the poverty line. Among single-father households, those with 1 or 2 children have the highest poverty rate, with 199 households (43.8%) experiencing poverty. Likewise, among single-mother households, those with 3 or 4 children have the highest poverty rate, with 490 households (75.4%) falling below the poverty line.
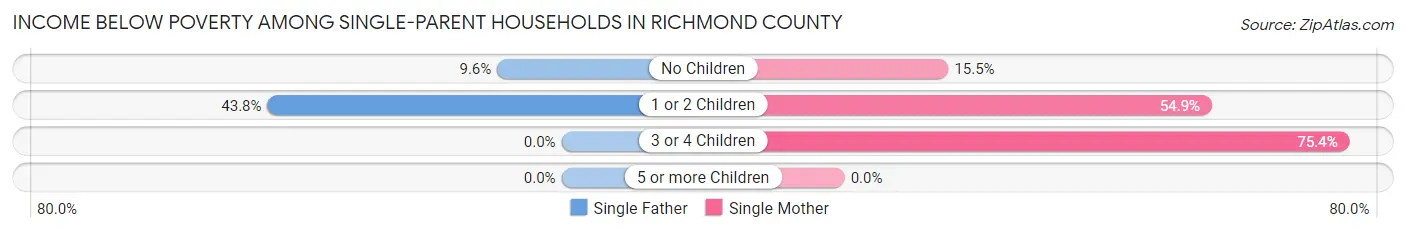
| Children | Single Father | Single Mother |
| No Children | 51 (9.6%) | 124 (15.5%) |
| 1 or 2 Children | 199 (43.8%) | 902 (54.9%) |
| 3 or 4 Children | 0 (0.0%) | 490 (75.4%) |
| 5 or more Children | 0 (0.0%) | 0 (0.0%) |
| Total | 250 (24.2%) | 1,516 (49.0%) |
Income Below Poverty Among Married-Couple vs Single-Parent Households in Richmond County
The poverty data for Richmond County shows that 217 of the married-couple family households (3.5%) and 1,766 of the single-parent households (42.8%) are living below the poverty level. Within the married-couple family households, those with 3 or 4 children have the highest poverty rate, with 24 households (8.0%) falling below the poverty line. Among the single-parent households, those with 3 or 4 children have the highest poverty rate, with 490 household (70.3%) living below poverty.
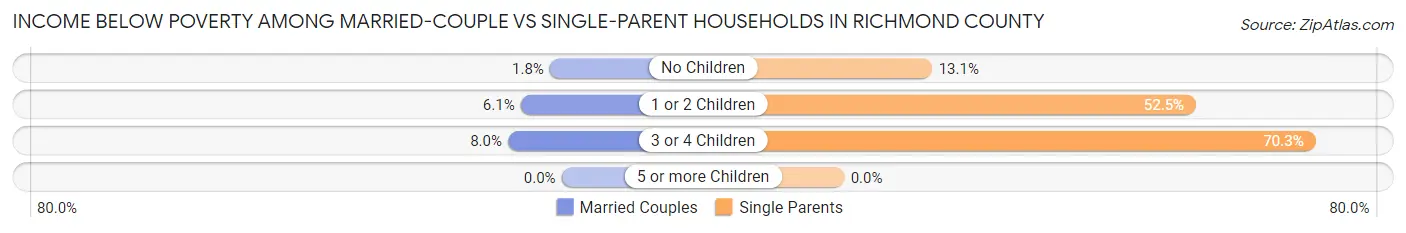
| Children | Married-Couple Families | Single-Parent Households |
| No Children | 69 (1.8%) | 175 (13.1%) |
| 1 or 2 Children | 124 (6.1%) | 1,101 (52.5%) |
| 3 or 4 Children | 24 (8.0%) | 490 (70.3%) |
| 5 or more Children | 0 (0.0%) | 0 (0.0%) |
| Total | 217 (3.5%) | 1,766 (42.8%) |
Race in Richmond County
The most populous races in Richmond County are White / Caucasian (24,952 | 57.8%), Black / African American (13,775 | 31.9%), and Hispanic or Latino (3,085 | 7.1%).
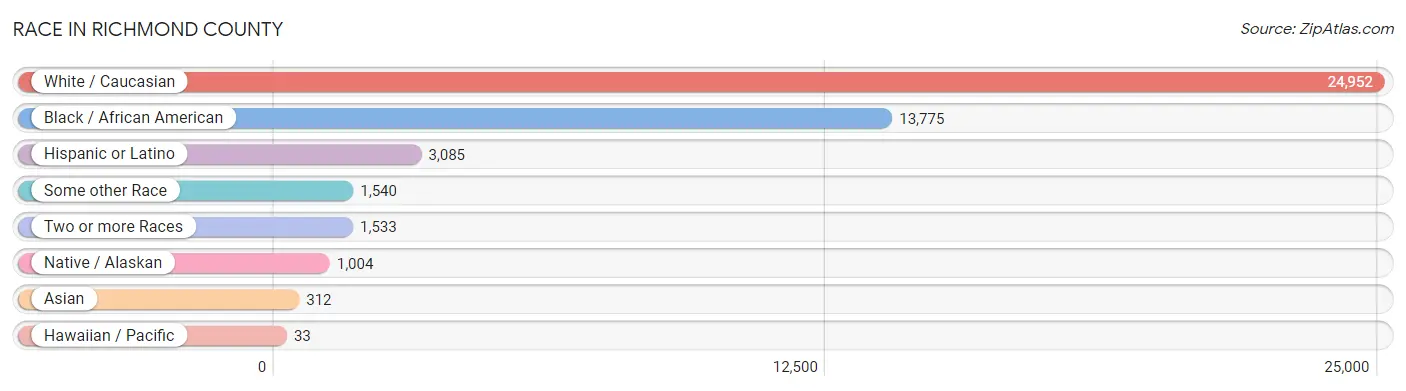
| Race | # Population | % Population |
| Asian | 312 | 0.7% |
| Black / African American | 13,775 | 31.9% |
| Hawaiian / Pacific | 33 | 0.1% |
| Hispanic or Latino | 3,085 | 7.1% |
| Native / Alaskan | 1,004 | 2.3% |
| White / Caucasian | 24,952 | 57.8% |
| Two or more Races | 1,533 | 3.5% |
| Some other Race | 1,540 | 3.6% |
| Total | 43,149 | 100.0% |
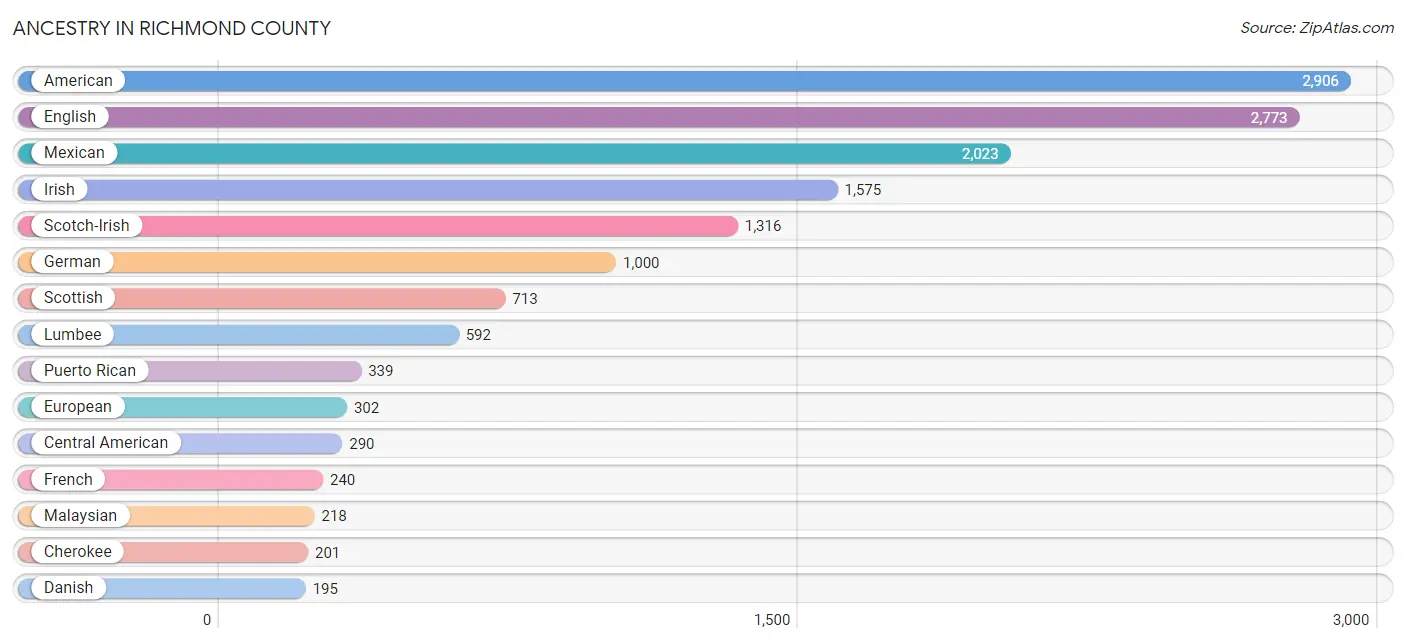
Ancestry in Richmond County
The most populous ancestries reported in Richmond County are American (2,906 | 6.7%), English (2,773 | 6.4%), Mexican (2,023 | 4.7%), Irish (1,575 | 3.6%), and Scotch-Irish (1,316 | 3.0%), together accounting for 24.5% of all Richmond County residents.
| Ancestry | # Population | % Population |
| African | 84 | 0.2% |
| Alaskan Athabascan | 22 | 0.1% |
| American | 2,906 | 6.7% |
| Arab | 59 | 0.1% |
| Australian | 5 | 0.0% |
| Austrian | 12 | 0.0% |
| Bangladeshi | 130 | 0.3% |
| British | 53 | 0.1% |
| Burmese | 30 | 0.1% |
| Celtic | 10 | 0.0% |
| Central American | 290 | 0.7% |
| Cherokee | 201 | 0.5% |
| Chickasaw | 44 | 0.1% |
| Colombian | 177 | 0.4% |
| Cuban | 49 | 0.1% |
| Czech | 10 | 0.0% |
| Danish | 195 | 0.4% |
| Dutch | 81 | 0.2% |
| Eastern European | 49 | 0.1% |
| Egyptian | 6 | 0.0% |
| English | 2,773 | 6.4% |
| European | 302 | 0.7% |
| Finnish | 12 | 0.0% |
| French | 240 | 0.6% |
| French Canadian | 43 | 0.1% |
| German | 1,000 | 2.3% |
| Greek | 27 | 0.1% |
| Guamanian / Chamorro | 33 | 0.1% |
| Guatemalan | 179 | 0.4% |
| Hungarian | 12 | 0.0% |
| Indian (Asian) | 6 | 0.0% |
| Irish | 1,575 | 3.6% |
| Iroquois | 33 | 0.1% |
| Italian | 156 | 0.4% |
| Jamaican | 27 | 0.1% |
| Lebanese | 23 | 0.1% |
| Lithuanian | 17 | 0.0% |
| Lumbee | 592 | 1.4% |
| Malaysian | 218 | 0.5% |
| Mexican | 2,023 | 4.7% |
| Moroccan | 30 | 0.1% |
| Navajo | 183 | 0.4% |
| Northern European | 9 | 0.0% |
| Osage | 18 | 0.0% |
| Panamanian | 49 | 0.1% |
| Peruvian | 3 | 0.0% |
| Polish | 149 | 0.4% |
| Portuguese | 37 | 0.1% |
| Puerto Rican | 339 | 0.8% |
| Russian | 104 | 0.2% |
| Salvadoran | 62 | 0.1% |
| Scandinavian | 8 | 0.0% |
| Scotch-Irish | 1,316 | 3.0% |
| Scottish | 713 | 1.7% |
| Sioux | 8 | 0.0% |
| Slovak | 7 | 0.0% |
| Slovene | 10 | 0.0% |
| South American | 180 | 0.4% |
| Spaniard | 48 | 0.1% |
| Sri Lankan | 38 | 0.1% |
| Subsaharan African | 84 | 0.2% |
| Swedish | 29 | 0.1% |
| Swiss | 12 | 0.0% |
| Thai | 119 | 0.3% |
| Tohono O'Odham | 21 | 0.1% |
| Turkish | 6 | 0.0% |
| Ukrainian | 15 | 0.0% |
| Welsh | 88 | 0.2% |
| West Indian | 55 | 0.1% | View All 69 Rows |
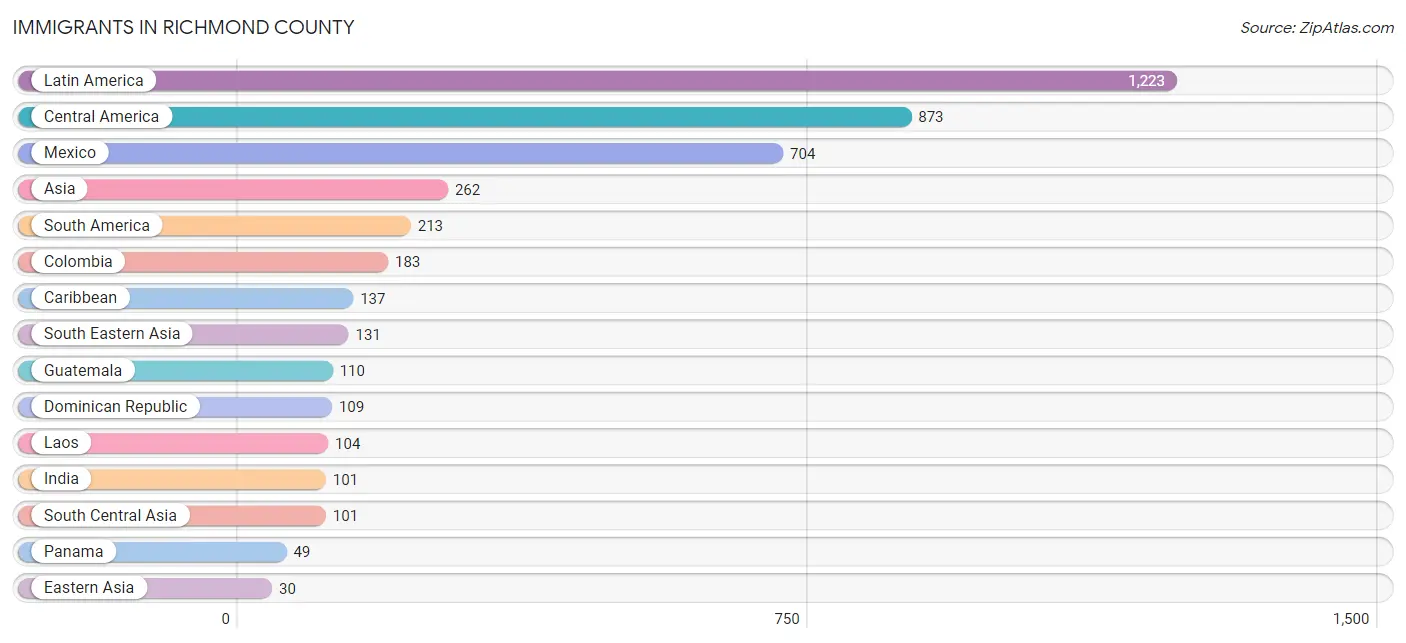
Immigrants in Richmond County
The most numerous immigrant groups reported in Richmond County came from Latin America (1,223 | 2.8%), Central America (873 | 2.0%), Mexico (704 | 1.6%), Asia (262 | 0.6%), and South America (213 | 0.5%), together accounting for 7.6% of all Richmond County residents.
| Immigration Origin | # Population | % Population |
| Asia | 262 | 0.6% |
| Australia | 5 | 0.0% |
| Caribbean | 137 | 0.3% |
| Central America | 873 | 2.0% |
| Colombia | 183 | 0.4% |
| Cuba | 16 | 0.0% |
| Dominican Republic | 109 | 0.3% |
| Eastern Asia | 30 | 0.1% |
| El Salvador | 5 | 0.0% |
| Europe | 26 | 0.1% |
| Guatemala | 110 | 0.3% |
| Guyana | 22 | 0.1% |
| Honduras | 5 | 0.0% |
| India | 101 | 0.2% |
| Korea | 30 | 0.1% |
| Laos | 104 | 0.2% |
| Latin America | 1,223 | 2.8% |
| Mexico | 704 | 1.6% |
| Netherlands | 14 | 0.0% |
| Northern Europe | 12 | 0.0% |
| Oceania | 5 | 0.0% |
| Panama | 49 | 0.1% |
| Peru | 8 | 0.0% |
| South America | 213 | 0.5% |
| South Central Asia | 101 | 0.2% |
| South Eastern Asia | 131 | 0.3% |
| Trinidad and Tobago | 12 | 0.0% |
| Vietnam | 27 | 0.1% |
| Western Europe | 14 | 0.0% | View All 29 Rows |
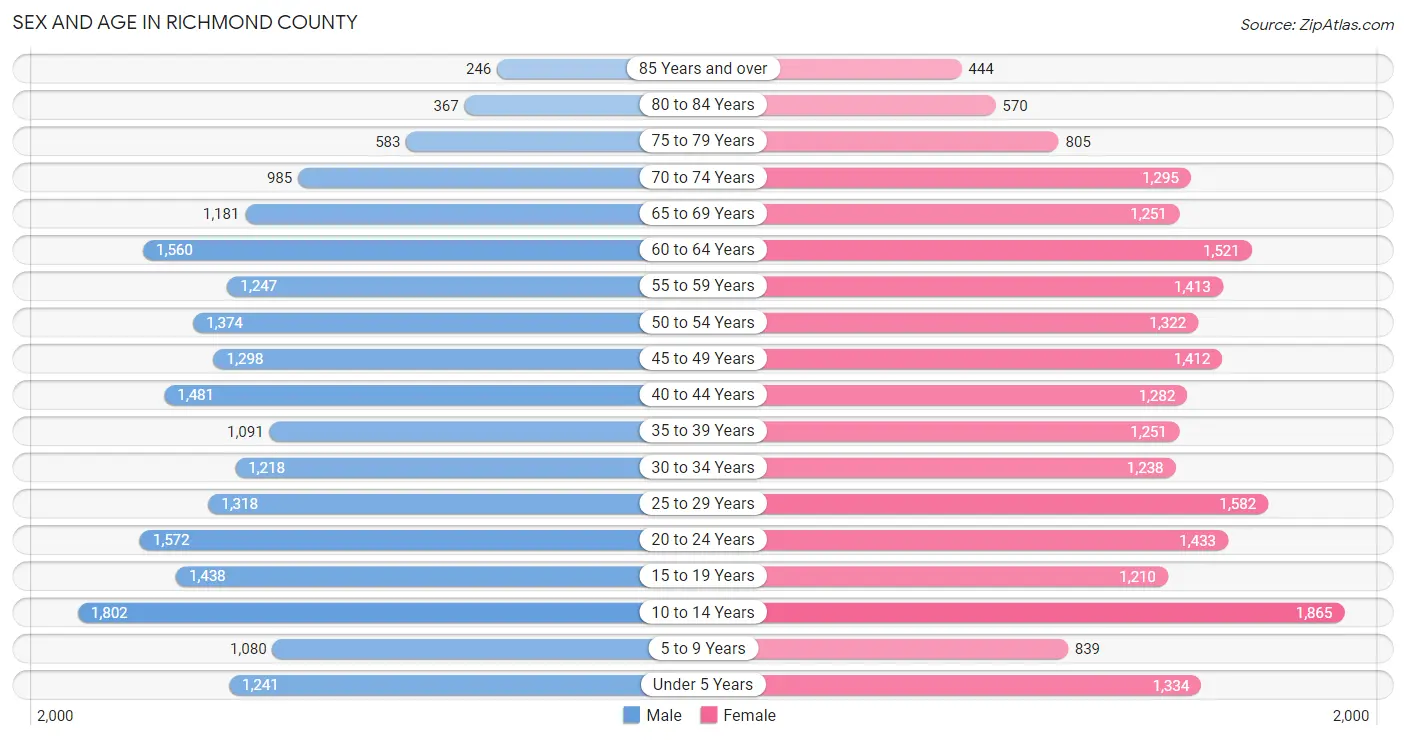
Sex and Age in Richmond County
Sex and Age in Richmond County
The most populous age groups in Richmond County are 10 to 14 Years (1,802 | 8.6%) for men and 10 to 14 Years (1,865 | 8.5%) for women.
| Age Bracket | Male | Female |
| Under 5 Years | 1,241 (5.9%) | 1,334 (6.0%) |
| 5 to 9 Years | 1,080 (5.1%) | 839 (3.8%) |
| 10 to 14 Years | 1,802 (8.6%) | 1,865 (8.5%) |
| 15 to 19 Years | 1,438 (6.8%) | 1,210 (5.5%) |
| 20 to 24 Years | 1,572 (7.5%) | 1,433 (6.5%) |
| 25 to 29 Years | 1,318 (6.2%) | 1,582 (7.2%) |
| 30 to 34 Years | 1,218 (5.8%) | 1,238 (5.6%) |
| 35 to 39 Years | 1,091 (5.2%) | 1,251 (5.7%) |
| 40 to 44 Years | 1,481 (7.0%) | 1,282 (5.8%) |
| 45 to 49 Years | 1,298 (6.2%) | 1,412 (6.4%) |
| 50 to 54 Years | 1,374 (6.5%) | 1,322 (6.0%) |
| 55 to 59 Years | 1,247 (5.9%) | 1,413 (6.4%) |
| 60 to 64 Years | 1,560 (7.4%) | 1,521 (6.9%) |
| 65 to 69 Years | 1,181 (5.6%) | 1,251 (5.7%) |
| 70 to 74 Years | 985 (4.7%) | 1,295 (5.9%) |
| 75 to 79 Years | 583 (2.8%) | 805 (3.6%) |
| 80 to 84 Years | 367 (1.7%) | 570 (2.6%) |
| 85 Years and over | 246 (1.2%) | 444 (2.0%) |
| Total | 21,082 (100.0%) | 22,067 (100.0%) |
Families and Households in Richmond County
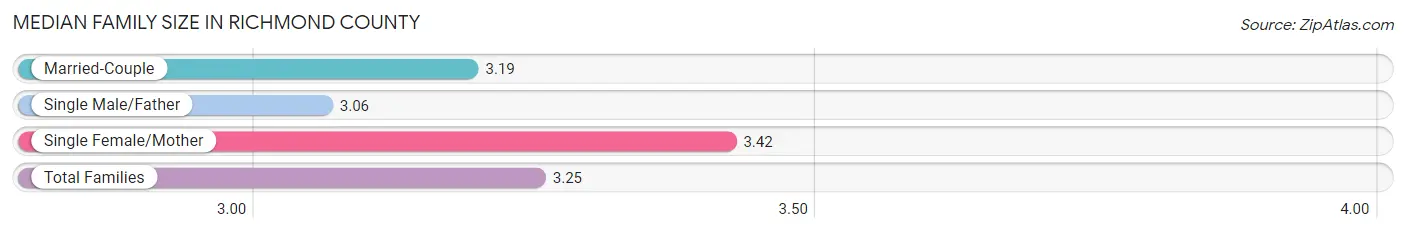
Median Family Size in Richmond County
The median family size in Richmond County is 3.25 persons per family, with single female/mother families (3,096 | 29.7%) accounting for the largest median family size of 3.42 persons per family. On the other hand, single male/father families (1,033 | 9.9%) represent the smallest median family size with 3.06 persons per family.
| Family Type | # Families | Family Size |
| Married-Couple | 6,296 (60.4%) | 3.19 |
| Single Male/Father | 1,033 (9.9%) | 3.06 |
| Single Female/Mother | 3,096 (29.7%) | 3.42 |
| Total Families | 10,425 (100.0%) | 3.25 |
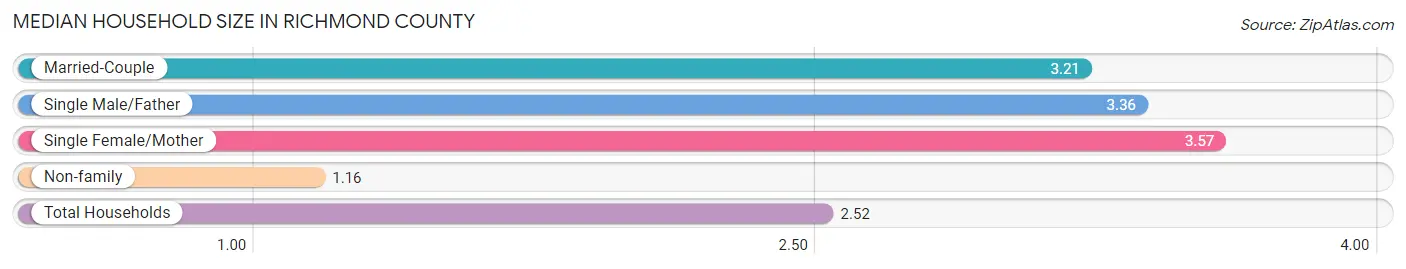
Median Household Size in Richmond County
The median household size in Richmond County is 2.52 persons per household, with single female/mother households (3,096 | 18.6%) accounting for the largest median household size of 3.57 persons per household. non-family households (6,180 | 37.2%) represent the smallest median household size with 1.16 persons per household.
| Household Type | # Households | Household Size |
| Married-Couple | 6,296 (37.9%) | 3.21 |
| Single Male/Father | 1,033 (6.2%) | 3.36 |
| Single Female/Mother | 3,096 (18.6%) | 3.57 |
| Non-family | 6,180 (37.2%) | 1.16 |
| Total Households | 16,605 (100.0%) | 2.52 |
Household Size by Marriage Status in Richmond County
Out of a total of 16,605 households in Richmond County, 10,425 (62.8%) are family households, while 6,180 (37.2%) are nonfamily households. The most numerous type of family households are 2-person households, comprising 4,948, and the most common type of nonfamily households are 1-person households, comprising 5,350.
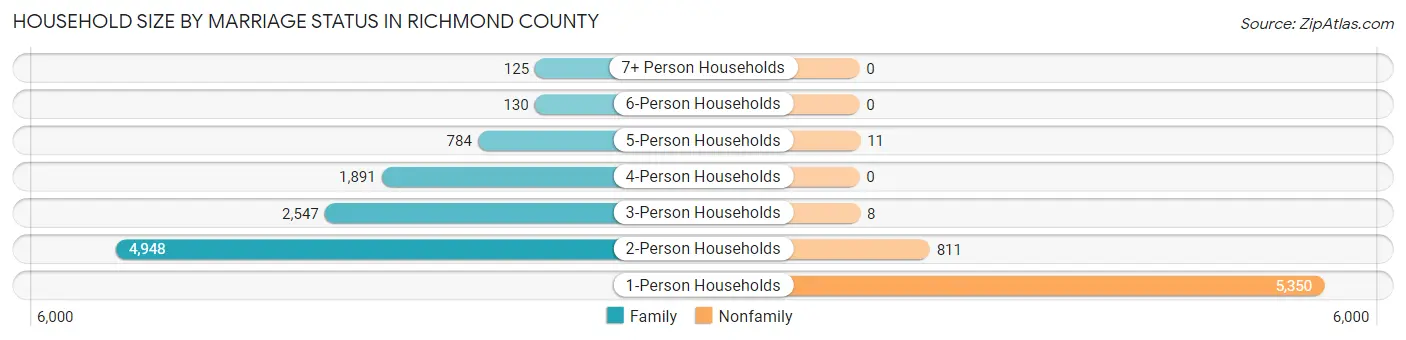
| Household Size | Family Households | Nonfamily Households |
| 1-Person Households | - | 5,350 (32.2%) |
| 2-Person Households | 4,948 (29.8%) | 811 (4.9%) |
| 3-Person Households | 2,547 (15.3%) | 8 (0.1%) |
| 4-Person Households | 1,891 (11.4%) | 0 (0.0%) |
| 5-Person Households | 784 (4.7%) | 11 (0.1%) |
| 6-Person Households | 130 (0.8%) | 0 (0.0%) |
| 7+ Person Households | 125 (0.7%) | 0 (0.0%) |
| Total | 10,425 (62.8%) | 6,180 (37.2%) |
Female Fertility in Richmond County
Fertility by Age in Richmond County
Average fertility rate in Richmond County is 49.0 births per 1,000 women. Women in the age bracket of 20 to 34 years have the highest fertility rate with 64.0 births per 1,000 women. Women in the age bracket of 20 to 34 years acount for 57.4% of all women with births.
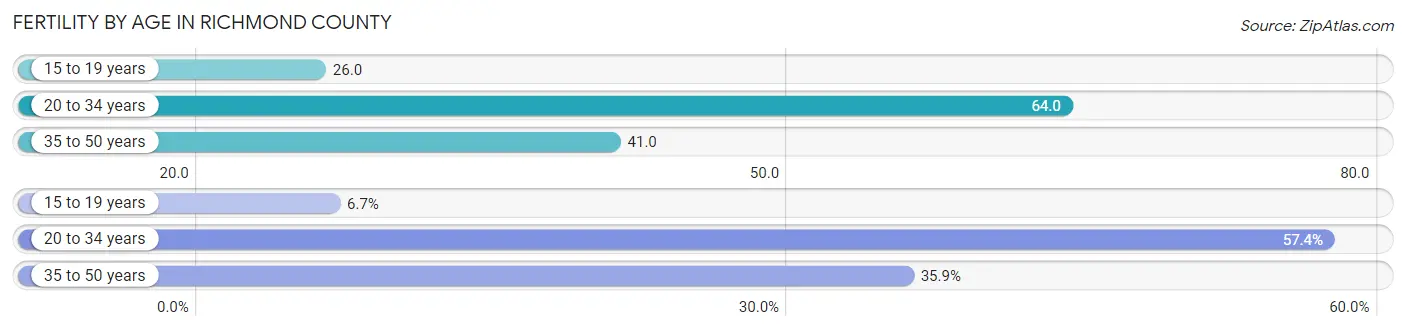
| Age Bracket | Women with Births | Births / 1,000 Women |
| 15 to 19 years | 32 (6.7%) | 26.0 |
| 20 to 34 years | 273 (57.4%) | 64.0 |
| 35 to 50 years | 171 (35.9%) | 41.0 |
| Total | 476 (100.0%) | 49.0 |
Fertility by Age by Marriage Status in Richmond County
39.3% of women with births (476) in Richmond County are married. The highest percentage of unmarried women with births falls into 15 to 19 years age bracket with 100.0% of them unmarried at the time of birth, while the lowest percentage of unmarried women with births belong to 35 to 50 years age bracket with 12.9% of them unmarried.
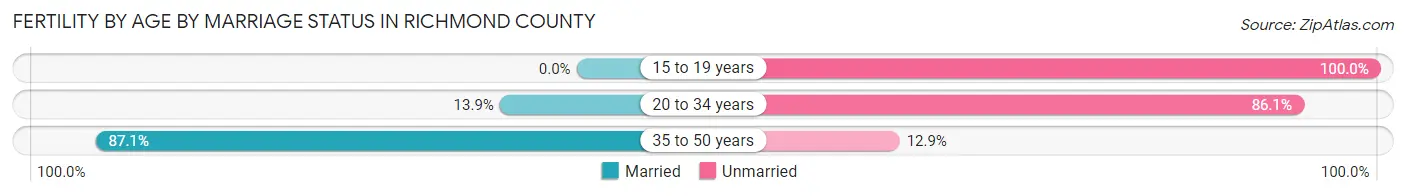
| Age Bracket | Married | Unmarried |
| 15 to 19 years | 0 (0.0%) | 32 (100.0%) |
| 20 to 34 years | 38 (13.9%) | 235 (86.1%) |
| 35 to 50 years | 149 (87.1%) | 22 (12.9%) |
| Total | 187 (39.3%) | 289 (60.7%) |
Fertility by Education in Richmond County
Average fertility rate in Richmond County is 49.0 births per 1,000 women. Women with the education attainment of graduate degree have the highest fertility rate of 66.0 births per 1,000 women, while women with the education attainment of less than high school have the lowest fertility at 32.0 births per 1,000 women. Women with the education attainment of college or associate's degree represent 38.7% of all women with births.
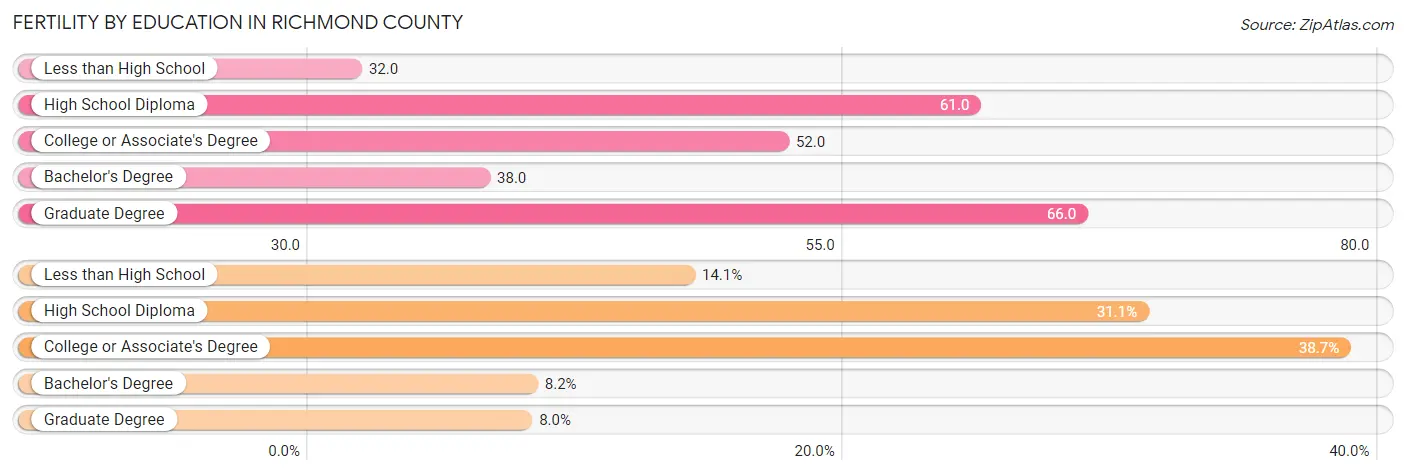
| Educational Attainment | Women with Births | Births / 1,000 Women |
| Less than High School | 67 (14.1%) | 32.0 |
| High School Diploma | 148 (31.1%) | 61.0 |
| College or Associate's Degree | 184 (38.7%) | 52.0 |
| Bachelor's Degree | 39 (8.2%) | 38.0 |
| Graduate Degree | 38 (8.0%) | 66.0 |
| Total | 476 (100.0%) | 49.0 |
Fertility by Education by Marriage Status in Richmond County
60.7% of women with births in Richmond County are unmarried. Women with the educational attainment of graduate degree are most likely to be married with 100.0% of them married at childbirth, while women with the educational attainment of less than high school are least likely to be married with 100.0% of them unmarried at childbirth.
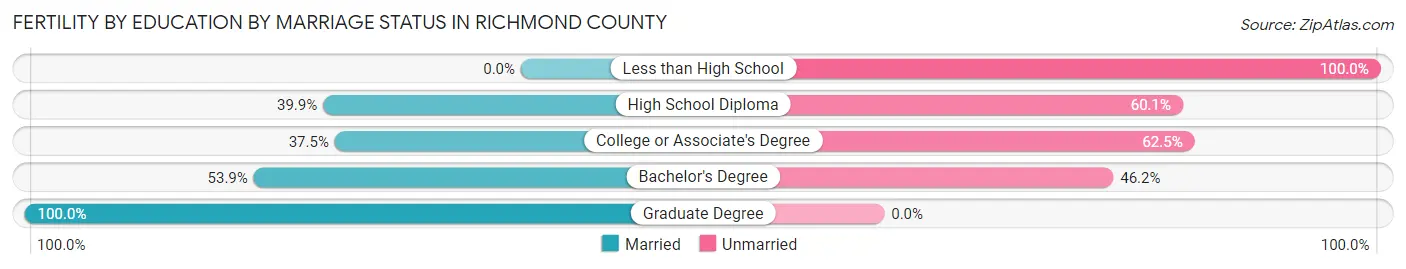
| Educational Attainment | Married | Unmarried |
| Less than High School | 0 (0.0%) | 67 (100.0%) |
| High School Diploma | 59 (39.9%) | 89 (60.1%) |
| College or Associate's Degree | 69 (37.5%) | 115 (62.5%) |
| Bachelor's Degree | 21 (53.8%) | 18 (46.2%) |
| Graduate Degree | 38 (100.0%) | 0 (0.0%) |
| Total | 187 (39.3%) | 289 (60.7%) |
Employment Characteristics in Richmond County
Employment by Class of Employer in Richmond County
Among the 17,681 employed individuals in Richmond County, private company employees (12,213 | 69.1%), local government employees (1,610 | 9.1%), and state government employees (1,365 | 7.7%) make up the most common classes of employment.
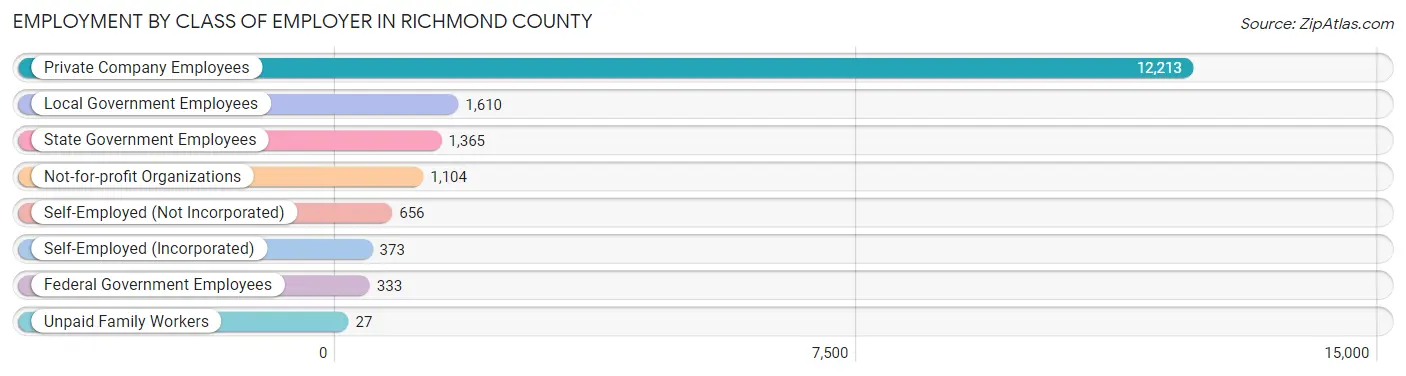
| Employer Class | # Employees | % Employees |
| Private Company Employees | 12,213 | 69.1% |
| Self-Employed (Incorporated) | 373 | 2.1% |
| Self-Employed (Not Incorporated) | 656 | 3.7% |
| Not-for-profit Organizations | 1,104 | 6.2% |
| Local Government Employees | 1,610 | 9.1% |
| State Government Employees | 1,365 | 7.7% |
| Federal Government Employees | 333 | 1.9% |
| Unpaid Family Workers | 27 | 0.2% |
| Total | 17,681 | 100.0% |
Employment Status by Age in Richmond County
According to the labor force statistics for Richmond County, out of the total population over 16 years of age (34,394), 57.9% or 19,914 individuals are in the labor force, with 9.6% or 1,912 of them unemployed. The age group with the highest labor force participation rate is 20 to 24 years, with 83.2% or 2,500 individuals in the labor force. Within the labor force, the 16 to 19 years age range has the highest percentage of unemployed individuals, with 30.3% or 276 of them being unemployed.
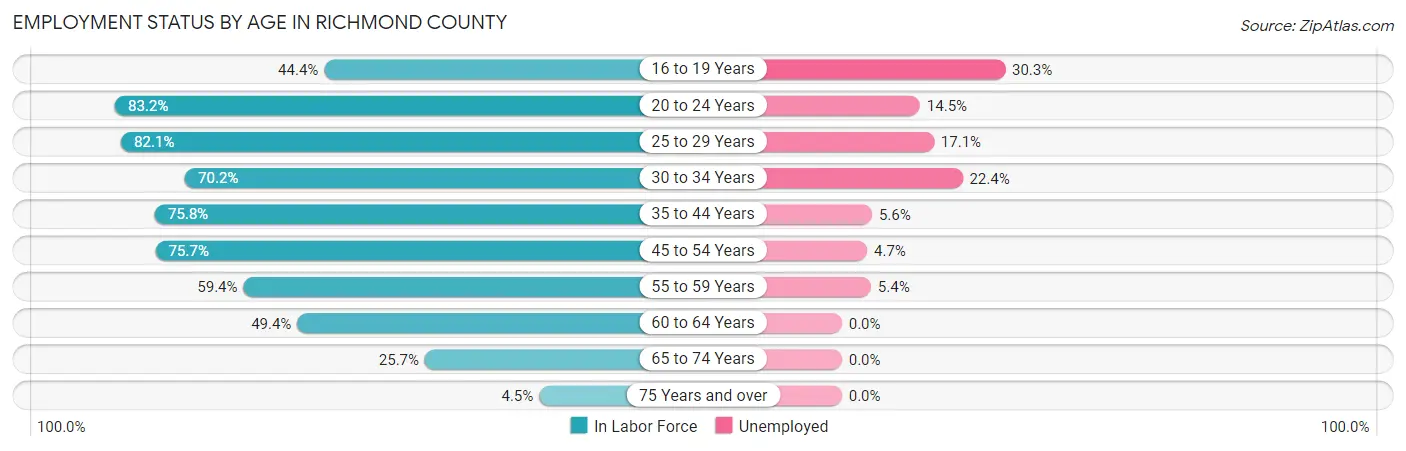
| Age Bracket | In Labor Force | Unemployed |
| 16 to 19 Years | 912 (44.4%) | 276 (30.3%) |
| 20 to 24 Years | 2,500 (83.2%) | 362 (14.5%) |
| 25 to 29 Years | 2,381 (82.1%) | 407 (17.1%) |
| 30 to 34 Years | 1,724 (70.2%) | 386 (22.4%) |
| 35 to 44 Years | 3,870 (75.8%) | 217 (5.6%) |
| 45 to 54 Years | 4,092 (75.7%) | 192 (4.7%) |
| 55 to 59 Years | 1,580 (59.4%) | 85 (5.4%) |
| 60 to 64 Years | 1,522 (49.4%) | 0 (0.0%) |
| 65 to 74 Years | 1,211 (25.7%) | 0 (0.0%) |
| 75 Years and over | 136 (4.5%) | 0 (0.0%) |
| Total | 19,914 (57.9%) | 1,912 (9.6%) |
Employment Status by Educational Attainment in Richmond County
According to labor force statistics for Richmond County, 70.2% of individuals (15,169) out of the total population between 25 and 64 years of age (21,608) are in the labor force, with 8.4% or 1,274 of them being unemployed. The group with the highest labor force participation rate are those with the educational attainment of bachelor's degree or higher, with 88.9% or 3,219 individuals in the labor force. Within the labor force, individuals with high school diploma education have the highest percentage of unemployment, with 12.6% or 532 of them being unemployed.
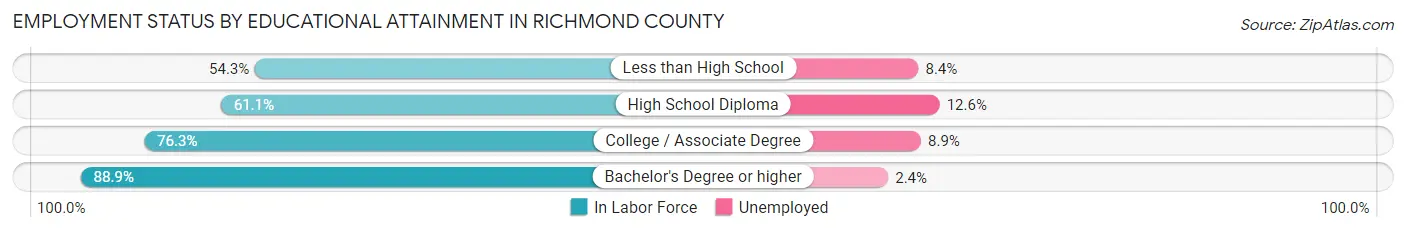
| Educational Attainment | In Labor Force | Unemployed |
| Less than High School | 1,777 (54.3%) | 275 (8.4%) |
| High School Diploma | 4,226 (61.1%) | 872 (12.6%) |
| College / Associate Degree | 5,950 (76.3%) | 694 (8.9%) |
| Bachelor's Degree or higher | 3,219 (88.9%) | 87 (2.4%) |
| Total | 15,169 (70.2%) | 1,815 (8.4%) |
Employment Occupations by Sex in Richmond County
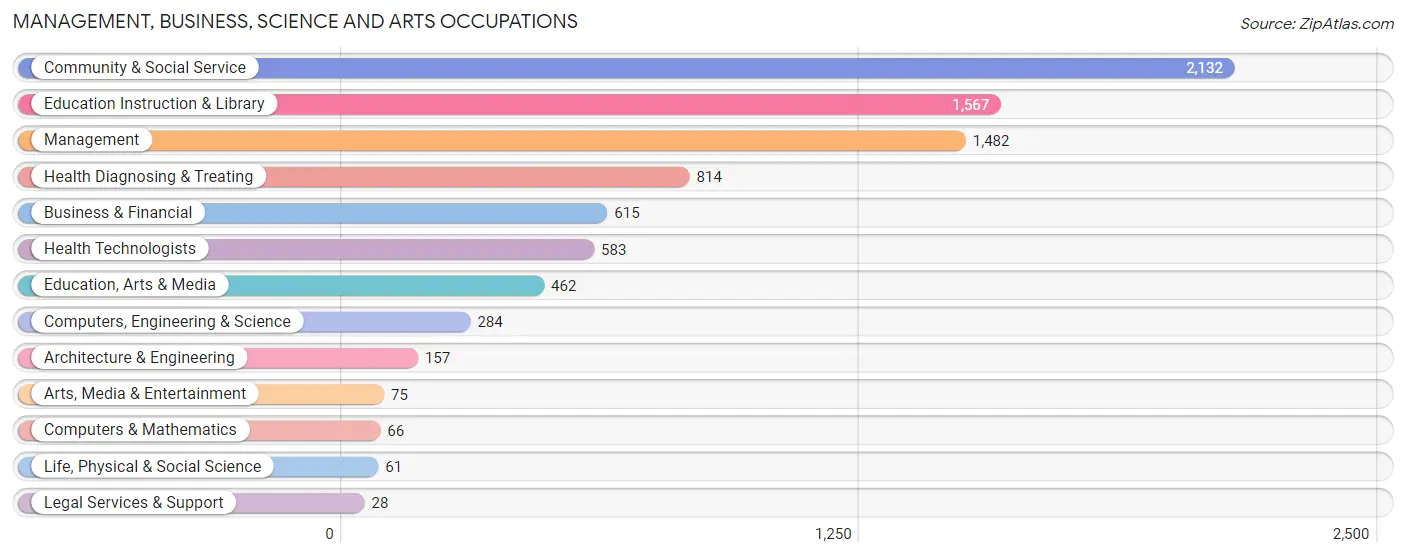
Management, Business, Science and Arts Occupations
The most common Management, Business, Science and Arts occupations in Richmond County are Community & Social Service (2,132 | 11.9%), Education Instruction & Library (1,567 | 8.8%), Management (1,482 | 8.3%), Health Diagnosing & Treating (814 | 4.6%), and Business & Financial (615 | 3.4%).
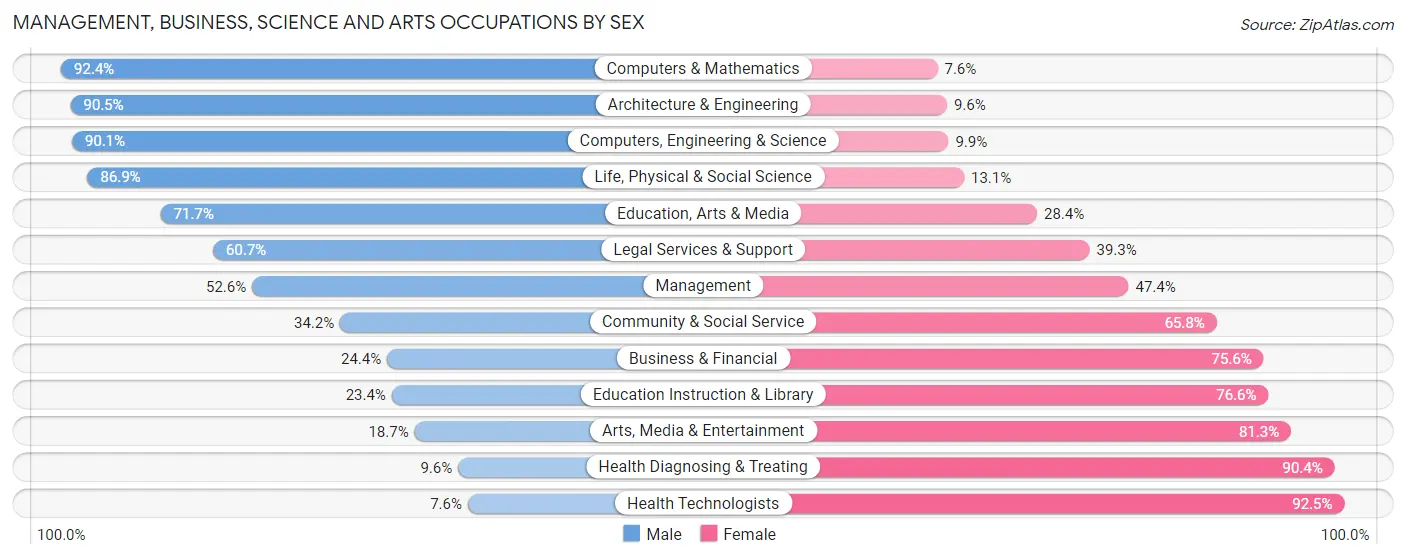
Management, Business, Science and Arts Occupations by Sex
Within the Management, Business, Science and Arts occupations in Richmond County, the most male-oriented occupations are Computers & Mathematics (92.4%), Architecture & Engineering (90.4%), and Computers, Engineering & Science (90.1%), while the most female-oriented occupations are Health Technologists (92.4%), Health Diagnosing & Treating (90.4%), and Arts, Media & Entertainment (81.3%).
| Occupation | Male | Female |
| Management | 779 (52.6%) | 703 (47.4%) |
| Business & Financial | 150 (24.4%) | 465 (75.6%) |
| Computers, Engineering & Science | 256 (90.1%) | 28 (9.9%) |
| Computers & Mathematics | 61 (92.4%) | 5 (7.6%) |
| Architecture & Engineering | 142 (90.4%) | 15 (9.6%) |
| Life, Physical & Social Science | 53 (86.9%) | 8 (13.1%) |
| Community & Social Service | 729 (34.2%) | 1,403 (65.8%) |
| Education, Arts & Media | 331 (71.7%) | 131 (28.3%) |
| Legal Services & Support | 17 (60.7%) | 11 (39.3%) |
| Education Instruction & Library | 367 (23.4%) | 1,200 (76.6%) |
| Arts, Media & Entertainment | 14 (18.7%) | 61 (81.3%) |
| Health Diagnosing & Treating | 78 (9.6%) | 736 (90.4%) |
| Health Technologists | 44 (7.5%) | 539 (92.4%) |
| Total (Category) | 1,992 (37.4%) | 3,335 (62.6%) |
| Total (Overall) | 9,160 (51.3%) | 8,702 (48.7%) |
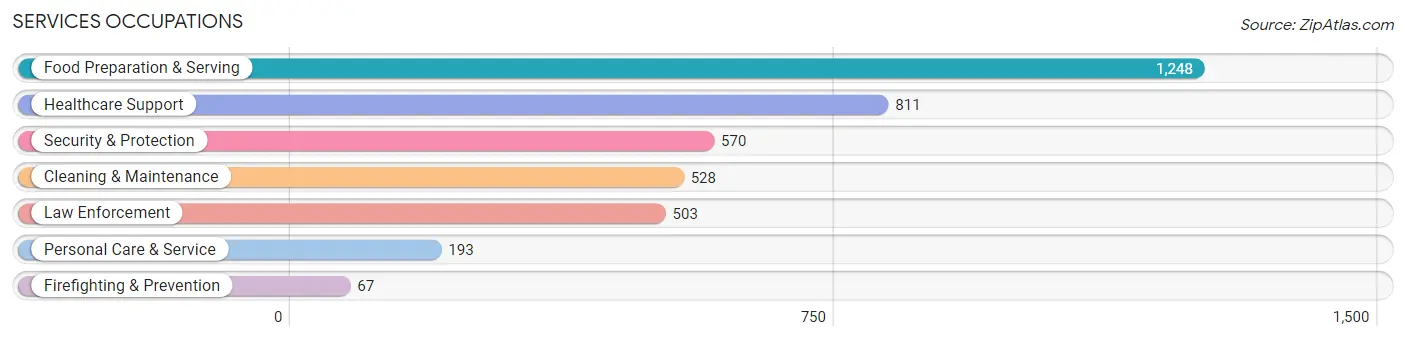
Services Occupations
The most common Services occupations in Richmond County are Food Preparation & Serving (1,248 | 7.0%), Healthcare Support (811 | 4.5%), Security & Protection (570 | 3.2%), Cleaning & Maintenance (528 | 3.0%), and Law Enforcement (503 | 2.8%).
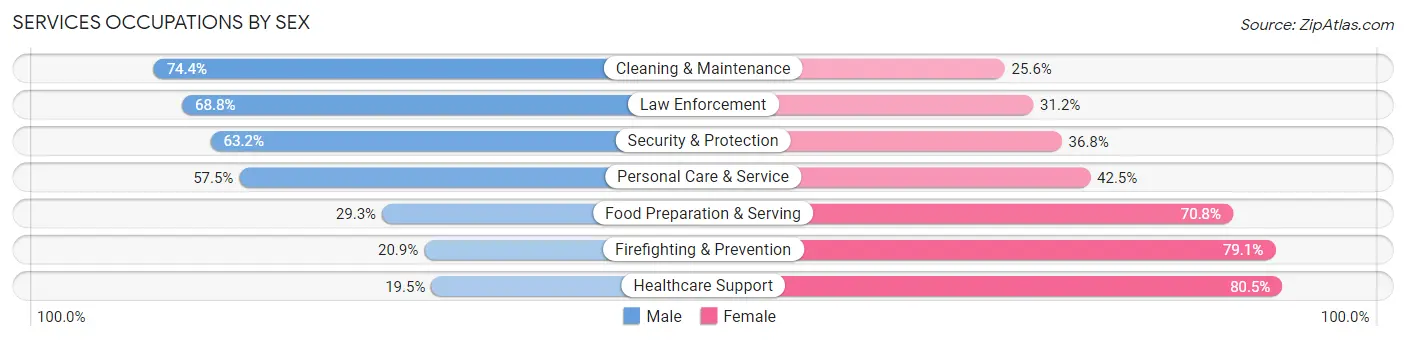
Services Occupations by Sex
Within the Services occupations in Richmond County, the most male-oriented occupations are Cleaning & Maintenance (74.4%), Law Enforcement (68.8%), and Security & Protection (63.2%), while the most female-oriented occupations are Healthcare Support (80.5%), Firefighting & Prevention (79.1%), and Food Preparation & Serving (70.8%).
| Occupation | Male | Female |
| Healthcare Support | 158 (19.5%) | 653 (80.5%) |
| Security & Protection | 360 (63.2%) | 210 (36.8%) |
| Firefighting & Prevention | 14 (20.9%) | 53 (79.1%) |
| Law Enforcement | 346 (68.8%) | 157 (31.2%) |
| Food Preparation & Serving | 365 (29.2%) | 883 (70.8%) |
| Cleaning & Maintenance | 393 (74.4%) | 135 (25.6%) |
| Personal Care & Service | 111 (57.5%) | 82 (42.5%) |
| Total (Category) | 1,387 (41.4%) | 1,963 (58.6%) |
| Total (Overall) | 9,160 (51.3%) | 8,702 (48.7%) |
Sales and Office Occupations
The most common Sales and Office occupations in Richmond County are Sales & Related (1,736 | 9.7%), and Office & Administration (1,374 | 7.7%).
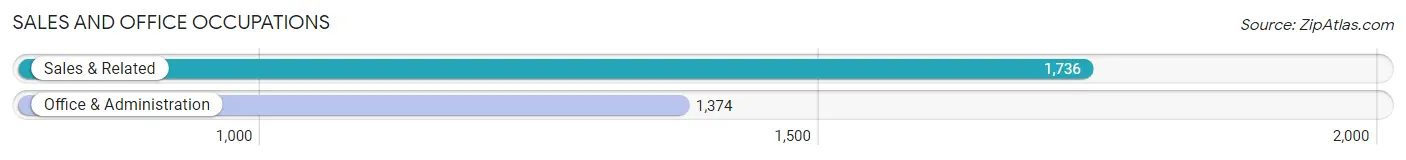
Sales and Office Occupations by Sex
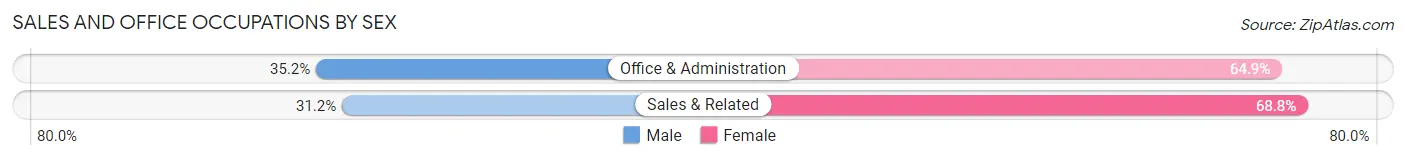
| Occupation | Male | Female |
| Sales & Related | 541 (31.2%) | 1,195 (68.8%) |
| Office & Administration | 483 (35.1%) | 891 (64.8%) |
| Total (Category) | 1,024 (32.9%) | 2,086 (67.1%) |
| Total (Overall) | 9,160 (51.3%) | 8,702 (48.7%) |
Natural Resources, Construction and Maintenance Occupations
The most common Natural Resources, Construction and Maintenance occupations in Richmond County are Installation, Maintenance & Repair (1,103 | 6.2%), Construction & Extraction (955 | 5.3%), and Farming, Fishing & Forestry (299 | 1.7%).
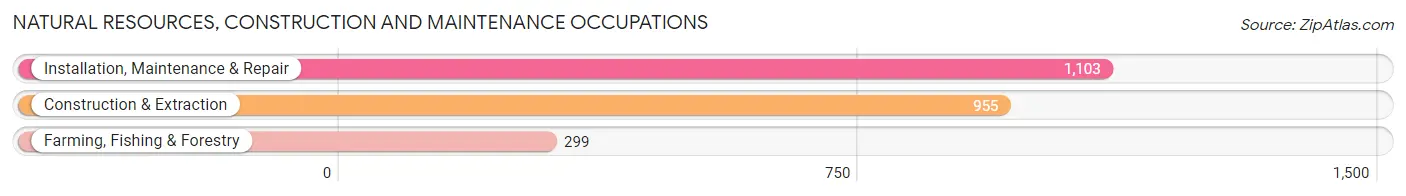
Natural Resources, Construction and Maintenance Occupations by Sex
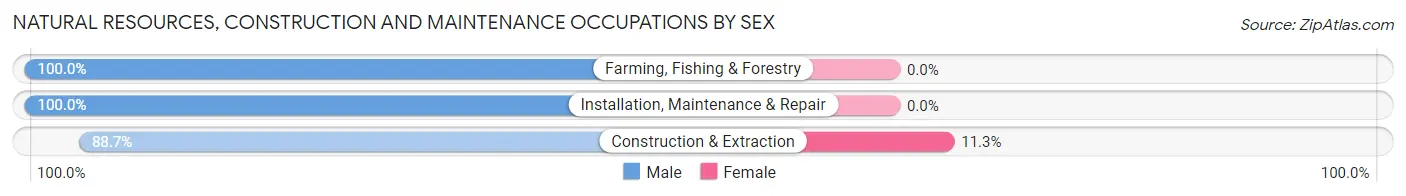
| Occupation | Male | Female |
| Farming, Fishing & Forestry | 299 (100.0%) | 0 (0.0%) |
| Construction & Extraction | 847 (88.7%) | 108 (11.3%) |
| Installation, Maintenance & Repair | 1,103 (100.0%) | 0 (0.0%) |
| Total (Category) | 2,249 (95.4%) | 108 (4.6%) |
| Total (Overall) | 9,160 (51.3%) | 8,702 (48.7%) |
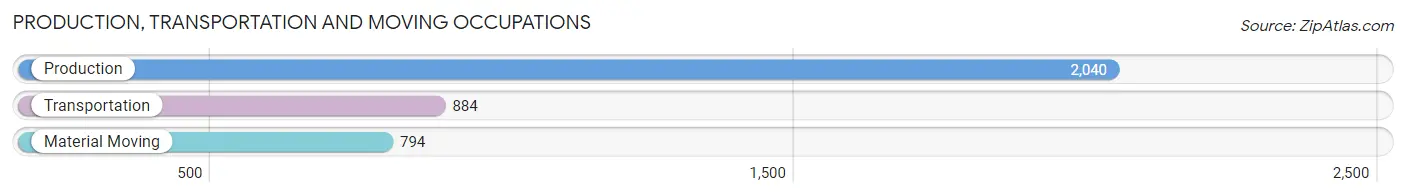
Production, Transportation and Moving Occupations
The most common Production, Transportation and Moving occupations in Richmond County are Production (2,040 | 11.4%), Transportation (884 | 5.0%), and Material Moving (794 | 4.4%).
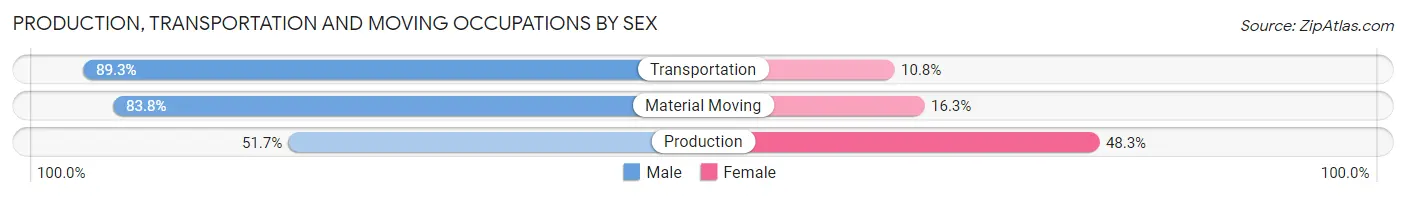
Production, Transportation and Moving Occupations by Sex
| Occupation | Male | Female |
| Production | 1,054 (51.7%) | 986 (48.3%) |
| Transportation | 789 (89.2%) | 95 (10.7%) |
| Material Moving | 665 (83.8%) | 129 (16.3%) |
| Total (Category) | 2,508 (67.5%) | 1,210 (32.5%) |
| Total (Overall) | 9,160 (51.3%) | 8,702 (48.7%) |
Employment Industries by Sex in Richmond County
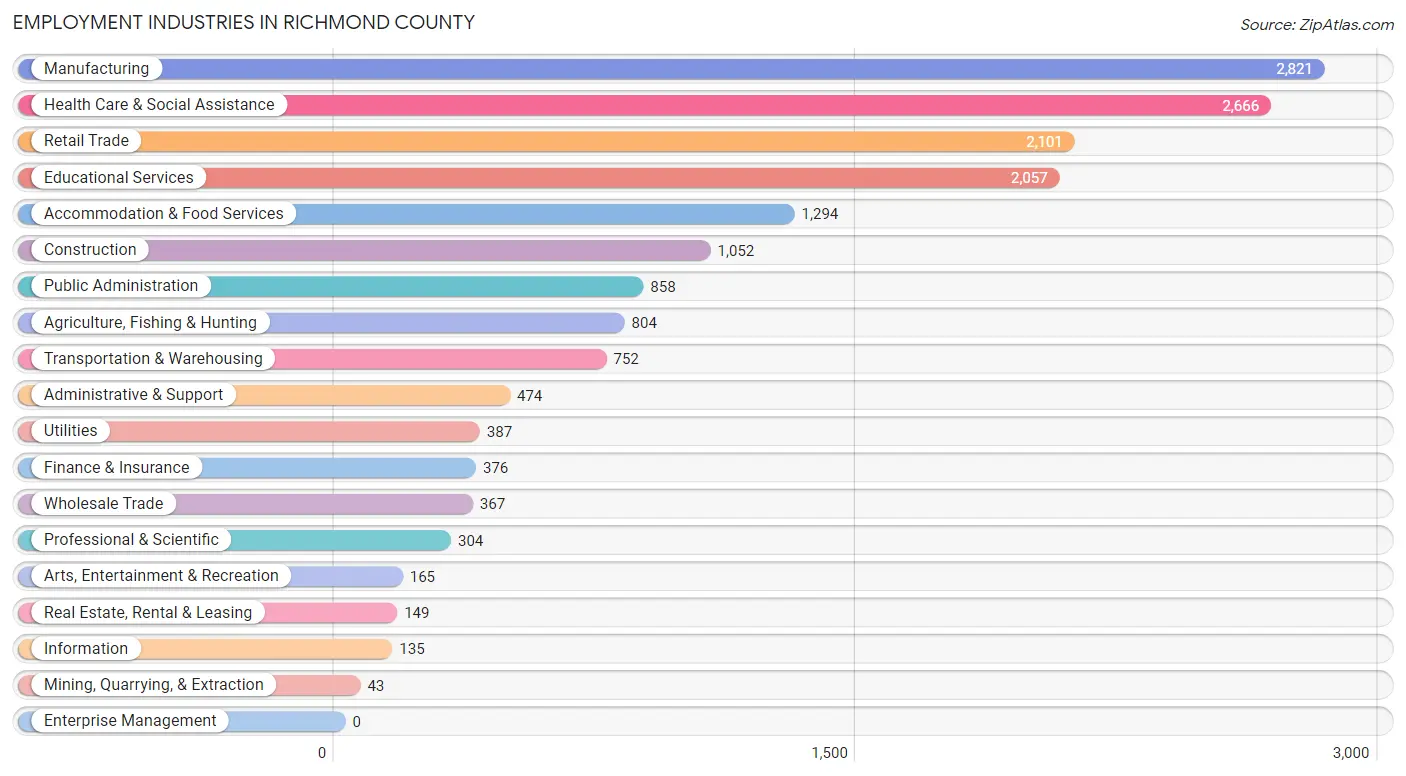
Employment Industries in Richmond County
The major employment industries in Richmond County include Manufacturing (2,821 | 15.8%), Health Care & Social Assistance (2,666 | 14.9%), Retail Trade (2,101 | 11.8%), Educational Services (2,057 | 11.5%), and Accommodation & Food Services (1,294 | 7.2%).
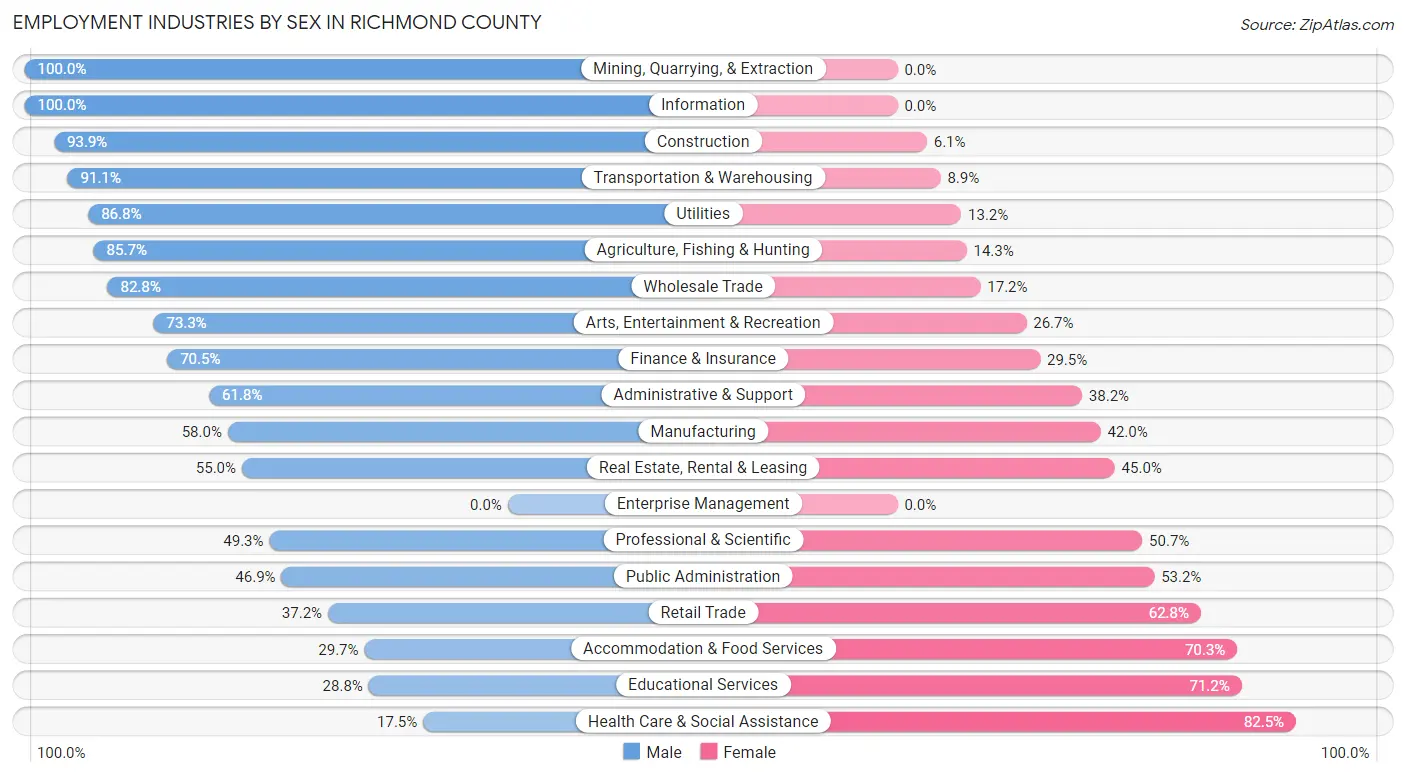
Employment Industries by Sex in Richmond County
The Richmond County industries that see more men than women are Mining, Quarrying, & Extraction (100.0%), Information (100.0%), and Construction (93.9%), whereas the industries that tend to have a higher number of women are Health Care & Social Assistance (82.5%), Educational Services (71.2%), and Accommodation & Food Services (70.3%).
| Industry | Male | Female |
| Agriculture, Fishing & Hunting | 689 (85.7%) | 115 (14.3%) |
| Mining, Quarrying, & Extraction | 43 (100.0%) | 0 (0.0%) |
| Construction | 988 (93.9%) | 64 (6.1%) |
| Manufacturing | 1,635 (58.0%) | 1,186 (42.0%) |
| Wholesale Trade | 304 (82.8%) | 63 (17.2%) |
| Retail Trade | 782 (37.2%) | 1,319 (62.8%) |
| Transportation & Warehousing | 685 (91.1%) | 67 (8.9%) |
| Utilities | 336 (86.8%) | 51 (13.2%) |
| Information | 135 (100.0%) | 0 (0.0%) |
| Finance & Insurance | 265 (70.5%) | 111 (29.5%) |
| Real Estate, Rental & Leasing | 82 (55.0%) | 67 (45.0%) |
| Professional & Scientific | 150 (49.3%) | 154 (50.7%) |
| Enterprise Management | 0 (0.0%) | 0 (0.0%) |
| Administrative & Support | 293 (61.8%) | 181 (38.2%) |
| Educational Services | 592 (28.8%) | 1,465 (71.2%) |
| Health Care & Social Assistance | 467 (17.5%) | 2,199 (82.5%) |
| Arts, Entertainment & Recreation | 121 (73.3%) | 44 (26.7%) |
| Accommodation & Food Services | 384 (29.7%) | 910 (70.3%) |
| Public Administration | 402 (46.9%) | 456 (53.1%) |
| Total | 9,160 (51.3%) | 8,702 (48.7%) |
Education in Richmond County
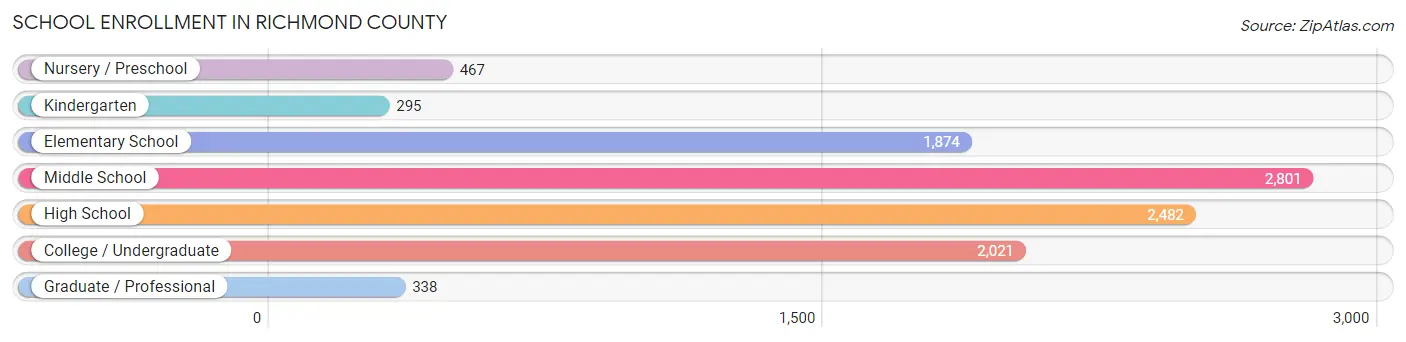
School Enrollment in Richmond County
The most common levels of schooling among the 10,278 students in Richmond County are middle school (2,801 | 27.3%), high school (2,482 | 24.1%), and college / undergraduate (2,021 | 19.7%).
| School Level | # Students | % Students |
| Nursery / Preschool | 467 | 4.5% |
| Kindergarten | 295 | 2.9% |
| Elementary School | 1,874 | 18.2% |
| Middle School | 2,801 | 27.3% |
| High School | 2,482 | 24.1% |
| College / Undergraduate | 2,021 | 19.7% |
| Graduate / Professional | 338 | 3.3% |
| Total | 10,278 | 100.0% |
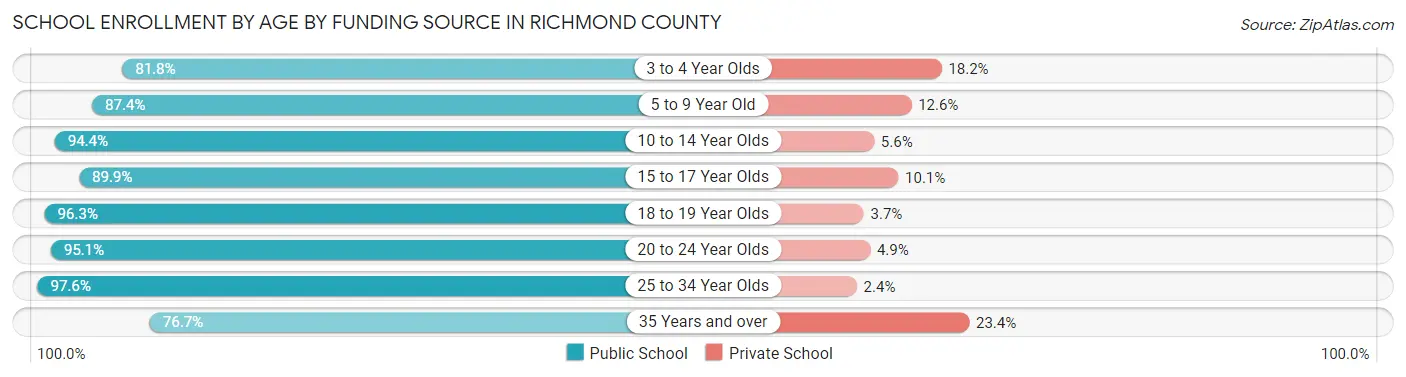
School Enrollment by Age by Funding Source in Richmond County
Out of a total of 10,278 students who are enrolled in schools in Richmond County, 915 (8.9%) attend a private institution, while the remaining 9,363 (91.1%) are enrolled in public schools. The age group of 35 years and over has the highest likelihood of being enrolled in private schools, with 156 (23.4% in the age bracket) enrolled. Conversely, the age group of 25 to 34 year olds has the lowest likelihood of being enrolled in a private school, with 726 (97.6% in the age bracket) attending a public institution.
| Age Bracket | Public School | Private School |
| 3 to 4 Year Olds | 310 (81.8%) | 69 (18.2%) |
| 5 to 9 Year Old | 1,563 (87.4%) | 225 (12.6%) |
| 10 to 14 Year Olds | 3,300 (94.4%) | 197 (5.6%) |
| 15 to 17 Year Olds | 1,674 (89.9%) | 189 (10.1%) |
| 18 to 19 Year Olds | 363 (96.3%) | 14 (3.7%) |
| 20 to 24 Year Olds | 915 (95.1%) | 47 (4.9%) |
| 25 to 34 Year Olds | 726 (97.6%) | 18 (2.4%) |
| 35 Years and over | 512 (76.6%) | 156 (23.4%) |
| Total | 9,363 (91.1%) | 915 (8.9%) |
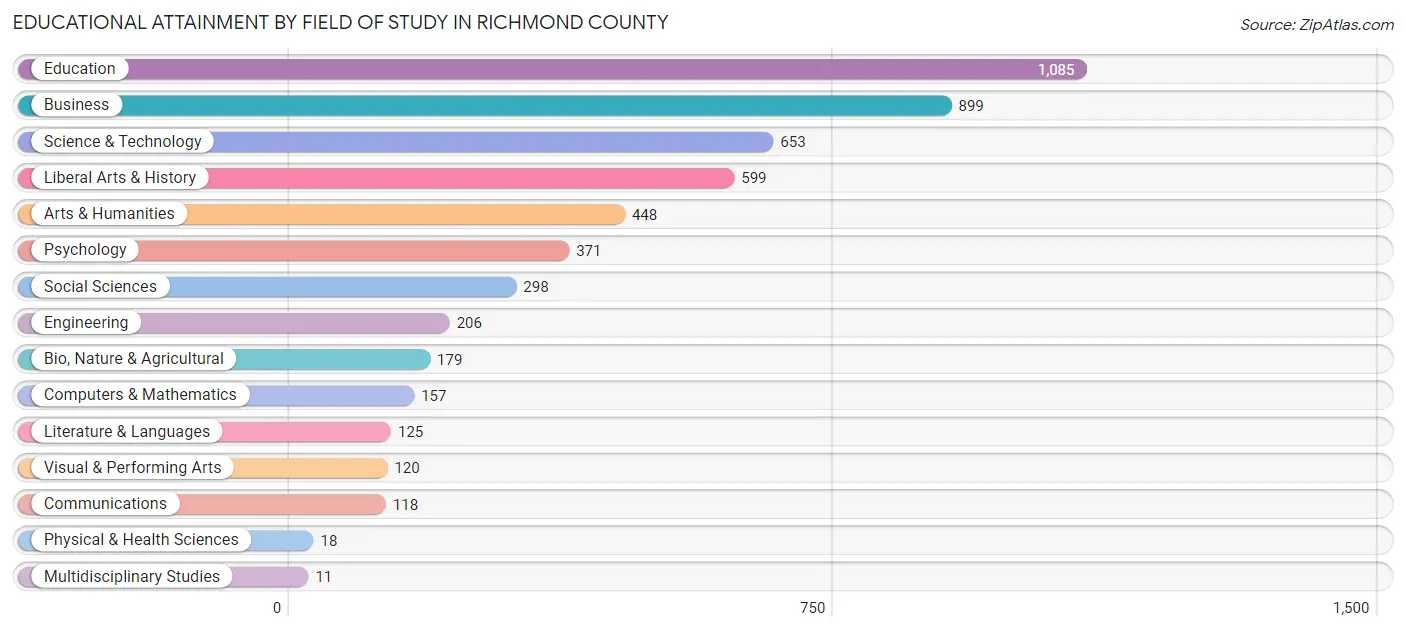
Educational Attainment by Field of Study in Richmond County
Education (1,085 | 20.5%), business (899 | 17.0%), science & technology (653 | 12.3%), liberal arts & history (599 | 11.3%), and arts & humanities (448 | 8.5%) are the most common fields of study among 5,287 individuals in Richmond County who have obtained a bachelor's degree or higher.
| Field of Study | # Graduates | % Graduates |
| Computers & Mathematics | 157 | 3.0% |
| Bio, Nature & Agricultural | 179 | 3.4% |
| Physical & Health Sciences | 18 | 0.3% |
| Psychology | 371 | 7.0% |
| Social Sciences | 298 | 5.6% |
| Engineering | 206 | 3.9% |
| Multidisciplinary Studies | 11 | 0.2% |
| Science & Technology | 653 | 12.3% |
| Business | 899 | 17.0% |
| Education | 1,085 | 20.5% |
| Literature & Languages | 125 | 2.4% |
| Liberal Arts & History | 599 | 11.3% |
| Visual & Performing Arts | 120 | 2.3% |
| Communications | 118 | 2.2% |
| Arts & Humanities | 448 | 8.5% |
| Total | 5,287 | 100.0% |
Transportation & Commute in Richmond County
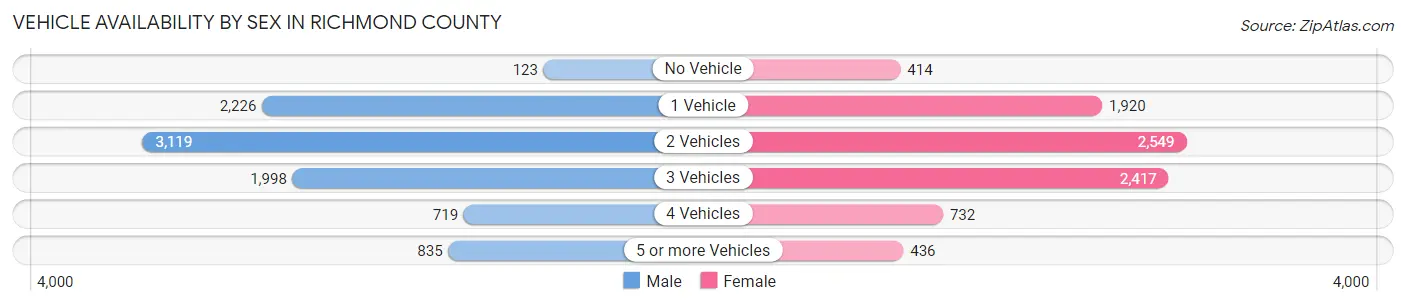
Vehicle Availability by Sex in Richmond County
The most prevalent vehicle ownership categories in Richmond County are males with 2 vehicles (3,119, accounting for 34.6%) and females with 2 vehicles (2,549, making up 36.8%).
| Vehicles Available | Male | Female |
| No Vehicle | 123 (1.4%) | 414 (4.9%) |
| 1 Vehicle | 2,226 (24.7%) | 1,920 (22.7%) |
| 2 Vehicles | 3,119 (34.6%) | 2,549 (30.1%) |
| 3 Vehicles | 1,998 (22.2%) | 2,417 (28.5%) |
| 4 Vehicles | 719 (8.0%) | 732 (8.6%) |
| 5 or more Vehicles | 835 (9.3%) | 436 (5.1%) |
| Total | 9,020 (100.0%) | 8,468 (100.0%) |
Commute Time in Richmond County
The most frequently occuring commute durations in Richmond County are 15 to 19 minutes (3,565 commuters, 20.7%), 30 to 34 minutes (2,577 commuters, 14.9%), and 10 to 14 minutes (2,557 commuters, 14.8%).
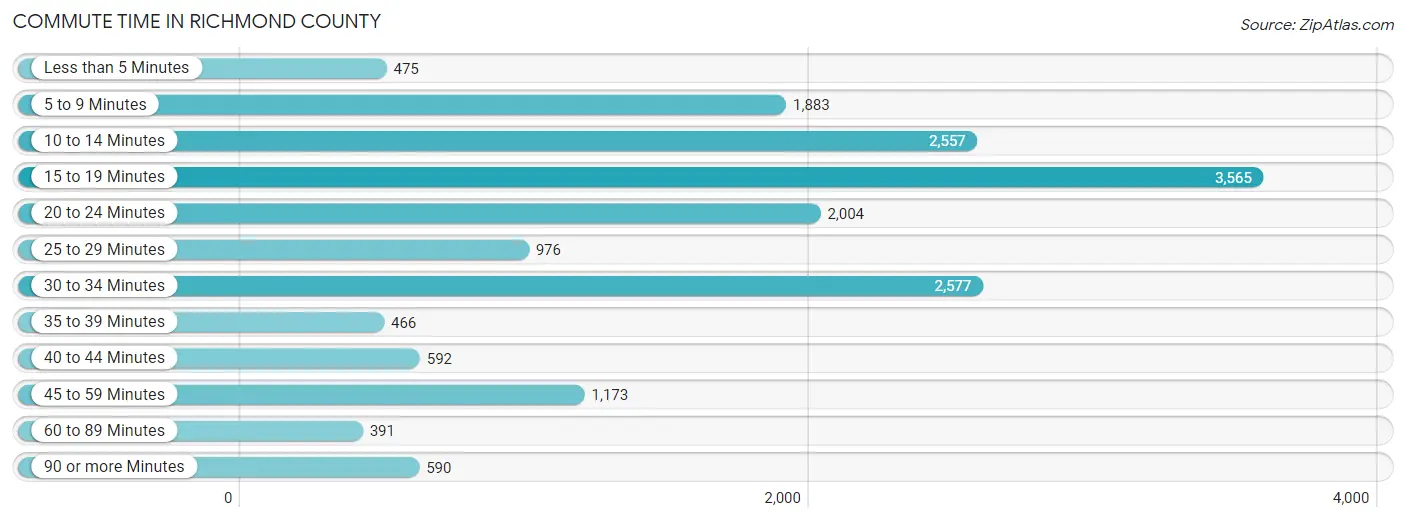
| Commute Time | # Commuters | % Commuters |
| Less than 5 Minutes | 475 | 2.8% |
| 5 to 9 Minutes | 1,883 | 10.9% |
| 10 to 14 Minutes | 2,557 | 14.8% |
| 15 to 19 Minutes | 3,565 | 20.7% |
| 20 to 24 Minutes | 2,004 | 11.6% |
| 25 to 29 Minutes | 976 | 5.7% |
| 30 to 34 Minutes | 2,577 | 14.9% |
| 35 to 39 Minutes | 466 | 2.7% |
| 40 to 44 Minutes | 592 | 3.4% |
| 45 to 59 Minutes | 1,173 | 6.8% |
| 60 to 89 Minutes | 391 | 2.3% |
| 90 or more Minutes | 590 | 3.4% |
Commute Time by Sex in Richmond County
The most common commute times in Richmond County are 15 to 19 minutes (1,899 commuters, 21.2%) for males and 15 to 19 minutes (1,666 commuters, 20.1%) for females.
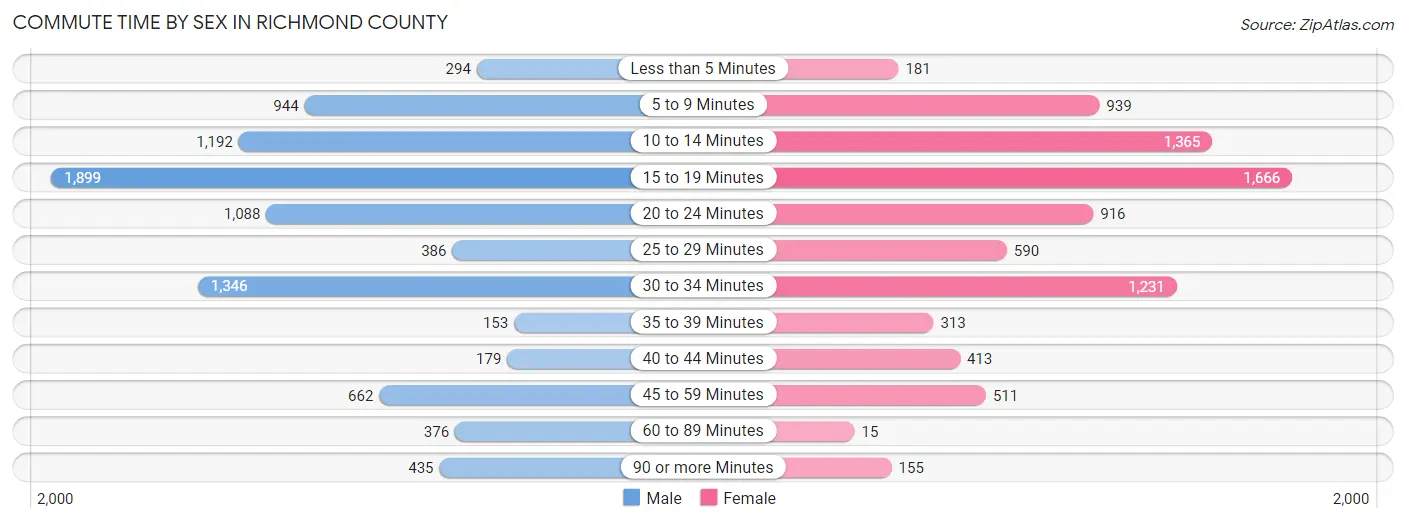
| Commute Time | Male | Female |
| Less than 5 Minutes | 294 (3.3%) | 181 (2.2%) |
| 5 to 9 Minutes | 944 (10.5%) | 939 (11.3%) |
| 10 to 14 Minutes | 1,192 (13.3%) | 1,365 (16.5%) |
| 15 to 19 Minutes | 1,899 (21.2%) | 1,666 (20.1%) |
| 20 to 24 Minutes | 1,088 (12.1%) | 916 (11.0%) |
| 25 to 29 Minutes | 386 (4.3%) | 590 (7.1%) |
| 30 to 34 Minutes | 1,346 (15.0%) | 1,231 (14.8%) |
| 35 to 39 Minutes | 153 (1.7%) | 313 (3.8%) |
| 40 to 44 Minutes | 179 (2.0%) | 413 (5.0%) |
| 45 to 59 Minutes | 662 (7.4%) | 511 (6.2%) |
| 60 to 89 Minutes | 376 (4.2%) | 15 (0.2%) |
| 90 or more Minutes | 435 (4.9%) | 155 (1.9%) |
Time of Departure to Work by Sex in Richmond County
The most frequent times of departure to work in Richmond County are 7:00 AM to 7:29 AM (1,747, 19.5%) for males and 7:00 AM to 7:29 AM (1,899, 22.9%) for females.
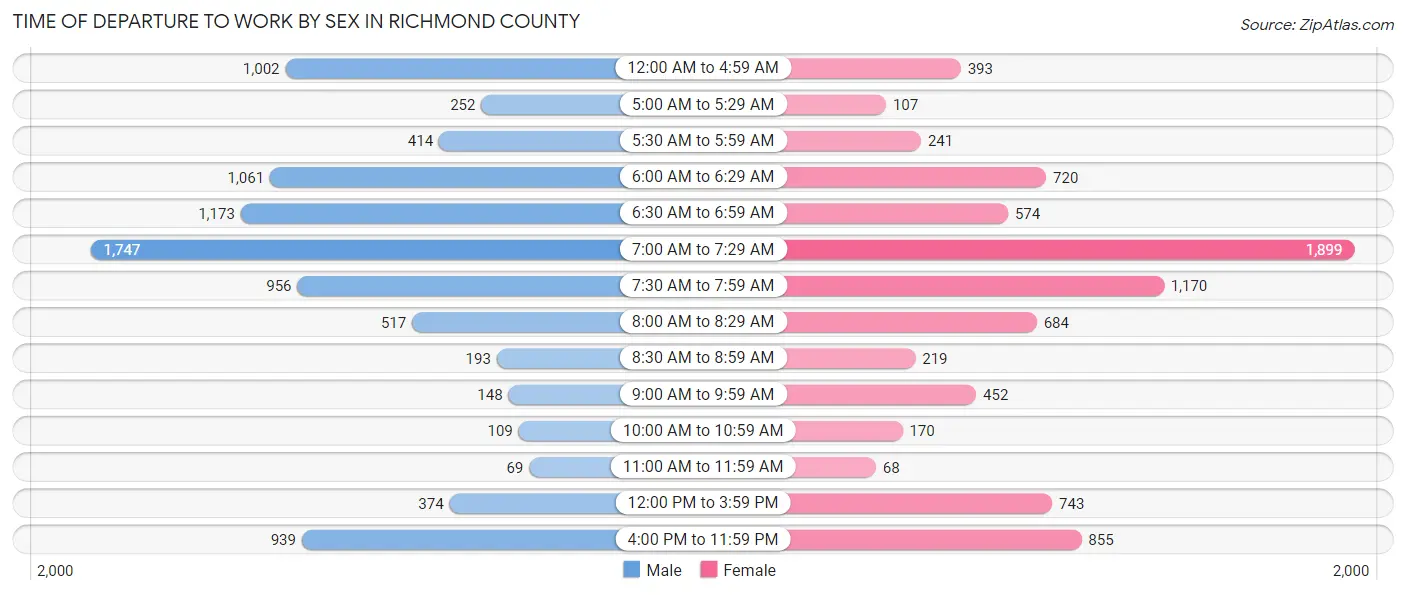
| Time of Departure | Male | Female |
| 12:00 AM to 4:59 AM | 1,002 (11.2%) | 393 (4.7%) |
| 5:00 AM to 5:29 AM | 252 (2.8%) | 107 (1.3%) |
| 5:30 AM to 5:59 AM | 414 (4.6%) | 241 (2.9%) |
| 6:00 AM to 6:29 AM | 1,061 (11.8%) | 720 (8.7%) |
| 6:30 AM to 6:59 AM | 1,173 (13.1%) | 574 (6.9%) |
| 7:00 AM to 7:29 AM | 1,747 (19.5%) | 1,899 (22.9%) |
| 7:30 AM to 7:59 AM | 956 (10.7%) | 1,170 (14.1%) |
| 8:00 AM to 8:29 AM | 517 (5.8%) | 684 (8.3%) |
| 8:30 AM to 8:59 AM | 193 (2.2%) | 219 (2.6%) |
| 9:00 AM to 9:59 AM | 148 (1.7%) | 452 (5.4%) |
| 10:00 AM to 10:59 AM | 109 (1.2%) | 170 (2.1%) |
| 11:00 AM to 11:59 AM | 69 (0.8%) | 68 (0.8%) |
| 12:00 PM to 3:59 PM | 374 (4.2%) | 743 (9.0%) |
| 4:00 PM to 11:59 PM | 939 (10.5%) | 855 (10.3%) |
| Total | 8,954 (100.0%) | 8,295 (100.0%) |
Housing Occupancy in Richmond County
Occupancy by Ownership in Richmond County
Of the total 16,605 dwellings in Richmond County, owner-occupied units account for 10,829 (65.2%), while renter-occupied units make up 5,776 (34.8%).
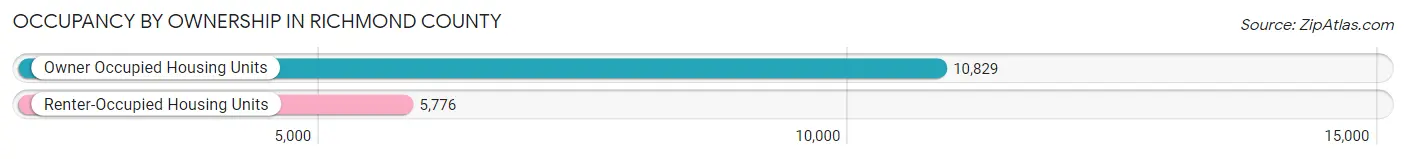
| Occupancy | # Housing Units | % Housing Units |
| Owner Occupied Housing Units | 10,829 | 65.2% |
| Renter-Occupied Housing Units | 5,776 | 34.8% |
| Total Occupied Housing Units | 16,605 | 100.0% |
Occupancy by Household Size in Richmond County
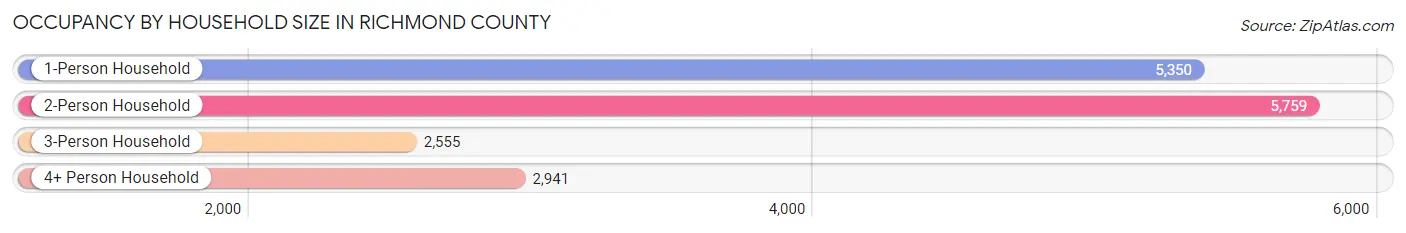
| Household Size | # Housing Units | % Housing Units |
| 1-Person Household | 5,350 | 32.2% |
| 2-Person Household | 5,759 | 34.7% |
| 3-Person Household | 2,555 | 15.4% |
| 4+ Person Household | 2,941 | 17.7% |
| Total Housing Units | 16,605 | 100.0% |
Occupancy by Ownership by Household Size in Richmond County
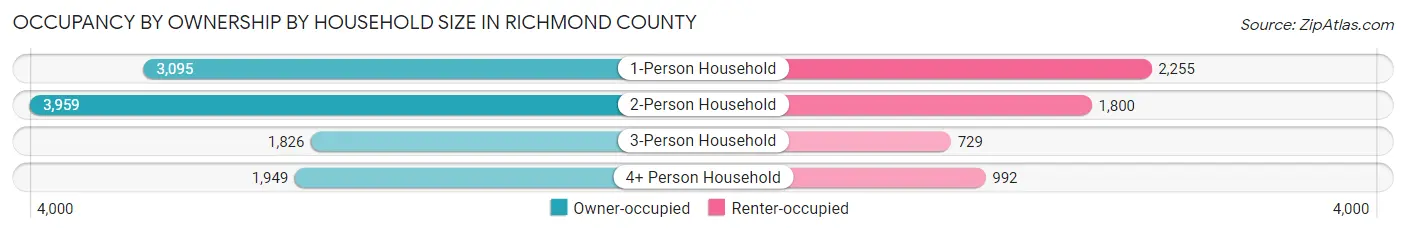
| Household Size | Owner-occupied | Renter-occupied |
| 1-Person Household | 3,095 (57.9%) | 2,255 (42.1%) |
| 2-Person Household | 3,959 (68.7%) | 1,800 (31.3%) |
| 3-Person Household | 1,826 (71.5%) | 729 (28.5%) |
| 4+ Person Household | 1,949 (66.3%) | 992 (33.7%) |
| Total Housing Units | 10,829 (65.2%) | 5,776 (34.8%) |
Occupancy by Educational Attainment in Richmond County
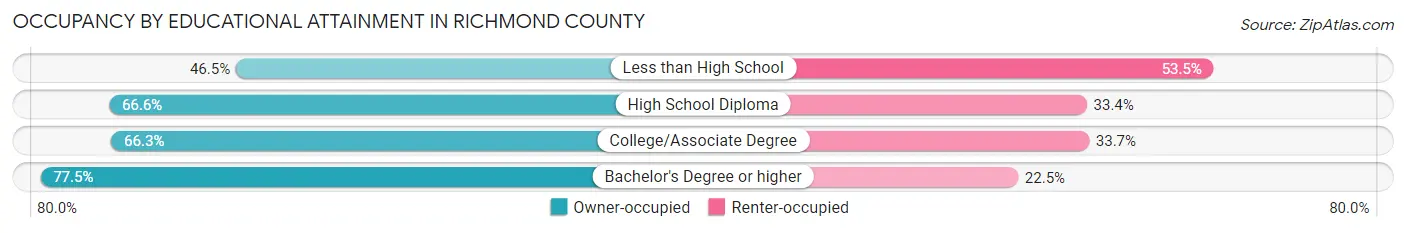
| Household Size | Owner-occupied | Renter-occupied |
| Less than High School | 1,239 (46.5%) | 1,427 (53.5%) |
| High School Diploma | 3,167 (66.6%) | 1,587 (33.4%) |
| College/Associate Degree | 4,109 (66.3%) | 2,091 (33.7%) |
| Bachelor's Degree or higher | 2,314 (77.5%) | 671 (22.5%) |
Occupancy by Age of Householder in Richmond County
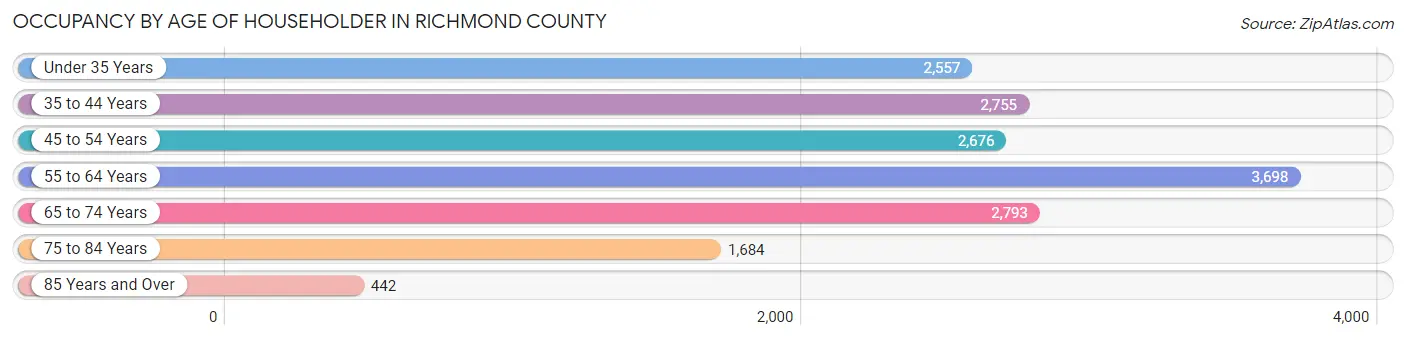
| Age Bracket | # Households | % Households |
| Under 35 Years | 2,557 | 15.4% |
| 35 to 44 Years | 2,755 | 16.6% |
| 45 to 54 Years | 2,676 | 16.1% |
| 55 to 64 Years | 3,698 | 22.3% |
| 65 to 74 Years | 2,793 | 16.8% |
| 75 to 84 Years | 1,684 | 10.1% |
| 85 Years and Over | 442 | 2.7% |
| Total | 16,605 | 100.0% |
Housing Finances in Richmond County
Median Income by Occupancy in Richmond County
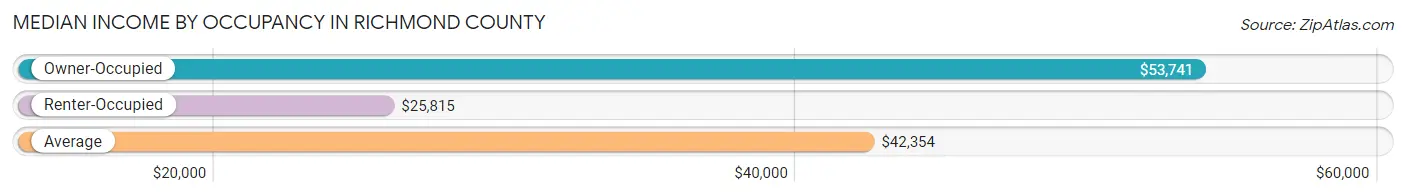
| Occupancy Type | # Households | Median Income |
| Owner-Occupied | 10,829 (65.2%) | $53,741 |
| Renter-Occupied | 5,776 (34.8%) | $25,815 |
| Average | 16,605 (100.0%) | $42,354 |
Occupancy by Householder Income Bracket in Richmond County
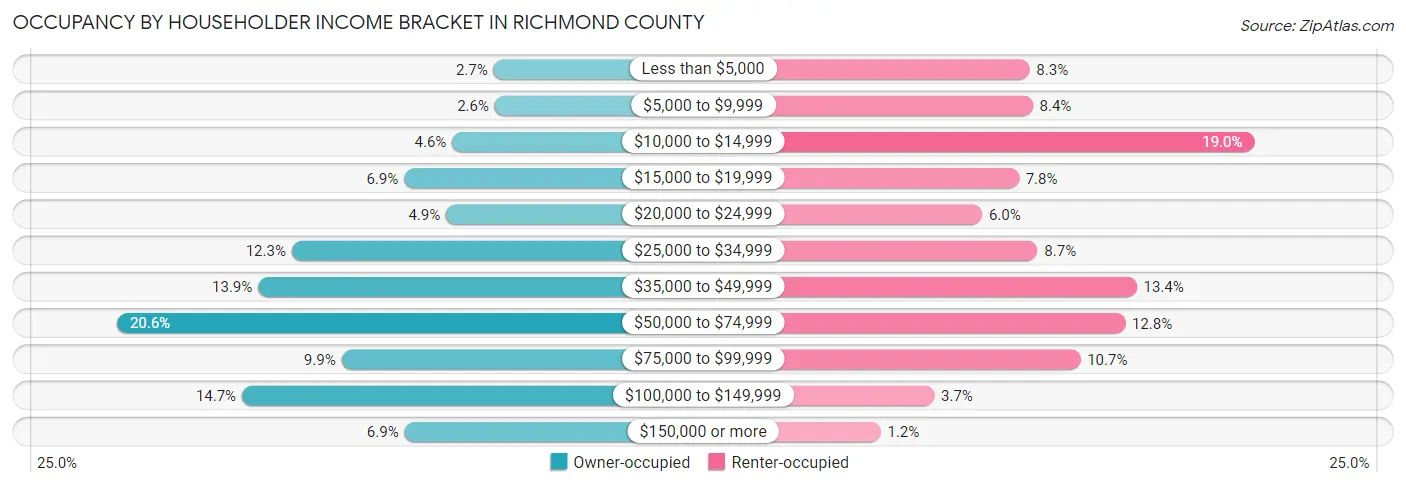
| Income Bracket | Owner-occupied | Renter-occupied |
| Less than $5,000 | 289 (2.7%) | 478 (8.3%) |
| $5,000 to $9,999 | 283 (2.6%) | 487 (8.4%) |
| $10,000 to $14,999 | 502 (4.6%) | 1,097 (19.0%) |
| $15,000 to $19,999 | 750 (6.9%) | 449 (7.8%) |
| $20,000 to $24,999 | 534 (4.9%) | 348 (6.0%) |
| $25,000 to $34,999 | 1,330 (12.3%) | 500 (8.7%) |
| $35,000 to $49,999 | 1,503 (13.9%) | 773 (13.4%) |
| $50,000 to $74,999 | 2,231 (20.6%) | 741 (12.8%) |
| $75,000 to $99,999 | 1,073 (9.9%) | 618 (10.7%) |
| $100,000 to $149,999 | 1,586 (14.6%) | 216 (3.7%) |
| $150,000 or more | 748 (6.9%) | 69 (1.2%) |
| Total | 10,829 (100.0%) | 5,776 (100.0%) |
Monthly Housing Cost Tiers in Richmond County
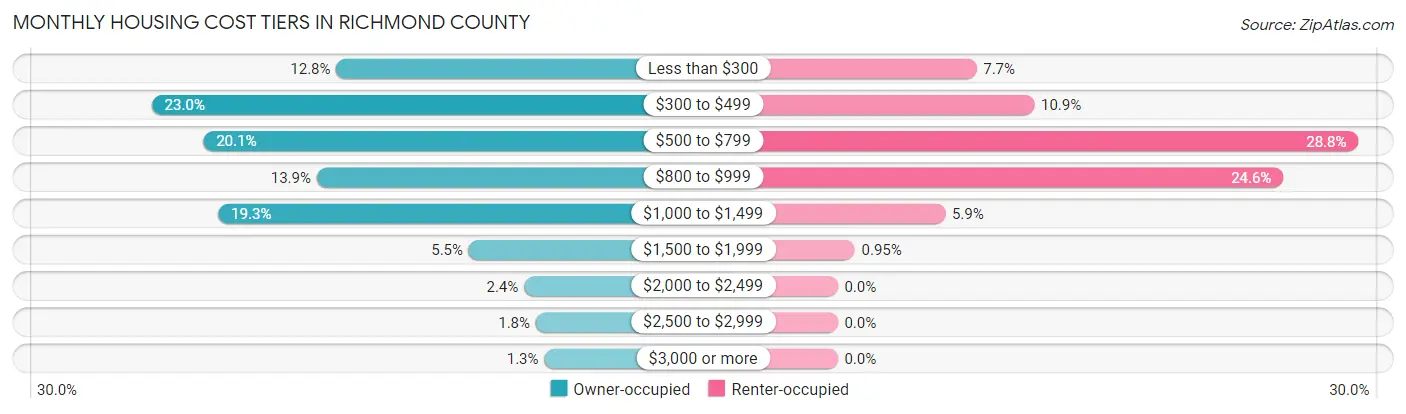
| Monthly Cost | Owner-occupied | Renter-occupied |
| Less than $300 | 1,384 (12.8%) | 443 (7.7%) |
| $300 to $499 | 2,490 (23.0%) | 627 (10.9%) |
| $500 to $799 | 2,180 (20.1%) | 1,662 (28.8%) |
| $800 to $999 | 1,501 (13.9%) | 1,422 (24.6%) |
| $1,000 to $1,499 | 2,091 (19.3%) | 343 (5.9%) |
| $1,500 to $1,999 | 591 (5.5%) | 55 (0.9%) |
| $2,000 to $2,499 | 261 (2.4%) | 0 (0.0%) |
| $2,500 to $2,999 | 191 (1.8%) | 0 (0.0%) |
| $3,000 or more | 140 (1.3%) | 0 (0.0%) |
| Total | 10,829 (100.0%) | 5,776 (100.0%) |
Physical Housing Characteristics in Richmond County
Housing Structures in Richmond County
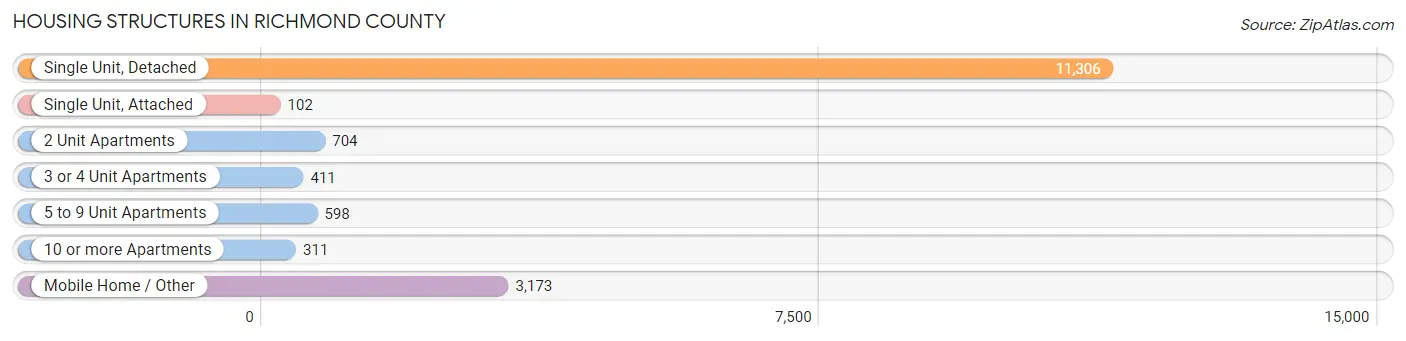
| Structure Type | # Housing Units | % Housing Units |
| Single Unit, Detached | 11,306 | 68.1% |
| Single Unit, Attached | 102 | 0.6% |
| 2 Unit Apartments | 704 | 4.2% |
| 3 or 4 Unit Apartments | 411 | 2.5% |
| 5 to 9 Unit Apartments | 598 | 3.6% |
| 10 or more Apartments | 311 | 1.9% |
| Mobile Home / Other | 3,173 | 19.1% |
| Total | 16,605 | 100.0% |
Housing Structures by Occupancy in Richmond County
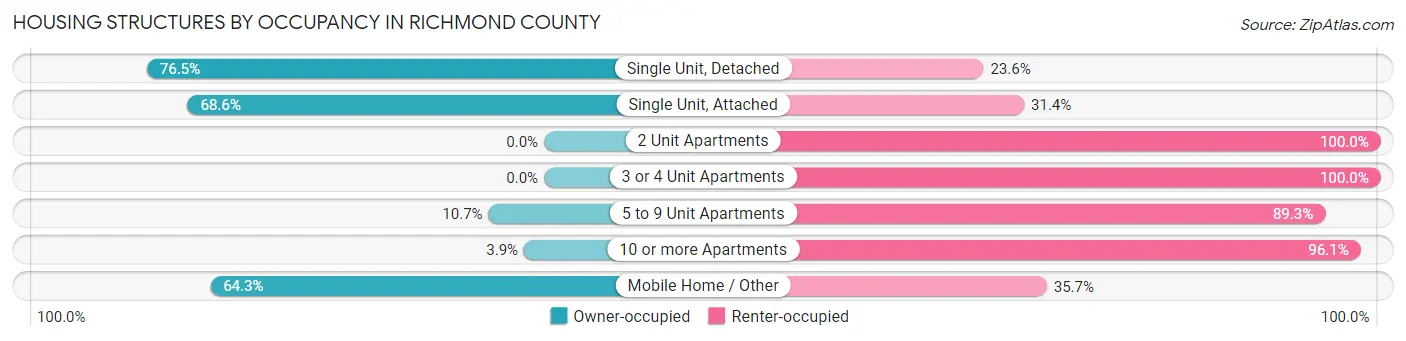
| Structure Type | Owner-occupied | Renter-occupied |
| Single Unit, Detached | 8,644 (76.4%) | 2,662 (23.5%) |
| Single Unit, Attached | 70 (68.6%) | 32 (31.4%) |
| 2 Unit Apartments | 0 (0.0%) | 704 (100.0%) |
| 3 or 4 Unit Apartments | 0 (0.0%) | 411 (100.0%) |
| 5 to 9 Unit Apartments | 64 (10.7%) | 534 (89.3%) |
| 10 or more Apartments | 12 (3.9%) | 299 (96.1%) |
| Mobile Home / Other | 2,039 (64.3%) | 1,134 (35.7%) |
| Total | 10,829 (65.2%) | 5,776 (34.8%) |
Housing Structures by Number of Rooms in Richmond County
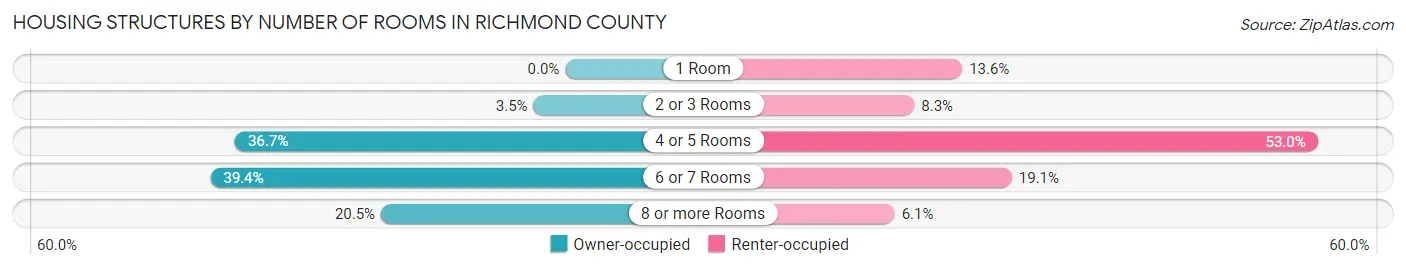
| Number of Rooms | Owner-occupied | Renter-occupied |
| 1 Room | 0 (0.0%) | 784 (13.6%) |
| 2 or 3 Rooms | 382 (3.5%) | 477 (8.3%) |
| 4 or 5 Rooms | 3,969 (36.6%) | 3,062 (53.0%) |
| 6 or 7 Rooms | 4,264 (39.4%) | 1,102 (19.1%) |
| 8 or more Rooms | 2,214 (20.4%) | 351 (6.1%) |
| Total | 10,829 (100.0%) | 5,776 (100.0%) |
Housing Structure by Heating Type in Richmond County
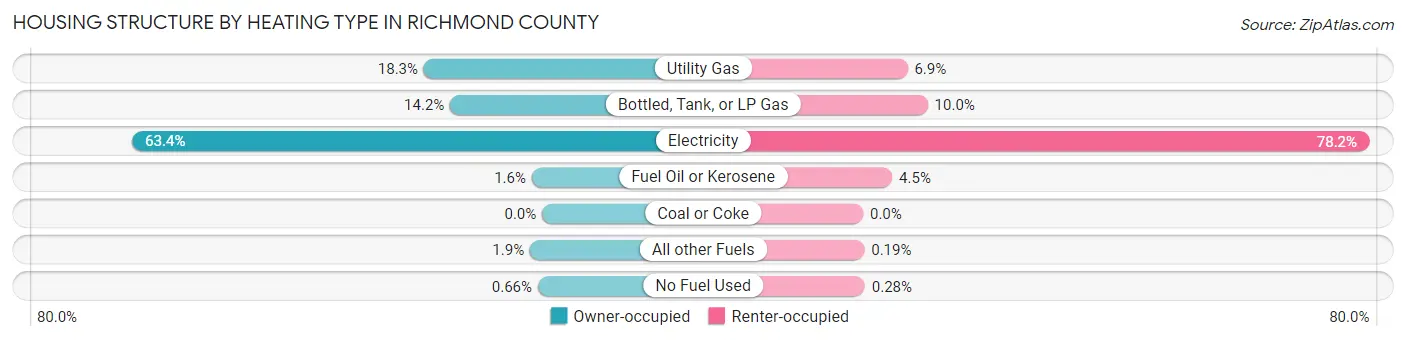
| Heating Type | Owner-occupied | Renter-occupied |
| Utility Gas | 1,980 (18.3%) | 396 (6.9%) |
| Bottled, Tank, or LP Gas | 1,539 (14.2%) | 577 (10.0%) |
| Electricity | 6,863 (63.4%) | 4,516 (78.2%) |
| Fuel Oil or Kerosene | 172 (1.6%) | 260 (4.5%) |
| Coal or Coke | 0 (0.0%) | 0 (0.0%) |
| All other Fuels | 203 (1.9%) | 11 (0.2%) |
| No Fuel Used | 72 (0.7%) | 16 (0.3%) |
| Total | 10,829 (100.0%) | 5,776 (100.0%) |
Household Vehicle Usage in Richmond County
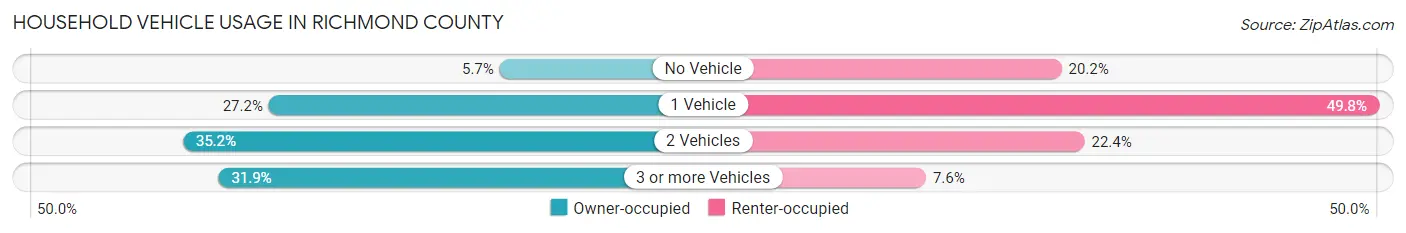
| Vehicles per Household | Owner-occupied | Renter-occupied |
| No Vehicle | 613 (5.7%) | 1,168 (20.2%) |
| 1 Vehicle | 2,947 (27.2%) | 2,879 (49.8%) |
| 2 Vehicles | 3,815 (35.2%) | 1,292 (22.4%) |
| 3 or more Vehicles | 3,454 (31.9%) | 437 (7.6%) |
| Total | 10,829 (100.0%) | 5,776 (100.0%) |
Real Estate & Mortgages in Richmond County
Real Estate and Mortgage Overview in Richmond County
| Characteristic | Without Mortgage | With Mortgage |
| Housing Units | 5,451 | 5,378 |
| Median Property Value | $92,500 | $125,700 |
| Median Household Income | $40,691 | $534 |
| Monthly Housing Costs | $389 | $140 |
| Real Estate Taxes | $842 | $163 |
Property Value by Mortgage Status in Richmond County
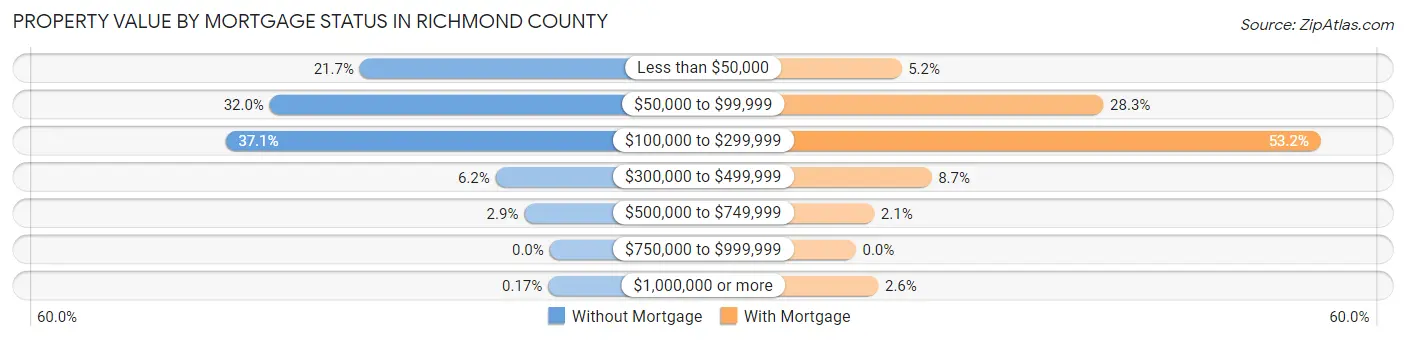
| Property Value | Without Mortgage | With Mortgage |
| Less than $50,000 | 1,183 (21.7%) | 281 (5.2%) |
| $50,000 to $99,999 | 1,744 (32.0%) | 1,522 (28.3%) |
| $100,000 to $299,999 | 2,020 (37.1%) | 2,859 (53.2%) |
| $300,000 to $499,999 | 337 (6.2%) | 465 (8.6%) |
| $500,000 to $749,999 | 158 (2.9%) | 113 (2.1%) |
| $750,000 to $999,999 | 0 (0.0%) | 0 (0.0%) |
| $1,000,000 or more | 9 (0.2%) | 138 (2.6%) |
| Total | 5,451 (100.0%) | 5,378 (100.0%) |
Household Income by Mortgage Status in Richmond County
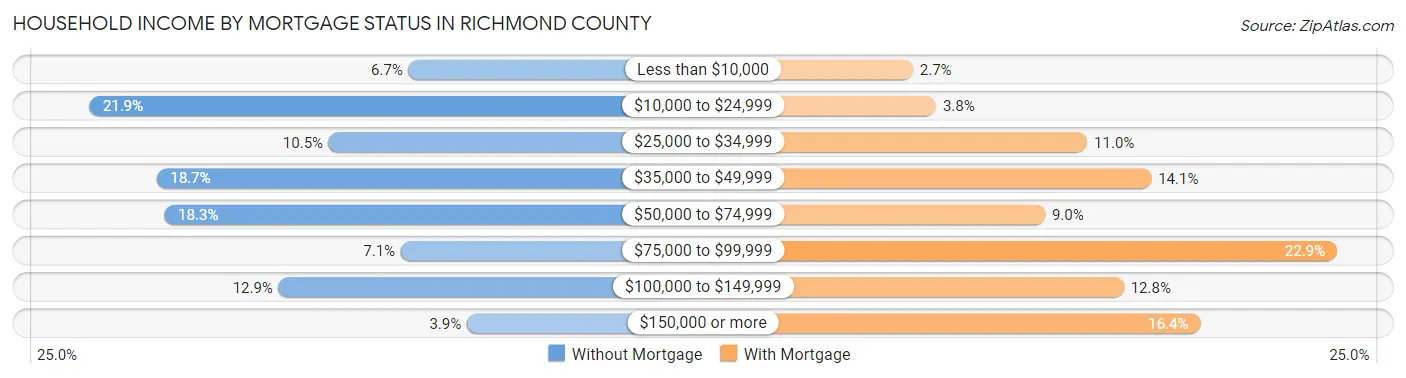
| Household Income | Without Mortgage | With Mortgage |
| Less than $10,000 | 366 (6.7%) | 147 (2.7%) |
| $10,000 to $24,999 | 1,193 (21.9%) | 206 (3.8%) |
| $25,000 to $34,999 | 573 (10.5%) | 593 (11.0%) |
| $35,000 to $49,999 | 1,018 (18.7%) | 757 (14.1%) |
| $50,000 to $74,999 | 998 (18.3%) | 485 (9.0%) |
| $75,000 to $99,999 | 386 (7.1%) | 1,233 (22.9%) |
| $100,000 to $149,999 | 703 (12.9%) | 687 (12.8%) |
| $150,000 or more | 214 (3.9%) | 883 (16.4%) |
| Total | 5,451 (100.0%) | 5,378 (100.0%) |
Property Value to Household Income Ratio in Richmond County
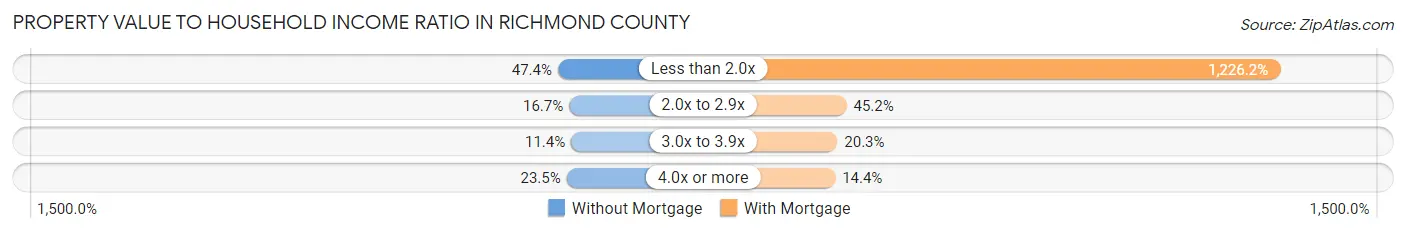
| Value-to-Income Ratio | Without Mortgage | With Mortgage |
| Less than 2.0x | 2,584 (47.4%) | 65,947 (1,226.2%) |
| 2.0x to 2.9x | 912 (16.7%) | 2,432 (45.2%) |
| 3.0x to 3.9x | 619 (11.4%) | 1,089 (20.3%) |
| 4.0x or more | 1,283 (23.5%) | 774 (14.4%) |
| Total | 5,451 (100.0%) | 5,378 (100.0%) |
Real Estate Taxes by Mortgage Status in Richmond County
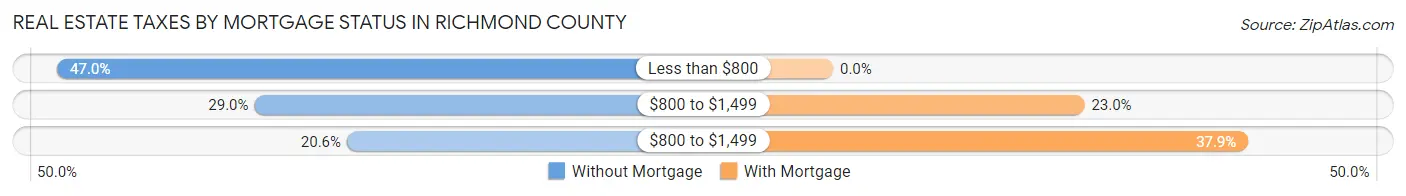
| Property Taxes | Without Mortgage | With Mortgage |
| Less than $800 | 2,564 (47.0%) | 0 (0.0%) |
| $800 to $1,499 | 1,582 (29.0%) | 1,235 (23.0%) |
| $800 to $1,499 | 1,121 (20.6%) | 2,039 (37.9%) |
| Total | 5,451 (100.0%) | 5,378 (100.0%) |
Health & Disability in Richmond County
Health Insurance Coverage by Age in Richmond County
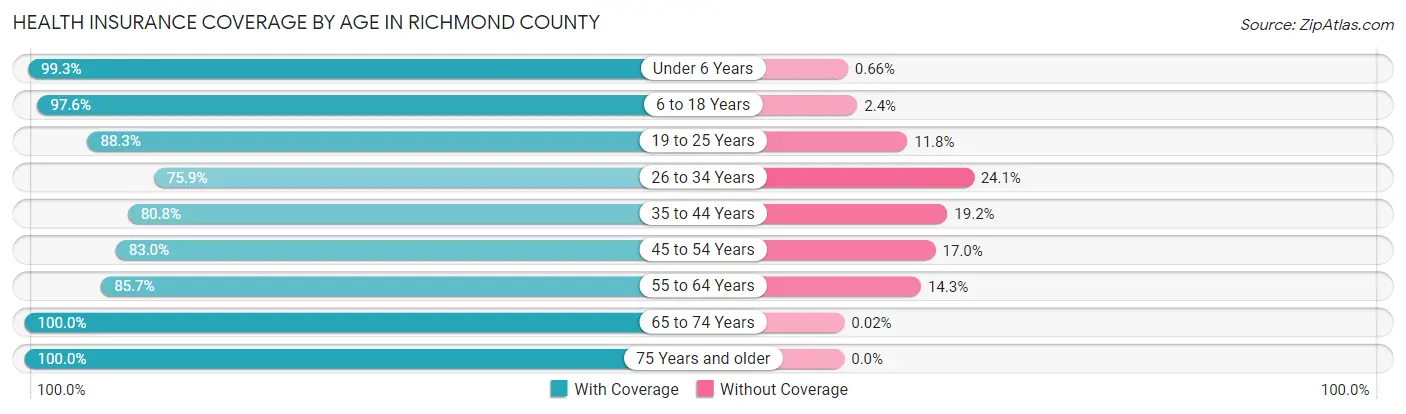
| Age Bracket | With Coverage | Without Coverage |
| Under 6 Years | 2,863 (99.3%) | 19 (0.7%) |
| 6 to 18 Years | 7,456 (97.6%) | 186 (2.4%) |
| 19 to 25 Years | 3,426 (88.2%) | 456 (11.7%) |
| 26 to 34 Years | 3,129 (75.9%) | 995 (24.1%) |
| 35 to 44 Years | 4,003 (80.8%) | 953 (19.2%) |
| 45 to 54 Years | 4,403 (83.0%) | 904 (17.0%) |
| 55 to 64 Years | 4,841 (85.7%) | 808 (14.3%) |
| 65 to 74 Years | 4,625 (100.0%) | 1 (0.0%) |
| 75 Years and older | 2,874 (100.0%) | 0 (0.0%) |
| Total | 37,620 (89.7%) | 4,322 (10.3%) |
Health Insurance Coverage by Citizenship Status in Richmond County
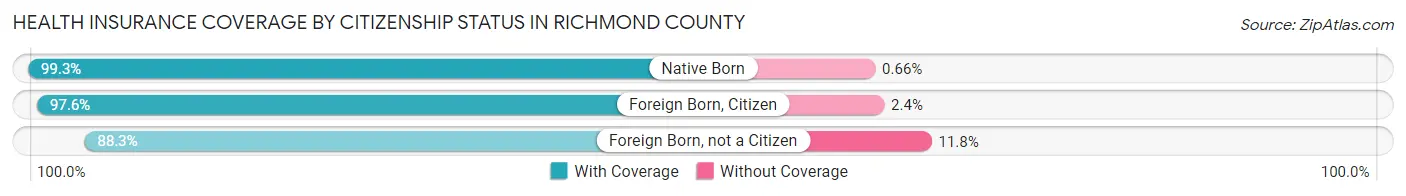
| Citizenship Status | With Coverage | Without Coverage |
| Native Born | 2,863 (99.3%) | 19 (0.7%) |
| Foreign Born, Citizen | 7,456 (97.6%) | 186 (2.4%) |
| Foreign Born, not a Citizen | 3,426 (88.2%) | 456 (11.7%) |
Health Insurance Coverage by Household Income in Richmond County
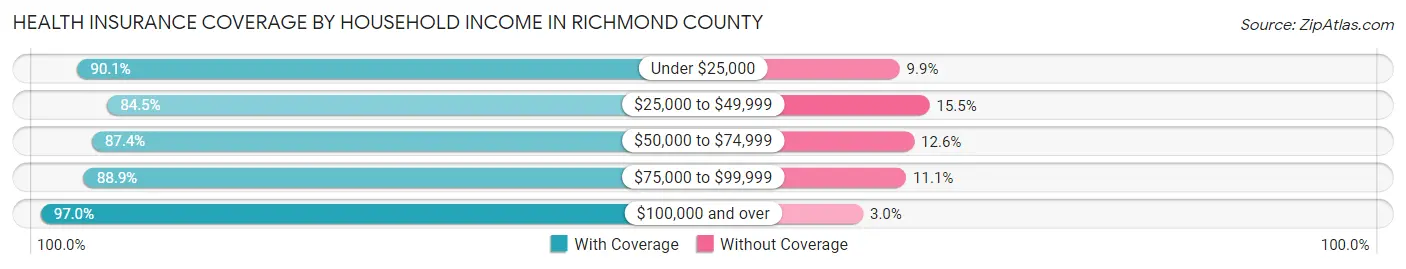
| Household Income | With Coverage | Without Coverage |
| Under $25,000 | 8,928 (90.1%) | 981 (9.9%) |
| $25,000 to $49,999 | 8,060 (84.5%) | 1,480 (15.5%) |
| $50,000 to $74,999 | 6,550 (87.4%) | 946 (12.6%) |
| $75,000 to $99,999 | 4,901 (88.9%) | 613 (11.1%) |
| $100,000 and over | 9,108 (97.0%) | 286 (3.0%) |
Public vs Private Health Insurance Coverage by Age in Richmond County
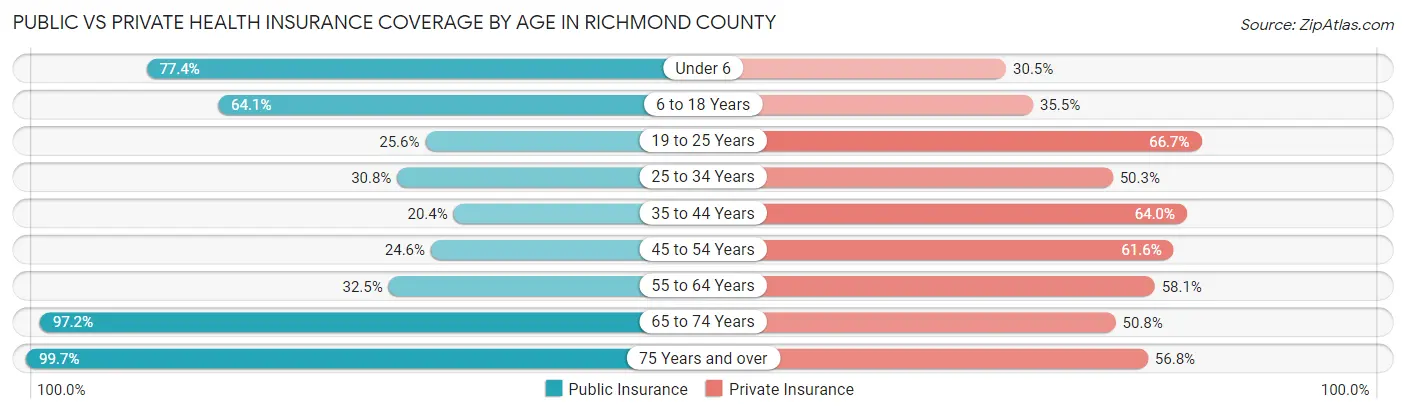
| Age Bracket | Public Insurance | Private Insurance |
| Under 6 | 2,230 (77.4%) | 879 (30.5%) |
| 6 to 18 Years | 4,898 (64.1%) | 2,713 (35.5%) |
| 19 to 25 Years | 995 (25.6%) | 2,590 (66.7%) |
| 25 to 34 Years | 1,272 (30.8%) | 2,074 (50.3%) |
| 35 to 44 Years | 1,010 (20.4%) | 3,174 (64.0%) |
| 45 to 54 Years | 1,305 (24.6%) | 3,267 (61.6%) |
| 55 to 64 Years | 1,833 (32.5%) | 3,281 (58.1%) |
| 65 to 74 Years | 4,495 (97.2%) | 2,351 (50.8%) |
| 75 Years and over | 2,866 (99.7%) | 1,633 (56.8%) |
| Total | 20,904 (49.8%) | 21,962 (52.4%) |
Disability Status by Sex by Age in Richmond County
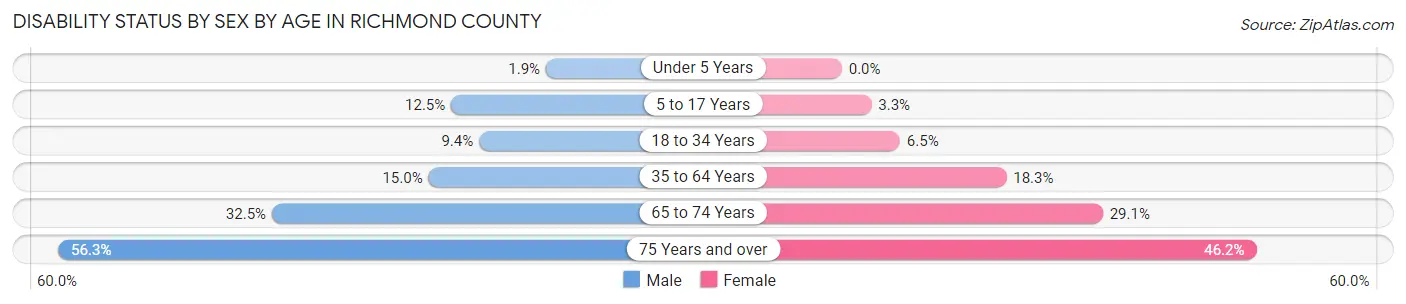
| Age Bracket | Male | Female |
| Under 5 Years | 24 (1.9%) | 0 (0.0%) |
| 5 to 17 Years | 464 (12.5%) | 123 (3.3%) |
| 18 to 34 Years | 383 (9.4%) | 287 (6.5%) |
| 35 to 64 Years | 1,164 (15.0%) | 1,495 (18.3%) |
| 65 to 74 Years | 694 (32.5%) | 723 (29.1%) |
| 75 Years and over | 664 (56.3%) | 782 (46.2%) |
Disability Class by Sex by Age in Richmond County
Disability Class: Hearing Difficulty
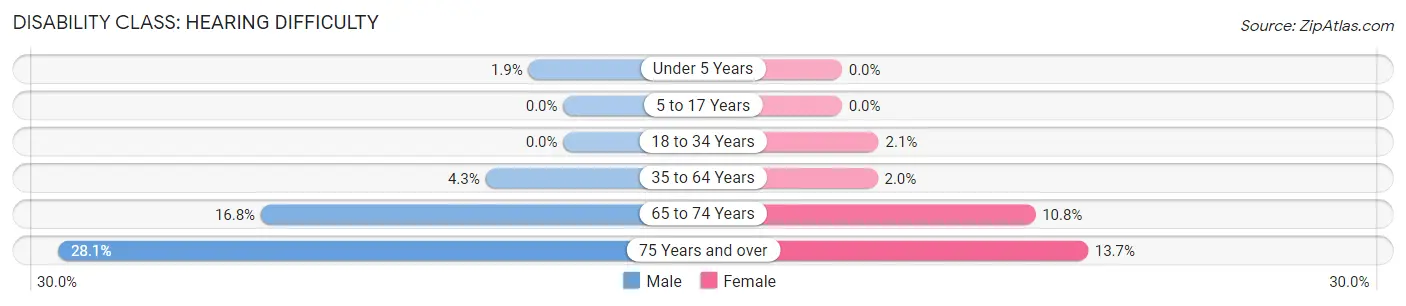
| Age Bracket | Male | Female |
| Under 5 Years | 24 (1.9%) | 0 (0.0%) |
| 5 to 17 Years | 0 (0.0%) | 0 (0.0%) |
| 18 to 34 Years | 0 (0.0%) | 91 (2.1%) |
| 35 to 64 Years | 336 (4.3%) | 162 (2.0%) |
| 65 to 74 Years | 360 (16.8%) | 268 (10.8%) |
| 75 Years and over | 332 (28.1%) | 232 (13.7%) |
Disability Class: Vision Difficulty
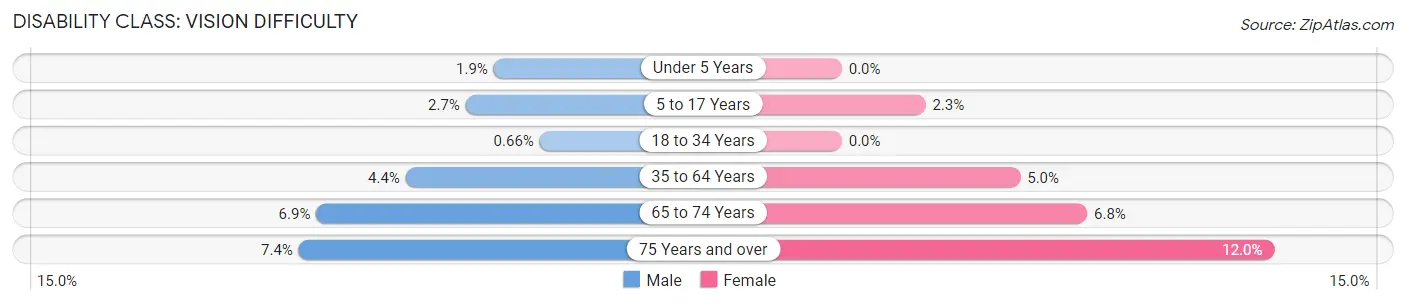
| Age Bracket | Male | Female |
| Under 5 Years | 24 (1.9%) | 0 (0.0%) |
| 5 to 17 Years | 101 (2.7%) | 87 (2.3%) |
| 18 to 34 Years | 27 (0.7%) | 0 (0.0%) |
| 35 to 64 Years | 340 (4.4%) | 406 (5.0%) |
| 65 to 74 Years | 147 (6.9%) | 170 (6.8%) |
| 75 Years and over | 87 (7.4%) | 204 (12.0%) |
Disability Class: Cognitive Difficulty
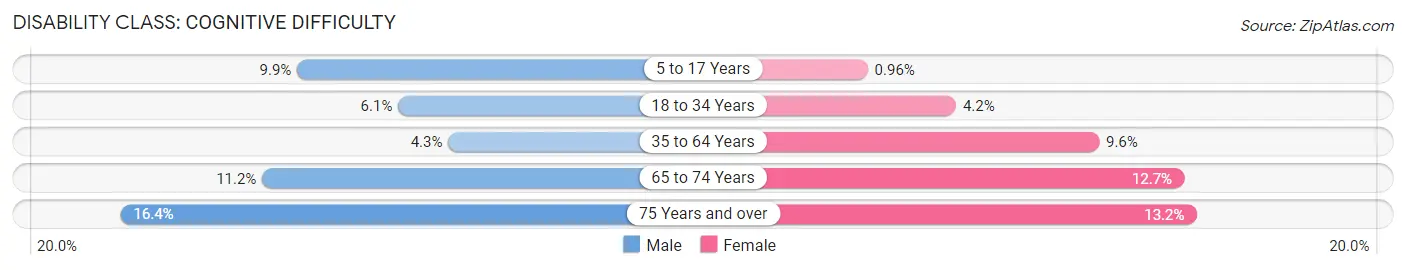
| Age Bracket | Male | Female |
| 5 to 17 Years | 367 (9.9%) | 36 (1.0%) |
| 18 to 34 Years | 250 (6.1%) | 188 (4.2%) |
| 35 to 64 Years | 331 (4.3%) | 779 (9.6%) |
| 65 to 74 Years | 239 (11.2%) | 316 (12.7%) |
| 75 Years and over | 194 (16.4%) | 223 (13.2%) |
Disability Class: Ambulatory Difficulty
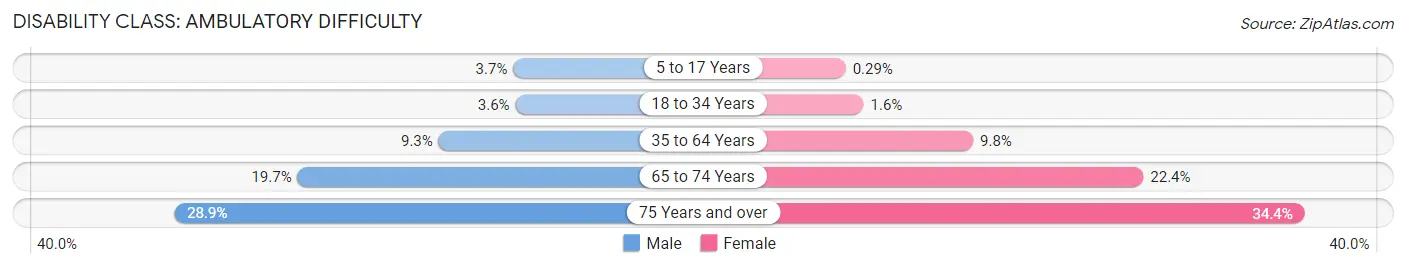
| Age Bracket | Male | Female |
| 5 to 17 Years | 138 (3.7%) | 11 (0.3%) |
| 18 to 34 Years | 145 (3.6%) | 72 (1.6%) |
| 35 to 64 Years | 718 (9.3%) | 796 (9.8%) |
| 65 to 74 Years | 422 (19.7%) | 557 (22.4%) |
| 75 Years and over | 341 (28.9%) | 582 (34.4%) |
Disability Class: Self-Care Difficulty
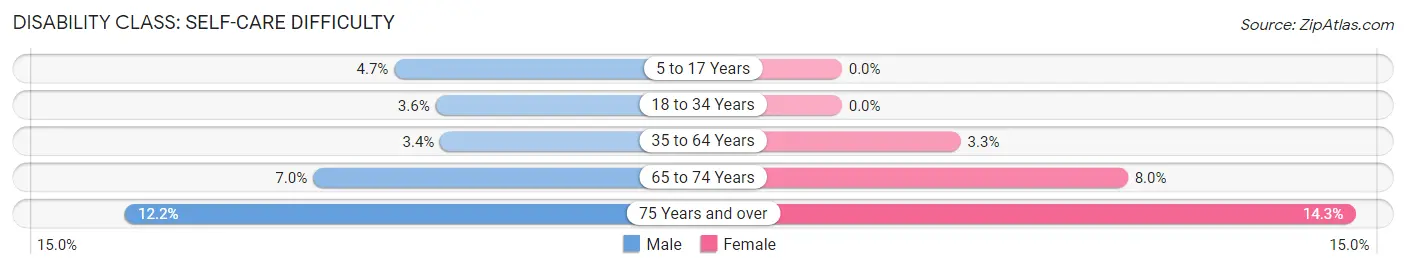
| Age Bracket | Male | Female |
| 5 to 17 Years | 175 (4.7%) | 0 (0.0%) |
| 18 to 34 Years | 145 (3.6%) | 0 (0.0%) |
| 35 to 64 Years | 266 (3.4%) | 270 (3.3%) |
| 65 to 74 Years | 149 (7.0%) | 198 (8.0%) |
| 75 Years and over | 144 (12.2%) | 242 (14.3%) |
Technology Access in Richmond County
Computing Device Access in Richmond County
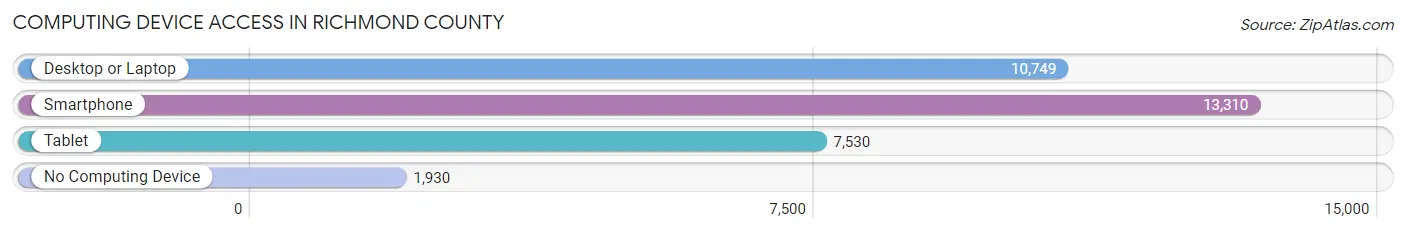
| Device Type | # Households | % Households |
| Desktop or Laptop | 10,749 | 64.7% |
| Smartphone | 13,310 | 80.2% |
| Tablet | 7,530 | 45.4% |
| No Computing Device | 1,930 | 11.6% |
| Total | 16,605 | 100.0% |
Internet Access in Richmond County
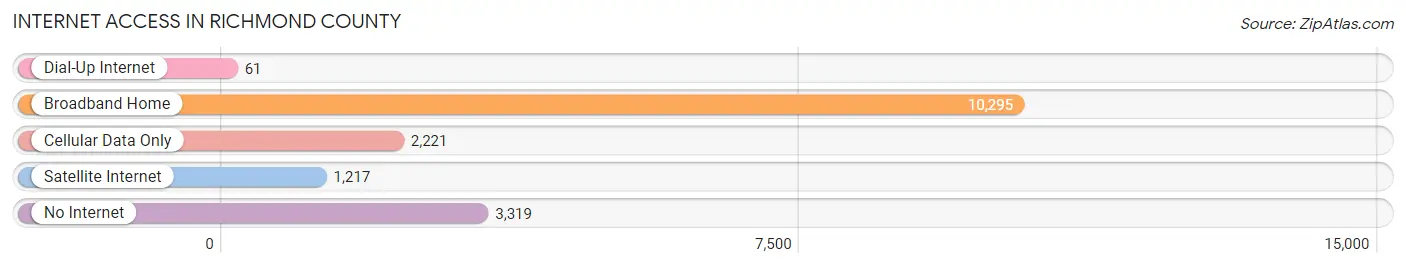
| Internet Type | # Households | % Households |
| Dial-Up Internet | 61 | 0.4% |
| Broadband Home | 10,295 | 62.0% |
| Cellular Data Only | 2,221 | 13.4% |
| Satellite Internet | 1,217 | 7.3% |
| No Internet | 3,319 | 20.0% |
| Total | 16,605 | 100.0% |
Richmond County Summary
Richmond County is a county located in the U.S. state of North Carolina. As of the 2010 census, the population was 46,639. The county seat is Rockingham. Richmond County is part of the Laurinburg, NC Micropolitan Statistical Area.
History
Richmond County was formed in 1779 from Anson County. It was named for Charles Lennox, 3rd Duke of Richmond, who had been a supporter of the American Revolution. The county was divided in 1785, with the western part becoming Scotland County.
Geography
Richmond County is located in the south-central part of North Carolina, in the Sandhills region. It is bordered by Scotland County to the west, Moore County to the north, Montgomery County to the east, and Hoke County to the south. The county covers an area of 545 square miles, with a population density of 85 people per square mile.
The county is mostly rural, with the majority of the population living in the towns of Rockingham and Hamlet. The county is home to several state parks, including the Uwharrie National Forest, Morrow Mountain State Park, and the Pee Dee National Wildlife Refuge.
Economy
Richmond County has a diverse economy, with the largest employers being the healthcare, retail, and manufacturing industries. The county is home to several large employers, including FirstHealth of the Carolinas, Sandhills Regional Medical Center, and the Richmond County School System.
The county is also home to several small businesses, including farms, restaurants, and retail stores. Agriculture is a major part of the county's economy, with the top crops being corn, soybeans, and cotton.
Demographics
As of the 2010 census, there were 46,639 people, 17,945 households, and 12,845 families living in the county. The population density was 85 people per square mile. The racial makeup of the county was 68.3% White, 25.2% African American, 0.4% Native American, 0.7% Asian, 0.1% Pacific Islander, 4.2% from other races, and 1.1% from two or more races. Hispanic or Latino of any race were 8.2% of the population.
The median income for a household in the county was $35,945, and the median income for a family was $43,945. The per capita income for the county was $17,945. About 17.2% of families and 21.2% of the population were below the poverty line, including 28.2% of those under age 18 and 16.2% of those age 65 or over.
Conclusion
Richmond County is a rural county located in the south-central part of North Carolina. It has a diverse economy, with the largest employers being the healthcare, retail, and manufacturing industries. The county is home to several state parks and is a major agricultural producer. The population of the county is 46,639, with a median household income of $35,945.
Common Questions
What is Per Capita Income in Richmond County?
Per Capita income in Richmond County is $24,416.
What is the Median Family Income in Richmond County?
Median Family Income in Richmond County is $58,611.
What is the Median Household income in Richmond County?
Median Household Income in Richmond County is $42,354.
What is Income or Wage Gap in Richmond County?
Income or Wage Gap in Richmond County is 27.4%.
Women in Richmond County earn 72.6 cents for every dollar earned by a man.
What is Family Income Deficit in Richmond County?
Family Income Deficit in Richmond County is $12,202.
Families that are below poverty line in Richmond County earn $12,202 less on average than the poverty threshold level.
What is Inequality or Gini Index in Richmond County?
Inequality or Gini Index in Richmond County is 0.47.
What is the Total Population of Richmond County?
Total Population of Richmond County is 43,149.
What is the Total Male Population of Richmond County?
Total Male Population of Richmond County is 21,082.
What is the Total Female Population of Richmond County?
Total Female Population of Richmond County is 22,067.
What is the Ratio of Males per 100 Females in Richmond County?
There are 95.54 Males per 100 Females in Richmond County.
What is the Ratio of Females per 100 Males in Richmond County?
There are 104.67 Females per 100 Males in Richmond County.
What is the Median Population Age in Richmond County?
Median Population Age in Richmond County is 40.1 Years.
What is the Average Family Size in Richmond County
Average Family Size in Richmond County is 3.2 People.
What is the Average Household Size in Richmond County
Average Household Size in Richmond County is 2.5 People.
How Large is the Labor Force in Richmond County?
There are 19,914 People in the Labor Forcein in Richmond County.
What is the Percentage of People in the Labor Force in Richmond County?
57.9% of People are in the Labor Force in Richmond County.
What is the Unemployment Rate in Richmond County?
Unemployment Rate in Richmond County is 9.6%.