Pender County, NC Map & Demographics
Pender County Map
Pender County Overview
$36,352
PER CAPITA INCOME
$90,057
AVG FAMILY INCOME
$74,538
AVG HOUSEHOLD INCOME
31.7%
WAGE / INCOME GAP [ % ]
68.3¢/ $1
WAGE / INCOME GAP [ $ ]
$12,353
FAMILY INCOME DEFICIT
0.44
INEQUALITY / GINI INDEX
61,592
TOTAL POPULATION
31,258
MALE POPULATION
30,334
FEMALE POPULATION
103.05
MALES / 100 FEMALES
97.04
FEMALES / 100 MALES
42.6
MEDIAN AGE
3.2
AVG FAMILY SIZE
2.6
AVG HOUSEHOLD SIZE
30,100
LABOR FORCE [ PEOPLE ]
60.5%
PERCENT IN LABOR FORCE
6.4%
UNEMPLOYMENT RATE
Pender County Area Codes
Income in Pender County
Income Overview in Pender County
Per Capita Income in Pender County is $36,352, while median incomes of families and households are $90,057 and $74,538 respectively.
| Characteristic | Number | Measure |
| Per Capita Income | 61,592 | $36,352 |
| Median Family Income | 15,896 | $90,057 |
| Mean Family Income | 15,896 | $109,492 |
| Median Household Income | 23,258 | $74,538 |
| Mean Household Income | 23,258 | $93,195 |
| Income Deficit | 15,896 | $12,353 |
| Wage / Income Gap (%) | 61,592 | 31.68% |
| Wage / Income Gap ($) | 61,592 | 68.32¢ per $1 |
| Gini / Inequality Index | 61,592 | 0.44 |
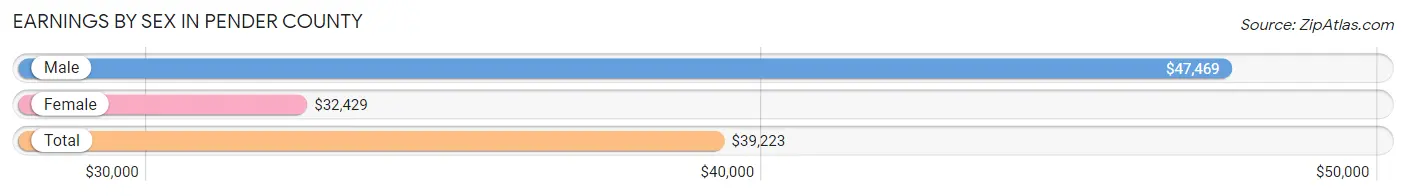
Earnings by Sex in Pender County
Average Earnings in Pender County are $39,223, $47,469 for men and $32,429 for women, a difference of 31.7%.
| Sex | Number | Average Earnings |
| Male | 16,259 (52.6%) | $47,469 |
| Female | 14,623 (47.3%) | $32,429 |
| Total | 30,882 (100.0%) | $39,223 |
Earnings by Sex by Income Bracket in Pender County
The most common earnings brackets in Pender County are $100,000+ for men (2,844 | 17.5%) and $2,499 or less for women (1,312 | 9.0%).
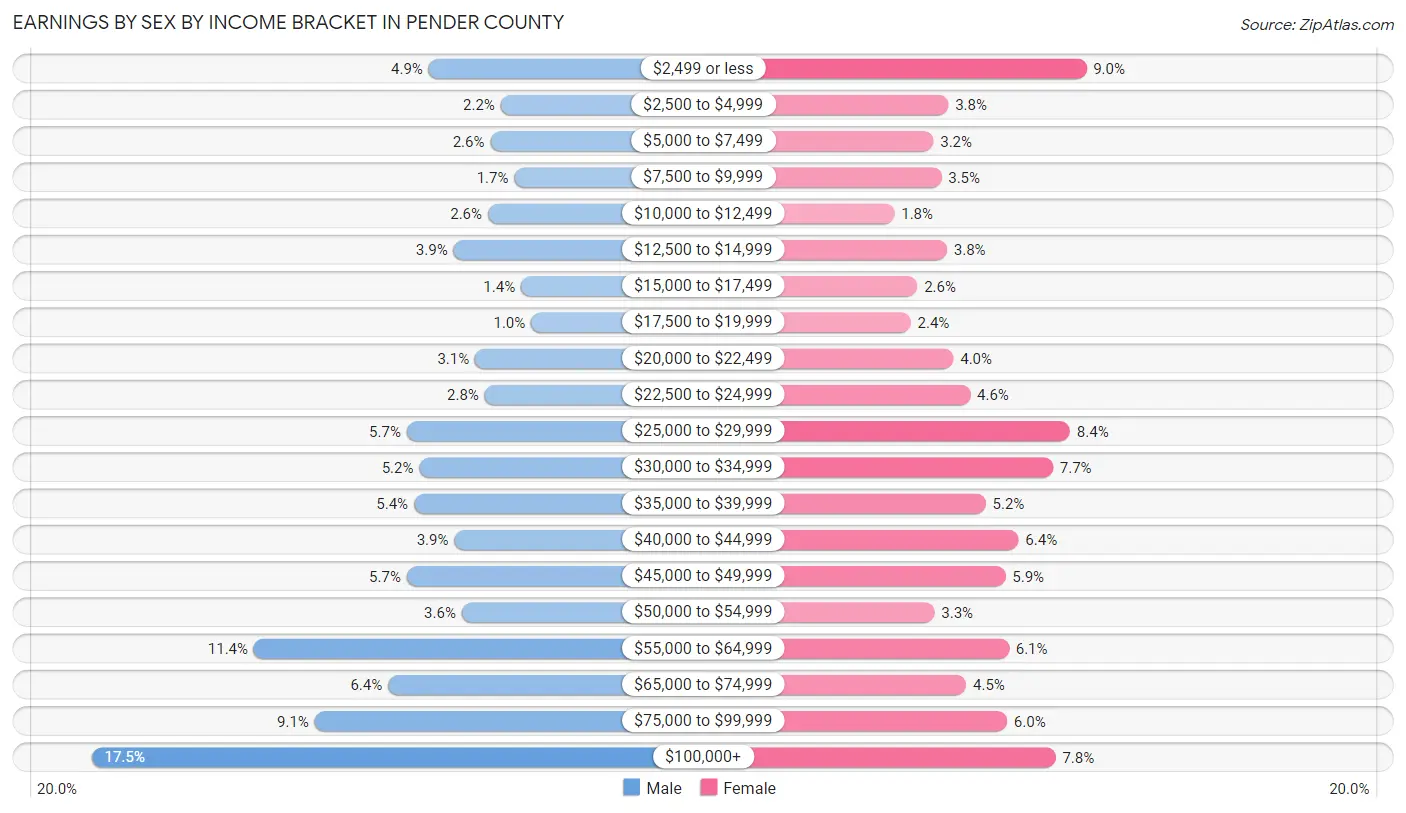
| Income | Male | Female |
| $2,499 or less | 791 (4.9%) | 1,312 (9.0%) |
| $2,500 to $4,999 | 352 (2.2%) | 556 (3.8%) |
| $5,000 to $7,499 | 414 (2.5%) | 474 (3.2%) |
| $7,500 to $9,999 | 269 (1.7%) | 517 (3.5%) |
| $10,000 to $12,499 | 430 (2.6%) | 260 (1.8%) |
| $12,500 to $14,999 | 639 (3.9%) | 548 (3.7%) |
| $15,000 to $17,499 | 227 (1.4%) | 386 (2.6%) |
| $17,500 to $19,999 | 166 (1.0%) | 350 (2.4%) |
| $20,000 to $22,499 | 508 (3.1%) | 584 (4.0%) |
| $22,500 to $24,999 | 448 (2.8%) | 675 (4.6%) |
| $25,000 to $29,999 | 923 (5.7%) | 1,223 (8.4%) |
| $30,000 to $34,999 | 847 (5.2%) | 1,129 (7.7%) |
| $35,000 to $39,999 | 879 (5.4%) | 760 (5.2%) |
| $40,000 to $44,999 | 634 (3.9%) | 940 (6.4%) |
| $45,000 to $49,999 | 924 (5.7%) | 868 (5.9%) |
| $50,000 to $54,999 | 588 (3.6%) | 479 (3.3%) |
| $55,000 to $64,999 | 1,855 (11.4%) | 887 (6.1%) |
| $65,000 to $74,999 | 1,037 (6.4%) | 653 (4.5%) |
| $75,000 to $99,999 | 1,484 (9.1%) | 878 (6.0%) |
| $100,000+ | 2,844 (17.5%) | 1,144 (7.8%) |
| Total | 16,259 (100.0%) | 14,623 (100.0%) |
Earnings by Sex by Educational Attainment in Pender County
Average earnings in Pender County are $55,078 for men and $36,547 for women, a difference of 33.7%. Men with an educational attainment of graduate degree enjoy the highest average annual earnings of $76,739, while those with less than high school education earn the least with $28,422. Women with an educational attainment of graduate degree earn the most with the average annual earnings of $65,403, while those with less than high school education have the smallest earnings of $16,433.
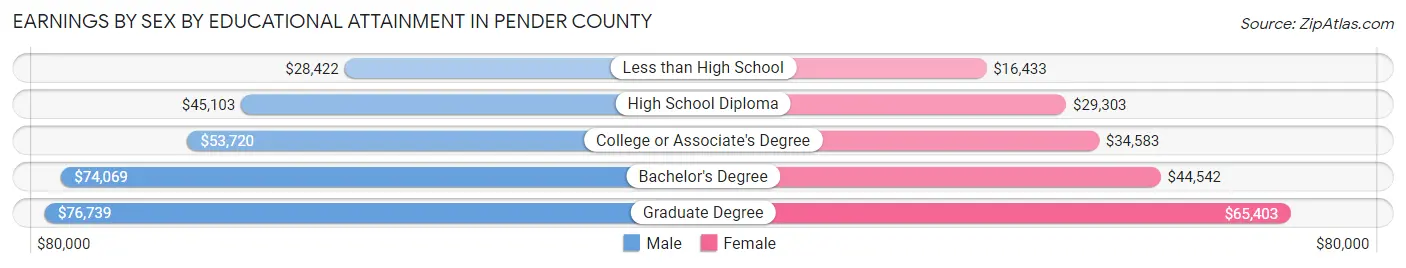
| Educational Attainment | Male Income | Female Income |
| Less than High School | $28,422 | $16,433 |
| High School Diploma | $45,103 | $29,303 |
| College or Associate's Degree | $53,720 | $34,583 |
| Bachelor's Degree | $74,069 | $44,542 |
| Graduate Degree | $76,739 | $65,403 |
| Total | $55,078 | $36,547 |
Family Income in Pender County
Family Income Brackets in Pender County
According to the Pender County family income data, there are 3,942 families falling into the $100,000 to $149,999 income range, which is the most common income bracket and makes up 24.8% of all families. Conversely, the $10,000 to $14,999 income bracket is the least frequent group with only 223 families (1.4%) belonging to this category.
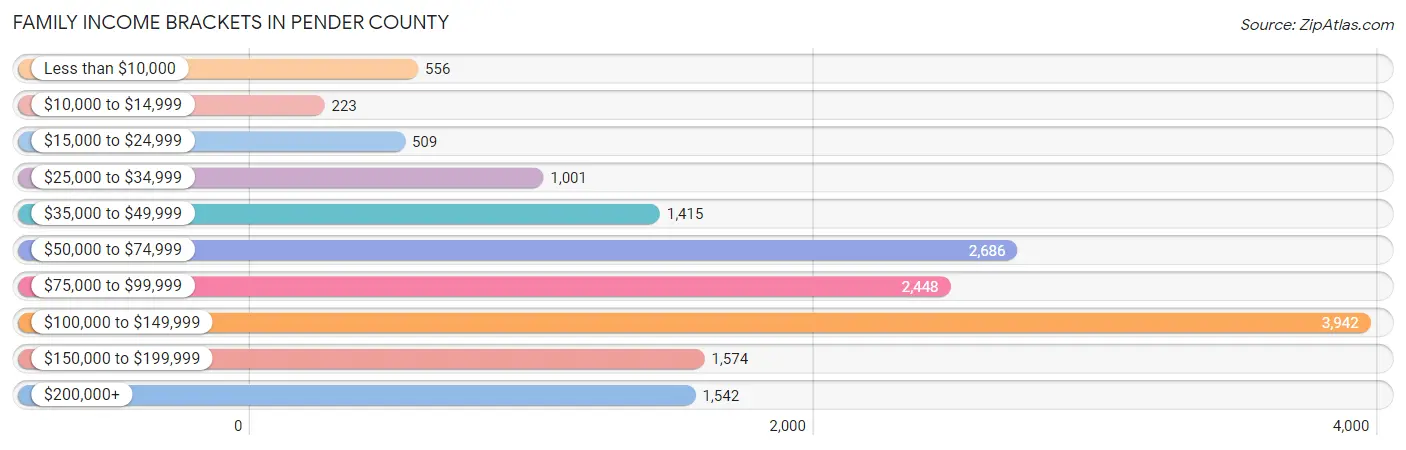
| Income Bracket | # Families | % Families |
| Less than $10,000 | 556 | 3.5% |
| $10,000 to $14,999 | 223 | 1.4% |
| $15,000 to $24,999 | 509 | 3.2% |
| $25,000 to $34,999 | 1,001 | 6.3% |
| $35,000 to $49,999 | 1,415 | 8.9% |
| $50,000 to $74,999 | 2,686 | 16.9% |
| $75,000 to $99,999 | 2,448 | 15.4% |
| $100,000 to $149,999 | 3,942 | 24.8% |
| $150,000 to $199,999 | 1,574 | 9.9% |
| $200,000+ | 1,542 | 9.7% |
Family Income by Famaliy Size in Pender County
6-person families (460 | 2.9%) account for the highest median family income in Pender County with $130,463 per family, while 2-person families (7,798 | 49.1%) have the highest median income of $40,216 per family member.
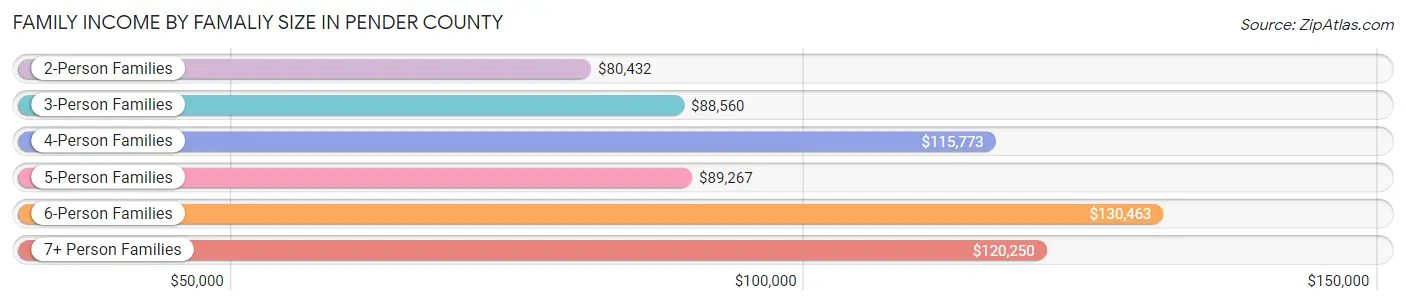
| Income Bracket | # Families | Median Income |
| 2-Person Families | 7,798 (49.1%) | $80,432 |
| 3-Person Families | 3,583 (22.5%) | $88,560 |
| 4-Person Families | 3,013 (19.0%) | $115,773 |
| 5-Person Families | 879 (5.5%) | $89,267 |
| 6-Person Families | 460 (2.9%) | $130,463 |
| 7+ Person Families | 163 (1.0%) | $120,250 |
| Total | 15,896 (100.0%) | $90,057 |
Family Income by Number of Earners in Pender County
The median family income in Pender County is $90,057, with families comprising 3+ earners (1,541) having the highest median family income of $139,875, while families with no earners (2,717) have the lowest median family income of $56,461, accounting for 9.7% and 17.1% of families, respectively.
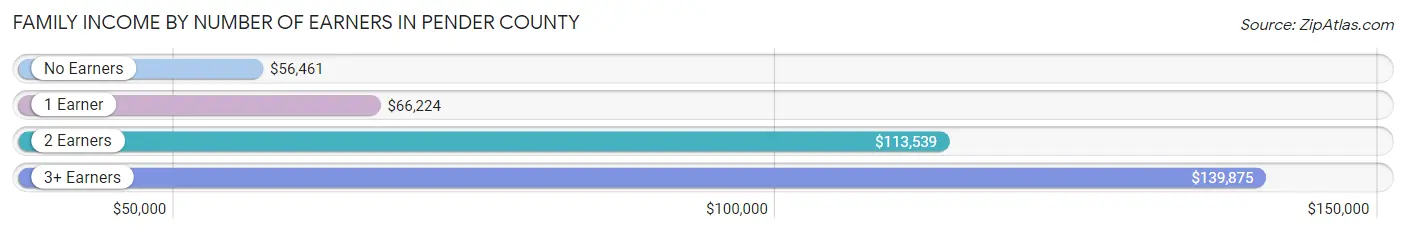
| Number of Earners | # Families | Median Income |
| No Earners | 2,717 (17.1%) | $56,461 |
| 1 Earner | 5,569 (35.0%) | $66,224 |
| 2 Earners | 6,069 (38.2%) | $113,539 |
| 3+ Earners | 1,541 (9.7%) | $139,875 |
| Total | 15,896 (100.0%) | $90,057 |
Household Income in Pender County
Household Income Brackets in Pender County
With 5,070 households falling in the category, the $100,000 to $149,999 income range is the most frequent in Pender County, accounting for 21.8% of all households. In contrast, only 1,070 households (4.6%) fall into the $10,000 to $14,999 income bracket, making it the least populous group.
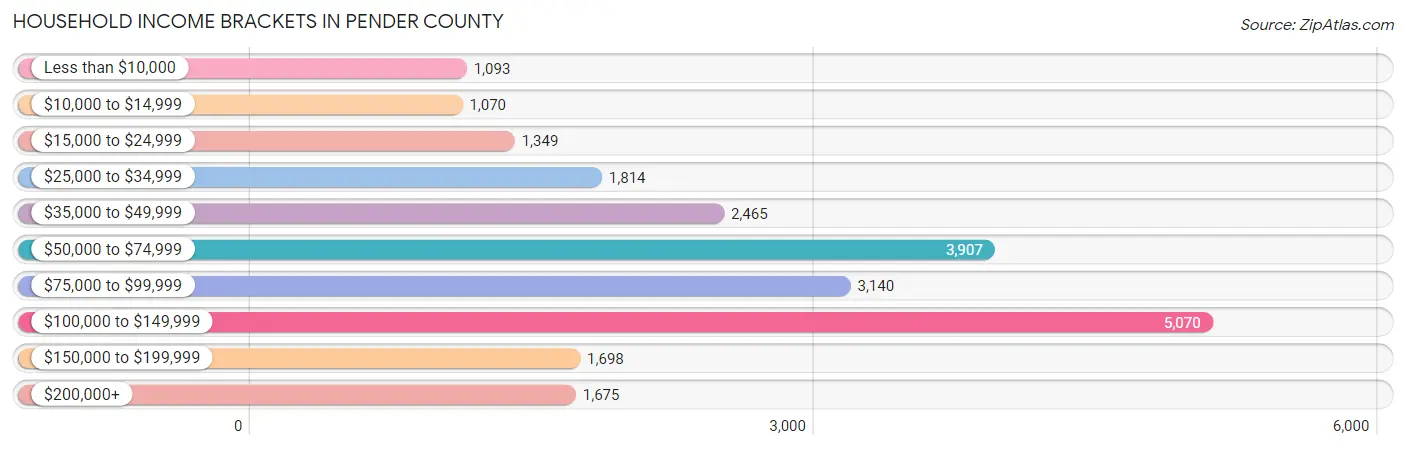
| Income Bracket | # Households | % Households |
| Less than $10,000 | 1,093 | 4.7% |
| $10,000 to $14,999 | 1,070 | 4.6% |
| $15,000 to $24,999 | 1,349 | 5.8% |
| $25,000 to $34,999 | 1,814 | 7.8% |
| $35,000 to $49,999 | 2,465 | 10.6% |
| $50,000 to $74,999 | 3,907 | 16.8% |
| $75,000 to $99,999 | 3,140 | 13.5% |
| $100,000 to $149,999 | 5,070 | 21.8% |
| $150,000 to $199,999 | 1,698 | 7.3% |
| $200,000+ | 1,675 | 7.2% |
Household Income by Householder Age in Pender County
The median household income in Pender County is $74,538, with the highest median household income of $83,014 found in the 45 to 64 years age bracket for the primary householder. A total of 9,407 households (40.5%) fall into this category. Meanwhile, the 15 to 24 years age bracket for the primary householder has the lowest median household income of $53,991, with 350 households (1.5%) in this group.
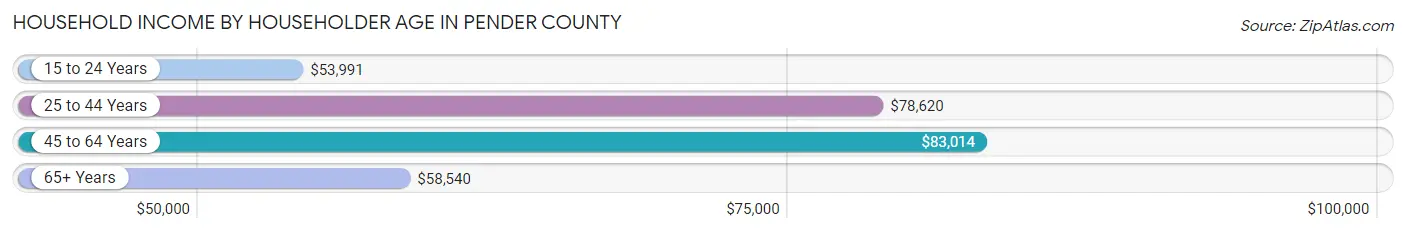
| Income Bracket | # Households | Median Income |
| 15 to 24 Years | 350 (1.5%) | $53,991 |
| 25 to 44 Years | 6,669 (28.7%) | $78,620 |
| 45 to 64 Years | 9,407 (40.5%) | $83,014 |
| 65+ Years | 6,832 (29.4%) | $58,540 |
| Total | 23,258 (100.0%) | $74,538 |
Poverty in Pender County
Income Below Poverty by Sex and Age in Pender County
With 11.1% poverty level for males and 12.3% for females among the residents of Pender County, 12 to 14 year old males and 5 year old females are the most vulnerable to poverty, with 314 males (24.5%) and 102 females (24.8%) in their respective age groups living below the poverty level.
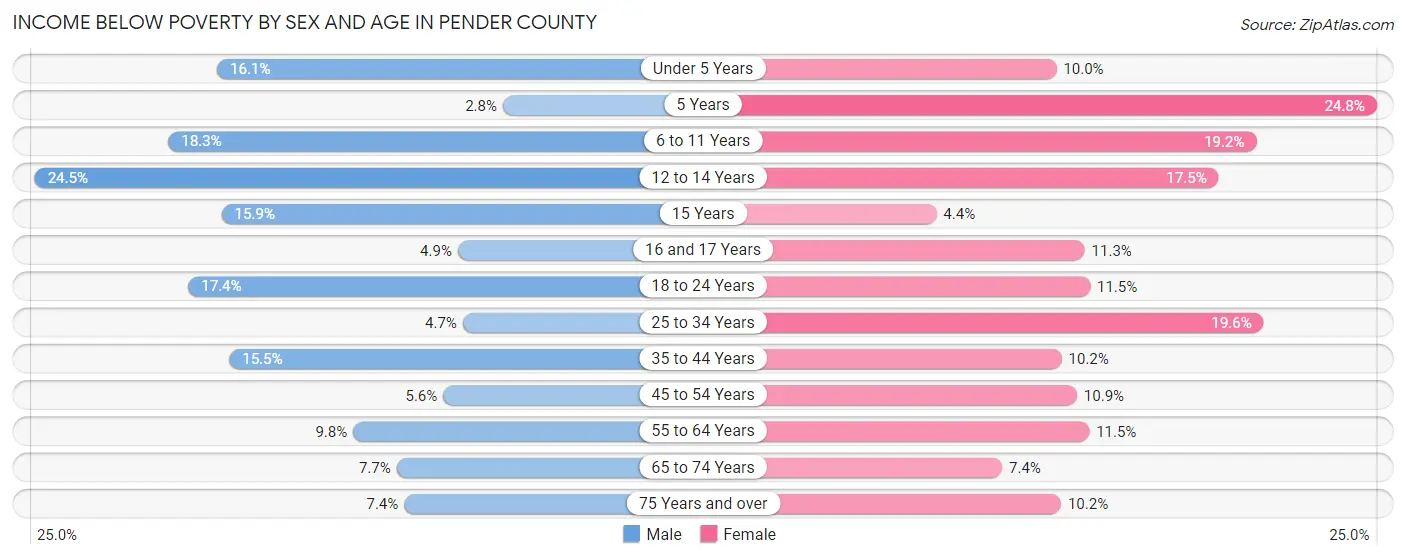
| Age Bracket | Male | Female |
| Under 5 Years | 293 (16.1%) | 139 (10.0%) |
| 5 Years | 10 (2.8%) | 102 (24.8%) |
| 6 to 11 Years | 429 (18.3%) | 452 (19.2%) |
| 12 to 14 Years | 314 (24.5%) | 183 (17.5%) |
| 15 Years | 36 (15.9%) | 17 (4.4%) |
| 16 and 17 Years | 51 (4.9%) | 81 (11.3%) |
| 18 to 24 Years | 395 (17.4%) | 243 (11.5%) |
| 25 to 34 Years | 153 (4.7%) | 614 (19.6%) |
| 35 to 44 Years | 621 (15.5%) | 401 (10.2%) |
| 45 to 54 Years | 233 (5.6%) | 464 (10.9%) |
| 55 to 64 Years | 433 (9.8%) | 517 (11.5%) |
| 65 to 74 Years | 248 (7.7%) | 266 (7.4%) |
| 75 Years and over | 135 (7.4%) | 220 (10.2%) |
| Total | 3,351 (11.1%) | 3,699 (12.3%) |
Income Above Poverty by Sex and Age in Pender County
According to the poverty statistics in Pender County, males aged 5 years and females aged 15 years are the age groups that are most secure financially, with 97.2% of males and 95.6% of females in these age groups living above the poverty line.
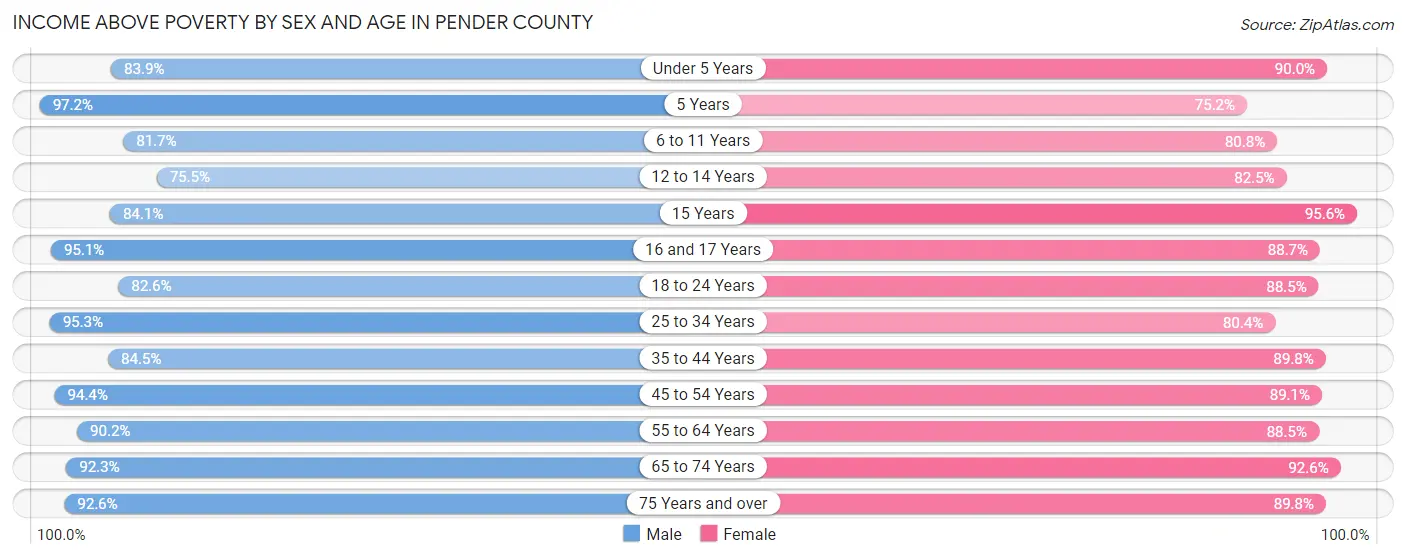
| Age Bracket | Male | Female |
| Under 5 Years | 1,530 (83.9%) | 1,256 (90.0%) |
| 5 Years | 346 (97.2%) | 309 (75.2%) |
| 6 to 11 Years | 1,912 (81.7%) | 1,898 (80.8%) |
| 12 to 14 Years | 966 (75.5%) | 864 (82.5%) |
| 15 Years | 191 (84.1%) | 370 (95.6%) |
| 16 and 17 Years | 989 (95.1%) | 638 (88.7%) |
| 18 to 24 Years | 1,875 (82.6%) | 1,866 (88.5%) |
| 25 to 34 Years | 3,124 (95.3%) | 2,524 (80.4%) |
| 35 to 44 Years | 3,386 (84.5%) | 3,531 (89.8%) |
| 45 to 54 Years | 3,946 (94.4%) | 3,789 (89.1%) |
| 55 to 64 Years | 4,003 (90.2%) | 3,985 (88.5%) |
| 65 to 74 Years | 2,958 (92.3%) | 3,311 (92.6%) |
| 75 Years and over | 1,691 (92.6%) | 1,944 (89.8%) |
| Total | 26,917 (88.9%) | 26,285 (87.7%) |
Income Below Poverty Among Married-Couple Families in Pender County
The poverty statistics for married-couple families in Pender County show that 5.2% or 662 of the total 12,731 families live below the poverty line. Families with 5 or more children have the highest poverty rate of 20.0%, comprising of 8 families. On the other hand, families with no children have the lowest poverty rate of 2.9%, which includes 217 families.
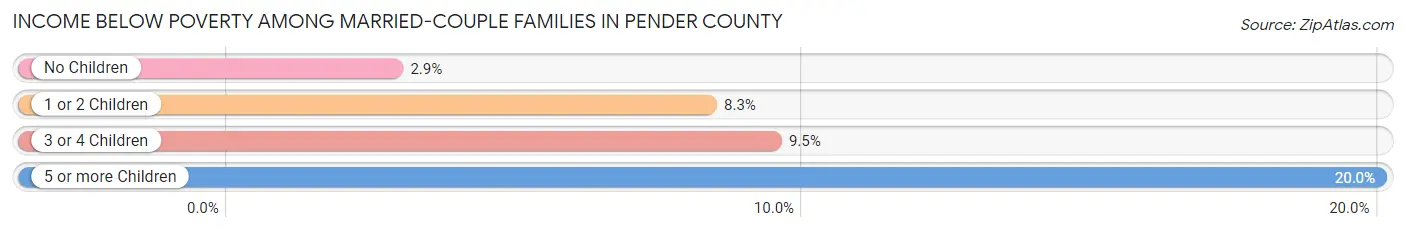
| Children | Above Poverty | Below Poverty |
| No Children | 7,329 (97.1%) | 217 (2.9%) |
| 1 or 2 Children | 4,058 (91.7%) | 369 (8.3%) |
| 3 or 4 Children | 650 (90.5%) | 68 (9.5%) |
| 5 or more Children | 32 (80.0%) | 8 (20.0%) |
| Total | 12,069 (94.8%) | 662 (5.2%) |
Income Below Poverty Among Single-Parent Households in Pender County
According to the poverty data in Pender County, 20.9% or 189 single-father households and 17.2% or 388 single-mother households are living below the poverty line. Among single-father households, those with 3 or 4 children have the highest poverty rate, with 54 households (34.6%) experiencing poverty. Likewise, among single-mother households, those with 3 or 4 children have the highest poverty rate, with 110 households (68.8%) falling below the poverty line.
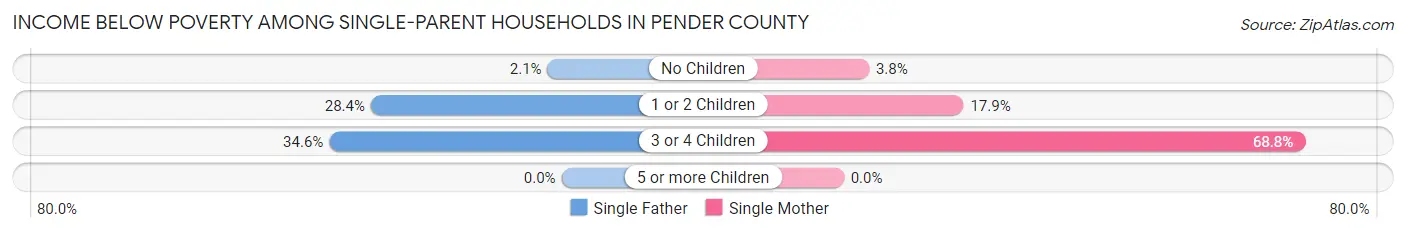
| Children | Single Father | Single Mother |
| No Children | 6 (2.1%) | 26 (3.8%) |
| 1 or 2 Children | 129 (28.4%) | 252 (17.8%) |
| 3 or 4 Children | 54 (34.6%) | 110 (68.8%) |
| 5 or more Children | 0 (0.0%) | 0 (0.0%) |
| Total | 189 (20.9%) | 388 (17.2%) |
Income Below Poverty Among Married-Couple vs Single-Parent Households in Pender County
The poverty data for Pender County shows that 662 of the married-couple family households (5.2%) and 577 of the single-parent households (18.2%) are living below the poverty level. Within the married-couple family households, those with 5 or more children have the highest poverty rate, with 8 households (20.0%) falling below the poverty line. Among the single-parent households, those with 3 or 4 children have the highest poverty rate, with 164 household (51.9%) living below poverty.
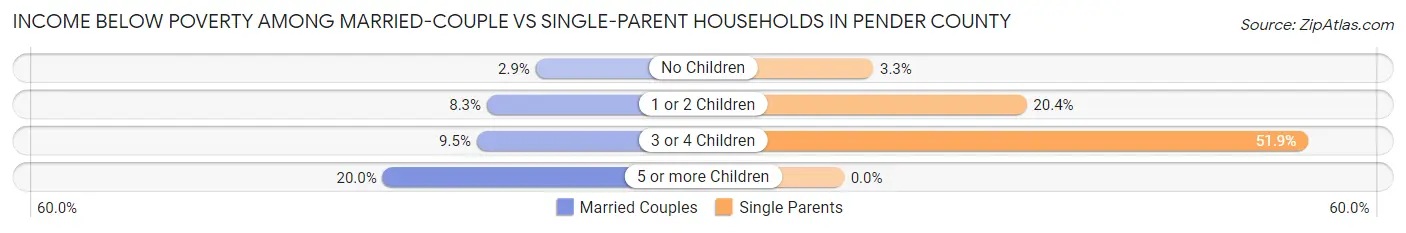
| Children | Married-Couple Families | Single-Parent Households |
| No Children | 217 (2.9%) | 32 (3.3%) |
| 1 or 2 Children | 369 (8.3%) | 381 (20.4%) |
| 3 or 4 Children | 68 (9.5%) | 164 (51.9%) |
| 5 or more Children | 8 (20.0%) | 0 (0.0%) |
| Total | 662 (5.2%) | 577 (18.2%) |
Race in Pender County
The most populous races in Pender County are White / Caucasian (46,696 | 75.8%), Black / African American (8,171 | 13.3%), and Hispanic or Latino (4,804 | 7.8%).
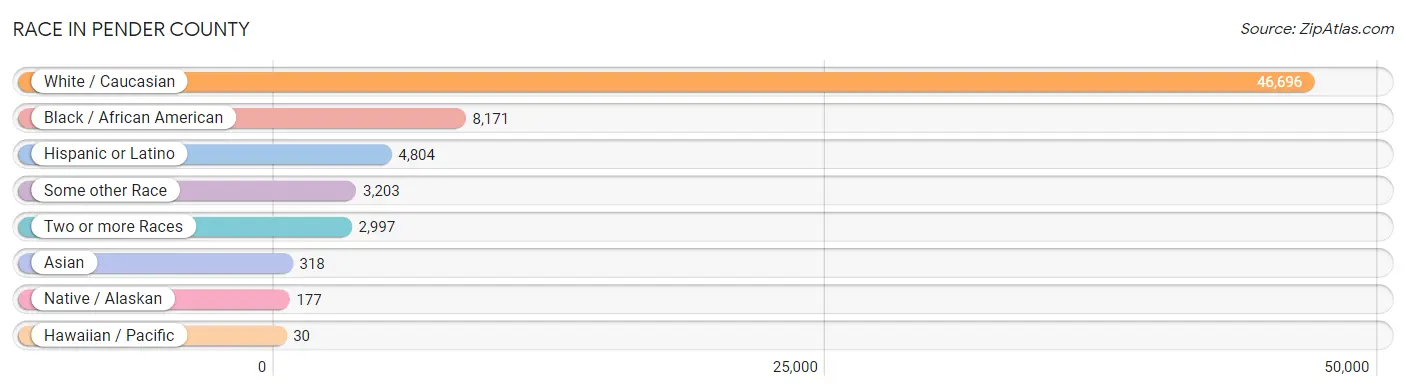
| Race | # Population | % Population |
| Asian | 318 | 0.5% |
| Black / African American | 8,171 | 13.3% |
| Hawaiian / Pacific | 30 | 0.1% |
| Hispanic or Latino | 4,804 | 7.8% |
| Native / Alaskan | 177 | 0.3% |
| White / Caucasian | 46,696 | 75.8% |
| Two or more Races | 2,997 | 4.9% |
| Some other Race | 3,203 | 5.2% |
| Total | 61,592 | 100.0% |
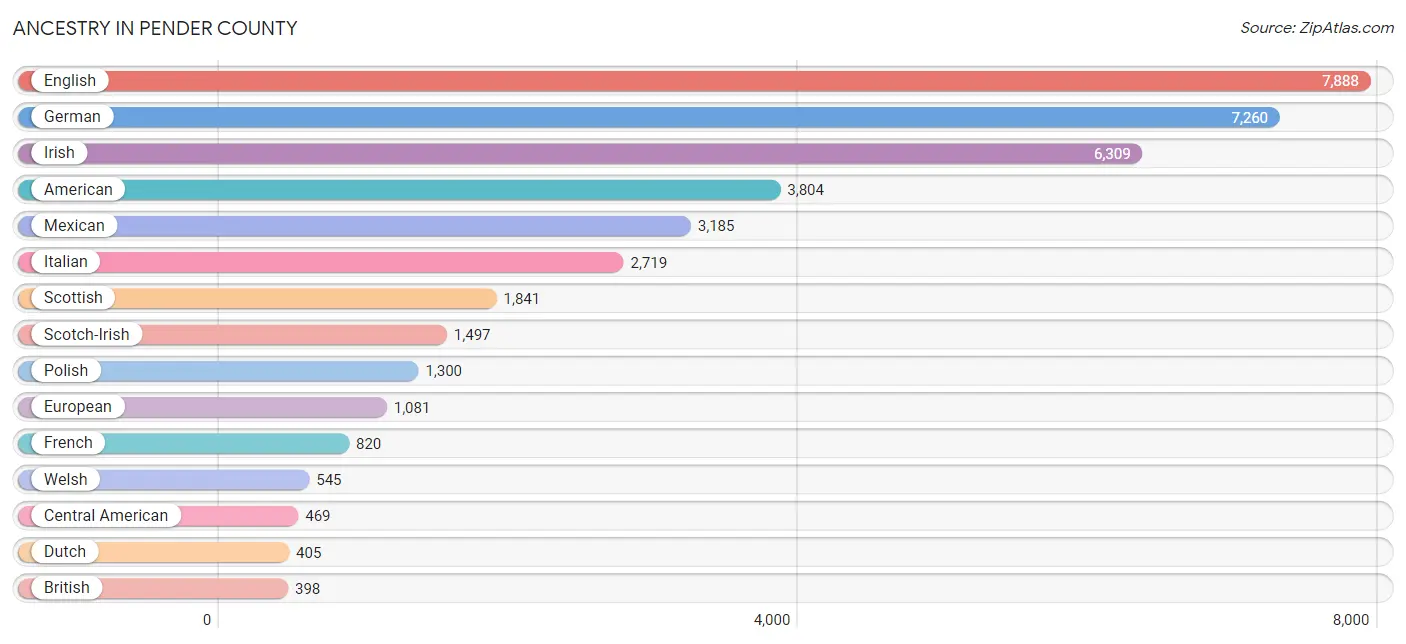
Ancestry in Pender County
The most populous ancestries reported in Pender County are English (7,888 | 12.8%), German (7,260 | 11.8%), Irish (6,309 | 10.2%), American (3,804 | 6.2%), and Mexican (3,185 | 5.2%), together accounting for 46.2% of all Pender County residents.
| Ancestry | # Population | % Population |
| African | 230 | 0.4% |
| American | 3,804 | 6.2% |
| Arab | 166 | 0.3% |
| Argentinean | 12 | 0.0% |
| Austrian | 81 | 0.1% |
| Barbadian | 17 | 0.0% |
| Belgian | 20 | 0.0% |
| Bhutanese | 27 | 0.0% |
| Blackfeet | 68 | 0.1% |
| Brazilian | 28 | 0.1% |
| British | 398 | 0.6% |
| Burmese | 113 | 0.2% |
| Cajun | 5 | 0.0% |
| Canadian | 27 | 0.0% |
| Central American | 469 | 0.8% |
| Central American Indian | 8 | 0.0% |
| Cherokee | 203 | 0.3% |
| Cheyenne | 2 | 0.0% |
| Choctaw | 17 | 0.0% |
| Colombian | 20 | 0.0% |
| Croatian | 23 | 0.0% |
| Cuban | 102 | 0.2% |
| Czech | 93 | 0.2% |
| Czechoslovakian | 54 | 0.1% |
| Danish | 90 | 0.2% |
| Dominican | 3 | 0.0% |
| Dutch | 405 | 0.7% |
| Eastern European | 202 | 0.3% |
| English | 7,888 | 12.8% |
| European | 1,081 | 1.8% |
| Finnish | 116 | 0.2% |
| French | 820 | 1.3% |
| French American Indian | 1 | 0.0% |
| French Canadian | 340 | 0.5% |
| German | 7,260 | 11.8% |
| Greek | 88 | 0.1% |
| Guamanian / Chamorro | 12 | 0.0% |
| Guatemalan | 308 | 0.5% |
| Honduran | 140 | 0.2% |
| Hungarian | 379 | 0.6% |
| Indian (Asian) | 122 | 0.2% |
| Iranian | 1 | 0.0% |
| Irish | 6,309 | 10.2% |
| Iroquois | 24 | 0.0% |
| Italian | 2,719 | 4.4% |
| Jamaican | 31 | 0.1% |
| Korean | 125 | 0.2% |
| Laotian | 94 | 0.2% |
| Lebanese | 43 | 0.1% |
| Lithuanian | 116 | 0.2% |
| Lumbee | 82 | 0.1% |
| Malaysian | 13 | 0.0% |
| Mexican | 3,185 | 5.2% |
| Mexican American Indian | 62 | 0.1% |
| Native Hawaiian | 10 | 0.0% |
| Navajo | 36 | 0.1% |
| Northern European | 36 | 0.1% |
| Norwegian | 128 | 0.2% |
| Pakistani | 4 | 0.0% |
| Panamanian | 6 | 0.0% |
| Pennsylvania German | 11 | 0.0% |
| Polish | 1,300 | 2.1% |
| Portuguese | 61 | 0.1% |
| Puerto Rican | 371 | 0.6% |
| Romanian | 42 | 0.1% |
| Russian | 305 | 0.5% |
| Salvadoran | 15 | 0.0% |
| Samoan | 18 | 0.0% |
| Scandinavian | 236 | 0.4% |
| Scotch-Irish | 1,497 | 2.4% |
| Scottish | 1,841 | 3.0% |
| Shoshone | 21 | 0.0% |
| Sioux | 65 | 0.1% |
| Slavic | 10 | 0.0% |
| Slovak | 124 | 0.2% |
| Slovene | 21 | 0.0% |
| South African | 37 | 0.1% |
| South American | 36 | 0.1% |
| Spaniard | 56 | 0.1% |
| Spanish | 211 | 0.3% |
| Spanish American | 140 | 0.2% |
| Sri Lankan | 22 | 0.0% |
| Subsaharan African | 267 | 0.4% |
| Swedish | 227 | 0.4% |
| Swiss | 201 | 0.3% |
| Syrian | 44 | 0.1% |
| Thai | 57 | 0.1% |
| Turkish | 13 | 0.0% |
| Ukrainian | 121 | 0.2% |
| Venezuelan | 4 | 0.0% |
| Welsh | 545 | 0.9% |
| West Indian | 11 | 0.0% |
| Yugoslavian | 14 | 0.0% | View All 93 Rows |
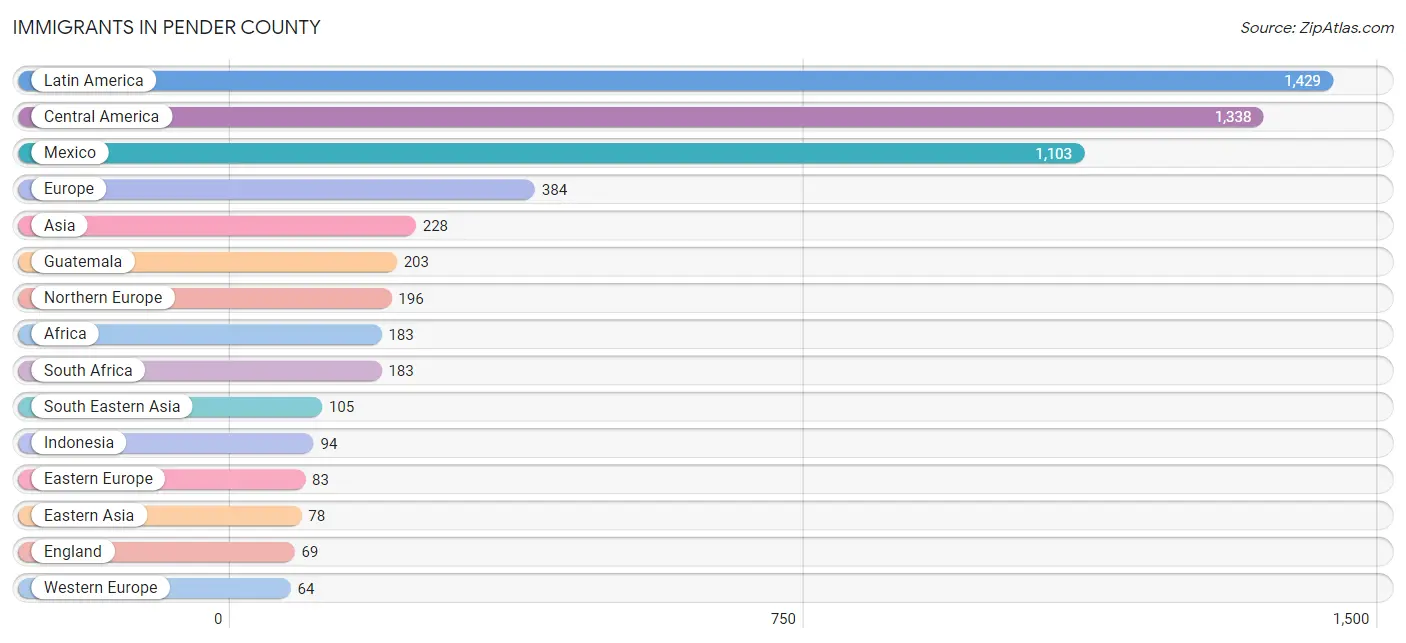
Immigrants in Pender County
The most numerous immigrant groups reported in Pender County came from Latin America (1,429 | 2.3%), Central America (1,338 | 2.2%), Mexico (1,103 | 1.8%), Europe (384 | 0.6%), and Asia (228 | 0.4%), together accounting for 7.3% of all Pender County residents.
| Immigration Origin | # Population | % Population |
| Africa | 183 | 0.3% |
| Argentina | 18 | 0.0% |
| Asia | 228 | 0.4% |
| Barbados | 17 | 0.0% |
| Belarus | 14 | 0.0% |
| Brazil | 21 | 0.0% |
| Canada | 55 | 0.1% |
| Caribbean | 34 | 0.1% |
| Central America | 1,338 | 2.2% |
| China | 19 | 0.0% |
| Colombia | 14 | 0.0% |
| Cuba | 5 | 0.0% |
| Denmark | 8 | 0.0% |
| Eastern Asia | 78 | 0.1% |
| Eastern Europe | 83 | 0.1% |
| El Salvador | 15 | 0.0% |
| England | 69 | 0.1% |
| Europe | 384 | 0.6% |
| France | 16 | 0.0% |
| Germany | 48 | 0.1% |
| Guatemala | 203 | 0.3% |
| Honduras | 17 | 0.0% |
| India | 18 | 0.0% |
| Indonesia | 94 | 0.2% |
| Ireland | 45 | 0.1% |
| Italy | 41 | 0.1% |
| Japan | 13 | 0.0% |
| Jordan | 14 | 0.0% |
| Korea | 46 | 0.1% |
| Kuwait | 9 | 0.0% |
| Latin America | 1,429 | 2.3% |
| Mexico | 1,103 | 1.8% |
| Northern Europe | 196 | 0.3% |
| Norway | 13 | 0.0% |
| Philippines | 7 | 0.0% |
| Poland | 29 | 0.1% |
| Russia | 40 | 0.1% |
| Scotland | 12 | 0.0% |
| South Africa | 183 | 0.3% |
| South America | 57 | 0.1% |
| South Central Asia | 18 | 0.0% |
| South Eastern Asia | 105 | 0.2% |
| Southern Europe | 41 | 0.1% |
| Syria | 4 | 0.0% |
| Trinidad and Tobago | 12 | 0.0% |
| Venezuela | 4 | 0.0% |
| Vietnam | 4 | 0.0% |
| Western Asia | 27 | 0.0% |
| Western Europe | 64 | 0.1% | View All 49 Rows |
Sex and Age in Pender County
Sex and Age in Pender County
The most populous age groups in Pender County are 60 to 64 Years (2,735 | 8.7%) for men and 55 to 59 Years (2,280 | 7.5%) for women.
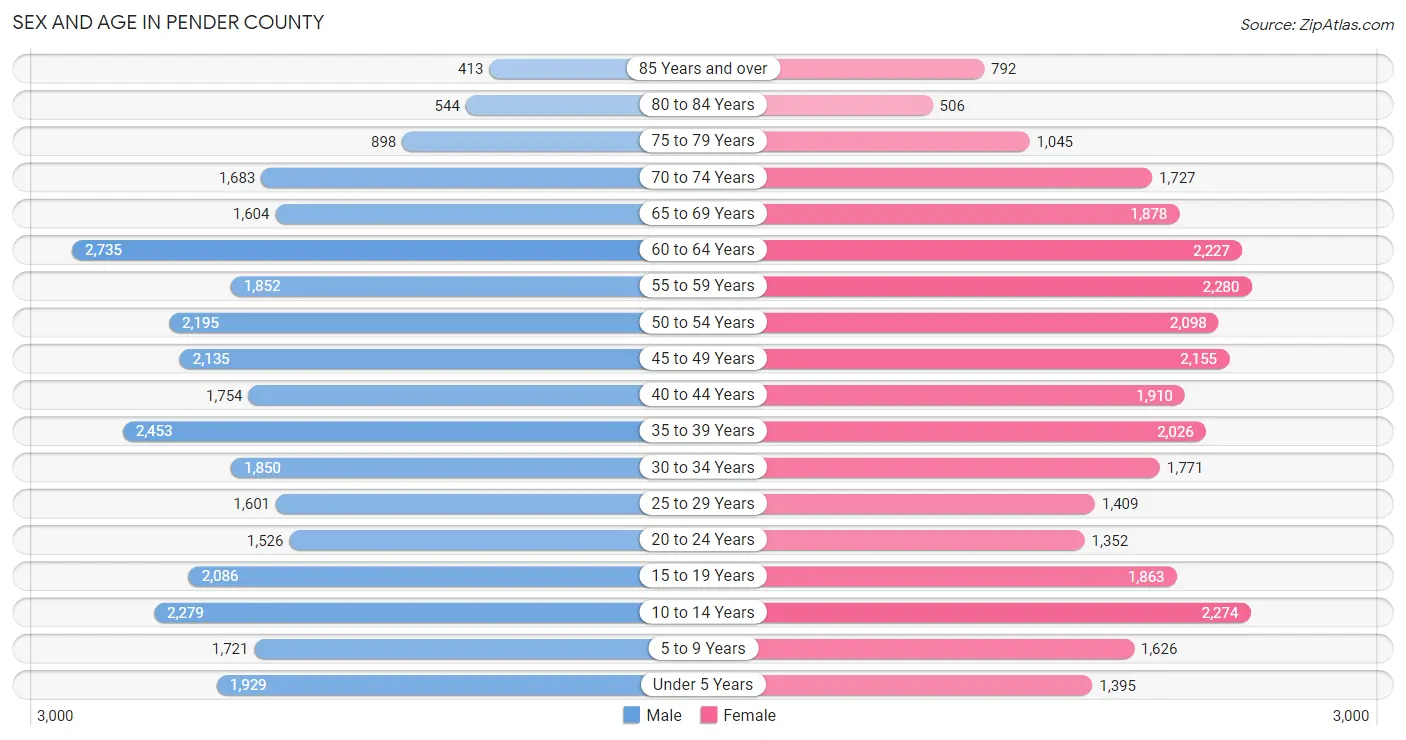
| Age Bracket | Male | Female |
| Under 5 Years | 1,929 (6.2%) | 1,395 (4.6%) |
| 5 to 9 Years | 1,721 (5.5%) | 1,626 (5.4%) |
| 10 to 14 Years | 2,279 (7.3%) | 2,274 (7.5%) |
| 15 to 19 Years | 2,086 (6.7%) | 1,863 (6.1%) |
| 20 to 24 Years | 1,526 (4.9%) | 1,352 (4.5%) |
| 25 to 29 Years | 1,601 (5.1%) | 1,409 (4.6%) |
| 30 to 34 Years | 1,850 (5.9%) | 1,771 (5.8%) |
| 35 to 39 Years | 2,453 (7.9%) | 2,026 (6.7%) |
| 40 to 44 Years | 1,754 (5.6%) | 1,910 (6.3%) |
| 45 to 49 Years | 2,135 (6.8%) | 2,155 (7.1%) |
| 50 to 54 Years | 2,195 (7.0%) | 2,098 (6.9%) |
| 55 to 59 Years | 1,852 (5.9%) | 2,280 (7.5%) |
| 60 to 64 Years | 2,735 (8.7%) | 2,227 (7.3%) |
| 65 to 69 Years | 1,604 (5.1%) | 1,878 (6.2%) |
| 70 to 74 Years | 1,683 (5.4%) | 1,727 (5.7%) |
| 75 to 79 Years | 898 (2.9%) | 1,045 (3.4%) |
| 80 to 84 Years | 544 (1.7%) | 506 (1.7%) |
| 85 Years and over | 413 (1.3%) | 792 (2.6%) |
| Total | 31,258 (100.0%) | 30,334 (100.0%) |
Families and Households in Pender County
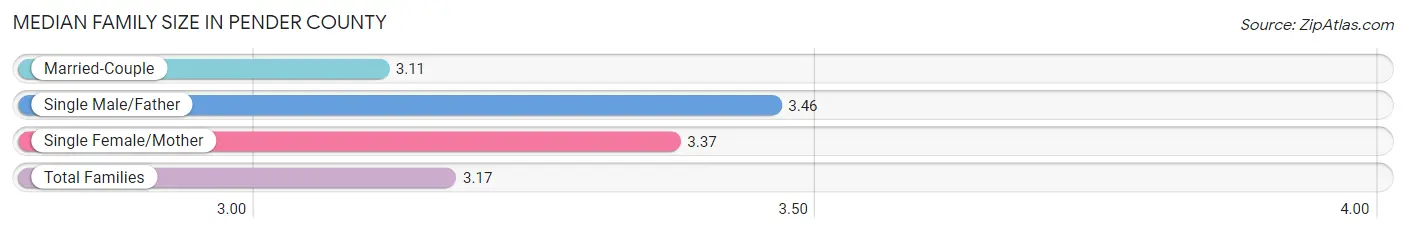
Median Family Size in Pender County
The median family size in Pender County is 3.17 persons per family, with single male/father families (904 | 5.7%) accounting for the largest median family size of 3.46 persons per family. On the other hand, married-couple families (12,731 | 80.1%) represent the smallest median family size with 3.11 persons per family.
| Family Type | # Families | Family Size |
| Married-Couple | 12,731 (80.1%) | 3.11 |
| Single Male/Father | 904 (5.7%) | 3.46 |
| Single Female/Mother | 2,261 (14.2%) | 3.37 |
| Total Families | 15,896 (100.0%) | 3.17 |
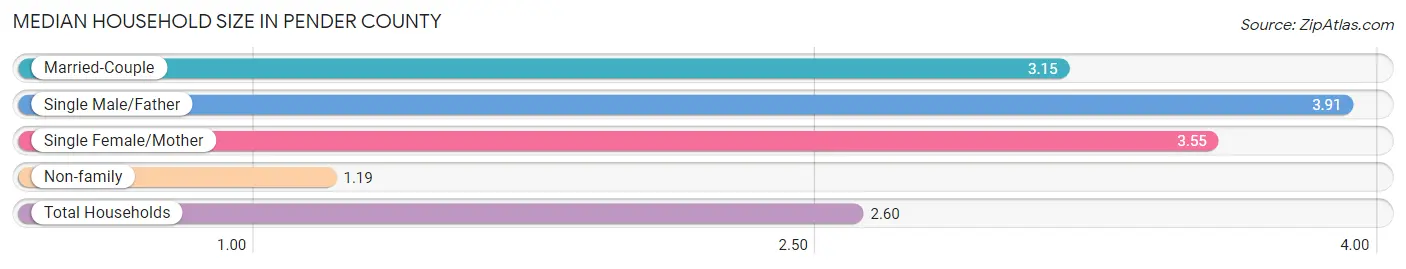
Median Household Size in Pender County
The median household size in Pender County is 2.60 persons per household, with single male/father households (904 | 3.9%) accounting for the largest median household size of 3.91 persons per household. non-family households (7,362 | 31.7%) represent the smallest median household size with 1.19 persons per household.
| Household Type | # Households | Household Size |
| Married-Couple | 12,731 (54.7%) | 3.15 |
| Single Male/Father | 904 (3.9%) | 3.91 |
| Single Female/Mother | 2,261 (9.7%) | 3.55 |
| Non-family | 7,362 (31.7%) | 1.19 |
| Total Households | 23,258 (100.0%) | 2.60 |
Household Size by Marriage Status in Pender County
Out of a total of 23,258 households in Pender County, 15,896 (68.3%) are family households, while 7,362 (31.7%) are nonfamily households. The most numerous type of family households are 2-person households, comprising 7,250, and the most common type of nonfamily households are 1-person households, comprising 6,250.
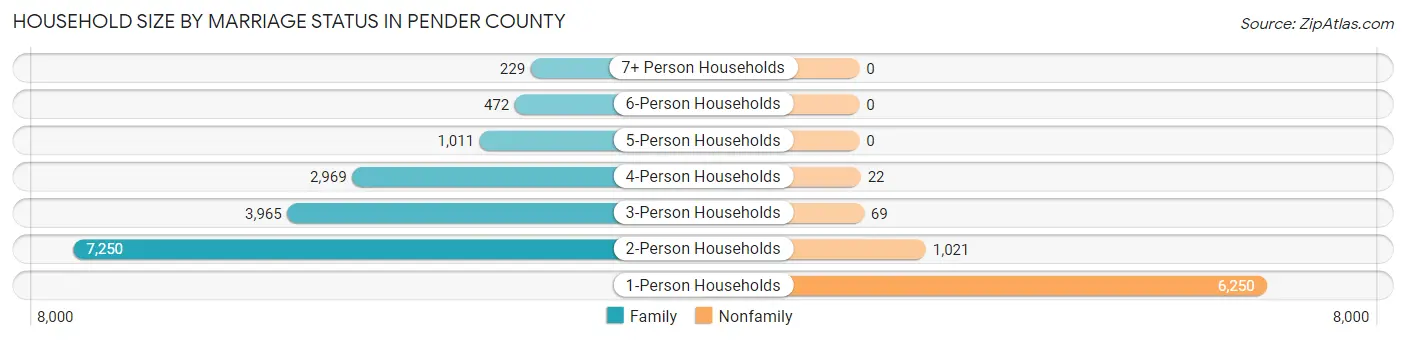
| Household Size | Family Households | Nonfamily Households |
| 1-Person Households | - | 6,250 (26.9%) |
| 2-Person Households | 7,250 (31.2%) | 1,021 (4.4%) |
| 3-Person Households | 3,965 (17.1%) | 69 (0.3%) |
| 4-Person Households | 2,969 (12.8%) | 22 (0.1%) |
| 5-Person Households | 1,011 (4.3%) | 0 (0.0%) |
| 6-Person Households | 472 (2.0%) | 0 (0.0%) |
| 7+ Person Households | 229 (1.0%) | 0 (0.0%) |
| Total | 15,896 (68.3%) | 7,362 (31.7%) |
Female Fertility in Pender County
Fertility by Age in Pender County
Average fertility rate in Pender County is 63.0 births per 1,000 women. Women in the age bracket of 20 to 34 years have the highest fertility rate with 101.0 births per 1,000 women. Women in the age bracket of 20 to 34 years acount for 55.5% of all women with births.
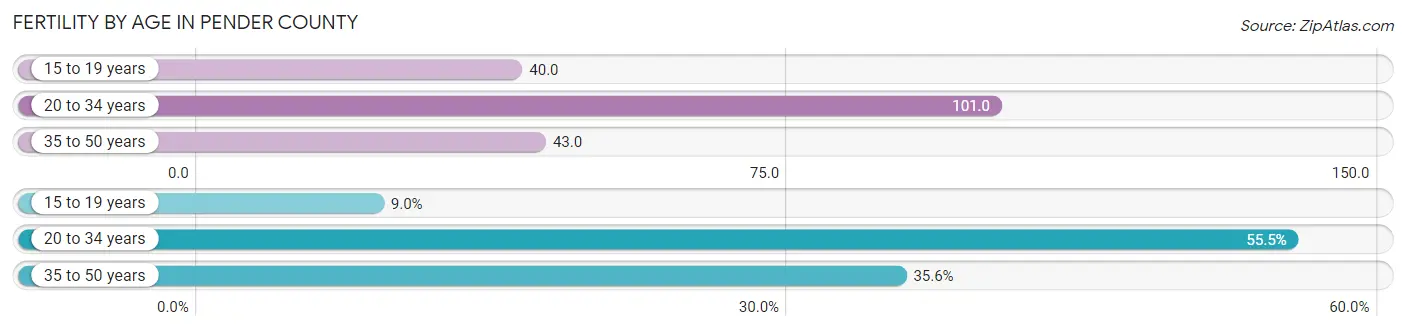
| Age Bracket | Women with Births | Births / 1,000 Women |
| 15 to 19 years | 74 (8.9%) | 40.0 |
| 20 to 34 years | 459 (55.5%) | 101.0 |
| 35 to 50 years | 294 (35.5%) | 43.0 |
| Total | 827 (100.0%) | 63.0 |
Fertility by Age by Marriage Status in Pender County
52.6% of women with births (827) in Pender County are married. The highest percentage of unmarried women with births falls into 15 to 19 years age bracket with 100.0% of them unmarried at the time of birth, while the lowest percentage of unmarried women with births belong to 35 to 50 years age bracket with 15.3% of them unmarried.
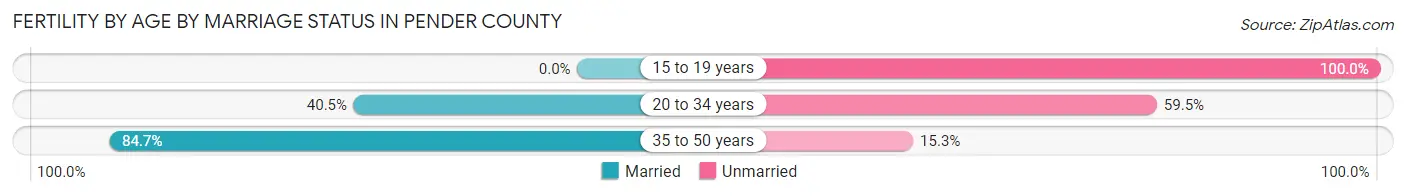
| Age Bracket | Married | Unmarried |
| 15 to 19 years | 0 (0.0%) | 74 (100.0%) |
| 20 to 34 years | 186 (40.5%) | 273 (59.5%) |
| 35 to 50 years | 249 (84.7%) | 45 (15.3%) |
| Total | 435 (52.6%) | 392 (47.4%) |
Fertility by Education in Pender County
Average fertility rate in Pender County is 63.0 births per 1,000 women. Women with the education attainment of high school diploma have the highest fertility rate of 123.0 births per 1,000 women, while women with the education attainment of less than high school have the lowest fertility at 19.0 births per 1,000 women. Women with the education attainment of high school diploma represent 40.4% of all women with births.
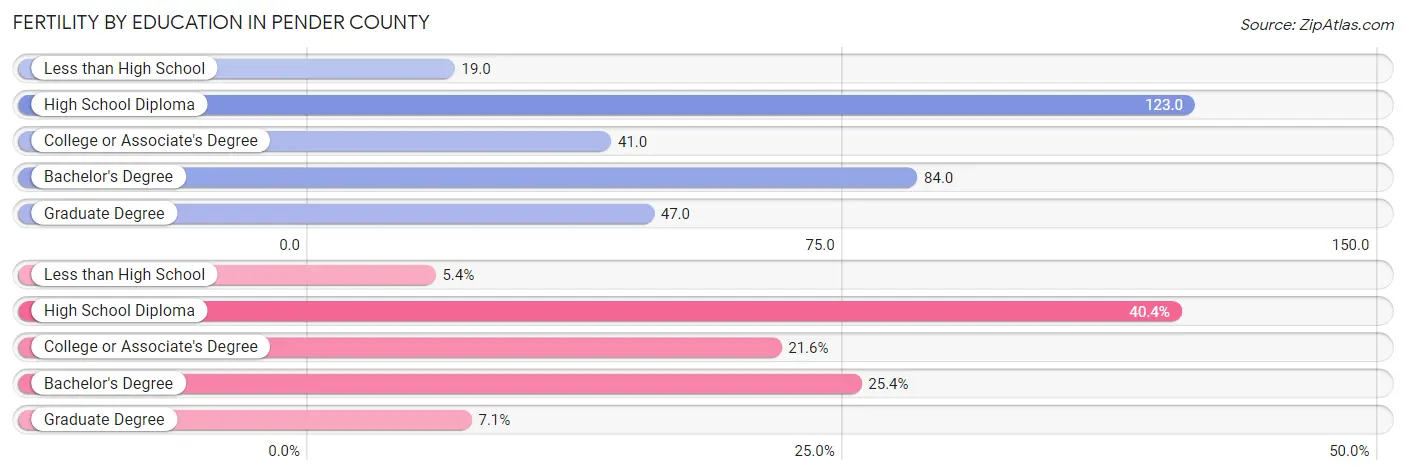
| Educational Attainment | Women with Births | Births / 1,000 Women |
| Less than High School | 45 (5.4%) | 19.0 |
| High School Diploma | 334 (40.4%) | 123.0 |
| College or Associate's Degree | 179 (21.6%) | 41.0 |
| Bachelor's Degree | 210 (25.4%) | 84.0 |
| Graduate Degree | 59 (7.1%) | 47.0 |
| Total | 827 (100.0%) | 63.0 |
Fertility by Education by Marriage Status in Pender County
47.4% of women with births in Pender County are unmarried. Women with the educational attainment of bachelor's degree are most likely to be married with 100.0% of them married at childbirth, while women with the educational attainment of less than high school are least likely to be married with 100.0% of them unmarried at childbirth.
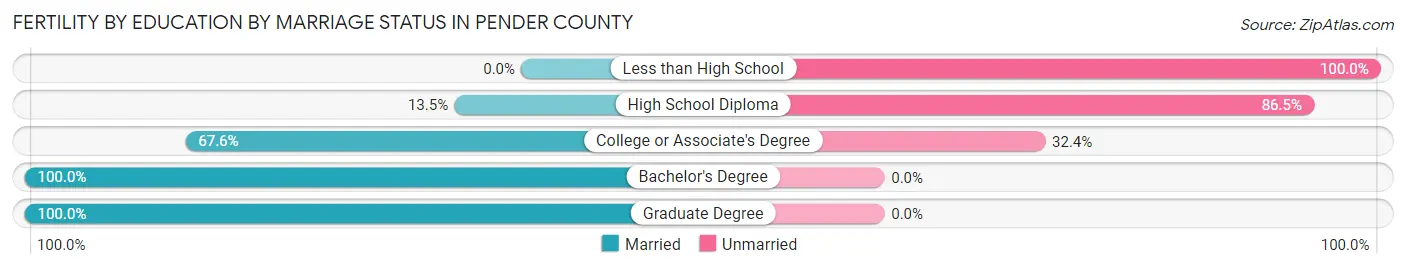
| Educational Attainment | Married | Unmarried |
| Less than High School | 0 (0.0%) | 45 (100.0%) |
| High School Diploma | 45 (13.5%) | 289 (86.5%) |
| College or Associate's Degree | 121 (67.6%) | 58 (32.4%) |
| Bachelor's Degree | 210 (100.0%) | 0 (0.0%) |
| Graduate Degree | 59 (100.0%) | 0 (0.0%) |
| Total | 435 (52.6%) | 392 (47.4%) |
Employment Characteristics in Pender County
Employment by Class of Employer in Pender County
Among the 27,872 employed individuals in Pender County, private company employees (17,024 | 61.1%), local government employees (2,263 | 8.1%), and self-employed (not incorporated) (1,971 | 7.1%) make up the most common classes of employment.
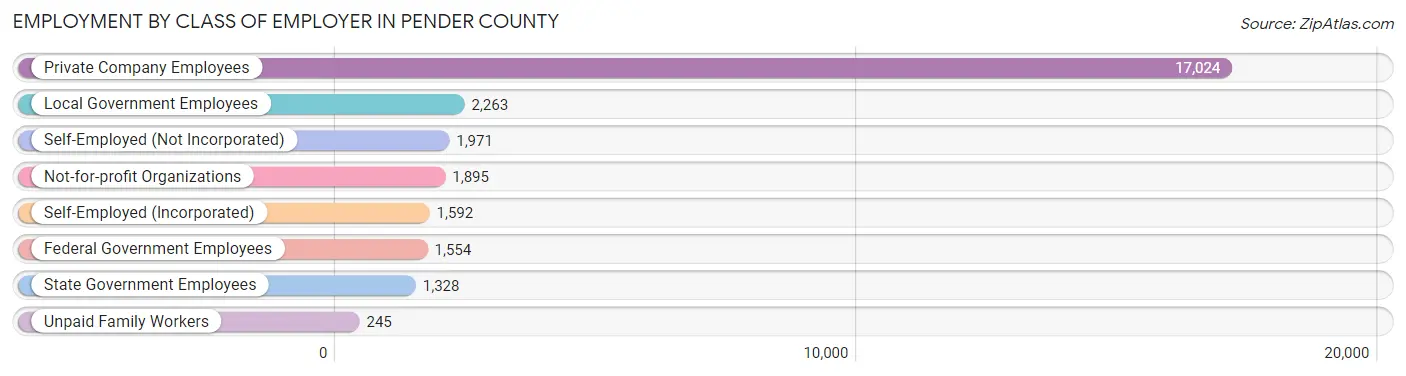
| Employer Class | # Employees | % Employees |
| Private Company Employees | 17,024 | 61.1% |
| Self-Employed (Incorporated) | 1,592 | 5.7% |
| Self-Employed (Not Incorporated) | 1,971 | 7.1% |
| Not-for-profit Organizations | 1,895 | 6.8% |
| Local Government Employees | 2,263 | 8.1% |
| State Government Employees | 1,328 | 4.8% |
| Federal Government Employees | 1,554 | 5.6% |
| Unpaid Family Workers | 245 | 0.9% |
| Total | 27,872 | 100.0% |
Employment Status by Age in Pender County
According to the labor force statistics for Pender County, out of the total population over 16 years of age (49,752), 60.5% or 30,100 individuals are in the labor force, with 6.4% or 1,926 of them unemployed. The age group with the highest labor force participation rate is 25 to 29 years, with 84.2% or 2,534 individuals in the labor force. Within the labor force, the 16 to 19 years age range has the highest percentage of unemployed individuals, with 31.6% or 467 of them being unemployed.
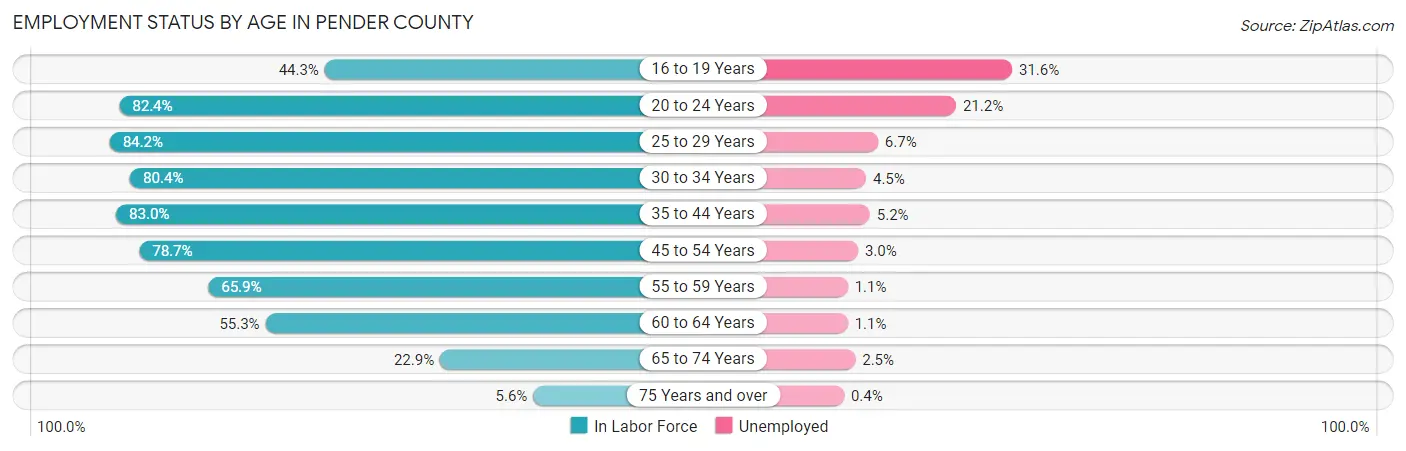
| Age Bracket | In Labor Force | Unemployed |
| 16 to 19 Years | 1,477 (44.3%) | 467 (31.6%) |
| 20 to 24 Years | 2,371 (82.4%) | 503 (21.2%) |
| 25 to 29 Years | 2,534 (84.2%) | 170 (6.7%) |
| 30 to 34 Years | 2,911 (80.4%) | 131 (4.5%) |
| 35 to 44 Years | 6,759 (83.0%) | 351 (5.2%) |
| 45 to 54 Years | 6,755 (78.7%) | 203 (3.0%) |
| 55 to 59 Years | 2,723 (65.9%) | 30 (1.1%) |
| 60 to 64 Years | 2,744 (55.3%) | 30 (1.1%) |
| 65 to 74 Years | 1,578 (22.9%) | 39 (2.5%) |
| 75 Years and over | 235 (5.6%) | 1 (0.4%) |
| Total | 30,100 (60.5%) | 1,926 (6.4%) |
Employment Status by Educational Attainment in Pender County
According to labor force statistics for Pender County, 75.3% of individuals (24,436) out of the total population between 25 and 64 years of age (32,451) are in the labor force, with 3.7% or 904 of them being unemployed. The group with the highest labor force participation rate are those with the educational attainment of bachelor's degree or higher, with 83.1% or 7,954 individuals in the labor force. Within the labor force, individuals with less than high school education have the highest percentage of unemployment, with 5.7% or 88 of them being unemployed.
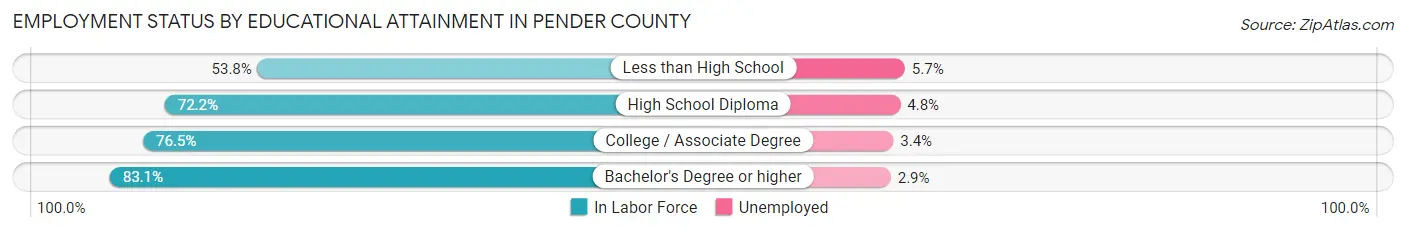
| Educational Attainment | In Labor Force | Unemployed |
| Less than High School | 1,537 (53.8%) | 163 (5.7%) |
| High School Diploma | 6,322 (72.2%) | 420 (4.8%) |
| College / Associate Degree | 8,619 (76.5%) | 383 (3.4%) |
| Bachelor's Degree or higher | 7,954 (83.1%) | 278 (2.9%) |
| Total | 24,436 (75.3%) | 1,201 (3.7%) |
Employment Occupations by Sex in Pender County
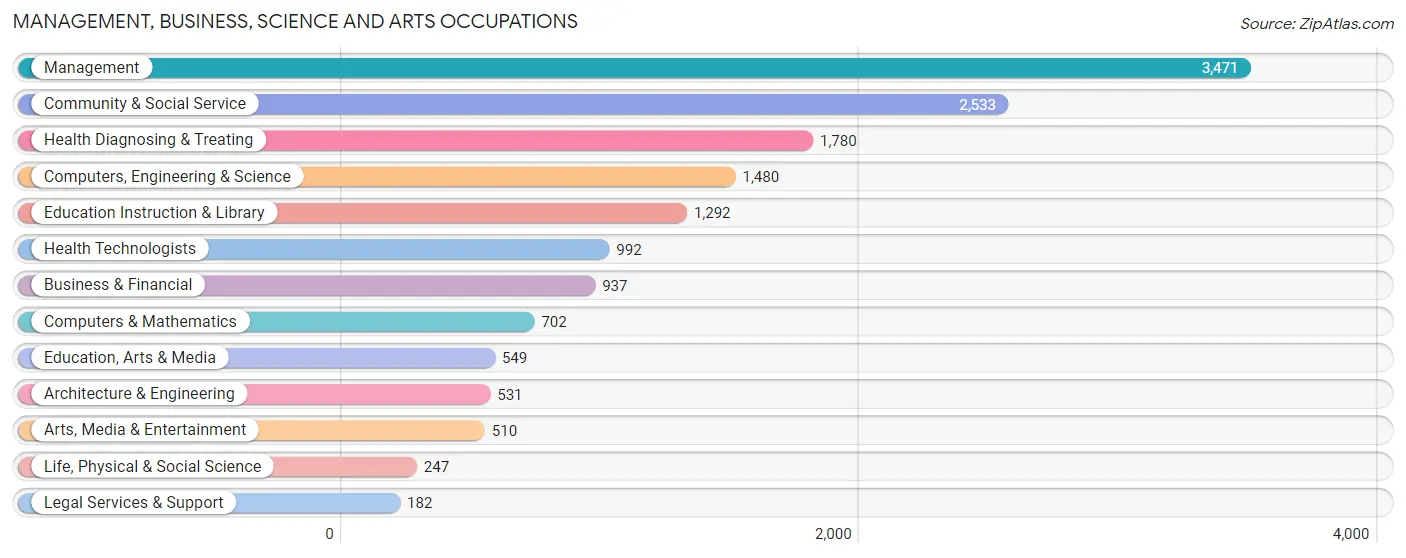
Management, Business, Science and Arts Occupations
The most common Management, Business, Science and Arts occupations in Pender County are Management (3,471 | 12.5%), Community & Social Service (2,533 | 9.1%), Health Diagnosing & Treating (1,780 | 6.4%), Computers, Engineering & Science (1,480 | 5.3%), and Education Instruction & Library (1,292 | 4.7%).
Management, Business, Science and Arts Occupations by Sex
Within the Management, Business, Science and Arts occupations in Pender County, the most male-oriented occupations are Architecture & Engineering (93.4%), Computers, Engineering & Science (72.9%), and Computers & Mathematics (66.8%), while the most female-oriented occupations are Legal Services & Support (89.6%), Health Technologists (87.5%), and Health Diagnosing & Treating (87.4%).
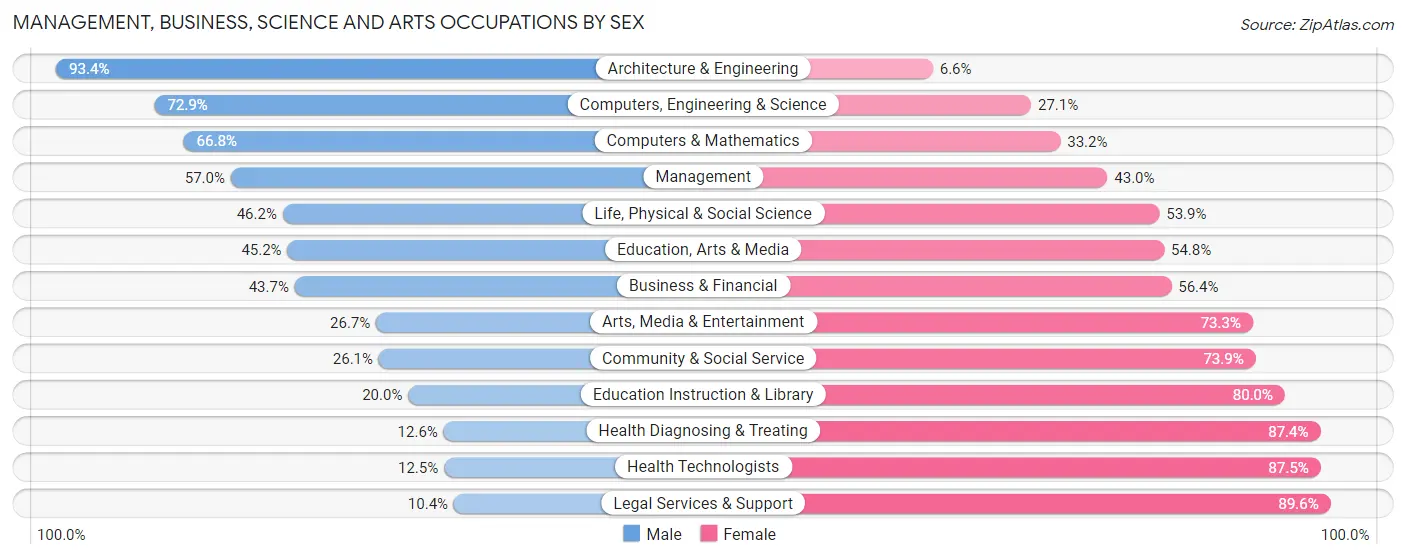
| Occupation | Male | Female |
| Management | 1,978 (57.0%) | 1,493 (43.0%) |
| Business & Financial | 409 (43.6%) | 528 (56.4%) |
| Computers, Engineering & Science | 1,079 (72.9%) | 401 (27.1%) |
| Computers & Mathematics | 469 (66.8%) | 233 (33.2%) |
| Architecture & Engineering | 496 (93.4%) | 35 (6.6%) |
| Life, Physical & Social Science | 114 (46.2%) | 133 (53.8%) |
| Community & Social Service | 661 (26.1%) | 1,872 (73.9%) |
| Education, Arts & Media | 248 (45.2%) | 301 (54.8%) |
| Legal Services & Support | 19 (10.4%) | 163 (89.6%) |
| Education Instruction & Library | 258 (20.0%) | 1,034 (80.0%) |
| Arts, Media & Entertainment | 136 (26.7%) | 374 (73.3%) |
| Health Diagnosing & Treating | 224 (12.6%) | 1,556 (87.4%) |
| Health Technologists | 124 (12.5%) | 868 (87.5%) |
| Total (Category) | 4,351 (42.6%) | 5,850 (57.4%) |
| Total (Overall) | 14,630 (52.7%) | 13,107 (47.2%) |
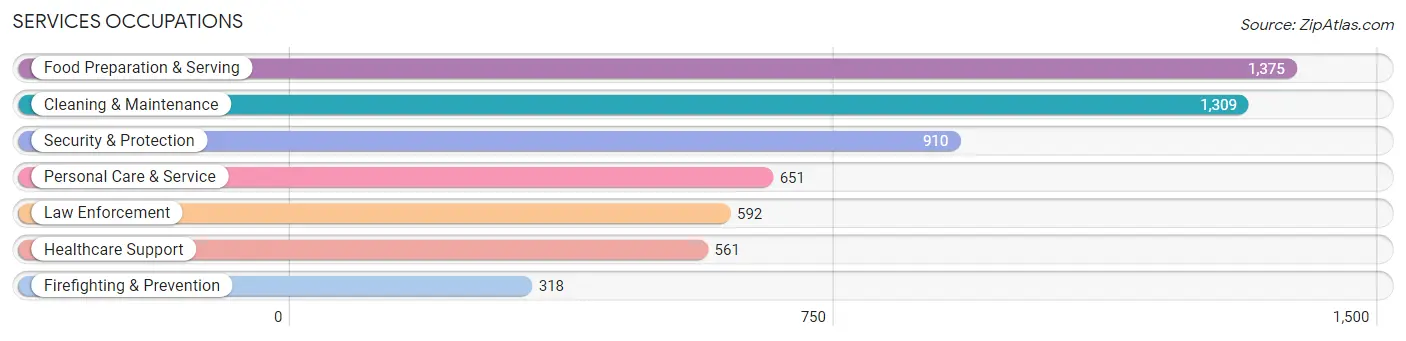
Services Occupations
The most common Services occupations in Pender County are Food Preparation & Serving (1,375 | 5.0%), Cleaning & Maintenance (1,309 | 4.7%), Security & Protection (910 | 3.3%), Personal Care & Service (651 | 2.4%), and Law Enforcement (592 | 2.1%).
Services Occupations by Sex
Within the Services occupations in Pender County, the most male-oriented occupations are Firefighting & Prevention (86.5%), Security & Protection (85.9%), and Law Enforcement (85.6%), while the most female-oriented occupations are Healthcare Support (85.6%), Personal Care & Service (81.9%), and Food Preparation & Serving (65.0%).
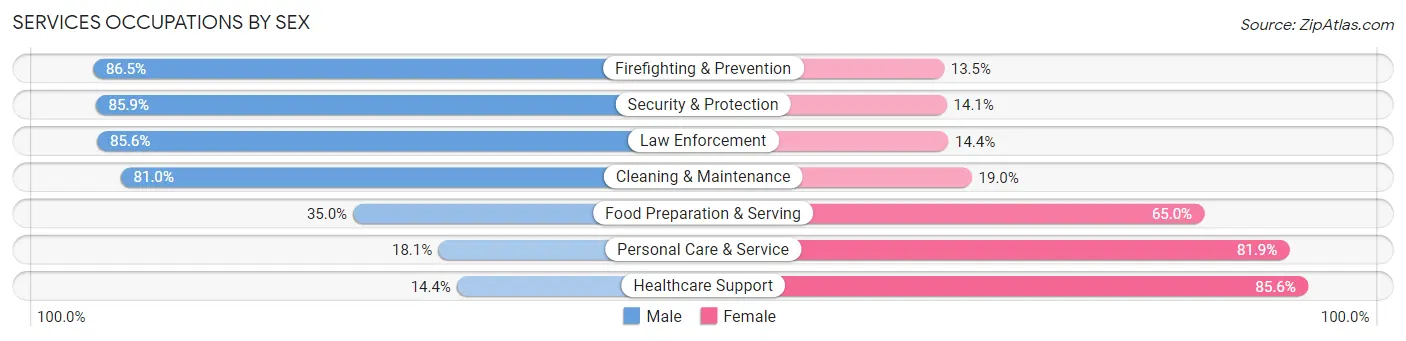
| Occupation | Male | Female |
| Healthcare Support | 81 (14.4%) | 480 (85.6%) |
| Security & Protection | 782 (85.9%) | 128 (14.1%) |
| Firefighting & Prevention | 275 (86.5%) | 43 (13.5%) |
| Law Enforcement | 507 (85.6%) | 85 (14.4%) |
| Food Preparation & Serving | 481 (35.0%) | 894 (65.0%) |
| Cleaning & Maintenance | 1,060 (81.0%) | 249 (19.0%) |
| Personal Care & Service | 118 (18.1%) | 533 (81.9%) |
| Total (Category) | 2,522 (52.5%) | 2,284 (47.5%) |
| Total (Overall) | 14,630 (52.7%) | 13,107 (47.2%) |
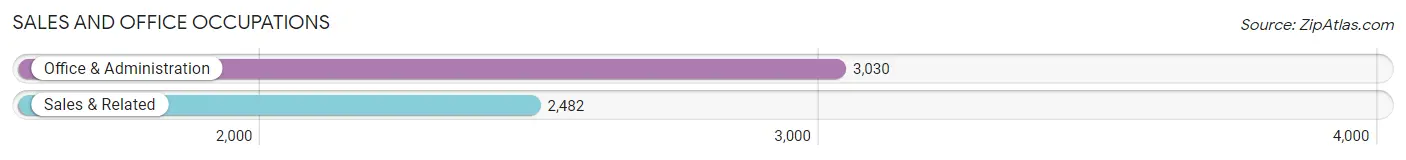
Sales and Office Occupations
The most common Sales and Office occupations in Pender County are Office & Administration (3,030 | 10.9%), and Sales & Related (2,482 | 8.9%).
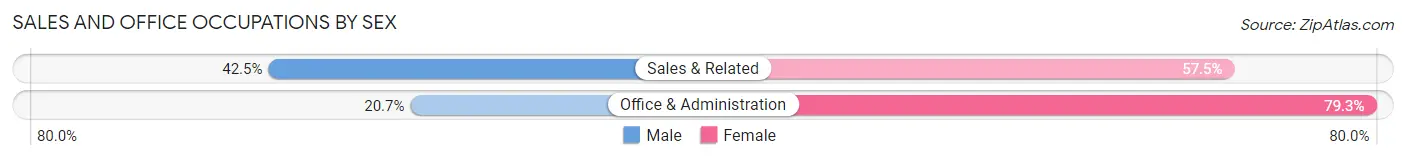
Sales and Office Occupations by Sex
| Occupation | Male | Female |
| Sales & Related | 1,055 (42.5%) | 1,427 (57.5%) |
| Office & Administration | 626 (20.7%) | 2,404 (79.3%) |
| Total (Category) | 1,681 (30.5%) | 3,831 (69.5%) |
| Total (Overall) | 14,630 (52.7%) | 13,107 (47.2%) |
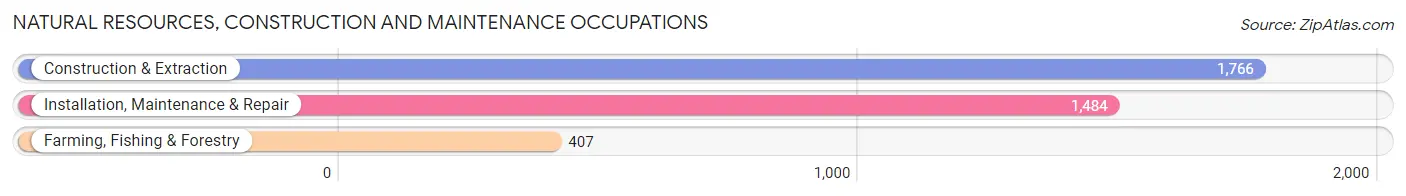
Natural Resources, Construction and Maintenance Occupations
The most common Natural Resources, Construction and Maintenance occupations in Pender County are Construction & Extraction (1,766 | 6.4%), Installation, Maintenance & Repair (1,484 | 5.3%), and Farming, Fishing & Forestry (407 | 1.5%).
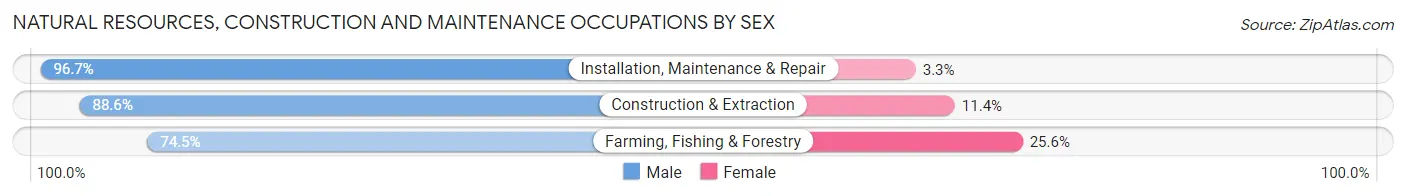
Natural Resources, Construction and Maintenance Occupations by Sex
| Occupation | Male | Female |
| Farming, Fishing & Forestry | 303 (74.5%) | 104 (25.6%) |
| Construction & Extraction | 1,564 (88.6%) | 202 (11.4%) |
| Installation, Maintenance & Repair | 1,435 (96.7%) | 49 (3.3%) |
| Total (Category) | 3,302 (90.3%) | 355 (9.7%) |
| Total (Overall) | 14,630 (52.7%) | 13,107 (47.2%) |
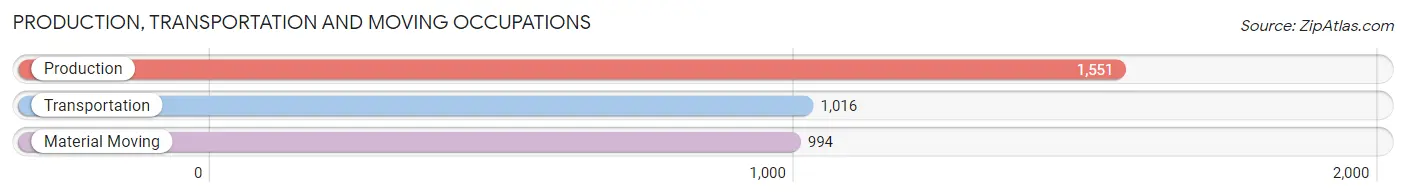
Production, Transportation and Moving Occupations
The most common Production, Transportation and Moving occupations in Pender County are Production (1,551 | 5.6%), Transportation (1,016 | 3.7%), and Material Moving (994 | 3.6%).
Production, Transportation and Moving Occupations by Sex
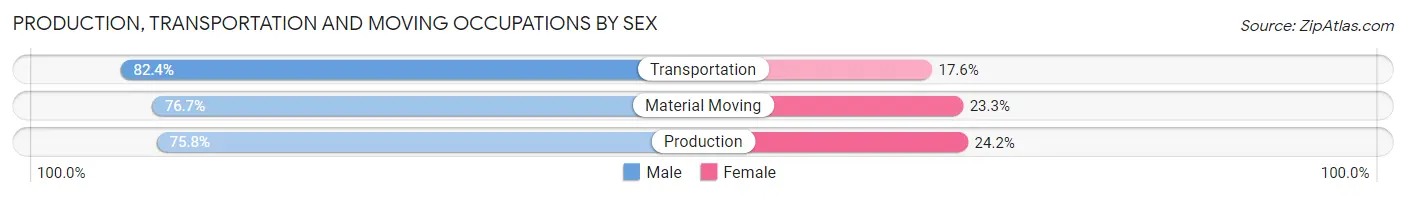
| Occupation | Male | Female |
| Production | 1,175 (75.8%) | 376 (24.2%) |
| Transportation | 837 (82.4%) | 179 (17.6%) |
| Material Moving | 762 (76.7%) | 232 (23.3%) |
| Total (Category) | 2,774 (77.9%) | 787 (22.1%) |
| Total (Overall) | 14,630 (52.7%) | 13,107 (47.2%) |
Employment Industries by Sex in Pender County
Employment Industries in Pender County
The major employment industries in Pender County include Retail Trade (3,340 | 12.0%), Health Care & Social Assistance (3,308 | 11.9%), Construction (2,995 | 10.8%), Educational Services (2,191 | 7.9%), and Manufacturing (2,180 | 7.9%).
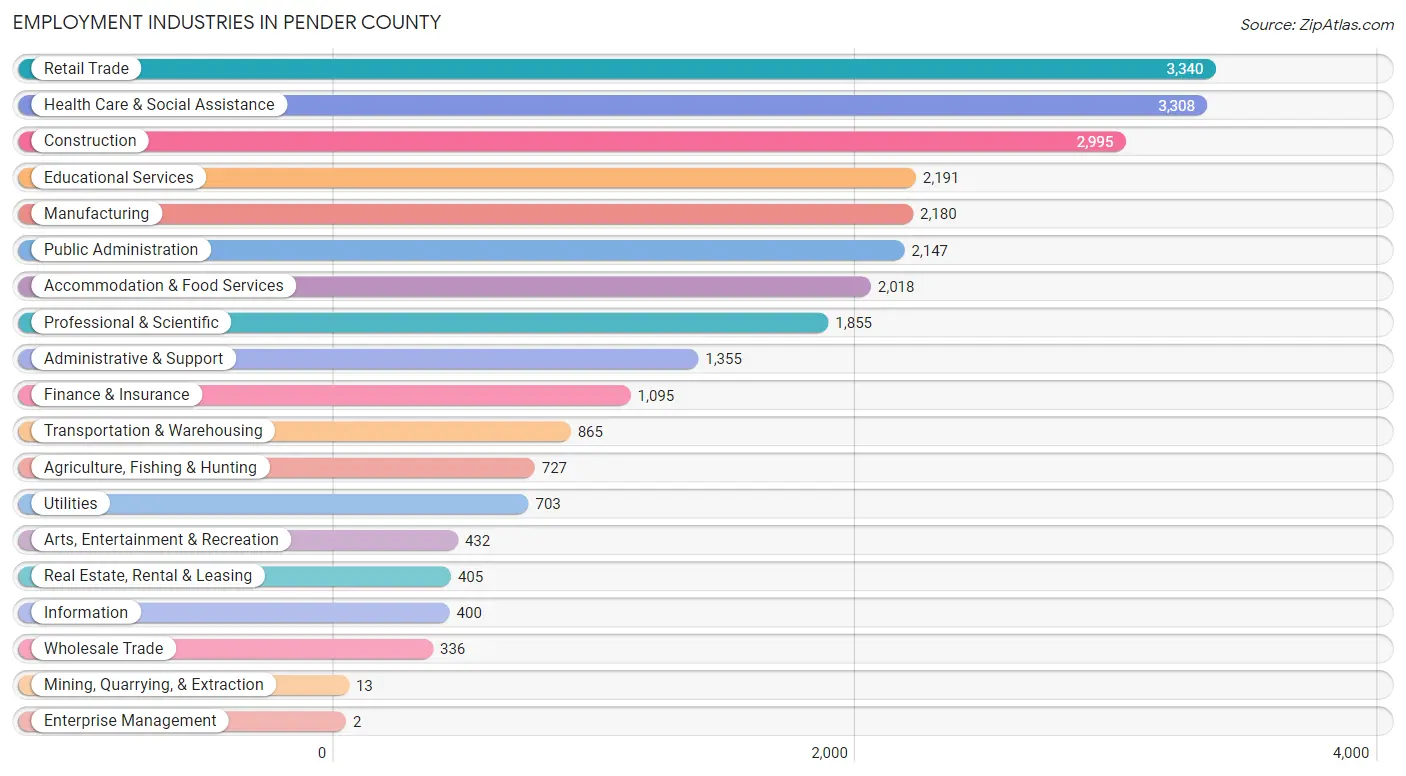
Employment Industries by Sex in Pender County
The Pender County industries that see more men than women are Utilities (86.9%), Construction (85.0%), and Administrative & Support (83.5%), whereas the industries that tend to have a higher number of women are Mining, Quarrying, & Extraction (100.0%), Enterprise Management (100.0%), and Health Care & Social Assistance (86.9%).
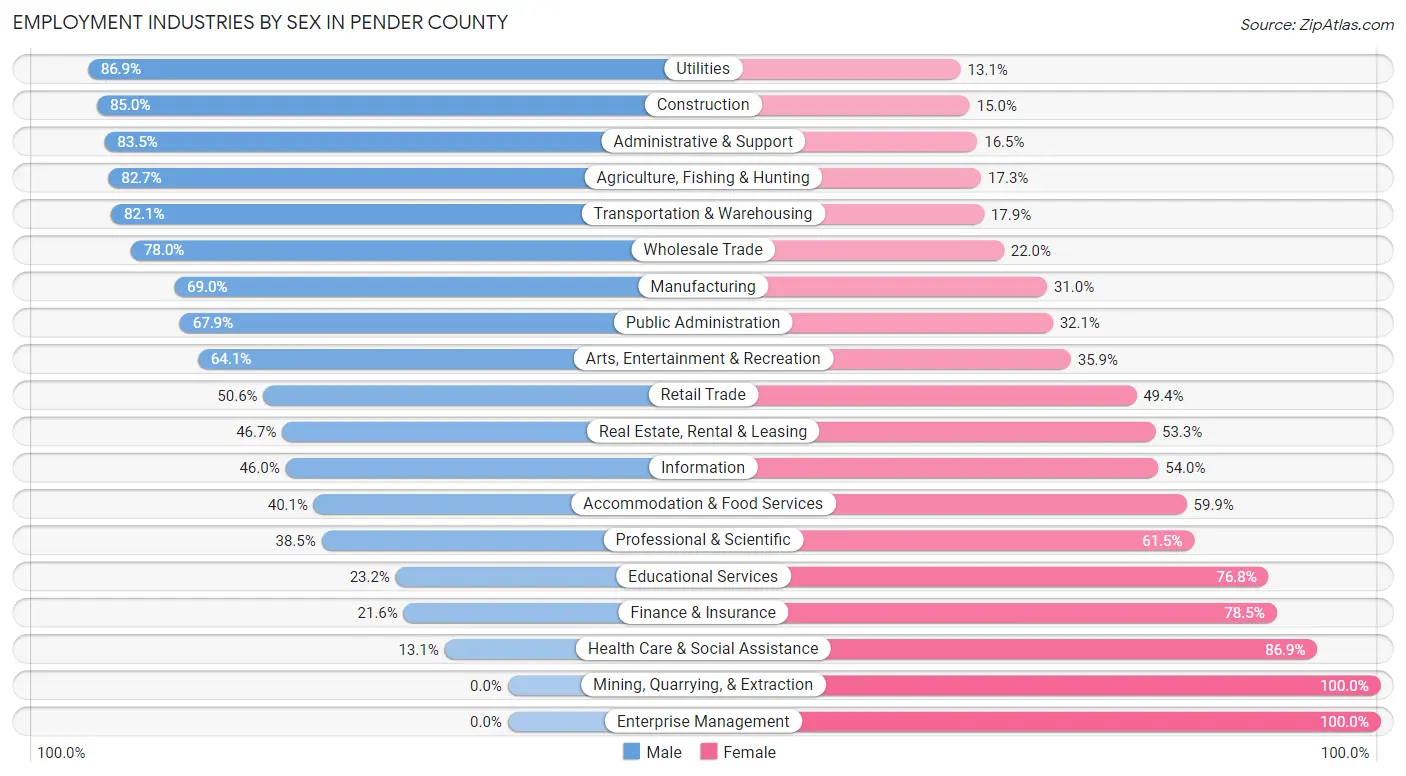
| Industry | Male | Female |
| Agriculture, Fishing & Hunting | 601 (82.7%) | 126 (17.3%) |
| Mining, Quarrying, & Extraction | 0 (0.0%) | 13 (100.0%) |
| Construction | 2,546 (85.0%) | 449 (15.0%) |
| Manufacturing | 1,505 (69.0%) | 675 (31.0%) |
| Wholesale Trade | 262 (78.0%) | 74 (22.0%) |
| Retail Trade | 1,689 (50.6%) | 1,651 (49.4%) |
| Transportation & Warehousing | 710 (82.1%) | 155 (17.9%) |
| Utilities | 611 (86.9%) | 92 (13.1%) |
| Information | 184 (46.0%) | 216 (54.0%) |
| Finance & Insurance | 236 (21.5%) | 859 (78.4%) |
| Real Estate, Rental & Leasing | 189 (46.7%) | 216 (53.3%) |
| Professional & Scientific | 715 (38.5%) | 1,140 (61.5%) |
| Enterprise Management | 0 (0.0%) | 2 (100.0%) |
| Administrative & Support | 1,131 (83.5%) | 224 (16.5%) |
| Educational Services | 508 (23.2%) | 1,683 (76.8%) |
| Health Care & Social Assistance | 433 (13.1%) | 2,875 (86.9%) |
| Arts, Entertainment & Recreation | 277 (64.1%) | 155 (35.9%) |
| Accommodation & Food Services | 810 (40.1%) | 1,208 (59.9%) |
| Public Administration | 1,457 (67.9%) | 690 (32.1%) |
| Total | 14,630 (52.7%) | 13,107 (47.2%) |
Education in Pender County
School Enrollment in Pender County
The most common levels of schooling among the 14,060 students in Pender County are middle school (3,801 | 27.0%), high school (3,238 | 23.0%), and elementary school (2,613 | 18.6%).
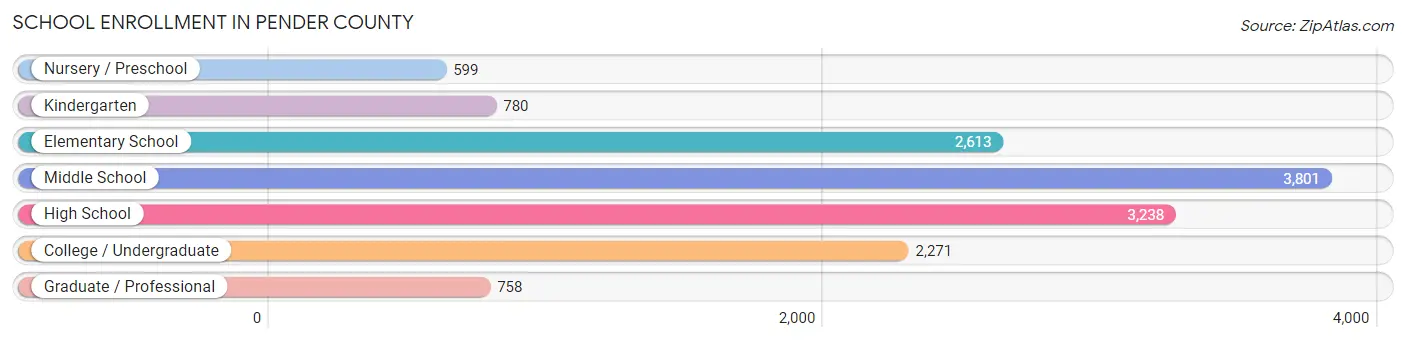
| School Level | # Students | % Students |
| Nursery / Preschool | 599 | 4.3% |
| Kindergarten | 780 | 5.6% |
| Elementary School | 2,613 | 18.6% |
| Middle School | 3,801 | 27.0% |
| High School | 3,238 | 23.0% |
| College / Undergraduate | 2,271 | 16.2% |
| Graduate / Professional | 758 | 5.4% |
| Total | 14,060 | 100.0% |
School Enrollment by Age by Funding Source in Pender County
Out of a total of 14,060 students who are enrolled in schools in Pender County, 1,814 (12.9%) attend a private institution, while the remaining 12,246 (87.1%) are enrolled in public schools. The age group of 3 to 4 year olds has the highest likelihood of being enrolled in private schools, with 255 (46.8% in the age bracket) enrolled. Conversely, the age group of 18 to 19 year olds has the lowest likelihood of being enrolled in a private school, with 1,119 (94.8% in the age bracket) attending a public institution.
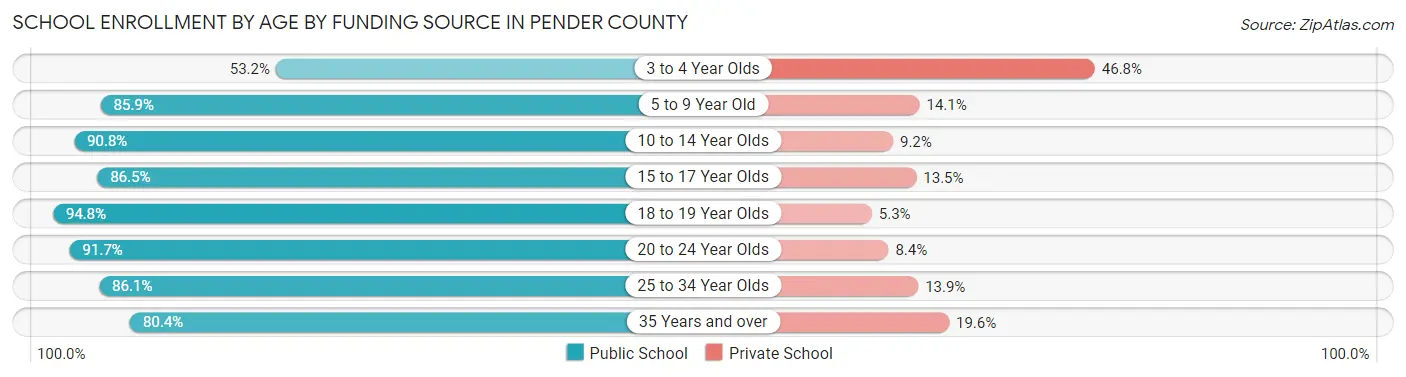
| Age Bracket | Public School | Private School |
| 3 to 4 Year Olds | 290 (53.2%) | 255 (46.8%) |
| 5 to 9 Year Old | 2,648 (85.9%) | 436 (14.1%) |
| 10 to 14 Year Olds | 4,127 (90.8%) | 418 (9.2%) |
| 15 to 17 Year Olds | 1,916 (86.5%) | 300 (13.5%) |
| 18 to 19 Year Olds | 1,119 (94.8%) | 62 (5.2%) |
| 20 to 24 Year Olds | 801 (91.6%) | 73 (8.4%) |
| 25 to 34 Year Olds | 614 (86.1%) | 99 (13.9%) |
| 35 Years and over | 725 (80.4%) | 177 (19.6%) |
| Total | 12,246 (87.1%) | 1,814 (12.9%) |
Educational Attainment by Field of Study in Pender County
Business (2,616 | 19.8%), education (1,753 | 13.3%), science & technology (1,265 | 9.6%), bio, nature & agricultural (1,097 | 8.3%), and arts & humanities (1,094 | 8.3%) are the most common fields of study among 13,230 individuals in Pender County who have obtained a bachelor's degree or higher.
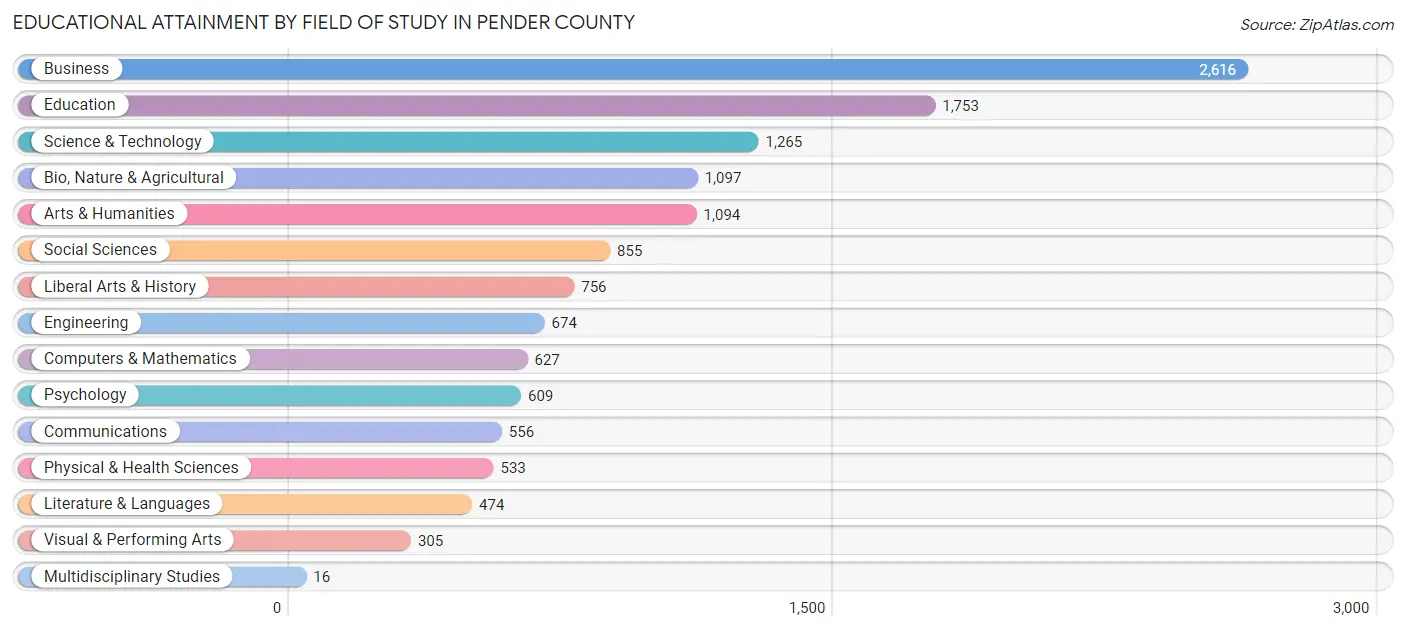
| Field of Study | # Graduates | % Graduates |
| Computers & Mathematics | 627 | 4.7% |
| Bio, Nature & Agricultural | 1,097 | 8.3% |
| Physical & Health Sciences | 533 | 4.0% |
| Psychology | 609 | 4.6% |
| Social Sciences | 855 | 6.5% |
| Engineering | 674 | 5.1% |
| Multidisciplinary Studies | 16 | 0.1% |
| Science & Technology | 1,265 | 9.6% |
| Business | 2,616 | 19.8% |
| Education | 1,753 | 13.3% |
| Literature & Languages | 474 | 3.6% |
| Liberal Arts & History | 756 | 5.7% |
| Visual & Performing Arts | 305 | 2.3% |
| Communications | 556 | 4.2% |
| Arts & Humanities | 1,094 | 8.3% |
| Total | 13,230 | 100.0% |
Transportation & Commute in Pender County
Vehicle Availability by Sex in Pender County
The most prevalent vehicle ownership categories in Pender County are males with 2 vehicles (5,740, accounting for 38.5%) and females with 2 vehicles (5,219, making up 44.4%).
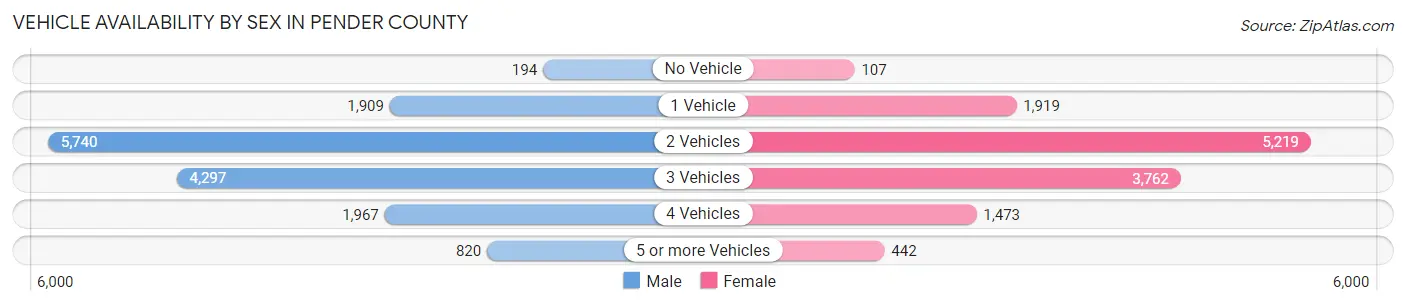
| Vehicles Available | Male | Female |
| No Vehicle | 194 (1.3%) | 107 (0.8%) |
| 1 Vehicle | 1,909 (12.8%) | 1,919 (14.8%) |
| 2 Vehicles | 5,740 (38.5%) | 5,219 (40.4%) |
| 3 Vehicles | 4,297 (28.8%) | 3,762 (29.1%) |
| 4 Vehicles | 1,967 (13.2%) | 1,473 (11.4%) |
| 5 or more Vehicles | 820 (5.5%) | 442 (3.4%) |
| Total | 14,927 (100.0%) | 12,922 (100.0%) |
Commute Time in Pender County
The most frequently occuring commute durations in Pender County are 30 to 34 minutes (4,046 commuters, 16.3%), 45 to 59 minutes (3,746 commuters, 15.0%), and 15 to 19 minutes (2,813 commuters, 11.3%).
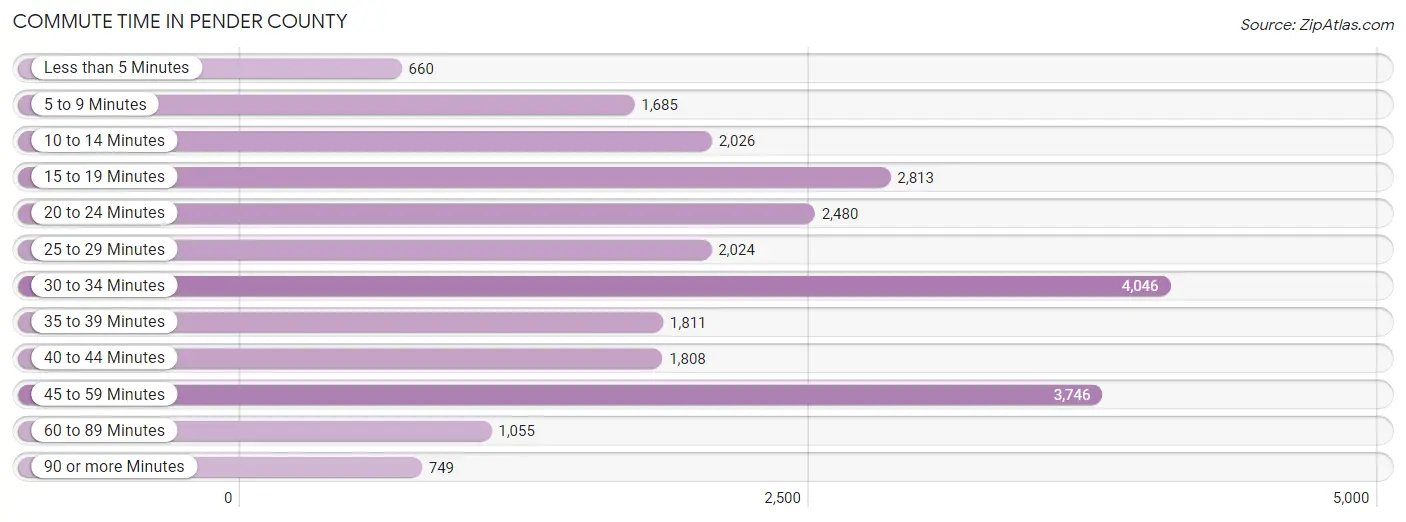
| Commute Time | # Commuters | % Commuters |
| Less than 5 Minutes | 660 | 2.6% |
| 5 to 9 Minutes | 1,685 | 6.8% |
| 10 to 14 Minutes | 2,026 | 8.1% |
| 15 to 19 Minutes | 2,813 | 11.3% |
| 20 to 24 Minutes | 2,480 | 10.0% |
| 25 to 29 Minutes | 2,024 | 8.1% |
| 30 to 34 Minutes | 4,046 | 16.3% |
| 35 to 39 Minutes | 1,811 | 7.3% |
| 40 to 44 Minutes | 1,808 | 7.3% |
| 45 to 59 Minutes | 3,746 | 15.0% |
| 60 to 89 Minutes | 1,055 | 4.2% |
| 90 or more Minutes | 749 | 3.0% |
Commute Time by Sex in Pender County
The most common commute times in Pender County are 30 to 34 minutes (2,244 commuters, 16.4%) for males and 45 to 59 minutes (2,033 commuters, 18.1%) for females.
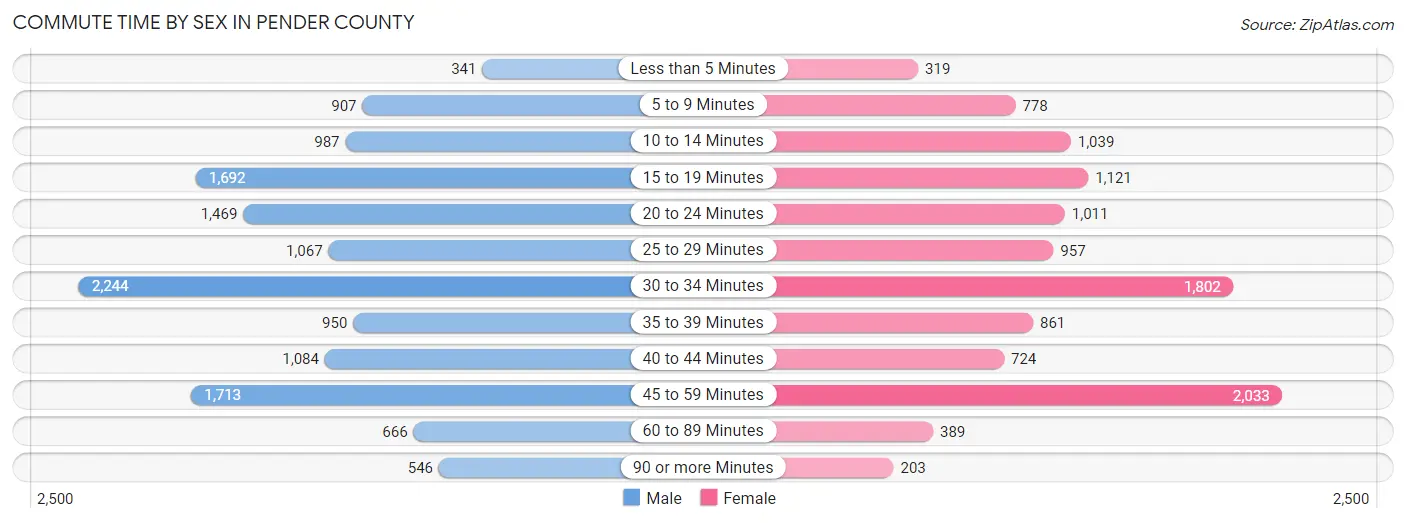
| Commute Time | Male | Female |
| Less than 5 Minutes | 341 (2.5%) | 319 (2.8%) |
| 5 to 9 Minutes | 907 (6.6%) | 778 (6.9%) |
| 10 to 14 Minutes | 987 (7.2%) | 1,039 (9.2%) |
| 15 to 19 Minutes | 1,692 (12.4%) | 1,121 (10.0%) |
| 20 to 24 Minutes | 1,469 (10.7%) | 1,011 (9.0%) |
| 25 to 29 Minutes | 1,067 (7.8%) | 957 (8.5%) |
| 30 to 34 Minutes | 2,244 (16.4%) | 1,802 (16.0%) |
| 35 to 39 Minutes | 950 (7.0%) | 861 (7.7%) |
| 40 to 44 Minutes | 1,084 (7.9%) | 724 (6.4%) |
| 45 to 59 Minutes | 1,713 (12.5%) | 2,033 (18.1%) |
| 60 to 89 Minutes | 666 (4.9%) | 389 (3.5%) |
| 90 or more Minutes | 546 (4.0%) | 203 (1.8%) |
Time of Departure to Work by Sex in Pender County
The most frequent times of departure to work in Pender County are 6:30 AM to 6:59 AM (2,366, 17.3%) for males and 7:00 AM to 7:29 AM (1,796, 16.0%) for females.
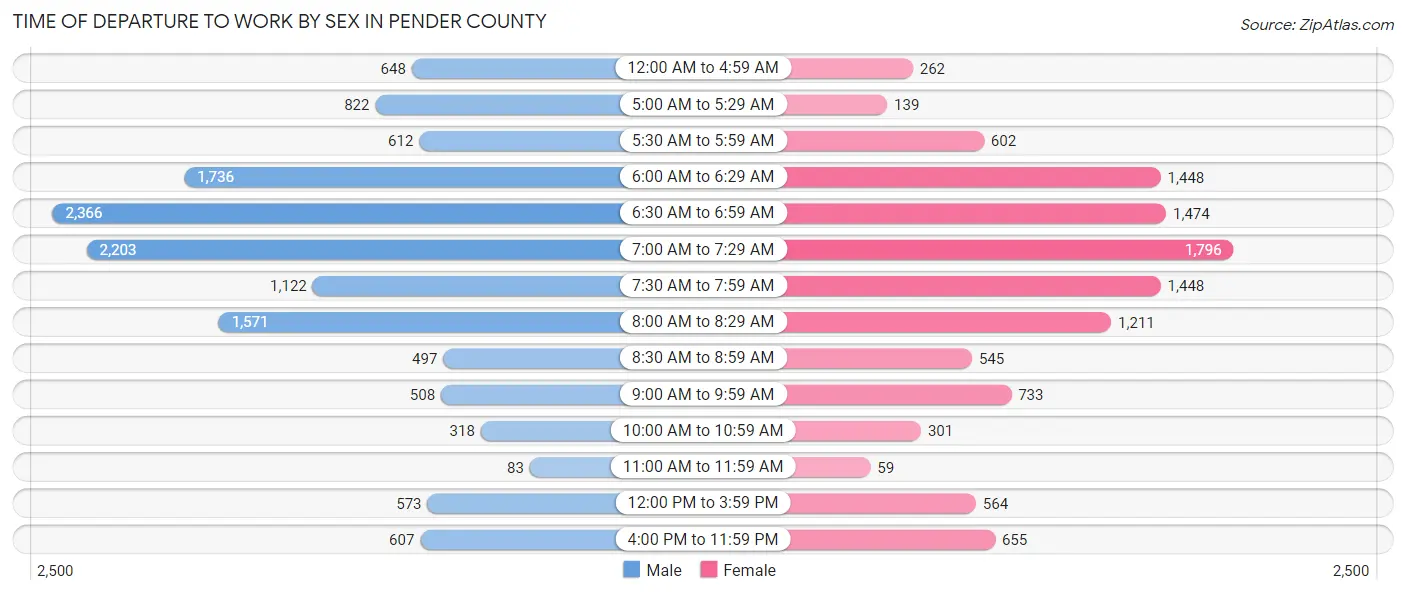
| Time of Departure | Male | Female |
| 12:00 AM to 4:59 AM | 648 (4.7%) | 262 (2.3%) |
| 5:00 AM to 5:29 AM | 822 (6.0%) | 139 (1.2%) |
| 5:30 AM to 5:59 AM | 612 (4.5%) | 602 (5.4%) |
| 6:00 AM to 6:29 AM | 1,736 (12.7%) | 1,448 (12.9%) |
| 6:30 AM to 6:59 AM | 2,366 (17.3%) | 1,474 (13.1%) |
| 7:00 AM to 7:29 AM | 2,203 (16.1%) | 1,796 (16.0%) |
| 7:30 AM to 7:59 AM | 1,122 (8.2%) | 1,448 (12.9%) |
| 8:00 AM to 8:29 AM | 1,571 (11.5%) | 1,211 (10.8%) |
| 8:30 AM to 8:59 AM | 497 (3.6%) | 545 (4.9%) |
| 9:00 AM to 9:59 AM | 508 (3.7%) | 733 (6.5%) |
| 10:00 AM to 10:59 AM | 318 (2.3%) | 301 (2.7%) |
| 11:00 AM to 11:59 AM | 83 (0.6%) | 59 (0.5%) |
| 12:00 PM to 3:59 PM | 573 (4.2%) | 564 (5.0%) |
| 4:00 PM to 11:59 PM | 607 (4.4%) | 655 (5.8%) |
| Total | 13,666 (100.0%) | 11,237 (100.0%) |
Housing Occupancy in Pender County
Occupancy by Ownership in Pender County
Of the total 23,258 dwellings in Pender County, owner-occupied units account for 19,143 (82.3%), while renter-occupied units make up 4,115 (17.7%).
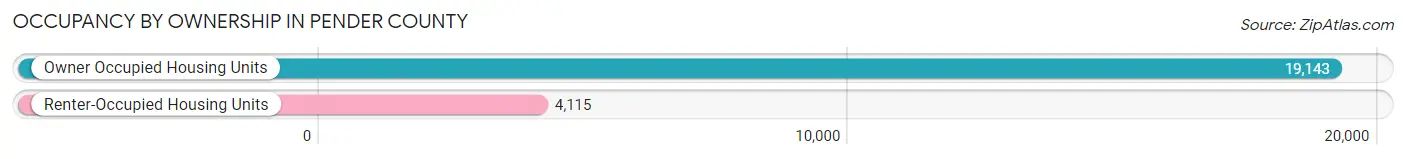
| Occupancy | # Housing Units | % Housing Units |
| Owner Occupied Housing Units | 19,143 | 82.3% |
| Renter-Occupied Housing Units | 4,115 | 17.7% |
| Total Occupied Housing Units | 23,258 | 100.0% |
Occupancy by Household Size in Pender County
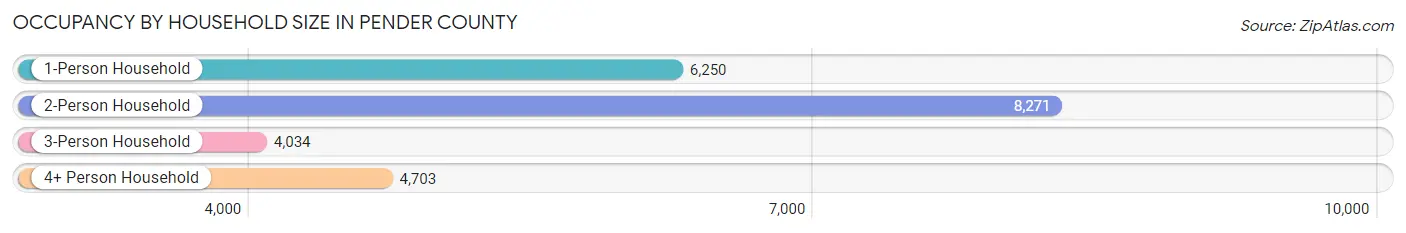
| Household Size | # Housing Units | % Housing Units |
| 1-Person Household | 6,250 | 26.9% |
| 2-Person Household | 8,271 | 35.6% |
| 3-Person Household | 4,034 | 17.3% |
| 4+ Person Household | 4,703 | 20.2% |
| Total Housing Units | 23,258 | 100.0% |
Occupancy by Ownership by Household Size in Pender County
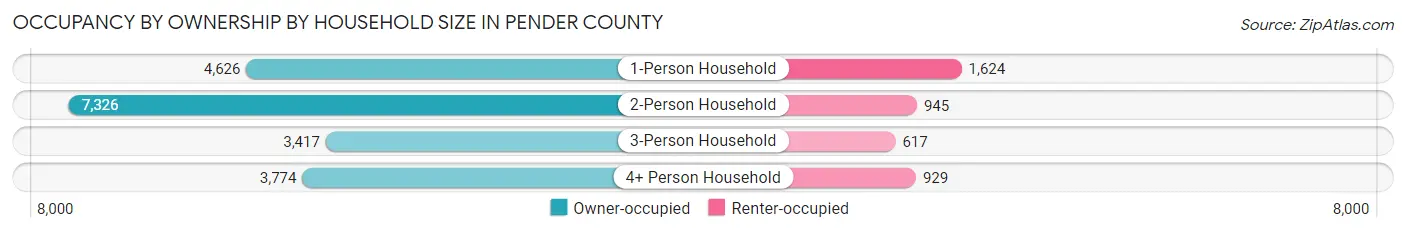
| Household Size | Owner-occupied | Renter-occupied |
| 1-Person Household | 4,626 (74.0%) | 1,624 (26.0%) |
| 2-Person Household | 7,326 (88.6%) | 945 (11.4%) |
| 3-Person Household | 3,417 (84.7%) | 617 (15.3%) |
| 4+ Person Household | 3,774 (80.2%) | 929 (19.8%) |
| Total Housing Units | 19,143 (82.3%) | 4,115 (17.7%) |
Occupancy by Educational Attainment in Pender County
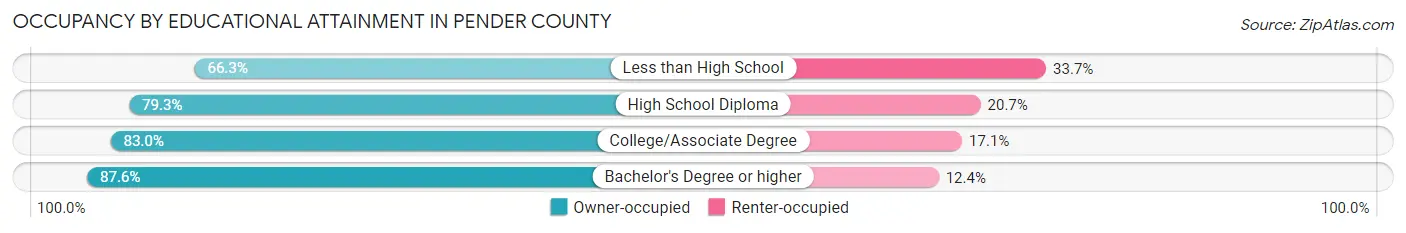
| Household Size | Owner-occupied | Renter-occupied |
| Less than High School | 1,249 (66.3%) | 635 (33.7%) |
| High School Diploma | 4,182 (79.3%) | 1,092 (20.7%) |
| College/Associate Degree | 6,993 (83.0%) | 1,437 (17.1%) |
| Bachelor's Degree or higher | 6,719 (87.6%) | 951 (12.4%) |
Occupancy by Age of Householder in Pender County
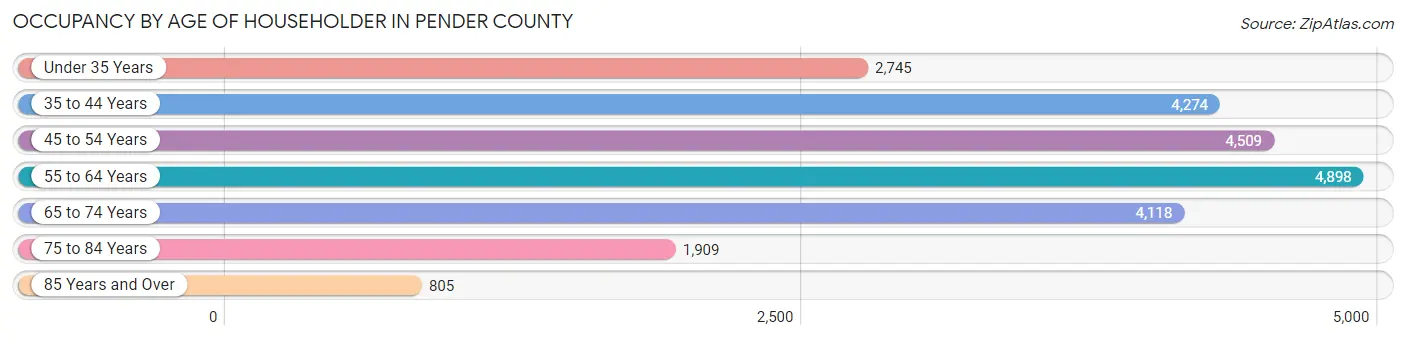
| Age Bracket | # Households | % Households |
| Under 35 Years | 2,745 | 11.8% |
| 35 to 44 Years | 4,274 | 18.4% |
| 45 to 54 Years | 4,509 | 19.4% |
| 55 to 64 Years | 4,898 | 21.1% |
| 65 to 74 Years | 4,118 | 17.7% |
| 75 to 84 Years | 1,909 | 8.2% |
| 85 Years and Over | 805 | 3.5% |
| Total | 23,258 | 100.0% |
Housing Finances in Pender County
Median Income by Occupancy in Pender County
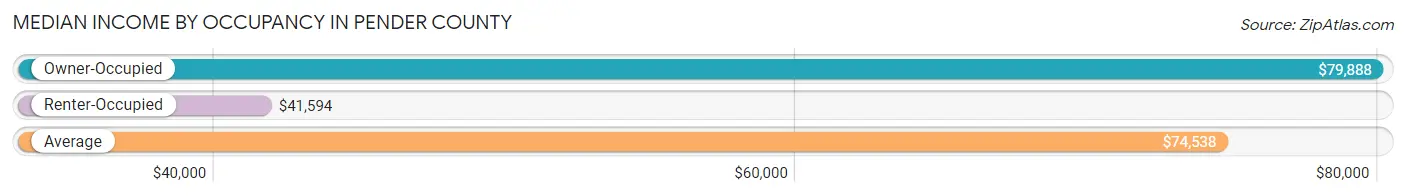
| Occupancy Type | # Households | Median Income |
| Owner-Occupied | 19,143 (82.3%) | $79,888 |
| Renter-Occupied | 4,115 (17.7%) | $41,594 |
| Average | 23,258 (100.0%) | $74,538 |
Occupancy by Householder Income Bracket in Pender County
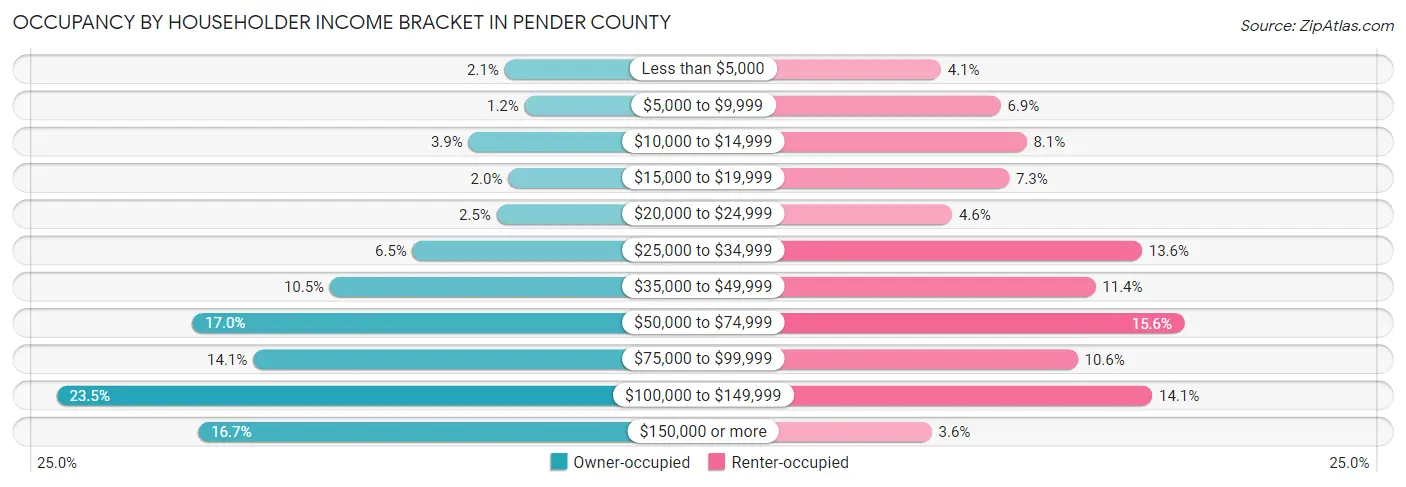
| Income Bracket | Owner-occupied | Renter-occupied |
| Less than $5,000 | 409 (2.1%) | 167 (4.1%) |
| $5,000 to $9,999 | 227 (1.2%) | 284 (6.9%) |
| $10,000 to $14,999 | 738 (3.9%) | 335 (8.1%) |
| $15,000 to $19,999 | 377 (2.0%) | 301 (7.3%) |
| $20,000 to $24,999 | 483 (2.5%) | 189 (4.6%) |
| $25,000 to $34,999 | 1,248 (6.5%) | 561 (13.6%) |
| $35,000 to $49,999 | 2,003 (10.5%) | 470 (11.4%) |
| $50,000 to $74,999 | 3,258 (17.0%) | 643 (15.6%) |
| $75,000 to $99,999 | 2,703 (14.1%) | 435 (10.6%) |
| $100,000 to $149,999 | 4,494 (23.5%) | 581 (14.1%) |
| $150,000 or more | 3,203 (16.7%) | 149 (3.6%) |
| Total | 19,143 (100.0%) | 4,115 (100.0%) |
Monthly Housing Cost Tiers in Pender County
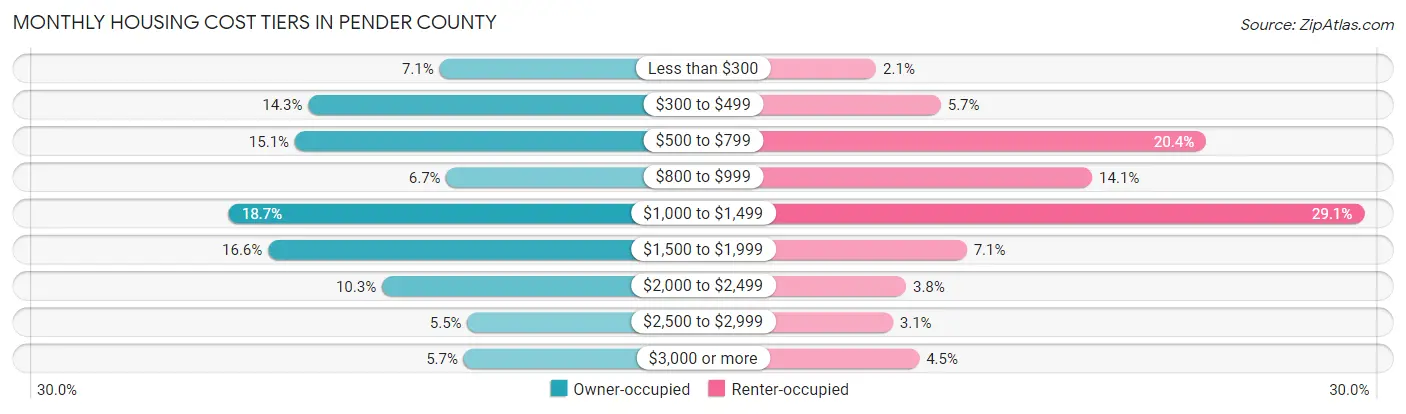
| Monthly Cost | Owner-occupied | Renter-occupied |
| Less than $300 | 1,356 (7.1%) | 88 (2.1%) |
| $300 to $499 | 2,744 (14.3%) | 235 (5.7%) |
| $500 to $799 | 2,884 (15.1%) | 838 (20.4%) |
| $800 to $999 | 1,283 (6.7%) | 579 (14.1%) |
| $1,000 to $1,499 | 3,584 (18.7%) | 1,197 (29.1%) |
| $1,500 to $1,999 | 3,168 (16.6%) | 294 (7.1%) |
| $2,000 to $2,499 | 1,965 (10.3%) | 156 (3.8%) |
| $2,500 to $2,999 | 1,060 (5.5%) | 126 (3.1%) |
| $3,000 or more | 1,099 (5.7%) | 186 (4.5%) |
| Total | 19,143 (100.0%) | 4,115 (100.0%) |
Physical Housing Characteristics in Pender County
Housing Structures in Pender County
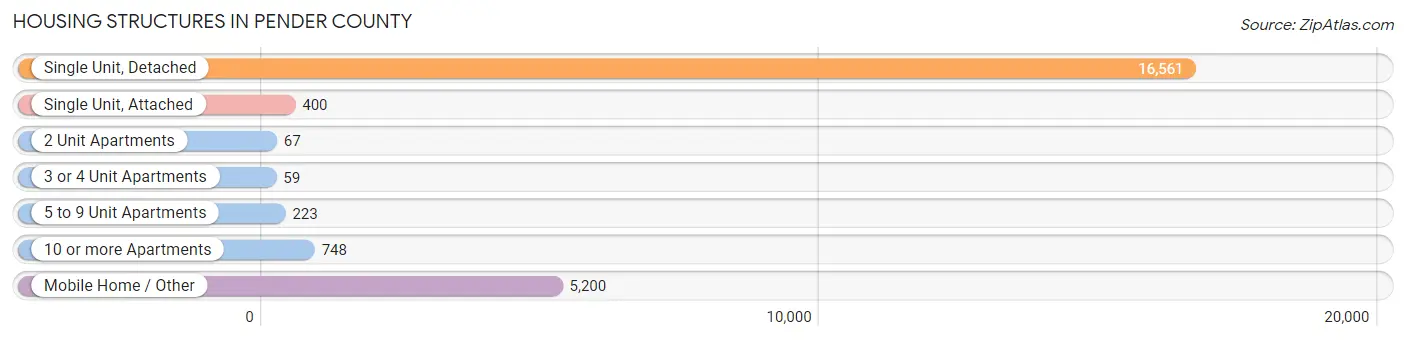
| Structure Type | # Housing Units | % Housing Units |
| Single Unit, Detached | 16,561 | 71.2% |
| Single Unit, Attached | 400 | 1.7% |
| 2 Unit Apartments | 67 | 0.3% |
| 3 or 4 Unit Apartments | 59 | 0.3% |
| 5 to 9 Unit Apartments | 223 | 1.0% |
| 10 or more Apartments | 748 | 3.2% |
| Mobile Home / Other | 5,200 | 22.4% |
| Total | 23,258 | 100.0% |
Housing Structures by Occupancy in Pender County
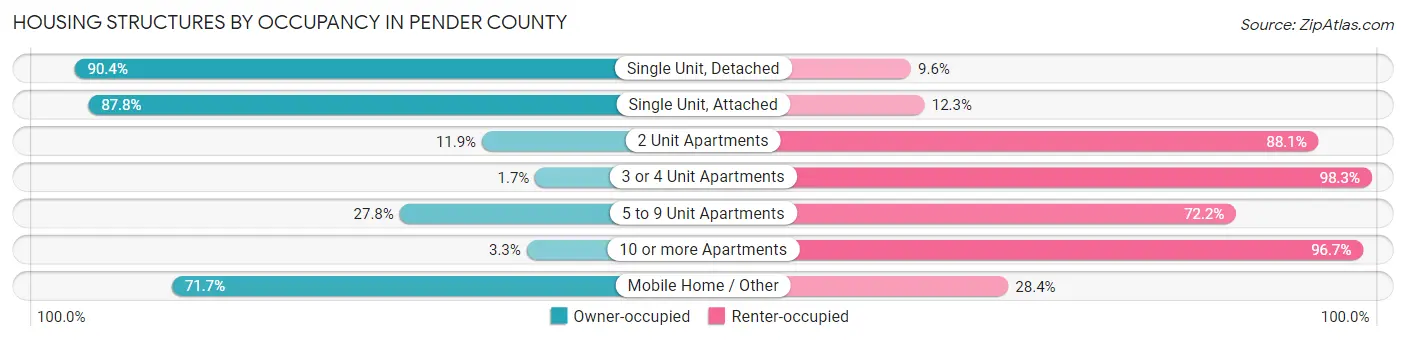
| Structure Type | Owner-occupied | Renter-occupied |
| Single Unit, Detached | 14,970 (90.4%) | 1,591 (9.6%) |
| Single Unit, Attached | 351 (87.7%) | 49 (12.2%) |
| 2 Unit Apartments | 8 (11.9%) | 59 (88.1%) |
| 3 or 4 Unit Apartments | 1 (1.7%) | 58 (98.3%) |
| 5 to 9 Unit Apartments | 62 (27.8%) | 161 (72.2%) |
| 10 or more Apartments | 25 (3.3%) | 723 (96.7%) |
| Mobile Home / Other | 3,726 (71.7%) | 1,474 (28.3%) |
| Total | 19,143 (82.3%) | 4,115 (17.7%) |
Housing Structures by Number of Rooms in Pender County
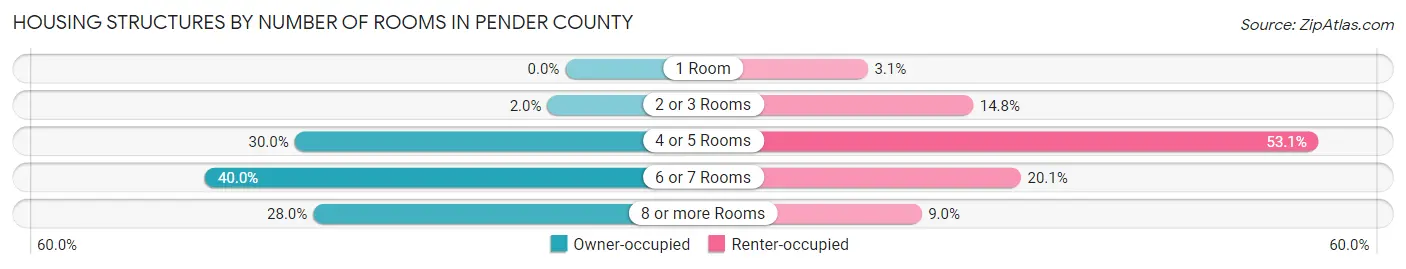
| Number of Rooms | Owner-occupied | Renter-occupied |
| 1 Room | 0 (0.0%) | 126 (3.1%) |
| 2 or 3 Rooms | 381 (2.0%) | 607 (14.7%) |
| 4 or 5 Rooms | 5,751 (30.0%) | 2,186 (53.1%) |
| 6 or 7 Rooms | 7,654 (40.0%) | 825 (20.1%) |
| 8 or more Rooms | 5,357 (28.0%) | 371 (9.0%) |
| Total | 19,143 (100.0%) | 4,115 (100.0%) |
Housing Structure by Heating Type in Pender County
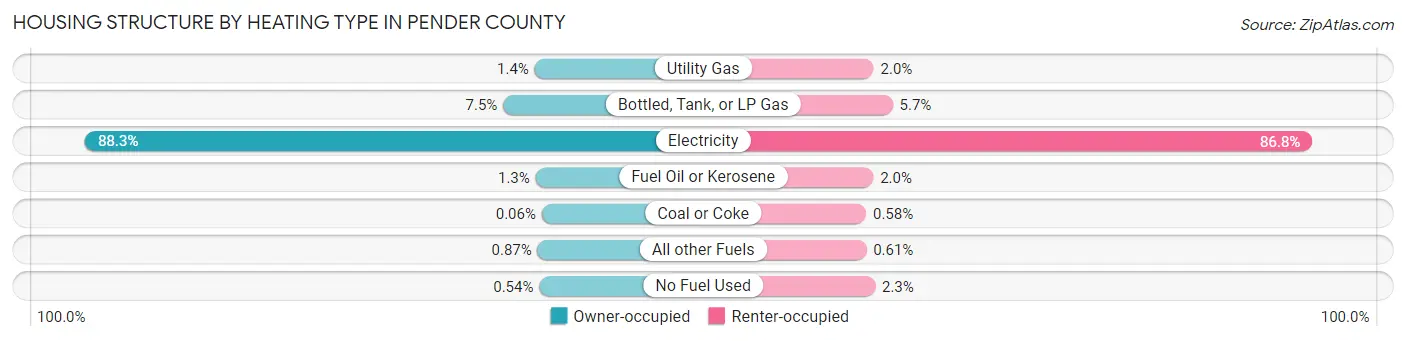
| Heating Type | Owner-occupied | Renter-occupied |
| Utility Gas | 274 (1.4%) | 84 (2.0%) |
| Bottled, Tank, or LP Gas | 1,440 (7.5%) | 235 (5.7%) |
| Electricity | 16,908 (88.3%) | 3,571 (86.8%) |
| Fuel Oil or Kerosene | 239 (1.3%) | 81 (2.0%) |
| Coal or Coke | 12 (0.1%) | 24 (0.6%) |
| All other Fuels | 166 (0.9%) | 25 (0.6%) |
| No Fuel Used | 104 (0.5%) | 95 (2.3%) |
| Total | 19,143 (100.0%) | 4,115 (100.0%) |
Household Vehicle Usage in Pender County
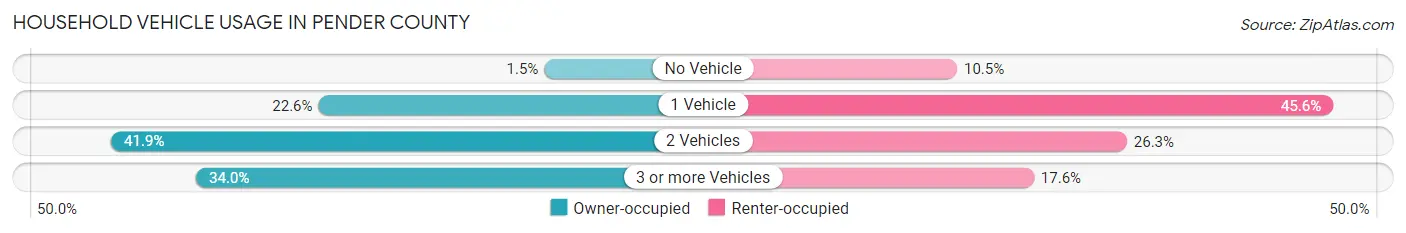
| Vehicles per Household | Owner-occupied | Renter-occupied |
| No Vehicle | 288 (1.5%) | 431 (10.5%) |
| 1 Vehicle | 4,322 (22.6%) | 1,875 (45.6%) |
| 2 Vehicles | 8,026 (41.9%) | 1,083 (26.3%) |
| 3 or more Vehicles | 6,507 (34.0%) | 726 (17.6%) |
| Total | 19,143 (100.0%) | 4,115 (100.0%) |
Real Estate & Mortgages in Pender County
Real Estate and Mortgage Overview in Pender County
| Characteristic | Without Mortgage | With Mortgage |
| Housing Units | 7,414 | 11,729 |
| Median Property Value | $170,800 | $282,200 |
| Median Household Income | $59,555 | $2,592 |
| Monthly Housing Costs | $483 | $991 |
| Real Estate Taxes | $1,343 | $150 |
Property Value by Mortgage Status in Pender County
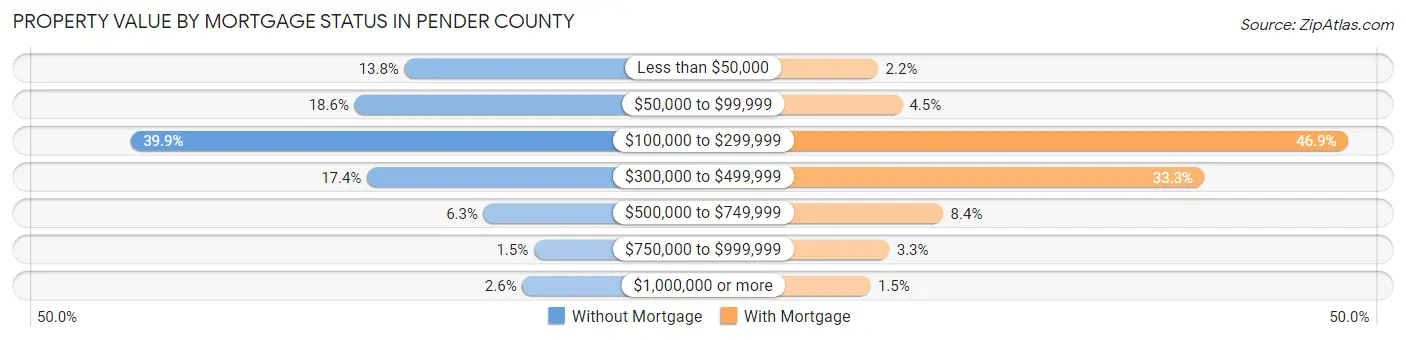
| Property Value | Without Mortgage | With Mortgage |
| Less than $50,000 | 1,023 (13.8%) | 258 (2.2%) |
| $50,000 to $99,999 | 1,376 (18.6%) | 524 (4.5%) |
| $100,000 to $299,999 | 2,961 (39.9%) | 5,506 (46.9%) |
| $300,000 to $499,999 | 1,288 (17.4%) | 3,902 (33.3%) |
| $500,000 to $749,999 | 465 (6.3%) | 984 (8.4%) |
| $750,000 to $999,999 | 110 (1.5%) | 382 (3.3%) |
| $1,000,000 or more | 191 (2.6%) | 173 (1.5%) |
| Total | 7,414 (100.0%) | 11,729 (100.0%) |
Household Income by Mortgage Status in Pender County
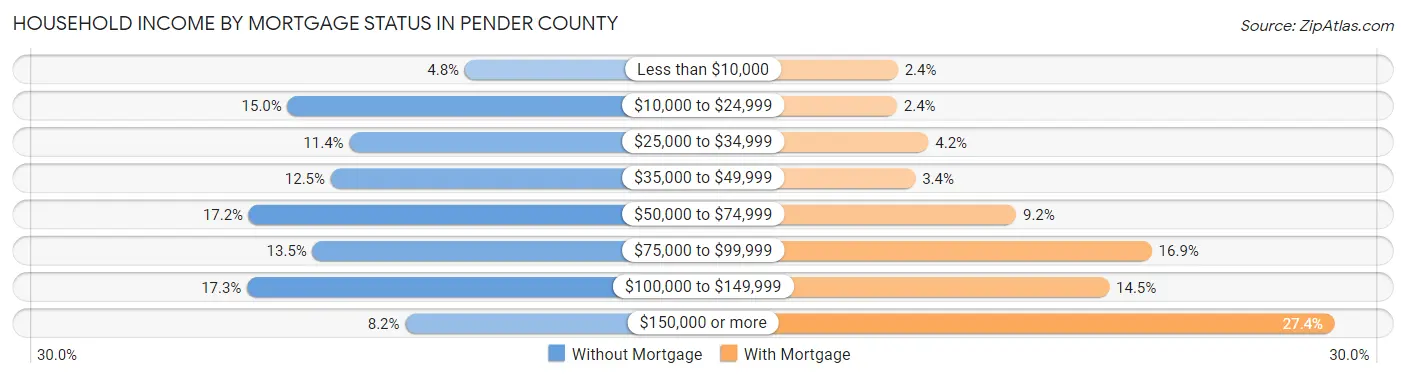
| Household Income | Without Mortgage | With Mortgage |
| Less than $10,000 | 359 (4.8%) | 283 (2.4%) |
| $10,000 to $24,999 | 1,110 (15.0%) | 277 (2.4%) |
| $25,000 to $34,999 | 848 (11.4%) | 488 (4.2%) |
| $35,000 to $49,999 | 927 (12.5%) | 400 (3.4%) |
| $50,000 to $74,999 | 1,274 (17.2%) | 1,076 (9.2%) |
| $75,000 to $99,999 | 1,004 (13.5%) | 1,984 (16.9%) |
| $100,000 to $149,999 | 1,281 (17.3%) | 1,699 (14.5%) |
| $150,000 or more | 611 (8.2%) | 3,213 (27.4%) |
| Total | 7,414 (100.0%) | 11,729 (100.0%) |
Property Value to Household Income Ratio in Pender County
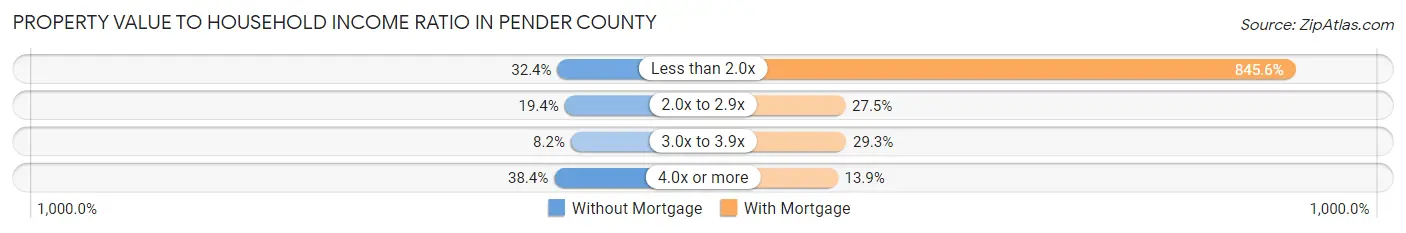
| Value-to-Income Ratio | Without Mortgage | With Mortgage |
| Less than 2.0x | 2,405 (32.4%) | 99,178 (845.6%) |
| 2.0x to 2.9x | 1,436 (19.4%) | 3,229 (27.5%) |
| 3.0x to 3.9x | 606 (8.2%) | 3,441 (29.3%) |
| 4.0x or more | 2,850 (38.4%) | 1,626 (13.9%) |
| Total | 7,414 (100.0%) | 11,729 (100.0%) |
Real Estate Taxes by Mortgage Status in Pender County
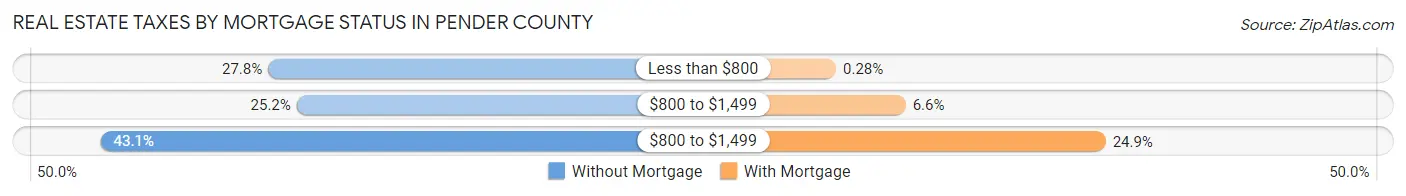
| Property Taxes | Without Mortgage | With Mortgage |
| Less than $800 | 2,059 (27.8%) | 33 (0.3%) |
| $800 to $1,499 | 1,865 (25.2%) | 779 (6.6%) |
| $800 to $1,499 | 3,192 (43.0%) | 2,921 (24.9%) |
| Total | 7,414 (100.0%) | 11,729 (100.0%) |
Health & Disability in Pender County
Health Insurance Coverage by Age in Pender County
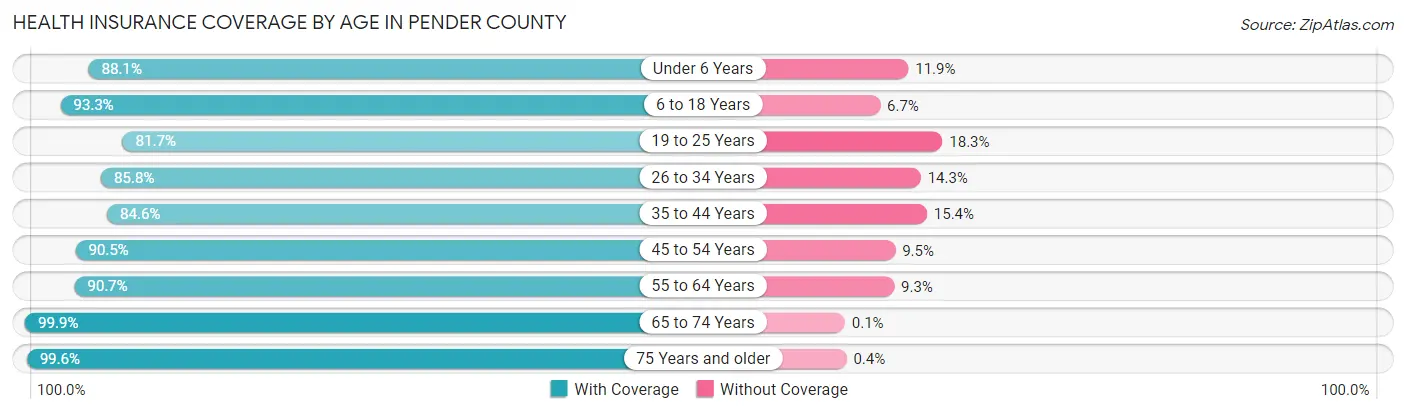
| Age Bracket | With Coverage | Without Coverage |
| Under 6 Years | 3,603 (88.1%) | 488 (11.9%) |
| 6 to 18 Years | 9,674 (93.3%) | 692 (6.7%) |
| 19 to 25 Years | 3,347 (81.7%) | 749 (18.3%) |
| 26 to 34 Years | 4,809 (85.8%) | 799 (14.2%) |
| 35 to 44 Years | 6,526 (84.6%) | 1,188 (15.4%) |
| 45 to 54 Years | 7,632 (90.5%) | 800 (9.5%) |
| 55 to 64 Years | 8,108 (90.7%) | 830 (9.3%) |
| 65 to 74 Years | 6,776 (99.9%) | 7 (0.1%) |
| 75 Years and older | 3,974 (99.6%) | 16 (0.4%) |
| Total | 54,449 (90.7%) | 5,569 (9.3%) |
Health Insurance Coverage by Citizenship Status in Pender County
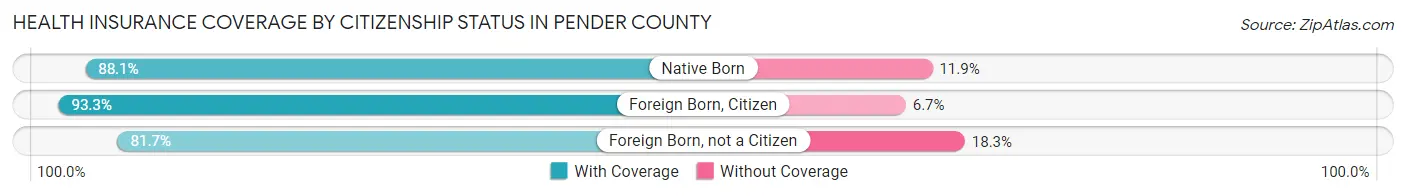
| Citizenship Status | With Coverage | Without Coverage |
| Native Born | 3,603 (88.1%) | 488 (11.9%) |
| Foreign Born, Citizen | 9,674 (93.3%) | 692 (6.7%) |
| Foreign Born, not a Citizen | 3,347 (81.7%) | 749 (18.3%) |
Health Insurance Coverage by Household Income in Pender County
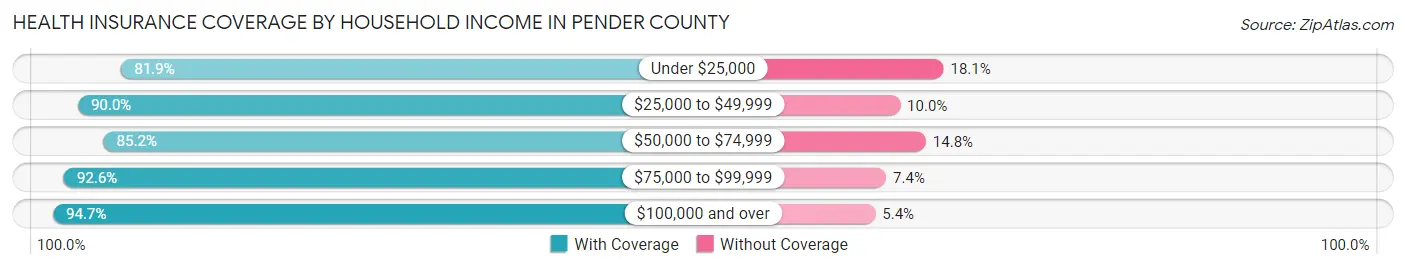
| Household Income | With Coverage | Without Coverage |
| Under $25,000 | 5,208 (81.9%) | 1,153 (18.1%) |
| $25,000 to $49,999 | 8,313 (90.0%) | 924 (10.0%) |
| $50,000 to $74,999 | 8,433 (85.2%) | 1,467 (14.8%) |
| $75,000 to $99,999 | 7,645 (92.6%) | 608 (7.4%) |
| $100,000 and over | 24,791 (94.7%) | 1,402 (5.3%) |
Public vs Private Health Insurance Coverage by Age in Pender County
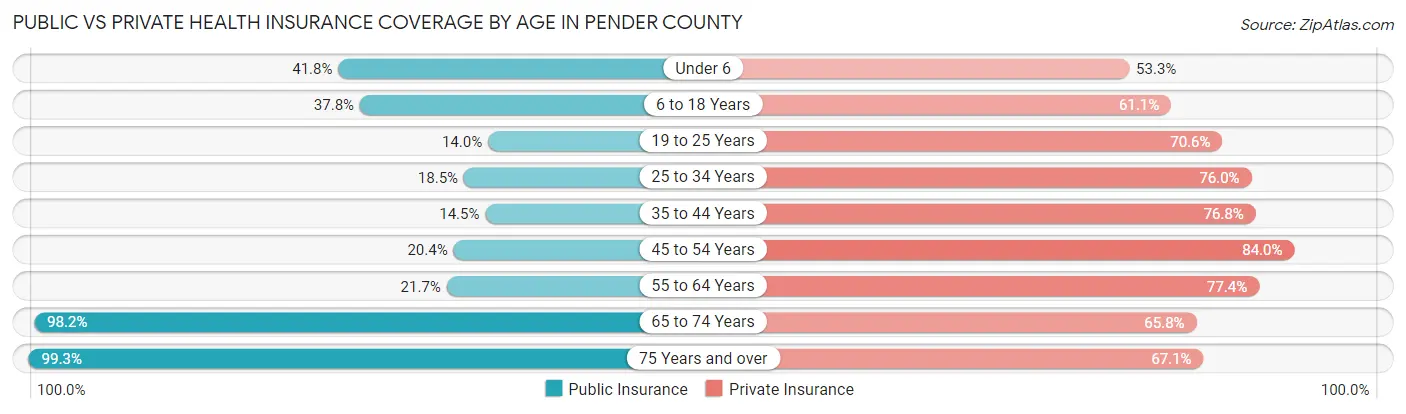
| Age Bracket | Public Insurance | Private Insurance |
| Under 6 | 1,709 (41.8%) | 2,182 (53.3%) |
| 6 to 18 Years | 3,914 (37.8%) | 6,336 (61.1%) |
| 19 to 25 Years | 573 (14.0%) | 2,893 (70.6%) |
| 25 to 34 Years | 1,035 (18.5%) | 4,264 (76.0%) |
| 35 to 44 Years | 1,117 (14.5%) | 5,926 (76.8%) |
| 45 to 54 Years | 1,719 (20.4%) | 7,082 (84.0%) |
| 55 to 64 Years | 1,936 (21.7%) | 6,922 (77.4%) |
| 65 to 74 Years | 6,663 (98.2%) | 4,464 (65.8%) |
| 75 Years and over | 3,960 (99.3%) | 2,678 (67.1%) |
| Total | 22,626 (37.7%) | 42,747 (71.2%) |
Disability Status by Sex by Age in Pender County
| Age Bracket | Male | Female |
| Under 5 Years | 105 (5.4%) | 0 (0.0%) |
| 5 to 17 Years | 581 (11.0%) | 250 (5.0%) |
| 18 to 34 Years | 912 (17.1%) | 530 (10.1%) |
| 35 to 64 Years | 1,920 (15.5%) | 1,711 (13.5%) |
| 65 to 74 Years | 931 (29.0%) | 764 (21.4%) |
| 75 Years and over | 954 (52.2%) | 947 (43.8%) |
Disability Class by Sex by Age in Pender County
Disability Class: Hearing Difficulty
| Age Bracket | Male | Female |
| Under 5 Years | 52 (2.7%) | 0 (0.0%) |
| 5 to 17 Years | 0 (0.0%) | 27 (0.5%) |
| 18 to 34 Years | 137 (2.6%) | 33 (0.6%) |
| 35 to 64 Years | 582 (4.7%) | 262 (2.1%) |
| 65 to 74 Years | 379 (11.8%) | 250 (7.0%) |
| 75 Years and over | 627 (34.3%) | 406 (18.8%) |
Disability Class: Vision Difficulty
| Age Bracket | Male | Female |
| Under 5 Years | 53 (2.8%) | 0 (0.0%) |
| 5 to 17 Years | 147 (2.8%) | 76 (1.5%) |
| 18 to 34 Years | 48 (0.9%) | 84 (1.6%) |
| 35 to 64 Years | 283 (2.3%) | 245 (1.9%) |
| 65 to 74 Years | 94 (2.9%) | 178 (5.0%) |
| 75 Years and over | 151 (8.3%) | 170 (7.9%) |
Disability Class: Cognitive Difficulty
| Age Bracket | Male | Female |
| 5 to 17 Years | 428 (8.1%) | 204 (4.1%) |
| 18 to 34 Years | 858 (16.1%) | 372 (7.1%) |
| 35 to 64 Years | 683 (5.5%) | 504 (4.0%) |
| 65 to 74 Years | 212 (6.6%) | 218 (6.1%) |
| 75 Years and over | 218 (11.9%) | 212 (9.8%) |
Disability Class: Ambulatory Difficulty
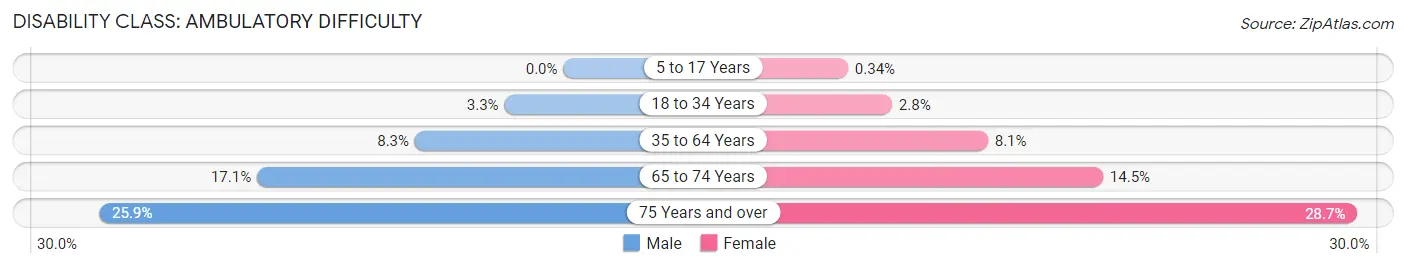
| Age Bracket | Male | Female |
| 5 to 17 Years | 0 (0.0%) | 17 (0.3%) |
| 18 to 34 Years | 175 (3.3%) | 146 (2.8%) |
| 35 to 64 Years | 1,027 (8.3%) | 1,030 (8.1%) |
| 65 to 74 Years | 547 (17.1%) | 520 (14.5%) |
| 75 Years and over | 472 (25.9%) | 621 (28.7%) |
Disability Class: Self-Care Difficulty
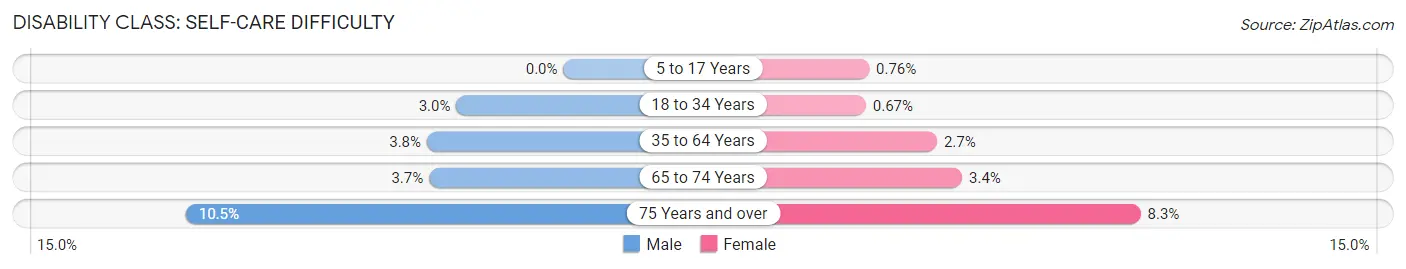
| Age Bracket | Male | Female |
| 5 to 17 Years | 0 (0.0%) | 38 (0.8%) |
| 18 to 34 Years | 159 (3.0%) | 35 (0.7%) |
| 35 to 64 Years | 472 (3.8%) | 336 (2.6%) |
| 65 to 74 Years | 120 (3.7%) | 120 (3.4%) |
| 75 Years and over | 192 (10.5%) | 180 (8.3%) |
Technology Access in Pender County
Computing Device Access in Pender County
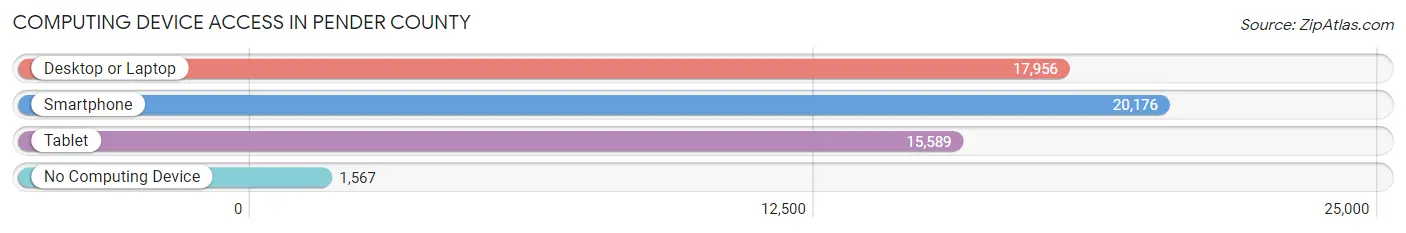
| Device Type | # Households | % Households |
| Desktop or Laptop | 17,956 | 77.2% |
| Smartphone | 20,176 | 86.8% |
| Tablet | 15,589 | 67.0% |
| No Computing Device | 1,567 | 6.7% |
| Total | 23,258 | 100.0% |
Internet Access in Pender County
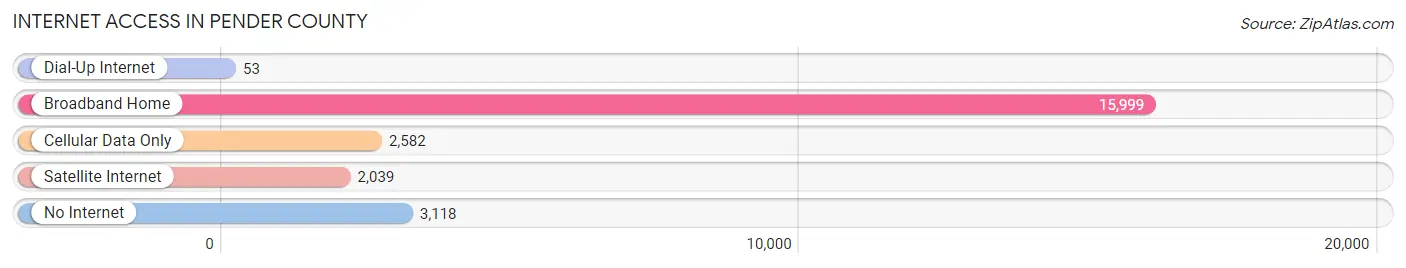
| Internet Type | # Households | % Households |
| Dial-Up Internet | 53 | 0.2% |
| Broadband Home | 15,999 | 68.8% |
| Cellular Data Only | 2,582 | 11.1% |
| Satellite Internet | 2,039 | 8.8% |
| No Internet | 3,118 | 13.4% |
| Total | 23,258 | 100.0% |
Pender County Summary
Pender County is located in the southeastern corner of North Carolina, and is part of the Wilmington Metropolitan Statistical Area. It is bordered by New Hanover County to the north, Brunswick County to the south, and Duplin County to the west. The county seat is Burgaw, and the largest city is Surf City. The county was formed in 1875 from New Hanover County and named for William Dorsey Pender, a Confederate general killed in the Battle of Gettysburg.
Geography
Pender County covers an area of 845 square miles, making it the second-largest county in North Carolina. The terrain is mostly flat, with some rolling hills in the western part of the county. The Cape Fear River forms the northern border of the county, and the Northeast Cape Fear River forms the eastern border. The county is home to several state parks, including Carolina Beach State Park, Fort Fisher State Recreation Area, and Holly Shelter Game Land.
Climate
Pender County has a humid subtropical climate, with hot, humid summers and mild winters. The average annual temperature is around 70°F, and the average annual precipitation is around 50 inches.
Demographics
As of the 2010 census, Pender County had a population of 52,217. The racial makeup of the county was 79.2% White, 15.3% African American, 0.7% Native American, 1.3% Asian, 0.1% Pacific Islander, 1.7% from other races, and 1.9% from two or more races. Hispanic or Latino of any race were 4.2% of the population.
Economy
Agriculture is the main economic activity in Pender County. The county is home to several large farms, including the Pender County Farm Bureau, which produces corn, soybeans, wheat, and other crops. The county is also home to several seafood processing plants, which process shrimp, crabs, and other seafood. Tourism is also an important part of the economy, with visitors coming to the county to enjoy its beaches, parks, and other attractions.
History
The area that is now Pender County was originally inhabited by the Tuscarora and Coree Native American tribes. The first European settlers arrived in the area in the late 17th century, and the county was officially established in 1875. During the Civil War, the county was the site of several battles, including the Battle of Fort Fisher and the Battle of Wilmington. After the war, the county experienced a period of growth and development, with the construction of roads, bridges, and other infrastructure. In the late 20th century, the county experienced a population boom, as people moved to the area to take advantage of its beaches and other attractions.
Today, Pender County is a vibrant and diverse community, with a strong economy and a rich history. The county is home to several state parks, beaches, and other attractions, making it a popular destination for tourists and residents alike.
Common Questions
What is Per Capita Income in Pender County?
Per Capita income in Pender County is $36,352.
What is the Median Family Income in Pender County?
Median Family Income in Pender County is $90,057.
What is the Median Household income in Pender County?
Median Household Income in Pender County is $74,538.
What is Income or Wage Gap in Pender County?
Income or Wage Gap in Pender County is 31.7%.
Women in Pender County earn 68.3 cents for every dollar earned by a man.
What is Family Income Deficit in Pender County?
Family Income Deficit in Pender County is $12,353.
Families that are below poverty line in Pender County earn $12,353 less on average than the poverty threshold level.
What is Inequality or Gini Index in Pender County?
Inequality or Gini Index in Pender County is 0.44.
What is the Total Population of Pender County?
Total Population of Pender County is 61,592.
What is the Total Male Population of Pender County?
Total Male Population of Pender County is 31,258.
What is the Total Female Population of Pender County?
Total Female Population of Pender County is 30,334.
What is the Ratio of Males per 100 Females in Pender County?
There are 103.05 Males per 100 Females in Pender County.
What is the Ratio of Females per 100 Males in Pender County?
There are 97.04 Females per 100 Males in Pender County.
What is the Median Population Age in Pender County?
Median Population Age in Pender County is 42.6 Years.
What is the Average Family Size in Pender County
Average Family Size in Pender County is 3.2 People.
What is the Average Household Size in Pender County
Average Household Size in Pender County is 2.6 People.
How Large is the Labor Force in Pender County?
There are 30,100 People in the Labor Forcein in Pender County.
What is the Percentage of People in the Labor Force in Pender County?
60.5% of People are in the Labor Force in Pender County.
What is the Unemployment Rate in Pender County?
Unemployment Rate in Pender County is 6.4%.