Hoke County, NC Map & Demographics
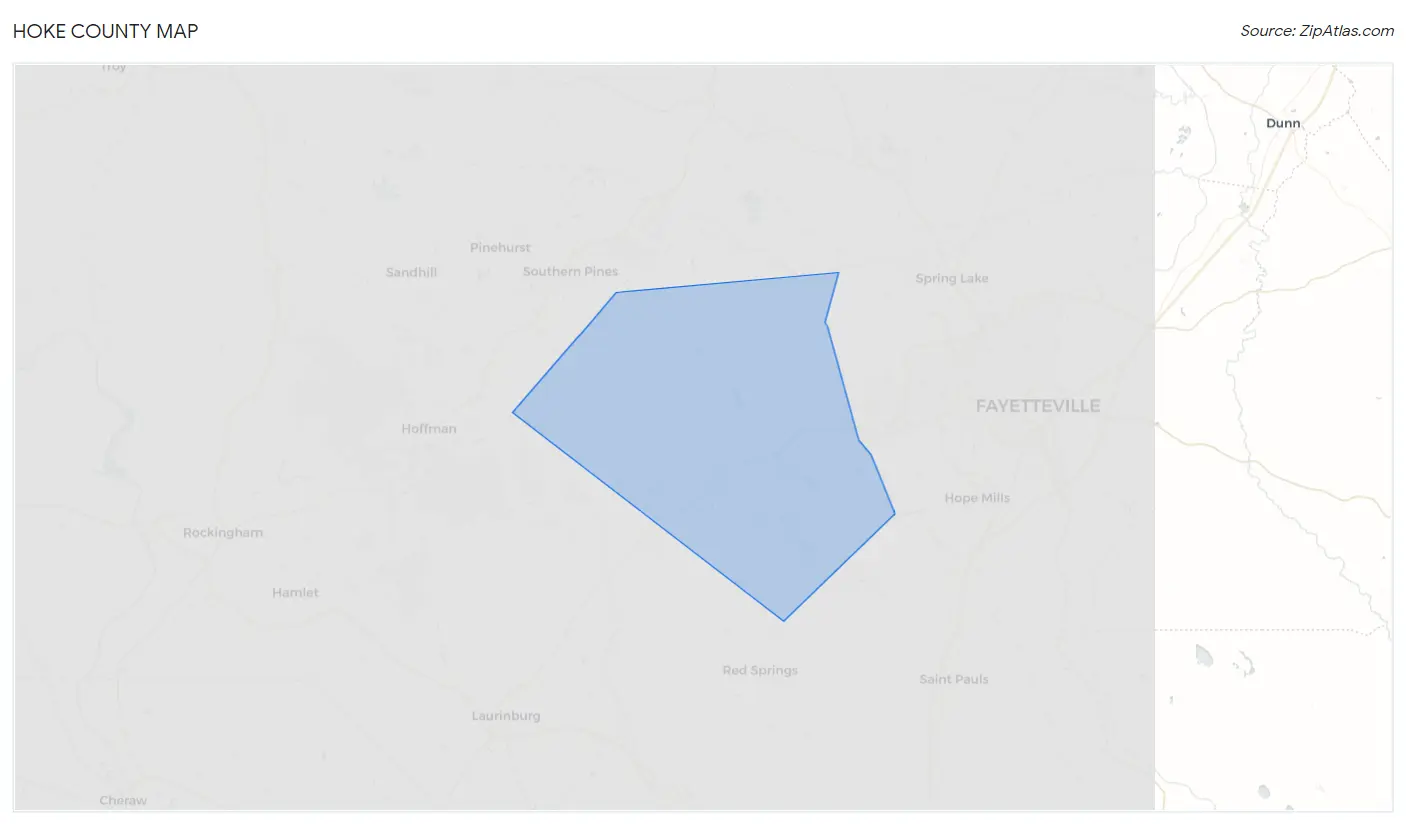
Hoke County Map
Hoke County Overview
$27,991
PER CAPITA INCOME
$70,671
AVG FAMILY INCOME
$57,141
AVG HOUSEHOLD INCOME
30.5%
WAGE / INCOME GAP [ % ]
69.5¢/ $1
WAGE / INCOME GAP [ $ ]
$12,568
FAMILY INCOME DEFICIT
0.48
INEQUALITY / GINI INDEX
52,612
TOTAL POPULATION
26,017
MALE POPULATION
26,595
FEMALE POPULATION
97.83
MALES / 100 FEMALES
102.22
FEMALES / 100 MALES
33.5
MEDIAN AGE
3.5
AVG FAMILY SIZE
2.8
AVG HOUSEHOLD SIZE
23,129
LABOR FORCE [ PEOPLE ]
58.3%
PERCENT IN LABOR FORCE
6.4%
UNEMPLOYMENT RATE
Hoke County Area Codes
Income in Hoke County
Income Overview in Hoke County
Per Capita Income in Hoke County is $27,991, while median incomes of families and households are $70,671 and $57,141 respectively.
| Characteristic | Number | Measure |
| Per Capita Income | 52,612 | $27,991 |
| Median Family Income | 11,936 | $70,671 |
| Mean Family Income | 11,936 | $94,114 |
| Median Household Income | 18,481 | $57,141 |
| Mean Household Income | 18,481 | $77,441 |
| Income Deficit | 11,936 | $12,568 |
| Wage / Income Gap (%) | 52,612 | 30.51% |
| Wage / Income Gap ($) | 52,612 | 69.49¢ per $1 |
| Gini / Inequality Index | 52,612 | 0.48 |
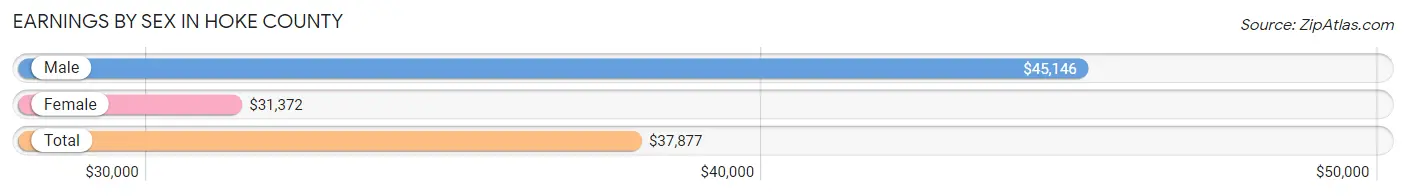
Earnings by Sex in Hoke County
Average Earnings in Hoke County are $37,877, $45,146 for men and $31,372 for women, a difference of 30.5%.
| Sex | Number | Average Earnings |
| Male | 12,267 (51.9%) | $45,146 |
| Female | 11,355 (48.1%) | $31,372 |
| Total | 23,622 (100.0%) | $37,877 |
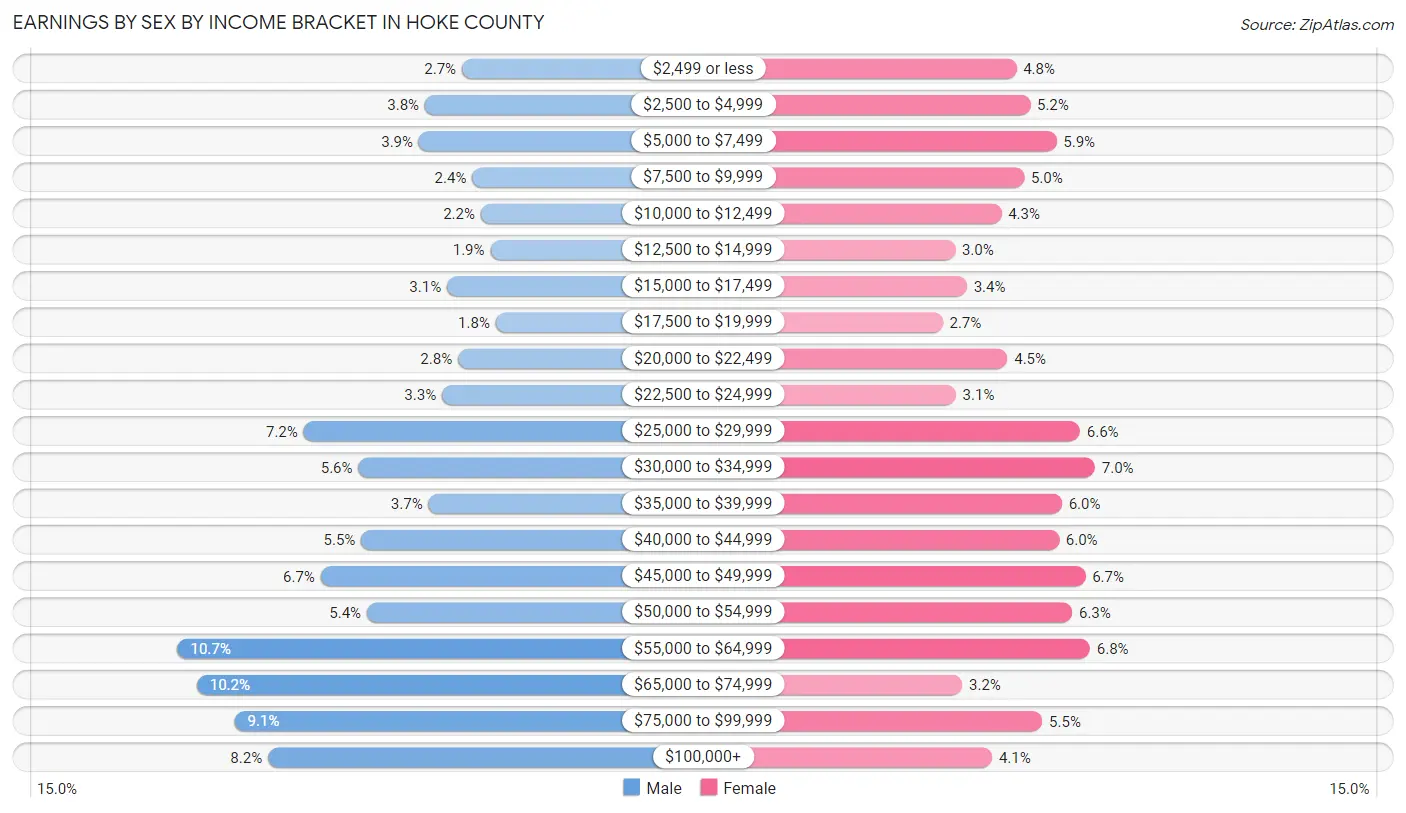
Earnings by Sex by Income Bracket in Hoke County
The most common earnings brackets in Hoke County are $55,000 to $64,999 for men (1,313 | 10.7%) and $30,000 to $34,999 for women (791 | 7.0%).
| Income | Male | Female |
| $2,499 or less | 332 (2.7%) | 541 (4.8%) |
| $2,500 to $4,999 | 460 (3.7%) | 585 (5.1%) |
| $5,000 to $7,499 | 481 (3.9%) | 669 (5.9%) |
| $7,500 to $9,999 | 297 (2.4%) | 566 (5.0%) |
| $10,000 to $12,499 | 267 (2.2%) | 493 (4.3%) |
| $12,500 to $14,999 | 234 (1.9%) | 345 (3.0%) |
| $15,000 to $17,499 | 384 (3.1%) | 383 (3.4%) |
| $17,500 to $19,999 | 216 (1.8%) | 306 (2.7%) |
| $20,000 to $22,499 | 346 (2.8%) | 512 (4.5%) |
| $22,500 to $24,999 | 401 (3.3%) | 348 (3.1%) |
| $25,000 to $29,999 | 878 (7.2%) | 744 (6.6%) |
| $30,000 to $34,999 | 689 (5.6%) | 791 (7.0%) |
| $35,000 to $39,999 | 448 (3.6%) | 686 (6.0%) |
| $40,000 to $44,999 | 679 (5.5%) | 677 (6.0%) |
| $45,000 to $49,999 | 819 (6.7%) | 761 (6.7%) |
| $50,000 to $54,999 | 660 (5.4%) | 719 (6.3%) |
| $55,000 to $64,999 | 1,313 (10.7%) | 775 (6.8%) |
| $65,000 to $74,999 | 1,246 (10.2%) | 368 (3.2%) |
| $75,000 to $99,999 | 1,116 (9.1%) | 623 (5.5%) |
| $100,000+ | 1,001 (8.2%) | 463 (4.1%) |
| Total | 12,267 (100.0%) | 11,355 (100.0%) |
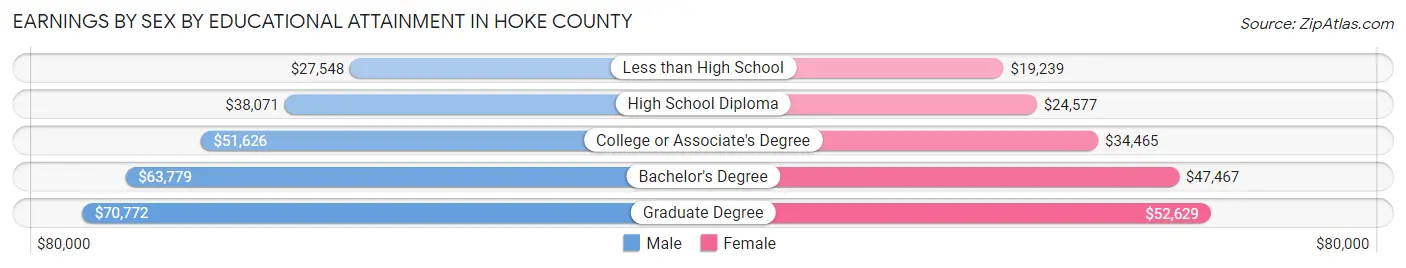
Earnings by Sex by Educational Attainment in Hoke County
Average earnings in Hoke County are $48,915 for men and $34,842 for women, a difference of 28.8%. Men with an educational attainment of graduate degree enjoy the highest average annual earnings of $70,772, while those with less than high school education earn the least with $27,548. Women with an educational attainment of graduate degree earn the most with the average annual earnings of $52,629, while those with less than high school education have the smallest earnings of $19,239.
| Educational Attainment | Male Income | Female Income |
| Less than High School | $27,548 | $19,239 |
| High School Diploma | $38,071 | $24,577 |
| College or Associate's Degree | $51,626 | $34,465 |
| Bachelor's Degree | $63,779 | $47,467 |
| Graduate Degree | $70,772 | $52,629 |
| Total | $48,915 | $34,842 |
Family Income in Hoke County
Family Income Brackets in Hoke County
According to the Hoke County family income data, there are 2,530 families falling into the $50,000 to $74,999 income range, which is the most common income bracket and makes up 21.2% of all families. Conversely, the $10,000 to $14,999 income bracket is the least frequent group with only 203 families (1.7%) belonging to this category.
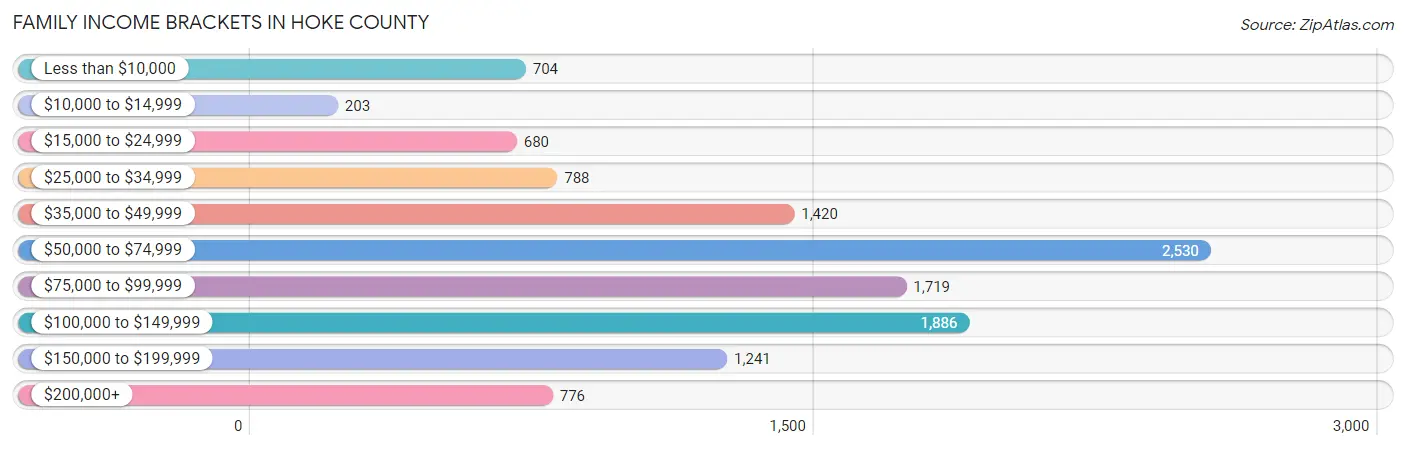
| Income Bracket | # Families | % Families |
| Less than $10,000 | 704 | 5.9% |
| $10,000 to $14,999 | 203 | 1.7% |
| $15,000 to $24,999 | 680 | 5.7% |
| $25,000 to $34,999 | 788 | 6.6% |
| $35,000 to $49,999 | 1,420 | 11.9% |
| $50,000 to $74,999 | 2,530 | 21.2% |
| $75,000 to $99,999 | 1,719 | 14.4% |
| $100,000 to $149,999 | 1,886 | 15.8% |
| $150,000 to $199,999 | 1,241 | 10.4% |
| $200,000+ | 776 | 6.5% |
Family Income by Famaliy Size in Hoke County
6-person families (455 | 3.8%) account for the highest median family income in Hoke County with $116,181 per family, while 2-person families (4,869 | 40.8%) have the highest median income of $31,605 per family member.
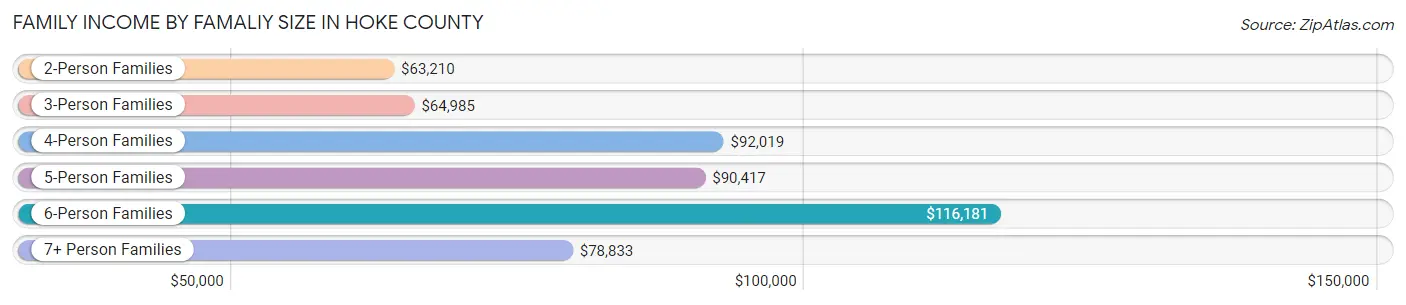
| Income Bracket | # Families | Median Income |
| 2-Person Families | 4,869 (40.8%) | $63,210 |
| 3-Person Families | 3,151 (26.4%) | $64,985 |
| 4-Person Families | 2,261 (18.9%) | $92,019 |
| 5-Person Families | 1,040 (8.7%) | $90,417 |
| 6-Person Families | 455 (3.8%) | $116,181 |
| 7+ Person Families | 160 (1.3%) | $78,833 |
| Total | 11,936 (100.0%) | $70,671 |
Family Income by Number of Earners in Hoke County
The median family income in Hoke County is $70,671, with families comprising 3+ earners (996) having the highest median family income of $150,000, while families with no earners (1,832) have the lowest median family income of $34,865, accounting for 8.3% and 15.3% of families, respectively.
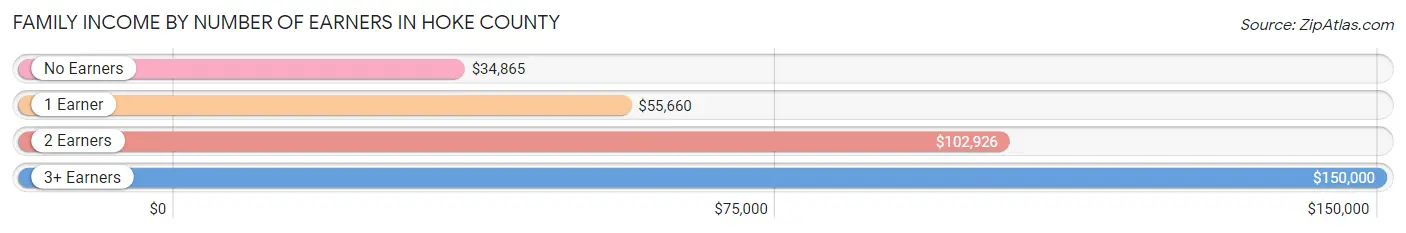
| Number of Earners | # Families | Median Income |
| No Earners | 1,832 (15.3%) | $34,865 |
| 1 Earner | 4,816 (40.4%) | $55,660 |
| 2 Earners | 4,292 (36.0%) | $102,926 |
| 3+ Earners | 996 (8.3%) | $150,000 |
| Total | 11,936 (100.0%) | $70,671 |
Household Income in Hoke County
Household Income Brackets in Hoke County
With 3,955 households falling in the category, the $50,000 to $74,999 income range is the most frequent in Hoke County, accounting for 21.4% of all households. In contrast, only 795 households (4.3%) fall into the $200,000+ income bracket, making it the least populous group.
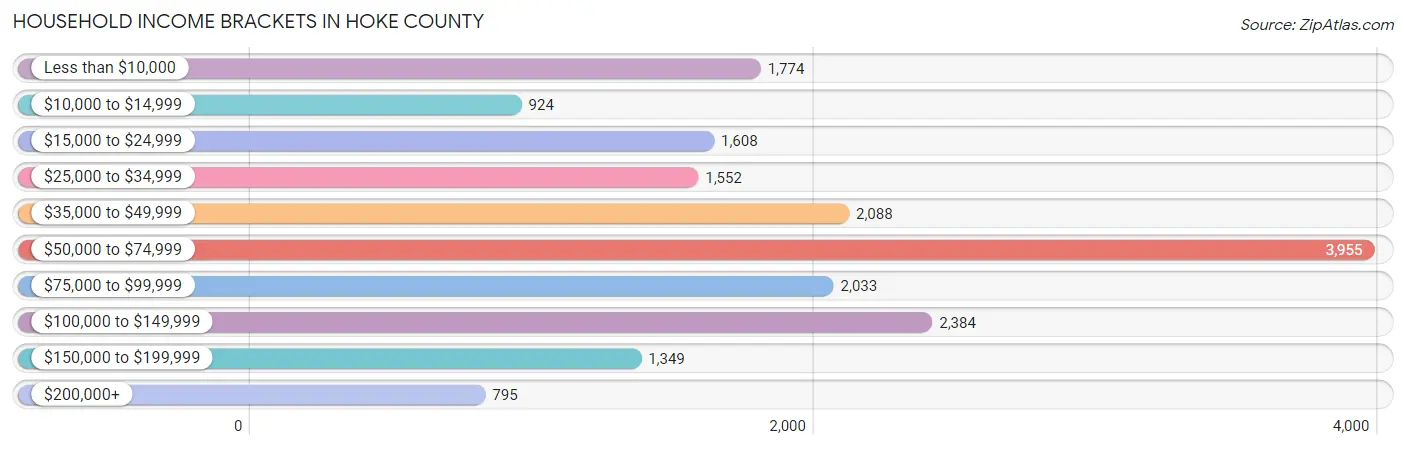
| Income Bracket | # Households | % Households |
| Less than $10,000 | 1,774 | 9.6% |
| $10,000 to $14,999 | 924 | 5.0% |
| $15,000 to $24,999 | 1,608 | 8.7% |
| $25,000 to $34,999 | 1,552 | 8.4% |
| $35,000 to $49,999 | 2,088 | 11.3% |
| $50,000 to $74,999 | 3,955 | 21.4% |
| $75,000 to $99,999 | 2,033 | 11.0% |
| $100,000 to $149,999 | 2,384 | 12.9% |
| $150,000 to $199,999 | 1,349 | 7.3% |
| $200,000+ | 795 | 4.3% |
Household Income by Householder Age in Hoke County
The median household income in Hoke County is $57,141, with the highest median household income of $62,172 found in the 25 to 44 years age bracket for the primary householder. A total of 7,640 households (41.3%) fall into this category. Meanwhile, the 65+ years age bracket for the primary householder has the lowest median household income of $40,701, with 3,668 households (19.9%) in this group.
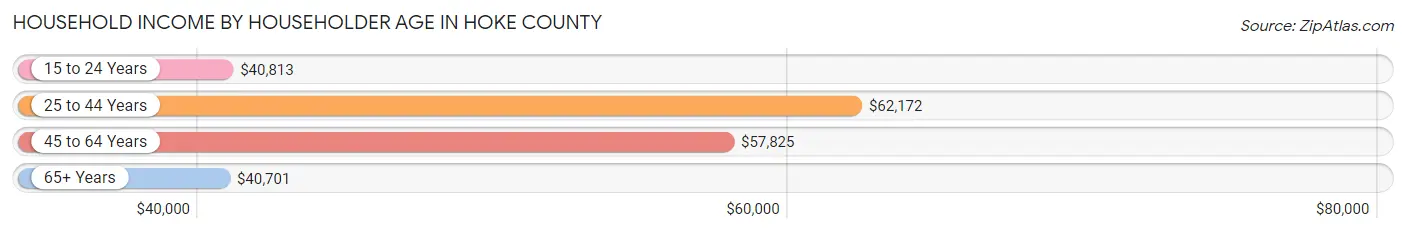
| Income Bracket | # Households | Median Income |
| 15 to 24 Years | 558 (3.0%) | $40,813 |
| 25 to 44 Years | 7,640 (41.3%) | $62,172 |
| 45 to 64 Years | 6,615 (35.8%) | $57,825 |
| 65+ Years | 3,668 (19.9%) | $40,701 |
| Total | 18,481 (100.0%) | $57,141 |
Poverty in Hoke County
Income Below Poverty by Sex and Age in Hoke County
With 15.7% poverty level for males and 18.8% for females among the residents of Hoke County, under 5 year old males and 15 year old females are the most vulnerable to poverty, with 546 males (25.3%) and 89 females (31.0%) in their respective age groups living below the poverty level.
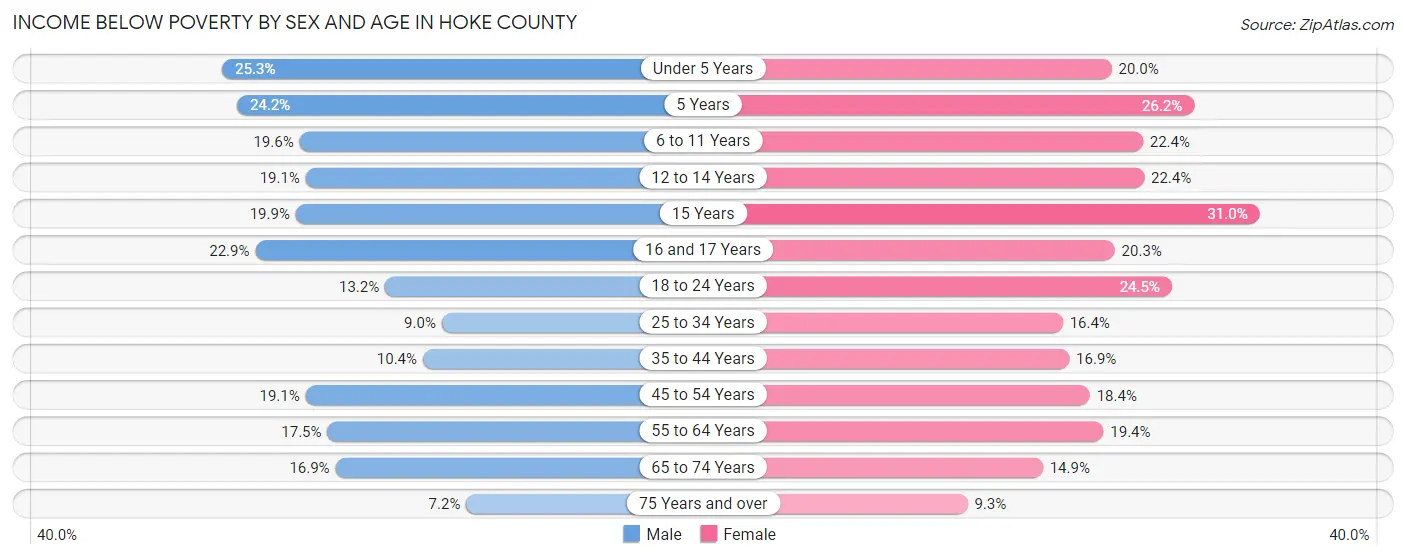
| Age Bracket | Male | Female |
| Under 5 Years | 546 (25.3%) | 389 (20.0%) |
| 5 Years | 47 (24.2%) | 90 (26.2%) |
| 6 to 11 Years | 523 (19.6%) | 480 (22.4%) |
| 12 to 14 Years | 207 (19.1%) | 281 (22.4%) |
| 15 Years | 92 (19.9%) | 89 (31.0%) |
| 16 and 17 Years | 148 (22.9%) | 139 (20.3%) |
| 18 to 24 Years | 258 (13.2%) | 552 (24.5%) |
| 25 to 34 Years | 403 (9.0%) | 705 (16.4%) |
| 35 to 44 Years | 366 (10.4%) | 640 (16.9%) |
| 45 to 54 Years | 518 (19.1%) | 578 (18.4%) |
| 55 to 64 Years | 450 (17.5%) | 593 (19.4%) |
| 65 to 74 Years | 300 (16.9%) | 294 (14.9%) |
| 75 Years and over | 55 (7.2%) | 97 (9.3%) |
| Total | 3,913 (15.7%) | 4,927 (18.8%) |
Income Above Poverty by Sex and Age in Hoke County
According to the poverty statistics in Hoke County, males aged 75 years and over and females aged 75 years and over are the age groups that are most secure financially, with 92.8% of males and 90.7% of females in these age groups living above the poverty line.
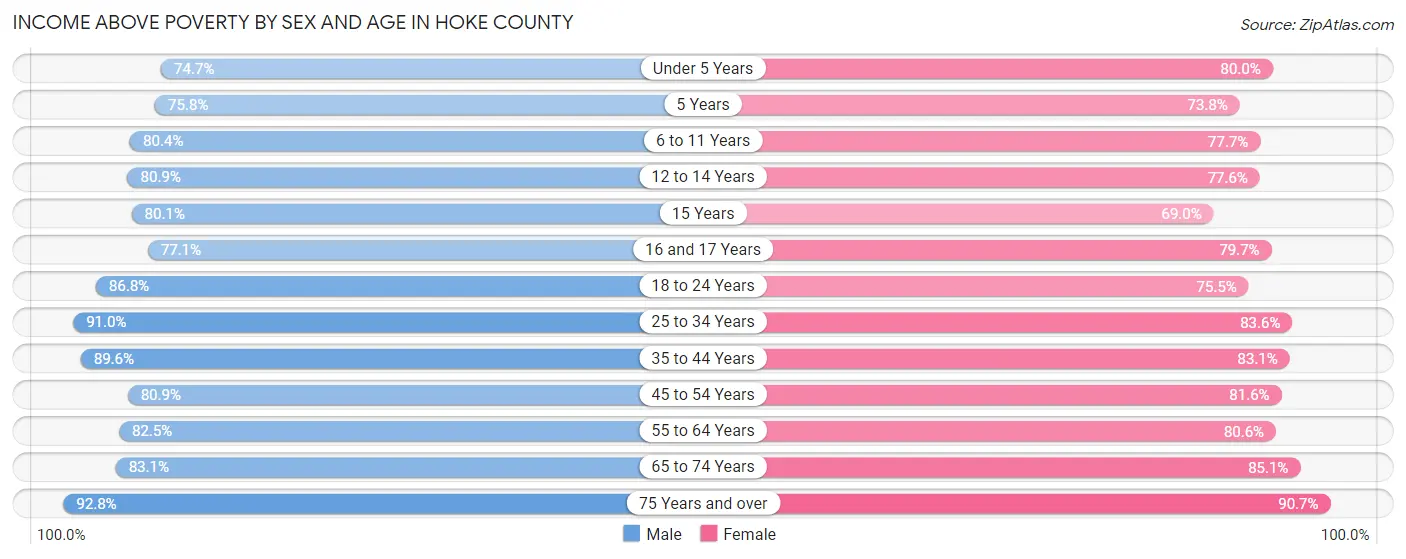
| Age Bracket | Male | Female |
| Under 5 Years | 1,609 (74.7%) | 1,553 (80.0%) |
| 5 Years | 147 (75.8%) | 254 (73.8%) |
| 6 to 11 Years | 2,147 (80.4%) | 1,668 (77.6%) |
| 12 to 14 Years | 875 (80.9%) | 971 (77.6%) |
| 15 Years | 371 (80.1%) | 198 (69.0%) |
| 16 and 17 Years | 499 (77.1%) | 547 (79.7%) |
| 18 to 24 Years | 1,690 (86.8%) | 1,702 (75.5%) |
| 25 to 34 Years | 4,062 (91.0%) | 3,595 (83.6%) |
| 35 to 44 Years | 3,142 (89.6%) | 3,152 (83.1%) |
| 45 to 54 Years | 2,189 (80.9%) | 2,562 (81.6%) |
| 55 to 64 Years | 2,118 (82.5%) | 2,460 (80.6%) |
| 65 to 74 Years | 1,473 (83.1%) | 1,676 (85.1%) |
| 75 Years and over | 708 (92.8%) | 943 (90.7%) |
| Total | 21,030 (84.3%) | 21,281 (81.2%) |
Income Below Poverty Among Married-Couple Families in Hoke County
The poverty statistics for married-couple families in Hoke County show that 7.7% or 663 of the total 8,638 families live below the poverty line. Families with 5 or more children have the highest poverty rate of 46.4%, comprising of 26 families. On the other hand, families with 1 or 2 children have the lowest poverty rate of 6.2%, which includes 217 families.
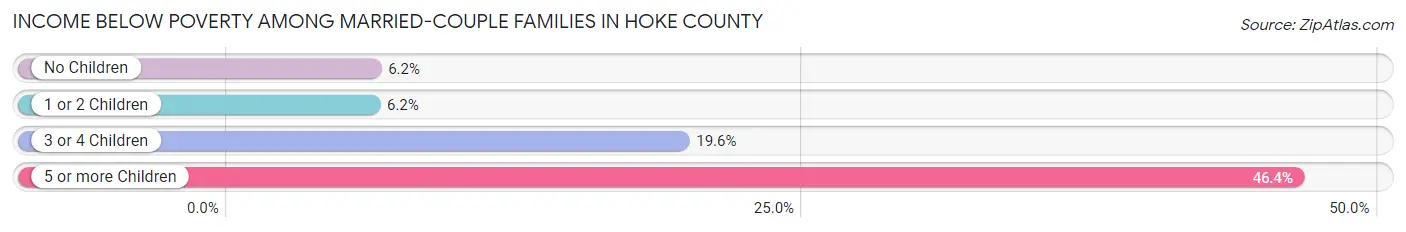
| Children | Above Poverty | Below Poverty |
| No Children | 4,022 (93.8%) | 267 (6.2%) |
| 1 or 2 Children | 3,297 (93.8%) | 217 (6.2%) |
| 3 or 4 Children | 626 (80.4%) | 153 (19.6%) |
| 5 or more Children | 30 (53.6%) | 26 (46.4%) |
| Total | 7,975 (92.3%) | 663 (7.7%) |
Income Below Poverty Among Single-Parent Households in Hoke County
According to the poverty data in Hoke County, 18.1% or 112 single-father households and 28.0% or 750 single-mother households are living below the poverty line. Among single-father households, those with 3 or 4 children have the highest poverty rate, with 23 households (28.1%) experiencing poverty. Likewise, among single-mother households, those with 3 or 4 children have the highest poverty rate, with 167 households (62.5%) falling below the poverty line.
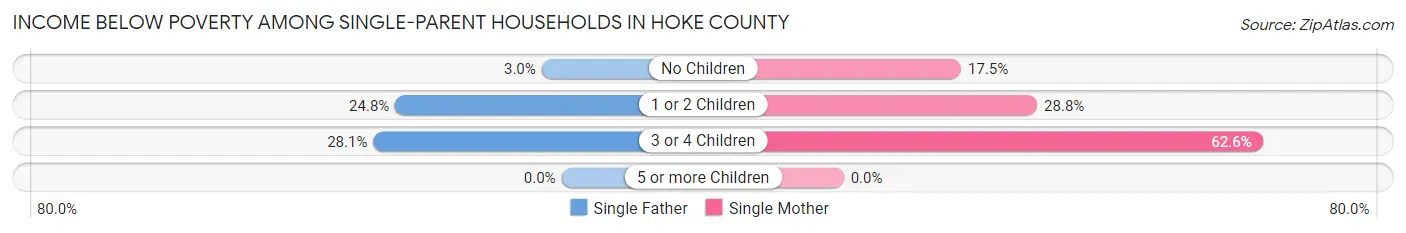
| Children | Single Father | Single Mother |
| No Children | 6 (3.0%) | 158 (17.5%) |
| 1 or 2 Children | 83 (24.8%) | 425 (28.8%) |
| 3 or 4 Children | 23 (28.1%) | 167 (62.5%) |
| 5 or more Children | 0 (0.0%) | 0 (0.0%) |
| Total | 112 (18.1%) | 750 (28.0%) |
Income Below Poverty Among Married-Couple vs Single-Parent Households in Hoke County
The poverty data for Hoke County shows that 663 of the married-couple family households (7.7%) and 862 of the single-parent households (26.1%) are living below the poverty level. Within the married-couple family households, those with 5 or more children have the highest poverty rate, with 26 households (46.4%) falling below the poverty line. Among the single-parent households, those with 3 or 4 children have the highest poverty rate, with 190 household (54.4%) living below poverty.
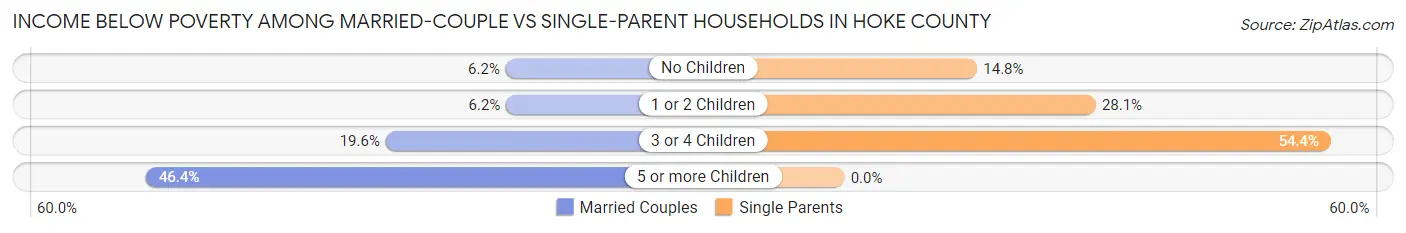
| Children | Married-Couple Families | Single-Parent Households |
| No Children | 267 (6.2%) | 164 (14.8%) |
| 1 or 2 Children | 217 (6.2%) | 508 (28.1%) |
| 3 or 4 Children | 153 (19.6%) | 190 (54.4%) |
| 5 or more Children | 26 (46.4%) | 0 (0.0%) |
| Total | 663 (7.7%) | 862 (26.1%) |
Race in Hoke County
The most populous races in Hoke County are White / Caucasian (22,292 | 42.4%), Black / African American (17,613 | 33.5%), and Hispanic or Latino (7,758 | 14.7%).
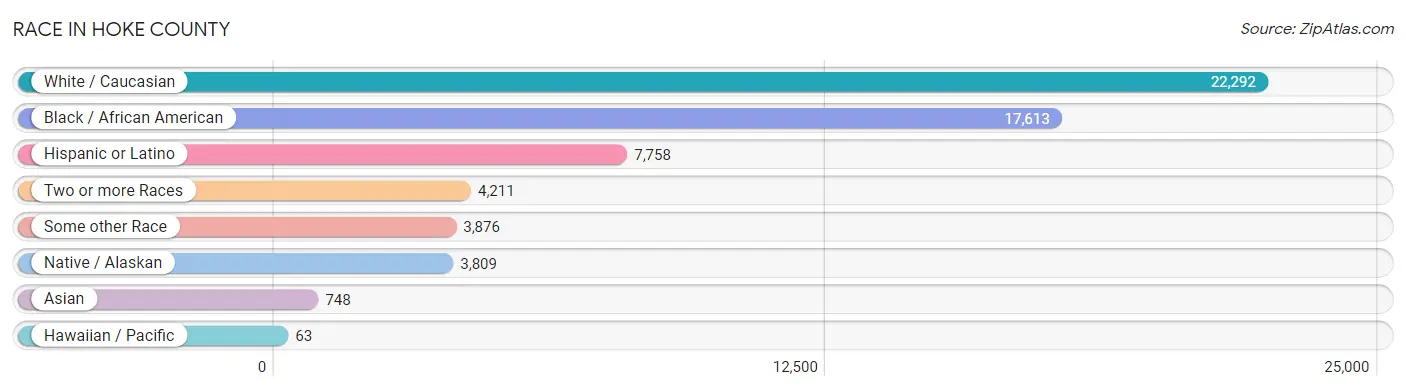
| Race | # Population | % Population |
| Asian | 748 | 1.4% |
| Black / African American | 17,613 | 33.5% |
| Hawaiian / Pacific | 63 | 0.1% |
| Hispanic or Latino | 7,758 | 14.7% |
| Native / Alaskan | 3,809 | 7.2% |
| White / Caucasian | 22,292 | 42.4% |
| Two or more Races | 4,211 | 8.0% |
| Some other Race | 3,876 | 7.4% |
| Total | 52,612 | 100.0% |
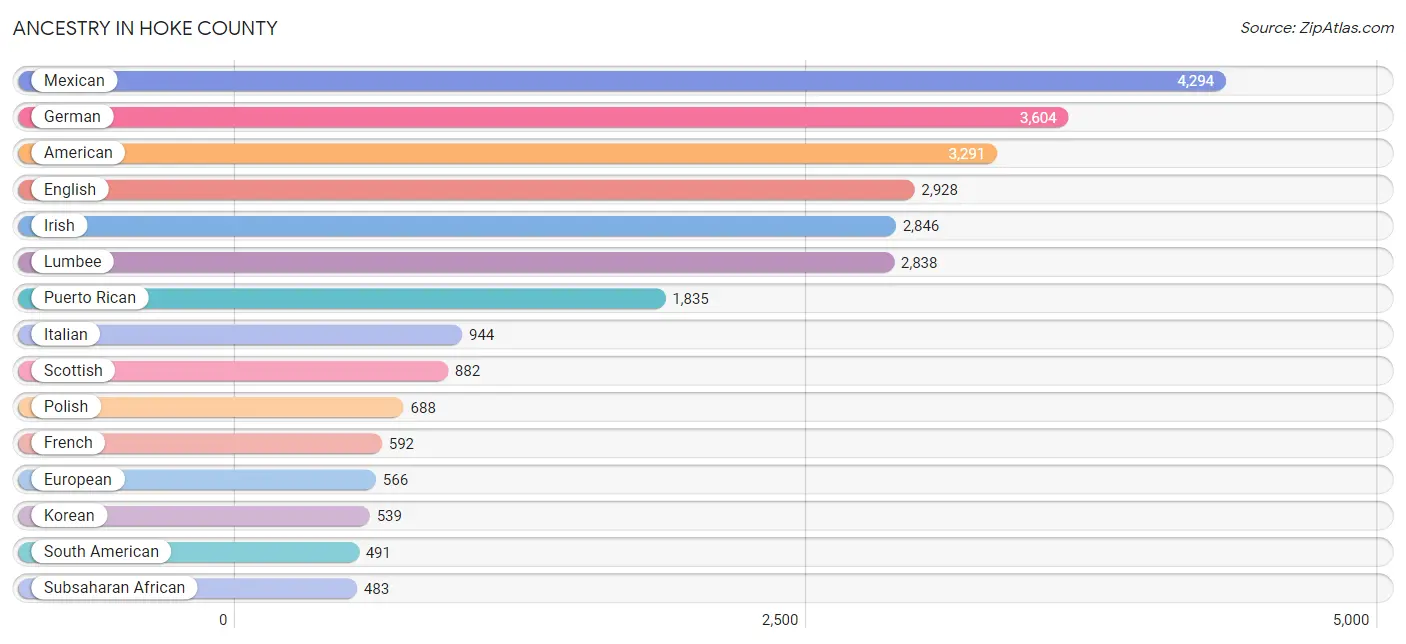
Ancestry in Hoke County
The most populous ancestries reported in Hoke County are Mexican (4,294 | 8.2%), German (3,604 | 6.9%), American (3,291 | 6.3%), English (2,928 | 5.6%), and Irish (2,846 | 5.4%), together accounting for 32.2% of all Hoke County residents.
| Ancestry | # Population | % Population |
| African | 450 | 0.9% |
| Albanian | 2 | 0.0% |
| American | 3,291 | 6.3% |
| Arab | 150 | 0.3% |
| Argentinean | 23 | 0.0% |
| Austrian | 19 | 0.0% |
| Bangladeshi | 34 | 0.1% |
| Bhutanese | 268 | 0.5% |
| Blackfeet | 93 | 0.2% |
| Brazilian | 26 | 0.1% |
| British | 210 | 0.4% |
| British West Indian | 20 | 0.0% |
| Burmese | 278 | 0.5% |
| Canadian | 15 | 0.0% |
| Central American | 450 | 0.9% |
| Central American Indian | 13 | 0.0% |
| Cherokee | 417 | 0.8% |
| Chilean | 174 | 0.3% |
| Choctaw | 15 | 0.0% |
| Colombian | 116 | 0.2% |
| Creek | 16 | 0.0% |
| Cuban | 171 | 0.3% |
| Czech | 109 | 0.2% |
| Danish | 110 | 0.2% |
| Dominican | 247 | 0.5% |
| Dutch | 272 | 0.5% |
| Eastern European | 82 | 0.2% |
| English | 2,928 | 5.6% |
| European | 566 | 1.1% |
| French | 592 | 1.1% |
| French Canadian | 213 | 0.4% |
| German | 3,604 | 6.9% |
| Greek | 81 | 0.2% |
| Guamanian / Chamorro | 187 | 0.4% |
| Guatemalan | 64 | 0.1% |
| Guyanese | 9 | 0.0% |
| Honduran | 49 | 0.1% |
| Hungarian | 43 | 0.1% |
| Indian (Asian) | 196 | 0.4% |
| Indonesian | 131 | 0.3% |
| Irish | 2,846 | 5.4% |
| Iroquois | 120 | 0.2% |
| Israeli | 16 | 0.0% |
| Italian | 944 | 1.8% |
| Jamaican | 71 | 0.1% |
| Korean | 539 | 1.0% |
| Lebanese | 142 | 0.3% |
| Lumbee | 2,838 | 5.4% |
| Mexican | 4,294 | 8.2% |
| Mexican American Indian | 77 | 0.2% |
| Moroccan | 8 | 0.0% |
| Native Hawaiian | 302 | 0.6% |
| Nepalese | 27 | 0.1% |
| Nicaraguan | 20 | 0.0% |
| Nigerian | 33 | 0.1% |
| Northern European | 42 | 0.1% |
| Norwegian | 64 | 0.1% |
| Panamanian | 243 | 0.5% |
| Peruvian | 124 | 0.2% |
| Polish | 688 | 1.3% |
| Portuguese | 7 | 0.0% |
| Puerto Rican | 1,835 | 3.5% |
| Romanian | 31 | 0.1% |
| Russian | 120 | 0.2% |
| Salvadoran | 74 | 0.1% |
| Samoan | 73 | 0.1% |
| Scandinavian | 136 | 0.3% |
| Scotch-Irish | 417 | 0.8% |
| Scottish | 882 | 1.7% |
| Sioux | 36 | 0.1% |
| Slovak | 6 | 0.0% |
| South American | 491 | 0.9% |
| South American Indian | 8 | 0.0% |
| Spaniard | 84 | 0.2% |
| Sri Lankan | 259 | 0.5% |
| Subsaharan African | 483 | 0.9% |
| Swedish | 152 | 0.3% |
| Swiss | 20 | 0.0% |
| Thai | 56 | 0.1% |
| Ukrainian | 57 | 0.1% |
| Venezuelan | 54 | 0.1% |
| Welsh | 176 | 0.3% |
| West Indian | 135 | 0.3% | View All 83 Rows |
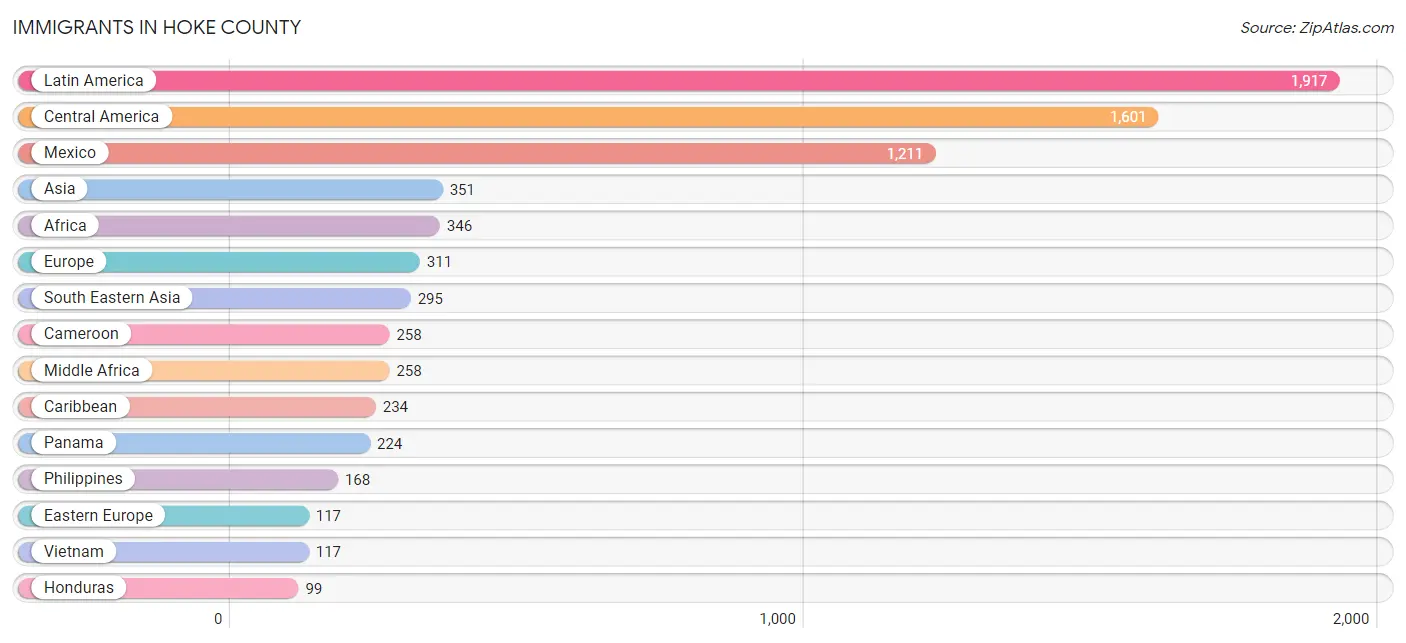
Immigrants in Hoke County
The most numerous immigrant groups reported in Hoke County came from Latin America (1,917 | 3.6%), Central America (1,601 | 3.0%), Mexico (1,211 | 2.3%), Asia (351 | 0.7%), and Africa (346 | 0.7%), together accounting for 10.3% of all Hoke County residents.
| Immigration Origin | # Population | % Population |
| Africa | 346 | 0.7% |
| Argentina | 10 | 0.0% |
| Asia | 351 | 0.7% |
| Cameroon | 258 | 0.5% |
| Canada | 38 | 0.1% |
| Caribbean | 234 | 0.4% |
| Central America | 1,601 | 3.0% |
| Chile | 6 | 0.0% |
| China | 12 | 0.0% |
| Colombia | 29 | 0.1% |
| Cuba | 7 | 0.0% |
| Dominica | 7 | 0.0% |
| Dominican Republic | 96 | 0.2% |
| Eastern Asia | 47 | 0.1% |
| Eastern Europe | 117 | 0.2% |
| El Salvador | 20 | 0.0% |
| England | 78 | 0.2% |
| Europe | 311 | 0.6% |
| Germany | 94 | 0.2% |
| Guatemala | 47 | 0.1% |
| Guyana | 9 | 0.0% |
| Honduras | 99 | 0.2% |
| India | 6 | 0.0% |
| Italy | 10 | 0.0% |
| Jamaica | 11 | 0.0% |
| Korea | 35 | 0.1% |
| Laos | 5 | 0.0% |
| Latin America | 1,917 | 3.6% |
| Mexico | 1,211 | 2.3% |
| Middle Africa | 258 | 0.5% |
| Nigeria | 33 | 0.1% |
| Northern Europe | 88 | 0.2% |
| Oceania | 19 | 0.0% |
| Pakistan | 3 | 0.0% |
| Panama | 224 | 0.4% |
| Peru | 15 | 0.0% |
| Philippines | 168 | 0.3% |
| Russia | 51 | 0.1% |
| South America | 82 | 0.2% |
| South Central Asia | 9 | 0.0% |
| South Eastern Asia | 295 | 0.6% |
| Southern Europe | 10 | 0.0% |
| Thailand | 5 | 0.0% |
| Trinidad and Tobago | 52 | 0.1% |
| Ukraine | 66 | 0.1% |
| Venezuela | 13 | 0.0% |
| Vietnam | 117 | 0.2% |
| Western Africa | 33 | 0.1% |
| Western Europe | 94 | 0.2% | View All 49 Rows |
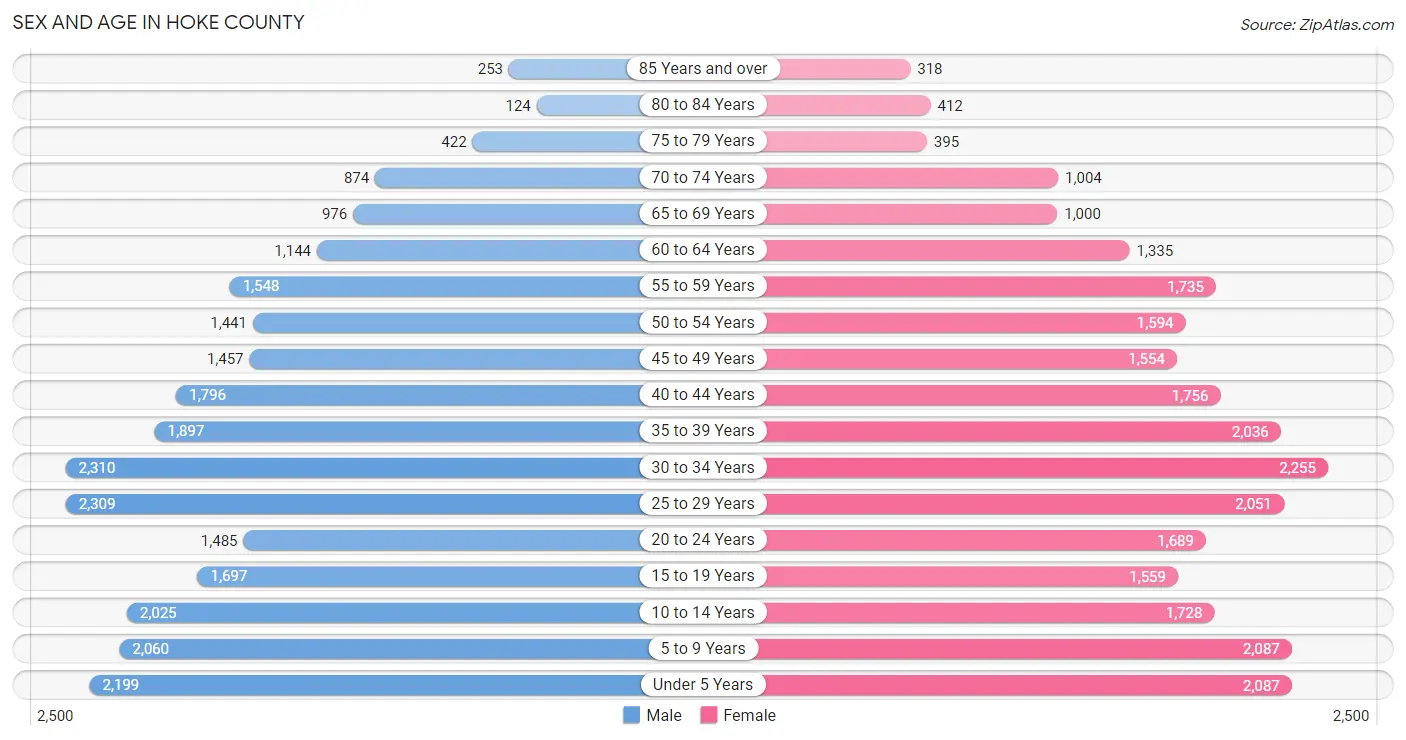
Sex and Age in Hoke County
Sex and Age in Hoke County
The most populous age groups in Hoke County are 30 to 34 Years (2,310 | 8.9%) for men and 30 to 34 Years (2,255 | 8.5%) for women.
| Age Bracket | Male | Female |
| Under 5 Years | 2,199 (8.5%) | 2,087 (7.9%) |
| 5 to 9 Years | 2,060 (7.9%) | 2,087 (7.9%) |
| 10 to 14 Years | 2,025 (7.8%) | 1,728 (6.5%) |
| 15 to 19 Years | 1,697 (6.5%) | 1,559 (5.9%) |
| 20 to 24 Years | 1,485 (5.7%) | 1,689 (6.4%) |
| 25 to 29 Years | 2,309 (8.9%) | 2,051 (7.7%) |
| 30 to 34 Years | 2,310 (8.9%) | 2,255 (8.5%) |
| 35 to 39 Years | 1,897 (7.3%) | 2,036 (7.7%) |
| 40 to 44 Years | 1,796 (6.9%) | 1,756 (6.6%) |
| 45 to 49 Years | 1,457 (5.6%) | 1,554 (5.8%) |
| 50 to 54 Years | 1,441 (5.5%) | 1,594 (6.0%) |
| 55 to 59 Years | 1,548 (5.9%) | 1,735 (6.5%) |
| 60 to 64 Years | 1,144 (4.4%) | 1,335 (5.0%) |
| 65 to 69 Years | 976 (3.7%) | 1,000 (3.8%) |
| 70 to 74 Years | 874 (3.4%) | 1,004 (3.8%) |
| 75 to 79 Years | 422 (1.6%) | 395 (1.5%) |
| 80 to 84 Years | 124 (0.5%) | 412 (1.5%) |
| 85 Years and over | 253 (1.0%) | 318 (1.2%) |
| Total | 26,017 (100.0%) | 26,595 (100.0%) |
Families and Households in Hoke County
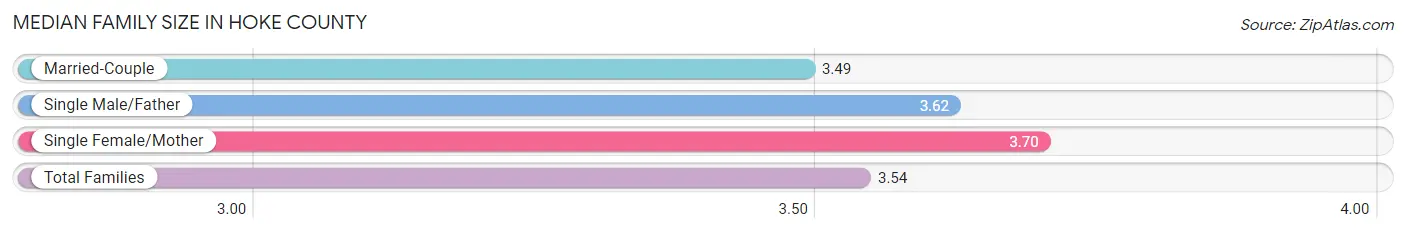
Median Family Size in Hoke County
The median family size in Hoke County is 3.54 persons per family, with single female/mother families (2,678 | 22.4%) accounting for the largest median family size of 3.7 persons per family. On the other hand, married-couple families (8,638 | 72.4%) represent the smallest median family size with 3.49 persons per family.
| Family Type | # Families | Family Size |
| Married-Couple | 8,638 (72.4%) | 3.49 |
| Single Male/Father | 620 (5.2%) | 3.62 |
| Single Female/Mother | 2,678 (22.4%) | 3.70 |
| Total Families | 11,936 (100.0%) | 3.54 |
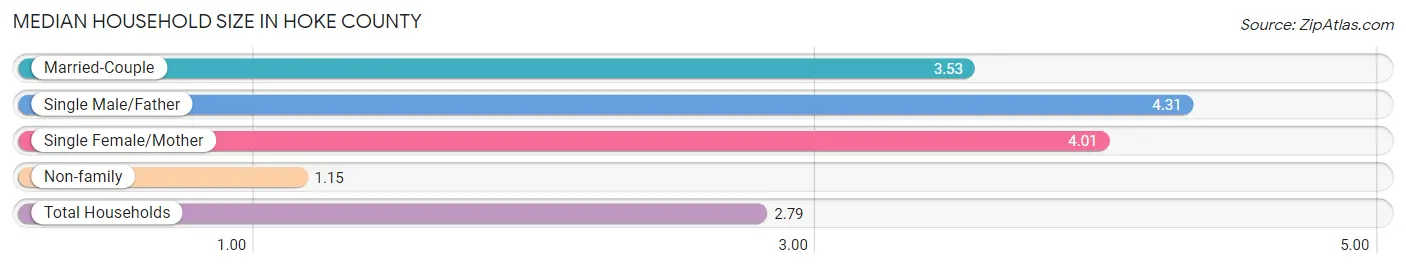
Median Household Size in Hoke County
The median household size in Hoke County is 2.79 persons per household, with single male/father households (620 | 3.4%) accounting for the largest median household size of 4.31 persons per household. non-family households (6,545 | 35.4%) represent the smallest median household size with 1.15 persons per household.
| Household Type | # Households | Household Size |
| Married-Couple | 8,638 (46.7%) | 3.53 |
| Single Male/Father | 620 (3.4%) | 4.31 |
| Single Female/Mother | 2,678 (14.5%) | 4.01 |
| Non-family | 6,545 (35.4%) | 1.15 |
| Total Households | 18,481 (100.0%) | 2.79 |
Household Size by Marriage Status in Hoke County
Out of a total of 18,481 households in Hoke County, 11,936 (64.6%) are family households, while 6,545 (35.4%) are nonfamily households. The most numerous type of family households are 2-person households, comprising 4,526, and the most common type of nonfamily households are 1-person households, comprising 5,940.
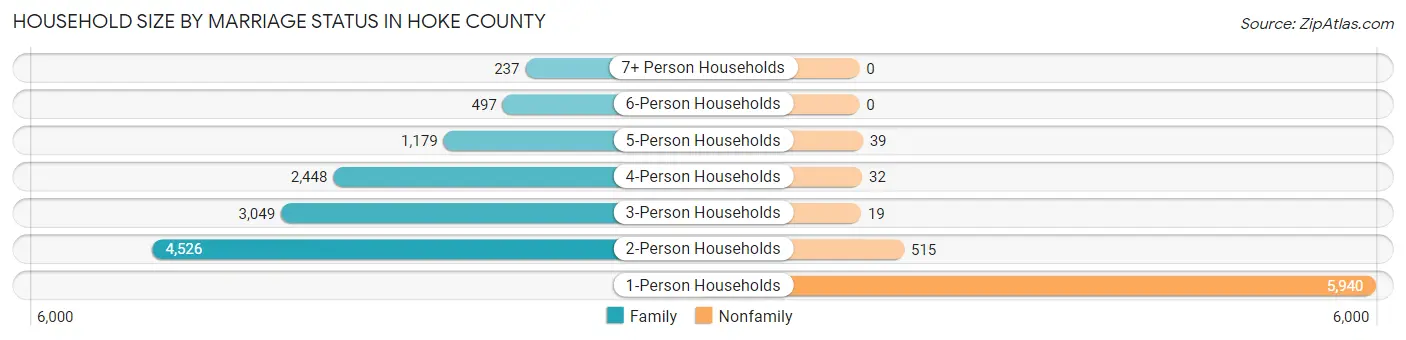
| Household Size | Family Households | Nonfamily Households |
| 1-Person Households | - | 5,940 (32.1%) |
| 2-Person Households | 4,526 (24.5%) | 515 (2.8%) |
| 3-Person Households | 3,049 (16.5%) | 19 (0.1%) |
| 4-Person Households | 2,448 (13.3%) | 32 (0.2%) |
| 5-Person Households | 1,179 (6.4%) | 39 (0.2%) |
| 6-Person Households | 497 (2.7%) | 0 (0.0%) |
| 7+ Person Households | 237 (1.3%) | 0 (0.0%) |
| Total | 11,936 (64.6%) | 6,545 (35.4%) |
Female Fertility in Hoke County
Fertility by Age in Hoke County
Average fertility rate in Hoke County is 65.0 births per 1,000 women. Women in the age bracket of 20 to 34 years have the highest fertility rate with 117.0 births per 1,000 women. Women in the age bracket of 20 to 34 years acount for 82.2% of all women with births.
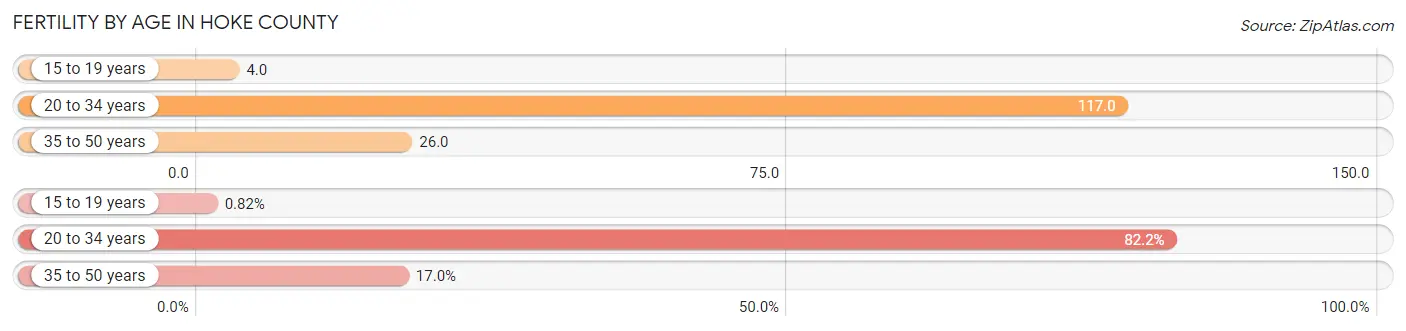
| Age Bracket | Women with Births | Births / 1,000 Women |
| 15 to 19 years | 7 (0.8%) | 4.0 |
| 20 to 34 years | 704 (82.2%) | 117.0 |
| 35 to 50 years | 146 (17.0%) | 26.0 |
| Total | 857 (100.0%) | 65.0 |
Fertility by Age by Marriage Status in Hoke County
70.8% of women with births (857) in Hoke County are married. The highest percentage of unmarried women with births falls into 20 to 34 years age bracket with 32.7% of them unmarried at the time of birth, while the lowest percentage of unmarried women with births belong to 15 to 19 years age bracket with 0.0% of them unmarried.
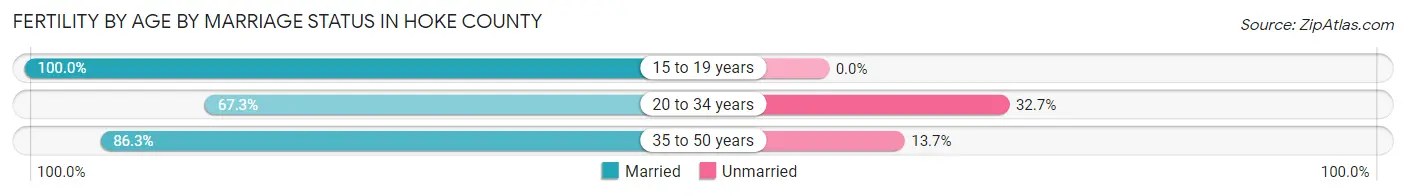
| Age Bracket | Married | Unmarried |
| 15 to 19 years | 7 (100.0%) | 0 (0.0%) |
| 20 to 34 years | 474 (67.3%) | 230 (32.7%) |
| 35 to 50 years | 126 (86.3%) | 20 (13.7%) |
| Total | 607 (70.8%) | 250 (29.2%) |
Fertility by Education in Hoke County
Average fertility rate in Hoke County is 65.0 births per 1,000 women. Women with the education attainment of graduate degree have the highest fertility rate of 80.0 births per 1,000 women, while women with the education attainment of high school diploma have the lowest fertility at 46.0 births per 1,000 women. Women with the education attainment of college or associate's degree represent 44.5% of all women with births.
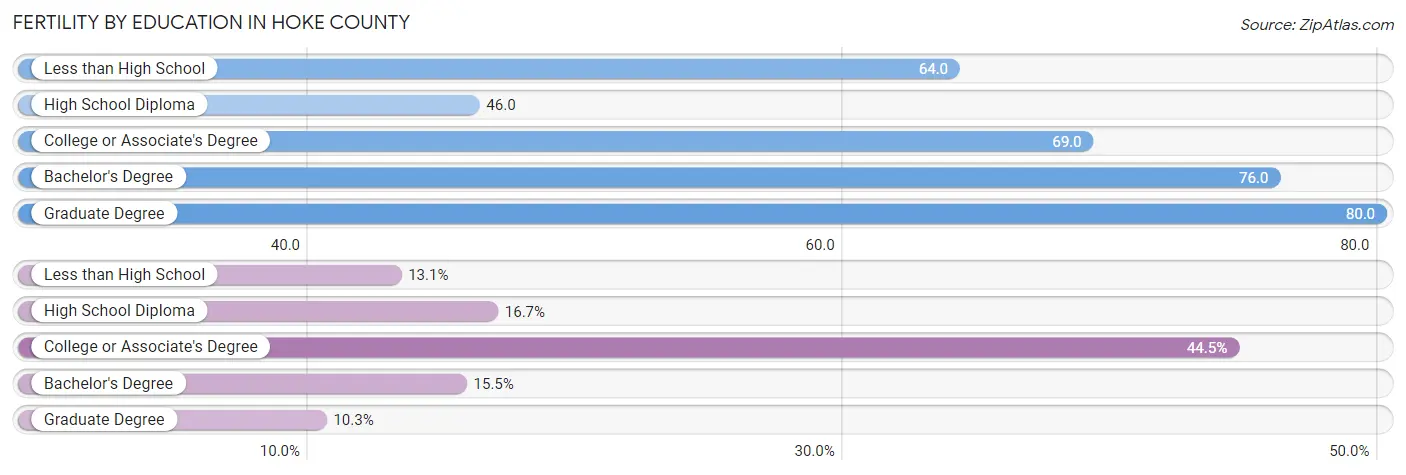
| Educational Attainment | Women with Births | Births / 1,000 Women |
| Less than High School | 112 (13.1%) | 64.0 |
| High School Diploma | 143 (16.7%) | 46.0 |
| College or Associate's Degree | 381 (44.5%) | 69.0 |
| Bachelor's Degree | 133 (15.5%) | 76.0 |
| Graduate Degree | 88 (10.3%) | 80.0 |
| Total | 857 (100.0%) | 65.0 |
Fertility by Education by Marriage Status in Hoke County
29.2% of women with births in Hoke County are unmarried. Women with the educational attainment of graduate degree are most likely to be married with 100.0% of them married at childbirth, while women with the educational attainment of high school diploma are least likely to be married with 48.2% of them unmarried at childbirth.
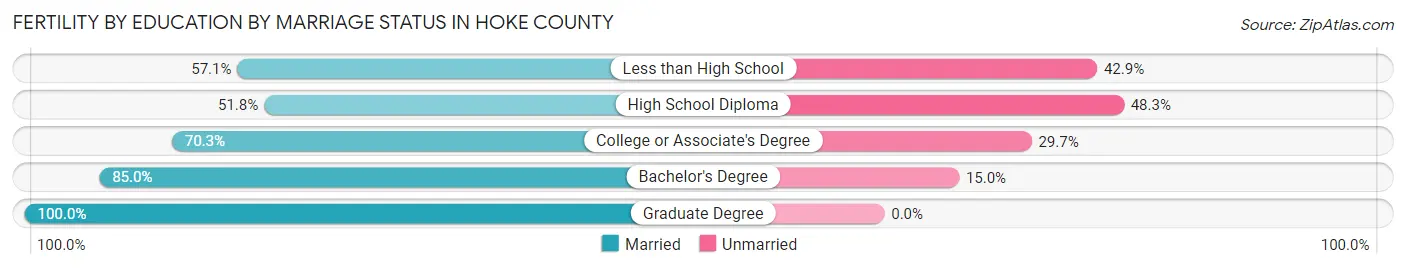
| Educational Attainment | Married | Unmarried |
| Less than High School | 64 (57.1%) | 48 (42.9%) |
| High School Diploma | 74 (51.7%) | 69 (48.2%) |
| College or Associate's Degree | 268 (70.3%) | 113 (29.7%) |
| Bachelor's Degree | 113 (85.0%) | 20 (15.0%) |
| Graduate Degree | 88 (100.0%) | 0 (0.0%) |
| Total | 607 (70.8%) | 250 (29.2%) |
Employment Characteristics in Hoke County
Employment by Class of Employer in Hoke County
Among the 21,569 employed individuals in Hoke County, private company employees (12,041 | 55.8%), federal government employees (4,564 | 21.2%), and local government employees (1,224 | 5.7%) make up the most common classes of employment.
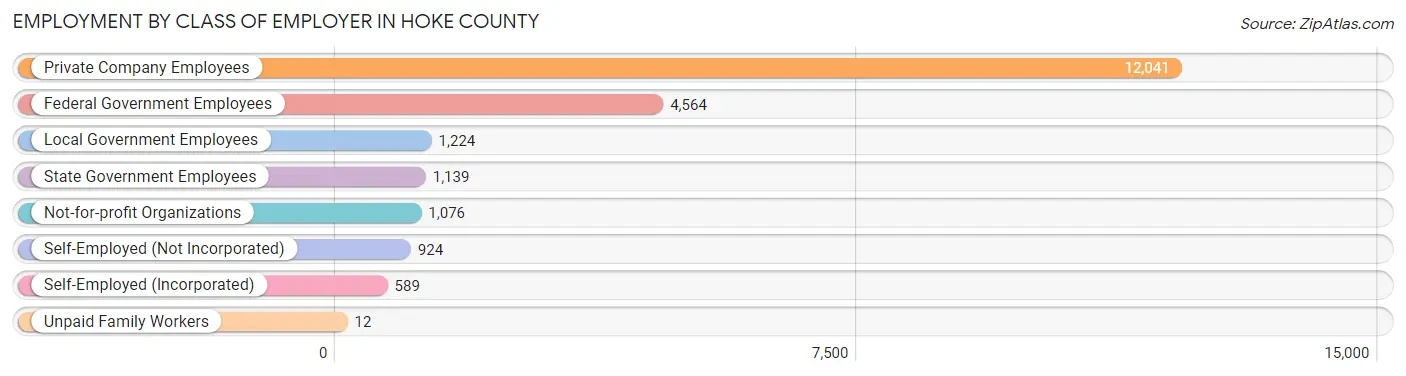
| Employer Class | # Employees | % Employees |
| Private Company Employees | 12,041 | 55.8% |
| Self-Employed (Incorporated) | 589 | 2.7% |
| Self-Employed (Not Incorporated) | 924 | 4.3% |
| Not-for-profit Organizations | 1,076 | 5.0% |
| Local Government Employees | 1,224 | 5.7% |
| State Government Employees | 1,139 | 5.3% |
| Federal Government Employees | 4,564 | 21.2% |
| Unpaid Family Workers | 12 | 0.1% |
| Total | 21,569 | 100.0% |
Employment Status by Age in Hoke County
According to the labor force statistics for Hoke County, out of the total population over 16 years of age (39,673), 58.3% or 23,129 individuals are in the labor force, with 6.4% or 1,480 of them unemployed. The age group with the highest labor force participation rate is 30 to 34 years, with 80.3% or 3,666 individuals in the labor force. Within the labor force, the 20 to 24 years age range has the highest percentage of unemployed individuals, with 14.1% or 325 of them being unemployed.
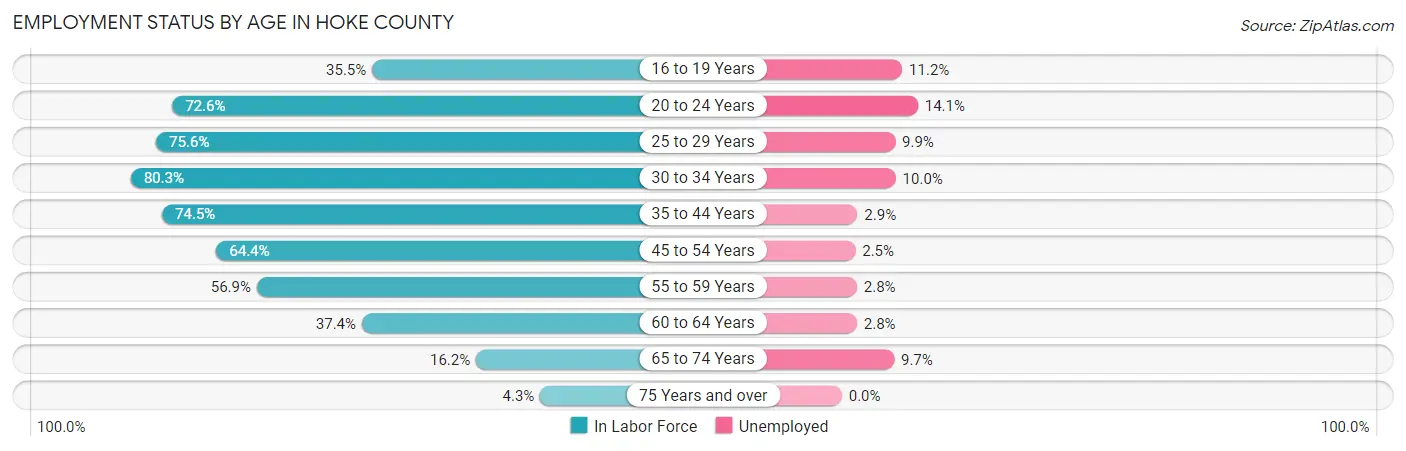
| Age Bracket | In Labor Force | Unemployed |
| 16 to 19 Years | 889 (35.5%) | 100 (11.2%) |
| 20 to 24 Years | 2,304 (72.6%) | 325 (14.1%) |
| 25 to 29 Years | 3,296 (75.6%) | 326 (9.9%) |
| 30 to 34 Years | 3,666 (80.3%) | 367 (10.0%) |
| 35 to 44 Years | 5,576 (74.5%) | 162 (2.9%) |
| 45 to 54 Years | 3,894 (64.4%) | 97 (2.5%) |
| 55 to 59 Years | 1,868 (56.9%) | 52 (2.8%) |
| 60 to 64 Years | 927 (37.4%) | 26 (2.8%) |
| 65 to 74 Years | 624 (16.2%) | 61 (9.7%) |
| 75 Years and over | 83 (4.3%) | 0 (0.0%) |
| Total | 23,129 (58.3%) | 1,480 (6.4%) |
Employment Status by Educational Attainment in Hoke County
According to labor force statistics for Hoke County, 68.1% of individuals (19,216) out of the total population between 25 and 64 years of age (28,218) are in the labor force, with 5.1% or 980 of them being unemployed. The group with the highest labor force participation rate are those with the educational attainment of bachelor's degree or higher, with 82.2% or 4,948 individuals in the labor force. Within the labor force, individuals with less than high school education have the highest percentage of unemployment, with 6.8% or 103 of them being unemployed.
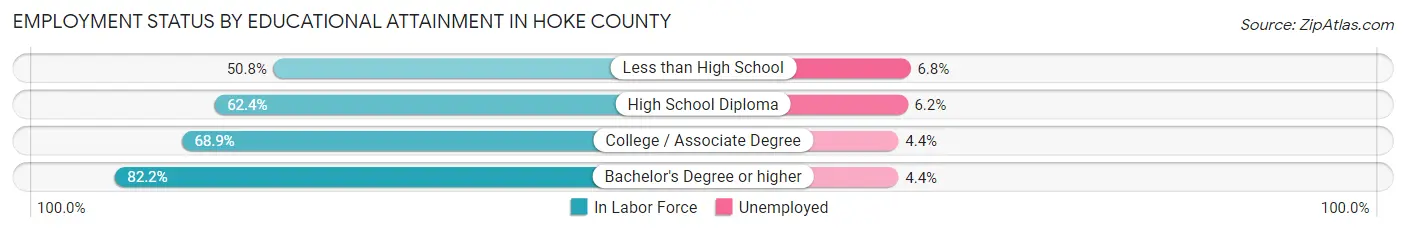
| Educational Attainment | In Labor Force | Unemployed |
| Less than High School | 1,515 (50.8%) | 203 (6.8%) |
| High School Diploma | 4,584 (62.4%) | 455 (6.2%) |
| College / Associate Degree | 8,179 (68.9%) | 522 (4.4%) |
| Bachelor's Degree or higher | 4,948 (82.2%) | 265 (4.4%) |
| Total | 19,216 (68.1%) | 1,439 (5.1%) |
Employment Occupations by Sex in Hoke County
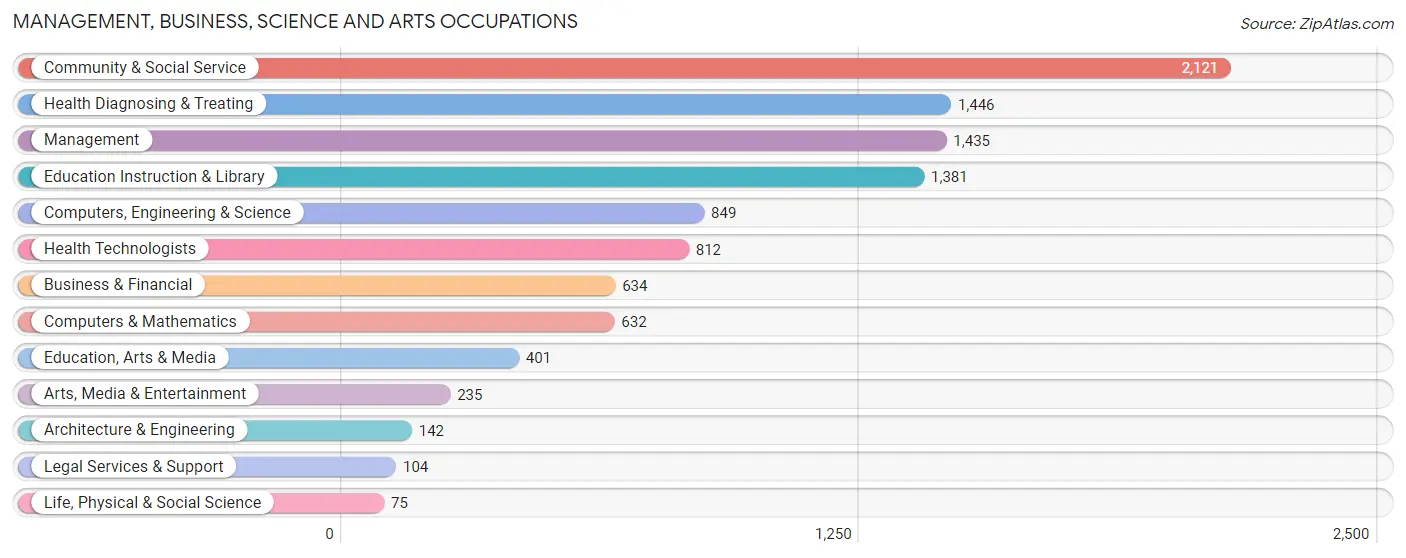
Management, Business, Science and Arts Occupations
The most common Management, Business, Science and Arts occupations in Hoke County are Community & Social Service (2,121 | 11.1%), Health Diagnosing & Treating (1,446 | 7.5%), Management (1,435 | 7.5%), Education Instruction & Library (1,381 | 7.2%), and Computers, Engineering & Science (849 | 4.4%).
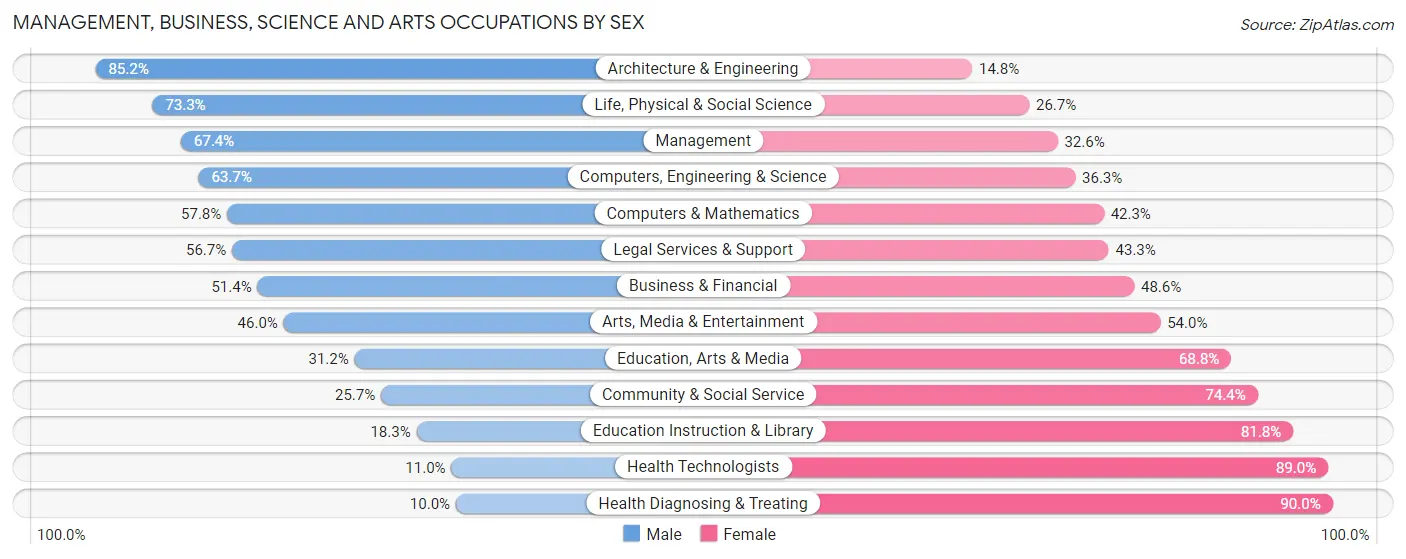
Management, Business, Science and Arts Occupations by Sex
Within the Management, Business, Science and Arts occupations in Hoke County, the most male-oriented occupations are Architecture & Engineering (85.2%), Life, Physical & Social Science (73.3%), and Management (67.4%), while the most female-oriented occupations are Health Diagnosing & Treating (90.0%), Health Technologists (89.0%), and Education Instruction & Library (81.8%).
| Occupation | Male | Female |
| Management | 967 (67.4%) | 468 (32.6%) |
| Business & Financial | 326 (51.4%) | 308 (48.6%) |
| Computers, Engineering & Science | 541 (63.7%) | 308 (36.3%) |
| Computers & Mathematics | 365 (57.8%) | 267 (42.2%) |
| Architecture & Engineering | 121 (85.2%) | 21 (14.8%) |
| Life, Physical & Social Science | 55 (73.3%) | 20 (26.7%) |
| Community & Social Service | 544 (25.7%) | 1,577 (74.4%) |
| Education, Arts & Media | 125 (31.2%) | 276 (68.8%) |
| Legal Services & Support | 59 (56.7%) | 45 (43.3%) |
| Education Instruction & Library | 252 (18.2%) | 1,129 (81.8%) |
| Arts, Media & Entertainment | 108 (46.0%) | 127 (54.0%) |
| Health Diagnosing & Treating | 145 (10.0%) | 1,301 (90.0%) |
| Health Technologists | 89 (11.0%) | 723 (89.0%) |
| Total (Category) | 2,523 (38.9%) | 3,962 (61.1%) |
| Total (Overall) | 9,066 (47.2%) | 10,122 (52.7%) |
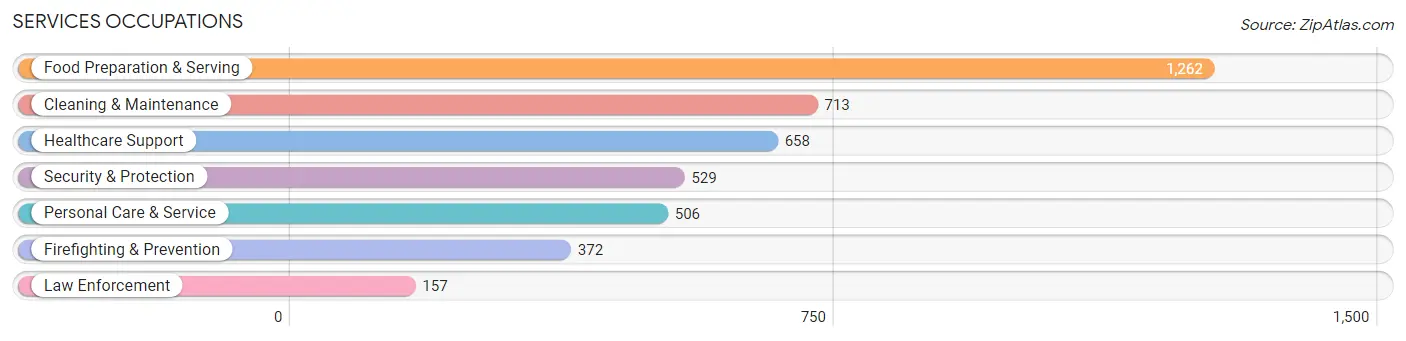
Services Occupations
The most common Services occupations in Hoke County are Food Preparation & Serving (1,262 | 6.6%), Cleaning & Maintenance (713 | 3.7%), Healthcare Support (658 | 3.4%), Security & Protection (529 | 2.8%), and Personal Care & Service (506 | 2.6%).
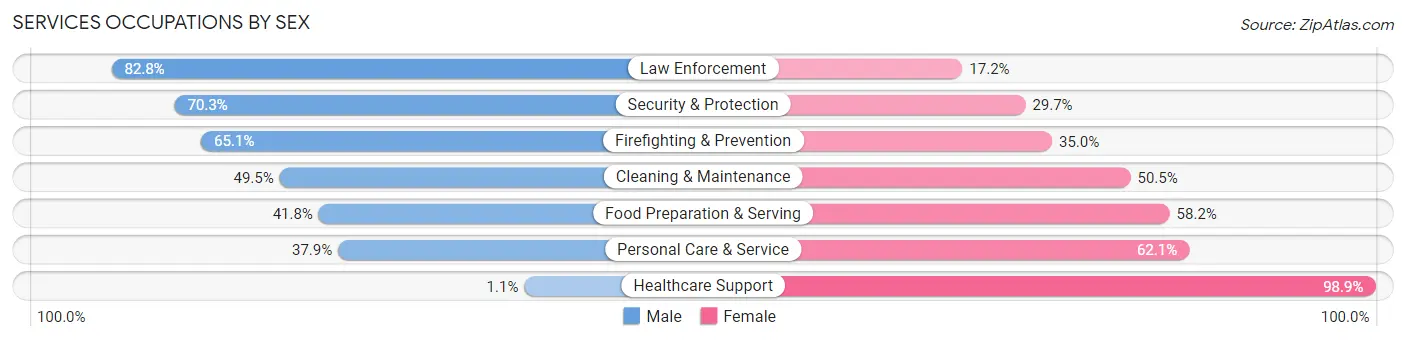
Services Occupations by Sex
Within the Services occupations in Hoke County, the most male-oriented occupations are Law Enforcement (82.8%), Security & Protection (70.3%), and Firefighting & Prevention (65.0%), while the most female-oriented occupations are Healthcare Support (98.9%), Personal Care & Service (62.1%), and Food Preparation & Serving (58.2%).
| Occupation | Male | Female |
| Healthcare Support | 7 (1.1%) | 651 (98.9%) |
| Security & Protection | 372 (70.3%) | 157 (29.7%) |
| Firefighting & Prevention | 242 (65.0%) | 130 (34.9%) |
| Law Enforcement | 130 (82.8%) | 27 (17.2%) |
| Food Preparation & Serving | 527 (41.8%) | 735 (58.2%) |
| Cleaning & Maintenance | 353 (49.5%) | 360 (50.5%) |
| Personal Care & Service | 192 (37.9%) | 314 (62.1%) |
| Total (Category) | 1,451 (39.6%) | 2,217 (60.4%) |
| Total (Overall) | 9,066 (47.2%) | 10,122 (52.7%) |
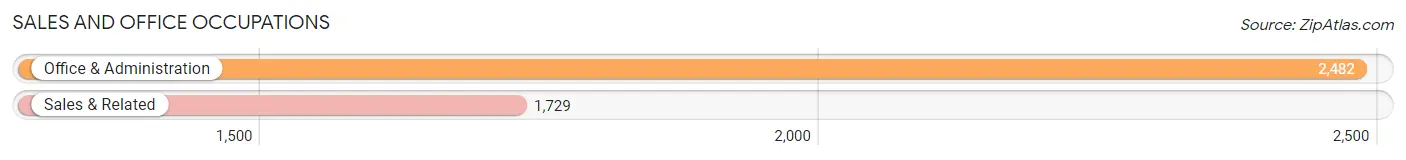
Sales and Office Occupations
The most common Sales and Office occupations in Hoke County are Office & Administration (2,482 | 12.9%), and Sales & Related (1,729 | 9.0%).
Sales and Office Occupations by Sex
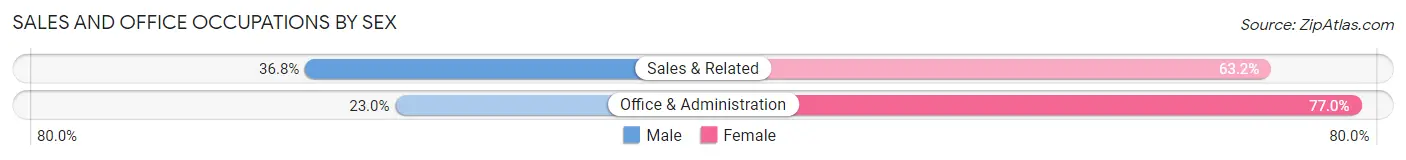
| Occupation | Male | Female |
| Sales & Related | 637 (36.8%) | 1,092 (63.2%) |
| Office & Administration | 570 (23.0%) | 1,912 (77.0%) |
| Total (Category) | 1,207 (28.7%) | 3,004 (71.3%) |
| Total (Overall) | 9,066 (47.2%) | 10,122 (52.7%) |
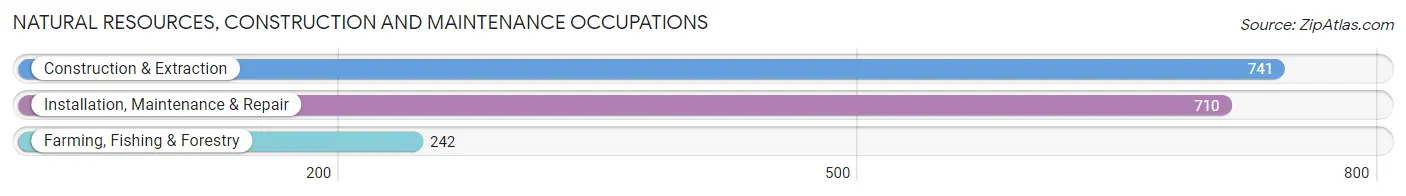
Natural Resources, Construction and Maintenance Occupations
The most common Natural Resources, Construction and Maintenance occupations in Hoke County are Construction & Extraction (741 | 3.9%), Installation, Maintenance & Repair (710 | 3.7%), and Farming, Fishing & Forestry (242 | 1.3%).
Natural Resources, Construction and Maintenance Occupations by Sex
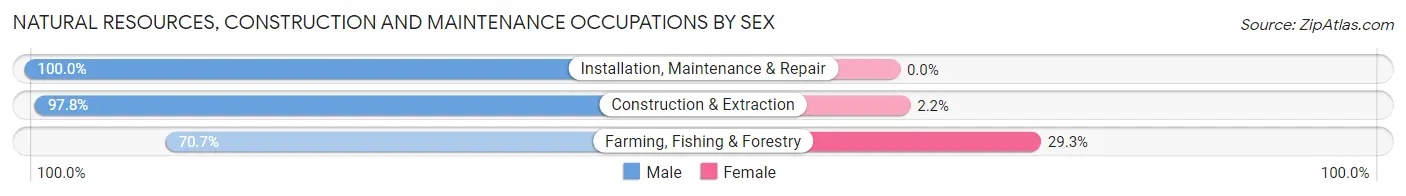
| Occupation | Male | Female |
| Farming, Fishing & Forestry | 171 (70.7%) | 71 (29.3%) |
| Construction & Extraction | 725 (97.8%) | 16 (2.2%) |
| Installation, Maintenance & Repair | 710 (100.0%) | 0 (0.0%) |
| Total (Category) | 1,606 (94.9%) | 87 (5.1%) |
| Total (Overall) | 9,066 (47.2%) | 10,122 (52.7%) |
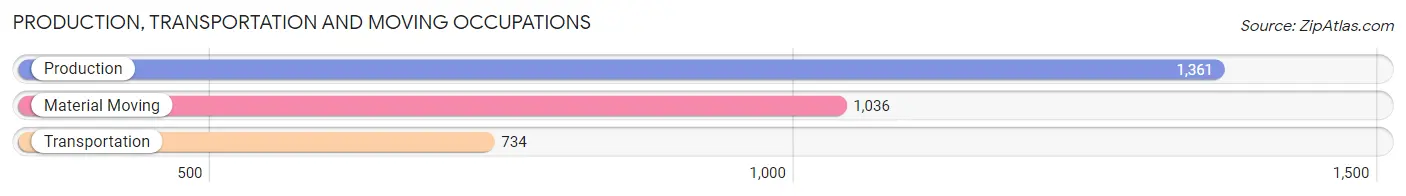
Production, Transportation and Moving Occupations
The most common Production, Transportation and Moving occupations in Hoke County are Production (1,361 | 7.1%), Material Moving (1,036 | 5.4%), and Transportation (734 | 3.8%).
Production, Transportation and Moving Occupations by Sex
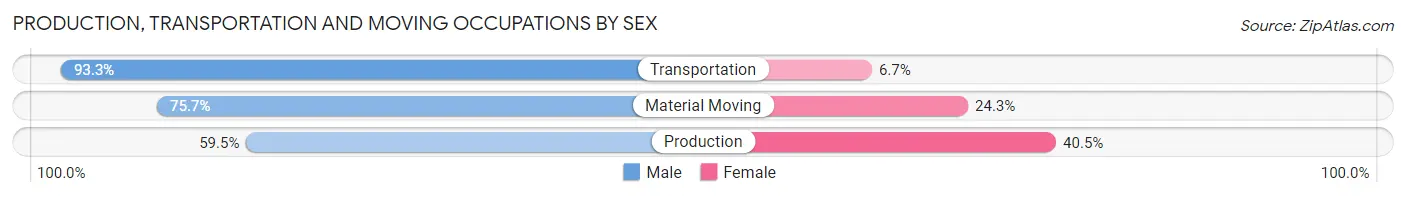
| Occupation | Male | Female |
| Production | 810 (59.5%) | 551 (40.5%) |
| Transportation | 685 (93.3%) | 49 (6.7%) |
| Material Moving | 784 (75.7%) | 252 (24.3%) |
| Total (Category) | 2,279 (72.8%) | 852 (27.2%) |
| Total (Overall) | 9,066 (47.2%) | 10,122 (52.7%) |
Employment Industries by Sex in Hoke County
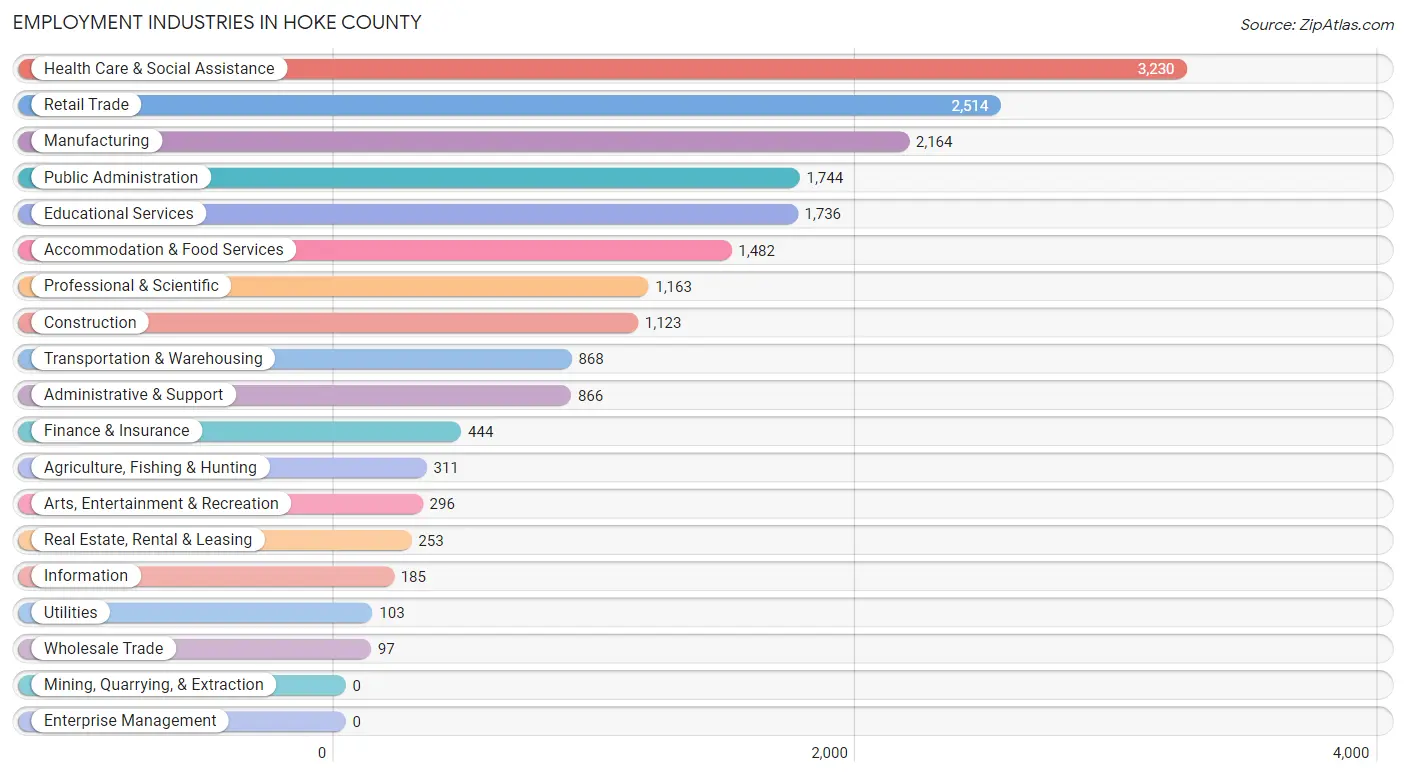
Employment Industries in Hoke County
The major employment industries in Hoke County include Health Care & Social Assistance (3,230 | 16.8%), Retail Trade (2,514 | 13.1%), Manufacturing (2,164 | 11.3%), Public Administration (1,744 | 9.1%), and Educational Services (1,736 | 9.0%).
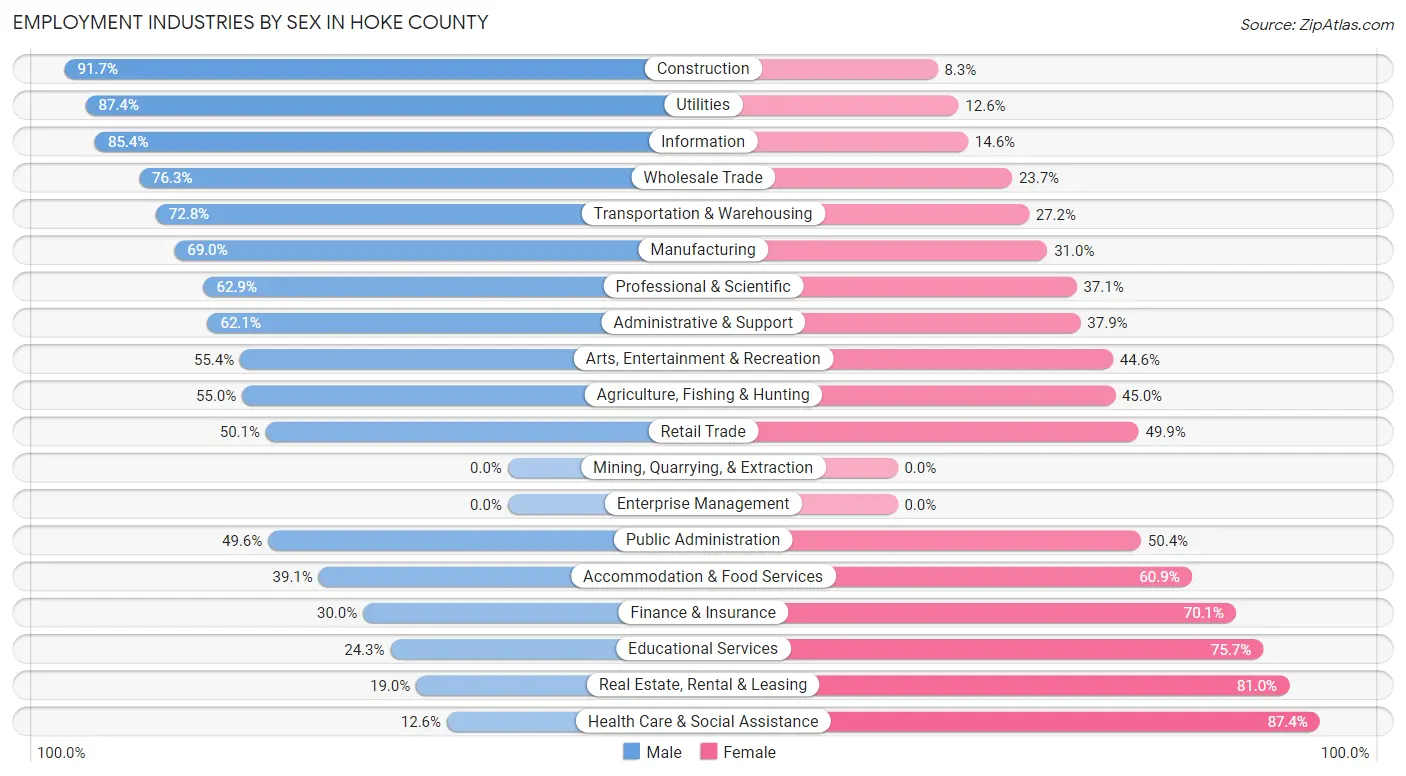
Employment Industries by Sex in Hoke County
The Hoke County industries that see more men than women are Construction (91.7%), Utilities (87.4%), and Information (85.4%), whereas the industries that tend to have a higher number of women are Health Care & Social Assistance (87.4%), Real Estate, Rental & Leasing (81.0%), and Educational Services (75.7%).
| Industry | Male | Female |
| Agriculture, Fishing & Hunting | 171 (55.0%) | 140 (45.0%) |
| Mining, Quarrying, & Extraction | 0 (0.0%) | 0 (0.0%) |
| Construction | 1,030 (91.7%) | 93 (8.3%) |
| Manufacturing | 1,493 (69.0%) | 671 (31.0%) |
| Wholesale Trade | 74 (76.3%) | 23 (23.7%) |
| Retail Trade | 1,259 (50.1%) | 1,255 (49.9%) |
| Transportation & Warehousing | 632 (72.8%) | 236 (27.2%) |
| Utilities | 90 (87.4%) | 13 (12.6%) |
| Information | 158 (85.4%) | 27 (14.6%) |
| Finance & Insurance | 133 (29.9%) | 311 (70.1%) |
| Real Estate, Rental & Leasing | 48 (19.0%) | 205 (81.0%) |
| Professional & Scientific | 732 (62.9%) | 431 (37.1%) |
| Enterprise Management | 0 (0.0%) | 0 (0.0%) |
| Administrative & Support | 538 (62.1%) | 328 (37.9%) |
| Educational Services | 422 (24.3%) | 1,314 (75.7%) |
| Health Care & Social Assistance | 407 (12.6%) | 2,823 (87.4%) |
| Arts, Entertainment & Recreation | 164 (55.4%) | 132 (44.6%) |
| Accommodation & Food Services | 580 (39.1%) | 902 (60.9%) |
| Public Administration | 865 (49.6%) | 879 (50.4%) |
| Total | 9,066 (47.2%) | 10,122 (52.7%) |
Education in Hoke County
School Enrollment in Hoke County
The most common levels of schooling among the 15,117 students in Hoke County are college / undergraduate (3,613 | 23.9%), elementary school (3,191 | 21.1%), and middle school (2,875 | 19.0%).
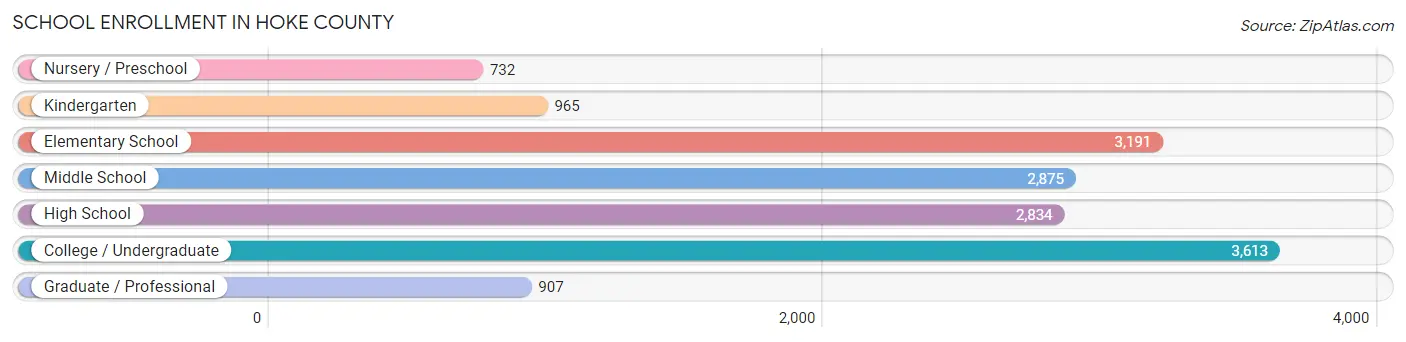
| School Level | # Students | % Students |
| Nursery / Preschool | 732 | 4.8% |
| Kindergarten | 965 | 6.4% |
| Elementary School | 3,191 | 21.1% |
| Middle School | 2,875 | 19.0% |
| High School | 2,834 | 18.8% |
| College / Undergraduate | 3,613 | 23.9% |
| Graduate / Professional | 907 | 6.0% |
| Total | 15,117 | 100.0% |
School Enrollment by Age by Funding Source in Hoke County
Out of a total of 15,117 students who are enrolled in schools in Hoke County, 2,207 (14.6%) attend a private institution, while the remaining 12,910 (85.4%) are enrolled in public schools. The age group of 3 to 4 year olds has the highest likelihood of being enrolled in private schools, with 145 (23.8% in the age bracket) enrolled. Conversely, the age group of 15 to 17 year olds has the lowest likelihood of being enrolled in a private school, with 1,761 (90.2% in the age bracket) attending a public institution.
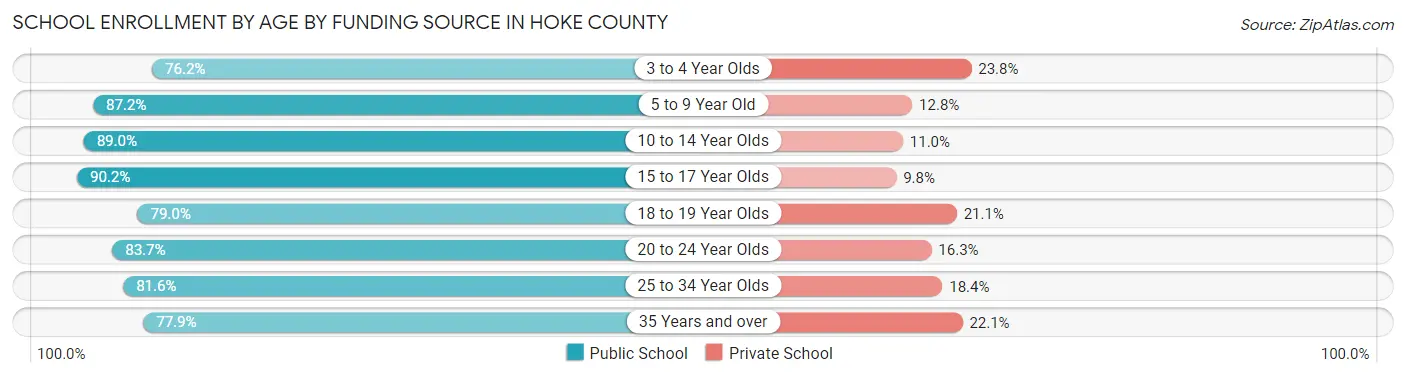
| Age Bracket | Public School | Private School |
| 3 to 4 Year Olds | 465 (76.2%) | 145 (23.8%) |
| 5 to 9 Year Old | 3,447 (87.2%) | 504 (12.8%) |
| 10 to 14 Year Olds | 3,286 (89.0%) | 407 (11.0%) |
| 15 to 17 Year Olds | 1,761 (90.2%) | 191 (9.8%) |
| 18 to 19 Year Olds | 615 (78.9%) | 164 (21.0%) |
| 20 to 24 Year Olds | 722 (83.7%) | 141 (16.3%) |
| 25 to 34 Year Olds | 1,329 (81.6%) | 299 (18.4%) |
| 35 Years and over | 1,278 (77.9%) | 363 (22.1%) |
| Total | 12,910 (85.4%) | 2,207 (14.6%) |
Educational Attainment by Field of Study in Hoke County
Business (1,545 | 21.1%), science & technology (1,077 | 14.7%), arts & humanities (979 | 13.4%), education (889 | 12.1%), and computers & mathematics (599 | 8.2%) are the most common fields of study among 7,317 individuals in Hoke County who have obtained a bachelor's degree or higher.
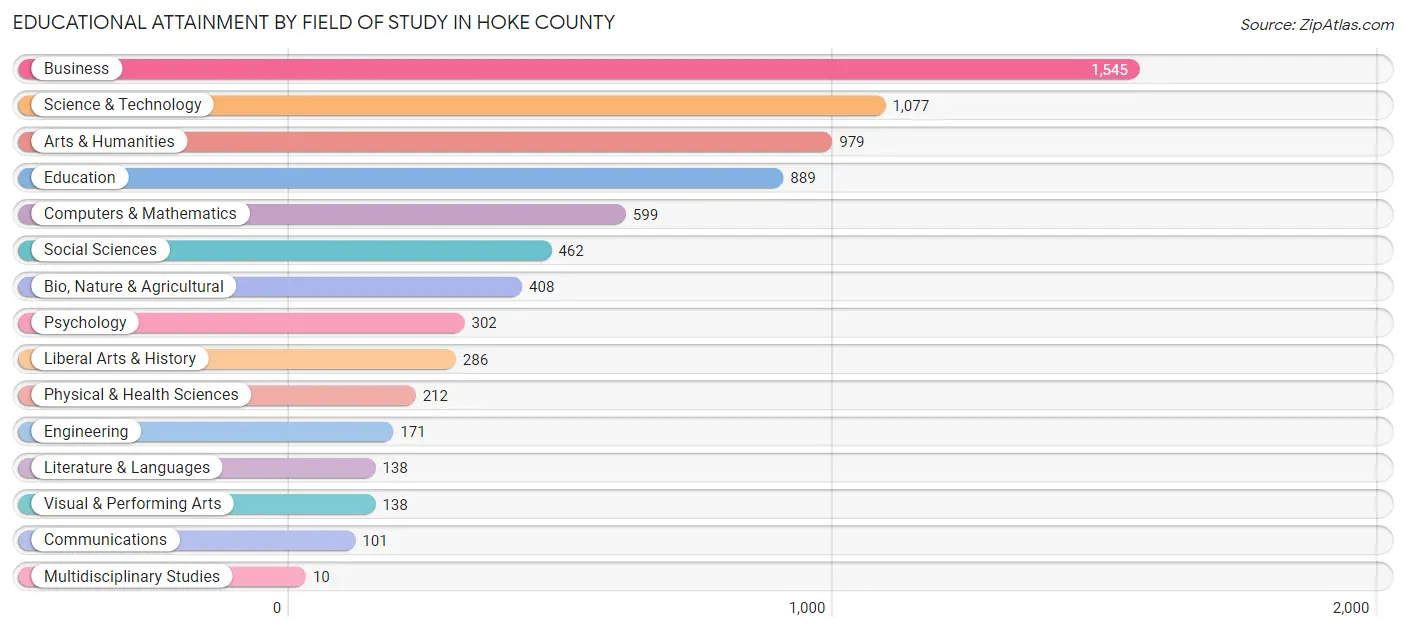
| Field of Study | # Graduates | % Graduates |
| Computers & Mathematics | 599 | 8.2% |
| Bio, Nature & Agricultural | 408 | 5.6% |
| Physical & Health Sciences | 212 | 2.9% |
| Psychology | 302 | 4.1% |
| Social Sciences | 462 | 6.3% |
| Engineering | 171 | 2.3% |
| Multidisciplinary Studies | 10 | 0.1% |
| Science & Technology | 1,077 | 14.7% |
| Business | 1,545 | 21.1% |
| Education | 889 | 12.1% |
| Literature & Languages | 138 | 1.9% |
| Liberal Arts & History | 286 | 3.9% |
| Visual & Performing Arts | 138 | 1.9% |
| Communications | 101 | 1.4% |
| Arts & Humanities | 979 | 13.4% |
| Total | 7,317 | 100.0% |
Transportation & Commute in Hoke County
Vehicle Availability by Sex in Hoke County
The most prevalent vehicle ownership categories in Hoke County are males with 2 vehicles (4,336, accounting for 38.7%) and females with 2 vehicles (3,535, making up 41.9%).
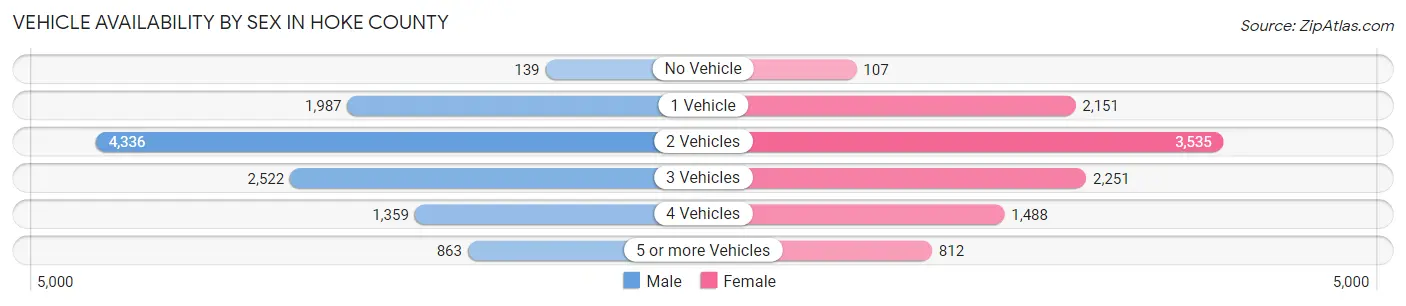
| Vehicles Available | Male | Female |
| No Vehicle | 139 (1.2%) | 107 (1.0%) |
| 1 Vehicle | 1,987 (17.7%) | 2,151 (20.8%) |
| 2 Vehicles | 4,336 (38.7%) | 3,535 (34.2%) |
| 3 Vehicles | 2,522 (22.5%) | 2,251 (21.8%) |
| 4 Vehicles | 1,359 (12.1%) | 1,488 (14.4%) |
| 5 or more Vehicles | 863 (7.7%) | 812 (7.9%) |
| Total | 11,206 (100.0%) | 10,344 (100.0%) |
Commute Time in Hoke County
The most frequently occuring commute durations in Hoke County are 30 to 34 minutes (3,475 commuters, 17.2%), 20 to 24 minutes (2,976 commuters, 14.7%), and 15 to 19 minutes (2,315 commuters, 11.5%).
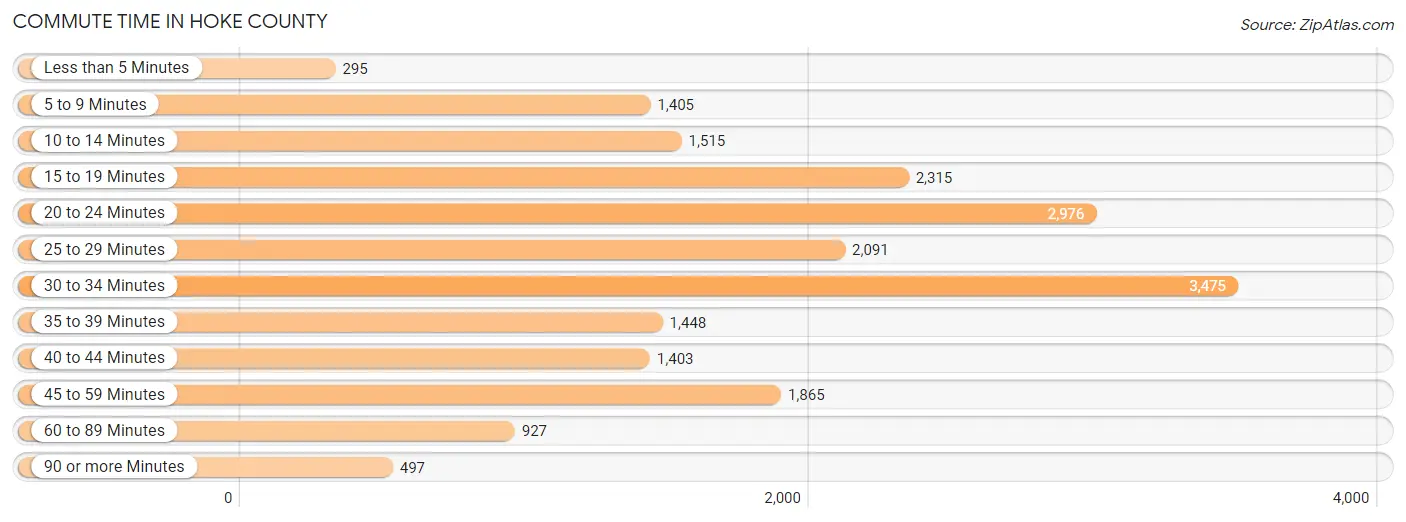
| Commute Time | # Commuters | % Commuters |
| Less than 5 Minutes | 295 | 1.5% |
| 5 to 9 Minutes | 1,405 | 7.0% |
| 10 to 14 Minutes | 1,515 | 7.5% |
| 15 to 19 Minutes | 2,315 | 11.5% |
| 20 to 24 Minutes | 2,976 | 14.7% |
| 25 to 29 Minutes | 2,091 | 10.3% |
| 30 to 34 Minutes | 3,475 | 17.2% |
| 35 to 39 Minutes | 1,448 | 7.2% |
| 40 to 44 Minutes | 1,403 | 6.9% |
| 45 to 59 Minutes | 1,865 | 9.2% |
| 60 to 89 Minutes | 927 | 4.6% |
| 90 or more Minutes | 497 | 2.5% |
Commute Time by Sex in Hoke County
The most common commute times in Hoke County are 30 to 34 minutes (1,836 commuters, 17.2%) for males and 30 to 34 minutes (1,639 commuters, 17.2%) for females.
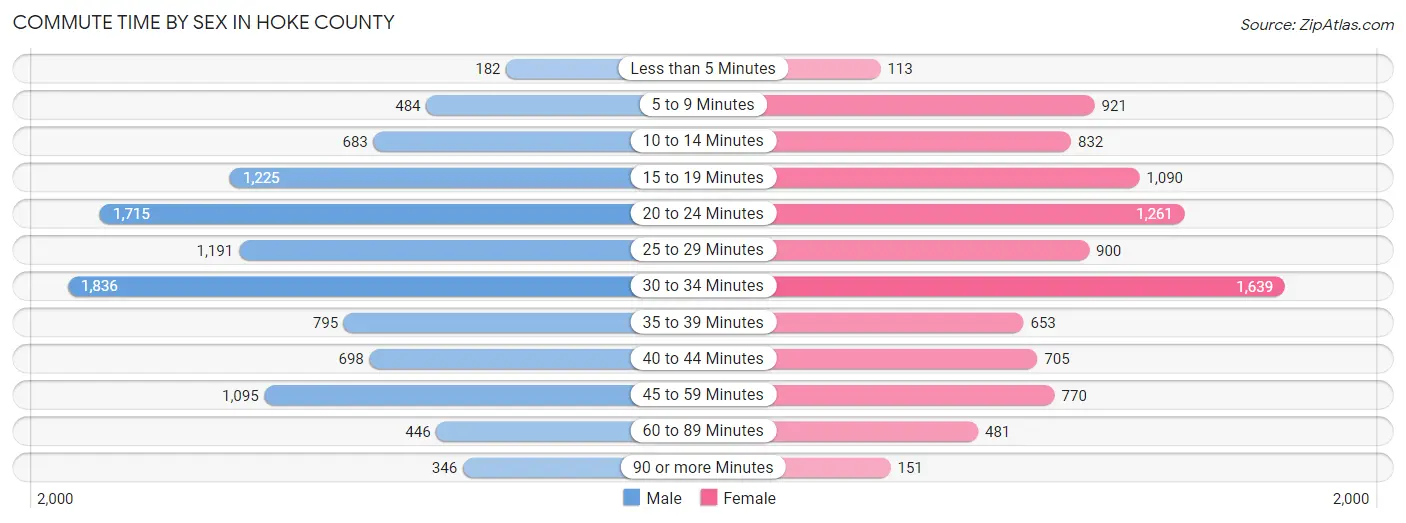
| Commute Time | Male | Female |
| Less than 5 Minutes | 182 (1.7%) | 113 (1.2%) |
| 5 to 9 Minutes | 484 (4.5%) | 921 (9.7%) |
| 10 to 14 Minutes | 683 (6.4%) | 832 (8.7%) |
| 15 to 19 Minutes | 1,225 (11.5%) | 1,090 (11.5%) |
| 20 to 24 Minutes | 1,715 (16.0%) | 1,261 (13.3%) |
| 25 to 29 Minutes | 1,191 (11.1%) | 900 (9.5%) |
| 30 to 34 Minutes | 1,836 (17.2%) | 1,639 (17.2%) |
| 35 to 39 Minutes | 795 (7.4%) | 653 (6.9%) |
| 40 to 44 Minutes | 698 (6.5%) | 705 (7.4%) |
| 45 to 59 Minutes | 1,095 (10.2%) | 770 (8.1%) |
| 60 to 89 Minutes | 446 (4.2%) | 481 (5.1%) |
| 90 or more Minutes | 346 (3.2%) | 151 (1.6%) |
Time of Departure to Work by Sex in Hoke County
The most frequent times of departure to work in Hoke County are 7:00 AM to 7:29 AM (1,297, 12.1%) for males and 7:00 AM to 7:29 AM (1,946, 20.4%) for females.
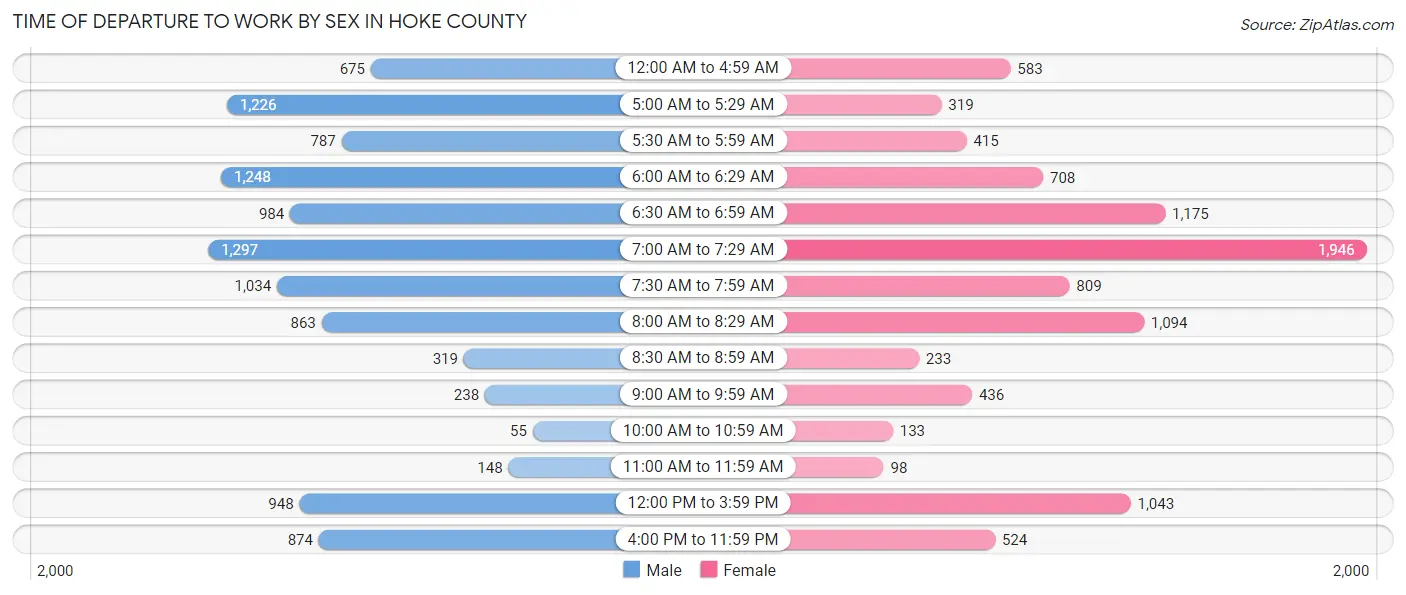
| Time of Departure | Male | Female |
| 12:00 AM to 4:59 AM | 675 (6.3%) | 583 (6.1%) |
| 5:00 AM to 5:29 AM | 1,226 (11.5%) | 319 (3.4%) |
| 5:30 AM to 5:59 AM | 787 (7.4%) | 415 (4.4%) |
| 6:00 AM to 6:29 AM | 1,248 (11.7%) | 708 (7.4%) |
| 6:30 AM to 6:59 AM | 984 (9.2%) | 1,175 (12.3%) |
| 7:00 AM to 7:29 AM | 1,297 (12.1%) | 1,946 (20.4%) |
| 7:30 AM to 7:59 AM | 1,034 (9.7%) | 809 (8.5%) |
| 8:00 AM to 8:29 AM | 863 (8.1%) | 1,094 (11.5%) |
| 8:30 AM to 8:59 AM | 319 (3.0%) | 233 (2.5%) |
| 9:00 AM to 9:59 AM | 238 (2.2%) | 436 (4.6%) |
| 10:00 AM to 10:59 AM | 55 (0.5%) | 133 (1.4%) |
| 11:00 AM to 11:59 AM | 148 (1.4%) | 98 (1.0%) |
| 12:00 PM to 3:59 PM | 948 (8.9%) | 1,043 (11.0%) |
| 4:00 PM to 11:59 PM | 874 (8.2%) | 524 (5.5%) |
| Total | 10,696 (100.0%) | 9,516 (100.0%) |
Housing Occupancy in Hoke County
Occupancy by Ownership in Hoke County
Of the total 18,481 dwellings in Hoke County, owner-occupied units account for 12,921 (69.9%), while renter-occupied units make up 5,560 (30.1%).
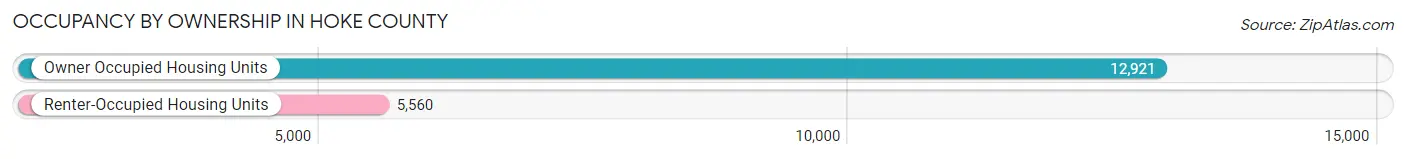
| Occupancy | # Housing Units | % Housing Units |
| Owner Occupied Housing Units | 12,921 | 69.9% |
| Renter-Occupied Housing Units | 5,560 | 30.1% |
| Total Occupied Housing Units | 18,481 | 100.0% |
Occupancy by Household Size in Hoke County
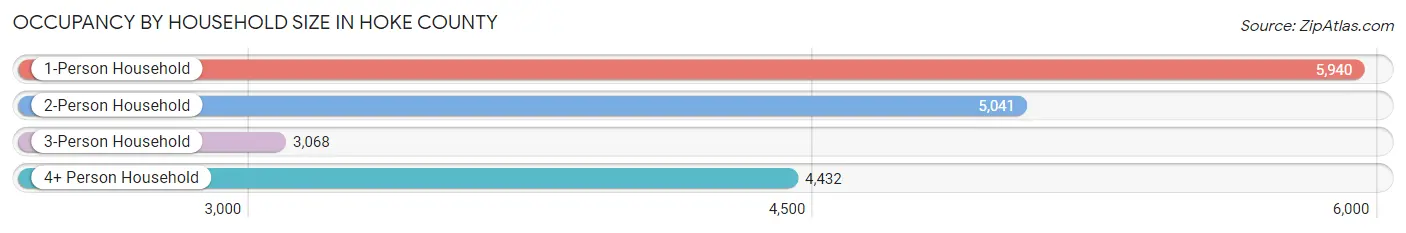
| Household Size | # Housing Units | % Housing Units |
| 1-Person Household | 5,940 | 32.1% |
| 2-Person Household | 5,041 | 27.3% |
| 3-Person Household | 3,068 | 16.6% |
| 4+ Person Household | 4,432 | 24.0% |
| Total Housing Units | 18,481 | 100.0% |
Occupancy by Ownership by Household Size in Hoke County
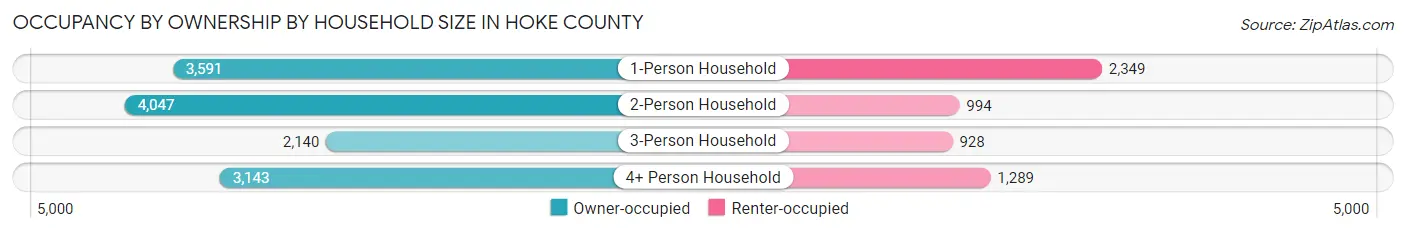
| Household Size | Owner-occupied | Renter-occupied |
| 1-Person Household | 3,591 (60.5%) | 2,349 (39.6%) |
| 2-Person Household | 4,047 (80.3%) | 994 (19.7%) |
| 3-Person Household | 2,140 (69.8%) | 928 (30.2%) |
| 4+ Person Household | 3,143 (70.9%) | 1,289 (29.1%) |
| Total Housing Units | 12,921 (69.9%) | 5,560 (30.1%) |
Occupancy by Educational Attainment in Hoke County
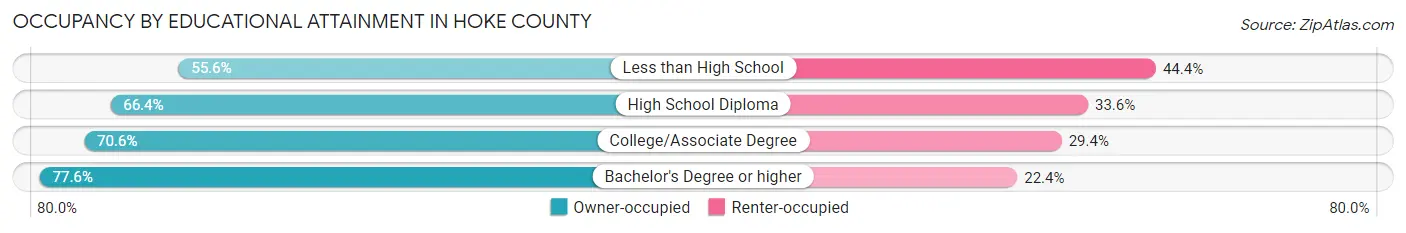
| Household Size | Owner-occupied | Renter-occupied |
| Less than High School | 906 (55.6%) | 723 (44.4%) |
| High School Diploma | 2,832 (66.4%) | 1,433 (33.6%) |
| College/Associate Degree | 5,876 (70.6%) | 2,450 (29.4%) |
| Bachelor's Degree or higher | 3,307 (77.6%) | 954 (22.4%) |
Occupancy by Age of Householder in Hoke County
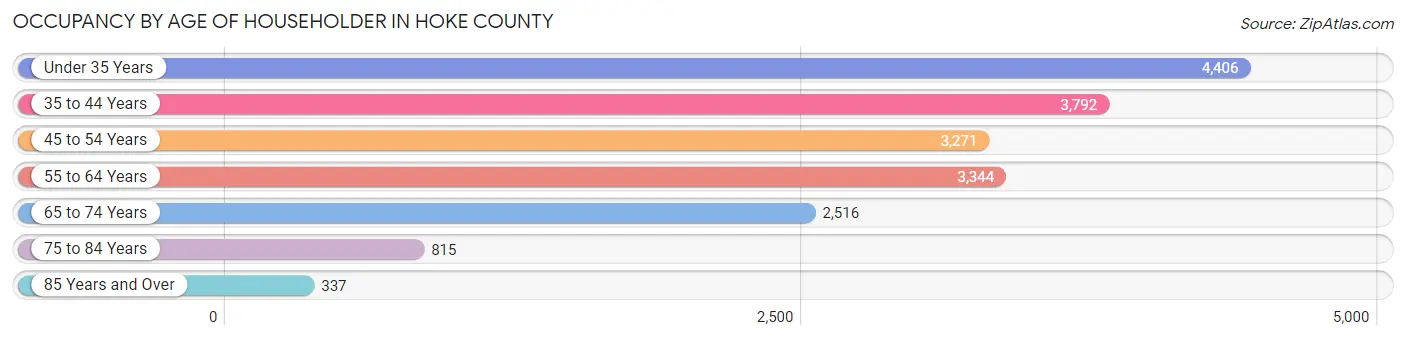
| Age Bracket | # Households | % Households |
| Under 35 Years | 4,406 | 23.8% |
| 35 to 44 Years | 3,792 | 20.5% |
| 45 to 54 Years | 3,271 | 17.7% |
| 55 to 64 Years | 3,344 | 18.1% |
| 65 to 74 Years | 2,516 | 13.6% |
| 75 to 84 Years | 815 | 4.4% |
| 85 Years and Over | 337 | 1.8% |
| Total | 18,481 | 100.0% |
Housing Finances in Hoke County
Median Income by Occupancy in Hoke County
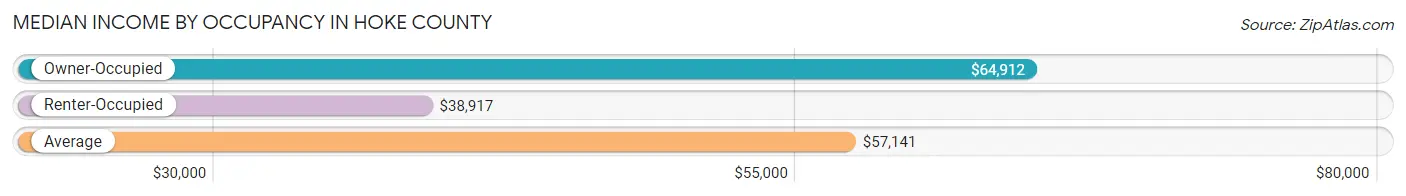
| Occupancy Type | # Households | Median Income |
| Owner-Occupied | 12,921 (69.9%) | $64,912 |
| Renter-Occupied | 5,560 (30.1%) | $38,917 |
| Average | 18,481 (100.0%) | $57,141 |
Occupancy by Householder Income Bracket in Hoke County
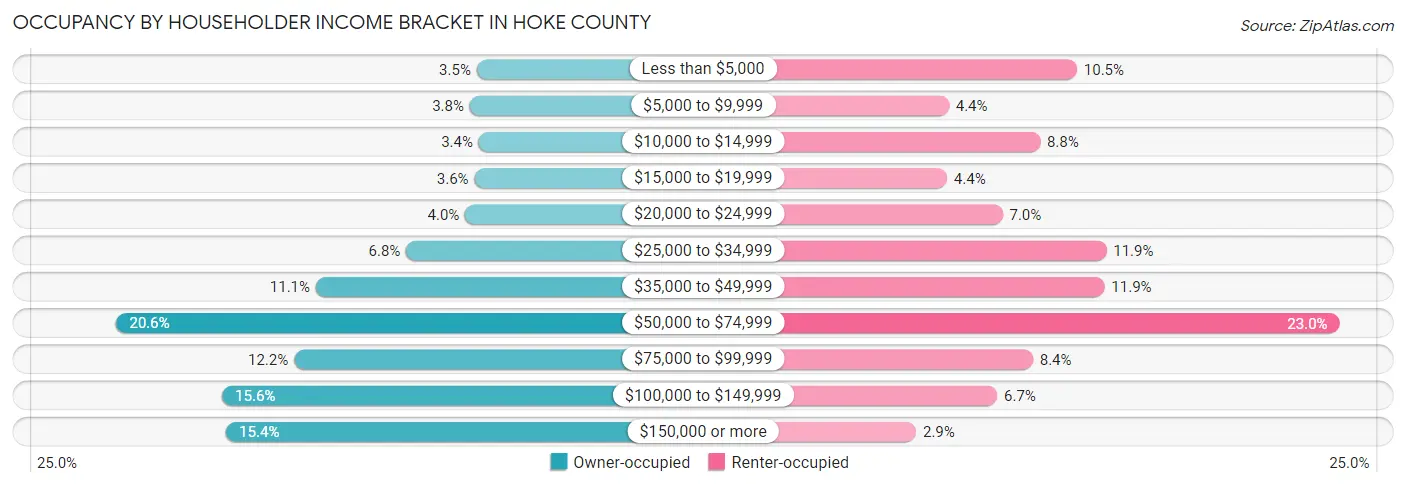
| Income Bracket | Owner-occupied | Renter-occupied |
| Less than $5,000 | 449 (3.5%) | 586 (10.5%) |
| $5,000 to $9,999 | 491 (3.8%) | 247 (4.4%) |
| $10,000 to $14,999 | 436 (3.4%) | 488 (8.8%) |
| $15,000 to $19,999 | 463 (3.6%) | 242 (4.3%) |
| $20,000 to $24,999 | 520 (4.0%) | 389 (7.0%) |
| $25,000 to $34,999 | 882 (6.8%) | 664 (11.9%) |
| $35,000 to $49,999 | 1,438 (11.1%) | 659 (11.8%) |
| $50,000 to $74,999 | 2,665 (20.6%) | 1,281 (23.0%) |
| $75,000 to $99,999 | 1,573 (12.2%) | 469 (8.4%) |
| $100,000 to $149,999 | 2,014 (15.6%) | 375 (6.7%) |
| $150,000 or more | 1,990 (15.4%) | 160 (2.9%) |
| Total | 12,921 (100.0%) | 5,560 (100.0%) |
Monthly Housing Cost Tiers in Hoke County
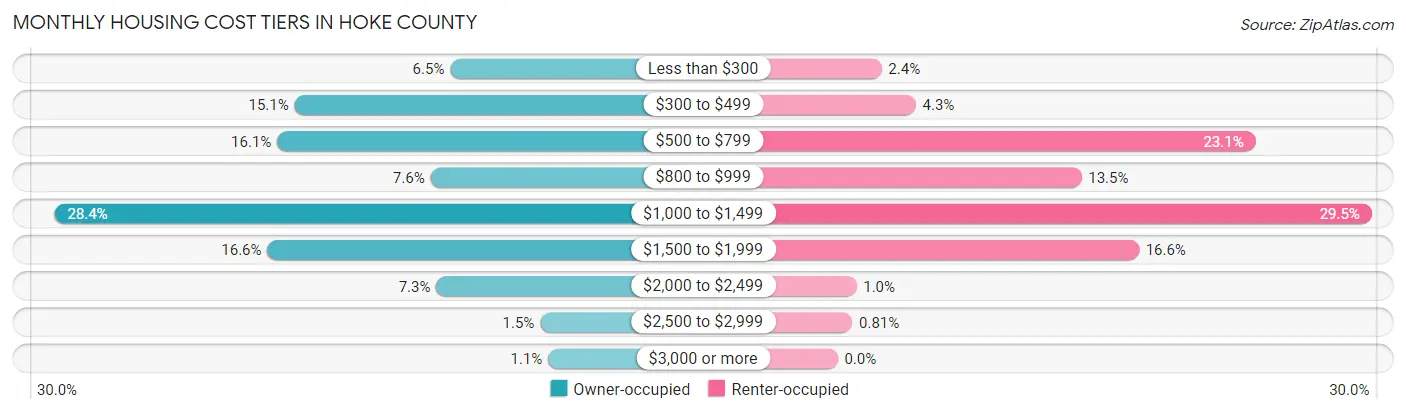
| Monthly Cost | Owner-occupied | Renter-occupied |
| Less than $300 | 838 (6.5%) | 135 (2.4%) |
| $300 to $499 | 1,950 (15.1%) | 240 (4.3%) |
| $500 to $799 | 2,074 (16.1%) | 1,284 (23.1%) |
| $800 to $999 | 979 (7.6%) | 749 (13.5%) |
| $1,000 to $1,499 | 3,663 (28.3%) | 1,641 (29.5%) |
| $1,500 to $1,999 | 2,143 (16.6%) | 925 (16.6%) |
| $2,000 to $2,499 | 938 (7.3%) | 58 (1.0%) |
| $2,500 to $2,999 | 196 (1.5%) | 45 (0.8%) |
| $3,000 or more | 140 (1.1%) | 0 (0.0%) |
| Total | 12,921 (100.0%) | 5,560 (100.0%) |
Physical Housing Characteristics in Hoke County
Housing Structures in Hoke County
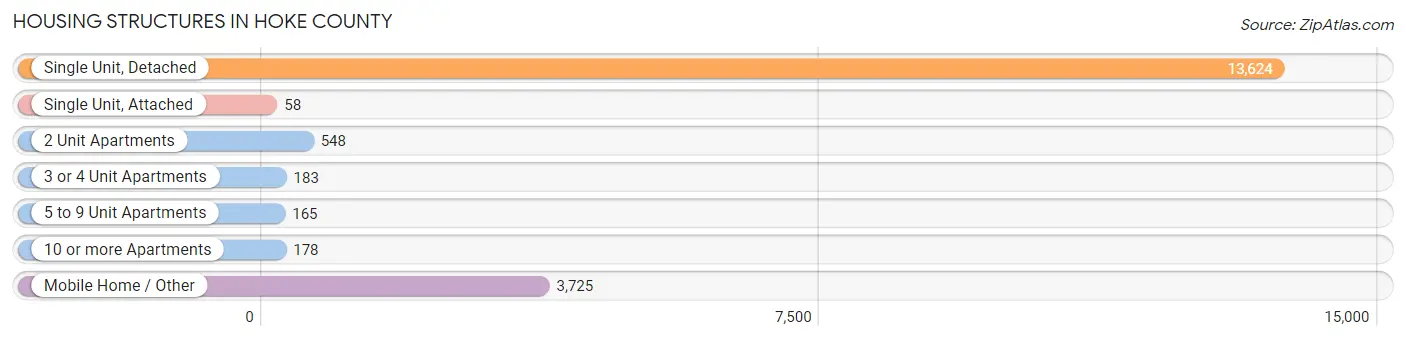
| Structure Type | # Housing Units | % Housing Units |
| Single Unit, Detached | 13,624 | 73.7% |
| Single Unit, Attached | 58 | 0.3% |
| 2 Unit Apartments | 548 | 3.0% |
| 3 or 4 Unit Apartments | 183 | 1.0% |
| 5 to 9 Unit Apartments | 165 | 0.9% |
| 10 or more Apartments | 178 | 1.0% |
| Mobile Home / Other | 3,725 | 20.2% |
| Total | 18,481 | 100.0% |
Housing Structures by Occupancy in Hoke County
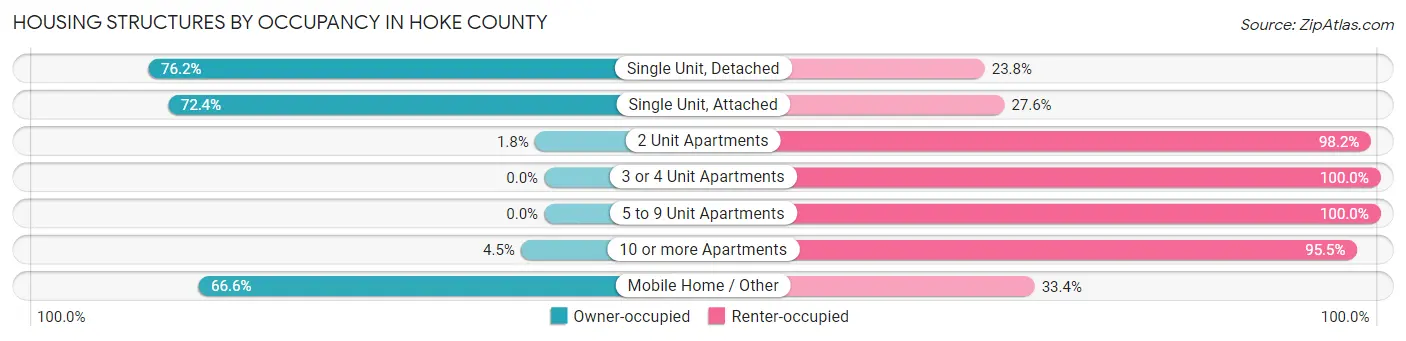
| Structure Type | Owner-occupied | Renter-occupied |
| Single Unit, Detached | 10,381 (76.2%) | 3,243 (23.8%) |
| Single Unit, Attached | 42 (72.4%) | 16 (27.6%) |
| 2 Unit Apartments | 10 (1.8%) | 538 (98.2%) |
| 3 or 4 Unit Apartments | 0 (0.0%) | 183 (100.0%) |
| 5 to 9 Unit Apartments | 0 (0.0%) | 165 (100.0%) |
| 10 or more Apartments | 8 (4.5%) | 170 (95.5%) |
| Mobile Home / Other | 2,480 (66.6%) | 1,245 (33.4%) |
| Total | 12,921 (69.9%) | 5,560 (30.1%) |
Housing Structures by Number of Rooms in Hoke County
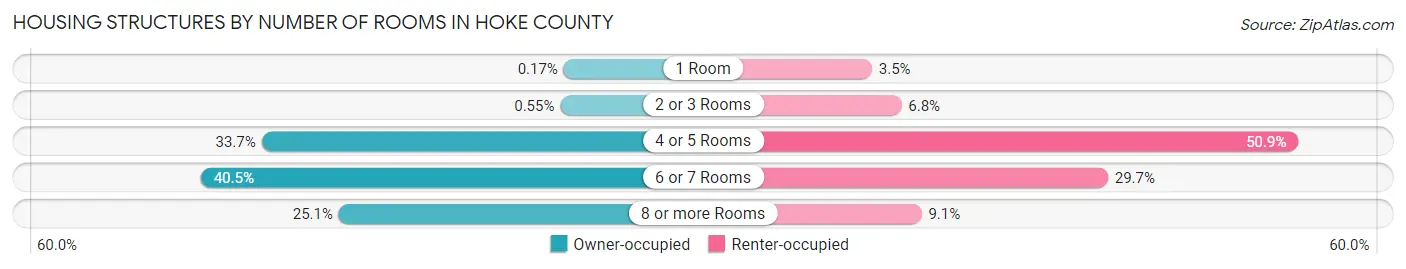
| Number of Rooms | Owner-occupied | Renter-occupied |
| 1 Room | 22 (0.2%) | 197 (3.5%) |
| 2 or 3 Rooms | 71 (0.5%) | 379 (6.8%) |
| 4 or 5 Rooms | 4,354 (33.7%) | 2,828 (50.9%) |
| 6 or 7 Rooms | 5,227 (40.5%) | 1,653 (29.7%) |
| 8 or more Rooms | 3,247 (25.1%) | 503 (9.0%) |
| Total | 12,921 (100.0%) | 5,560 (100.0%) |
Housing Structure by Heating Type in Hoke County
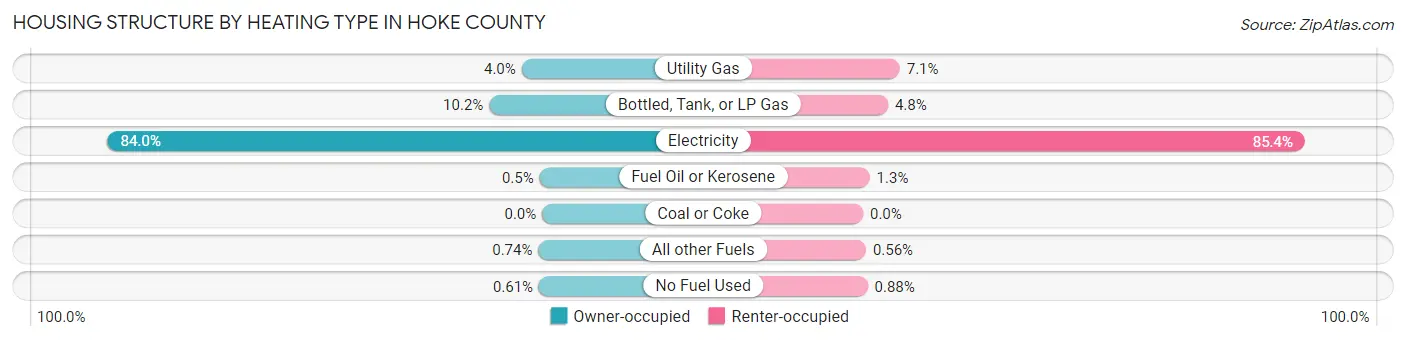
| Heating Type | Owner-occupied | Renter-occupied |
| Utility Gas | 512 (4.0%) | 395 (7.1%) |
| Bottled, Tank, or LP Gas | 1,322 (10.2%) | 268 (4.8%) |
| Electricity | 10,848 (84.0%) | 4,746 (85.4%) |
| Fuel Oil or Kerosene | 64 (0.5%) | 71 (1.3%) |
| Coal or Coke | 0 (0.0%) | 0 (0.0%) |
| All other Fuels | 96 (0.7%) | 31 (0.6%) |
| No Fuel Used | 79 (0.6%) | 49 (0.9%) |
| Total | 12,921 (100.0%) | 5,560 (100.0%) |
Household Vehicle Usage in Hoke County
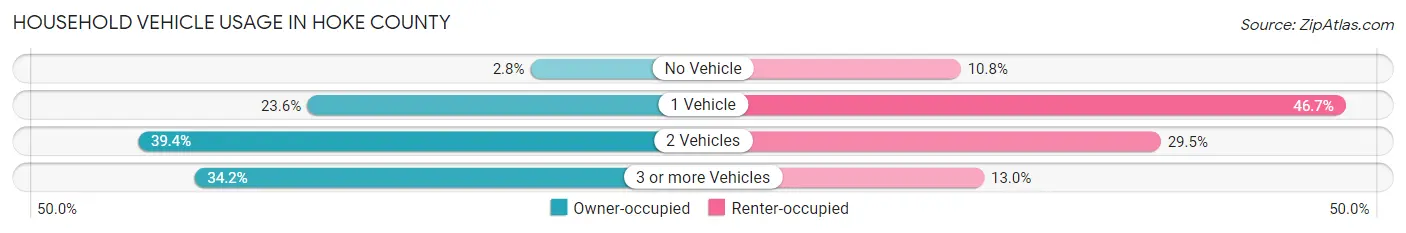
| Vehicles per Household | Owner-occupied | Renter-occupied |
| No Vehicle | 360 (2.8%) | 601 (10.8%) |
| 1 Vehicle | 3,054 (23.6%) | 2,598 (46.7%) |
| 2 Vehicles | 5,095 (39.4%) | 1,639 (29.5%) |
| 3 or more Vehicles | 4,412 (34.2%) | 722 (13.0%) |
| Total | 12,921 (100.0%) | 5,560 (100.0%) |
Real Estate & Mortgages in Hoke County
Real Estate and Mortgage Overview in Hoke County
| Characteristic | Without Mortgage | With Mortgage |
| Housing Units | 4,447 | 8,474 |
| Median Property Value | $112,100 | $200,100 |
| Median Household Income | $46,176 | $1,525 |
| Monthly Housing Costs | $440 | $140 |
| Real Estate Taxes | $832 | $328 |
Property Value by Mortgage Status in Hoke County
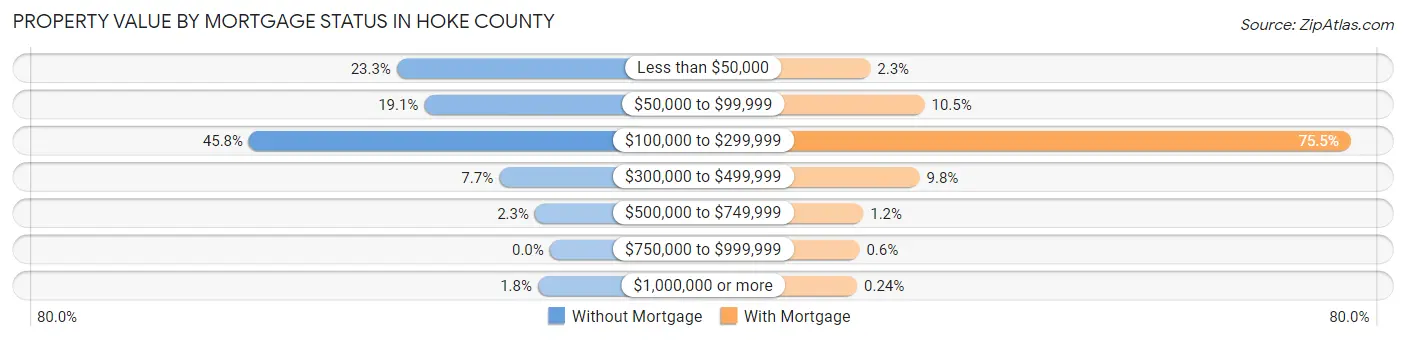
| Property Value | Without Mortgage | With Mortgage |
| Less than $50,000 | 1,036 (23.3%) | 191 (2.2%) |
| $50,000 to $99,999 | 850 (19.1%) | 891 (10.5%) |
| $100,000 to $299,999 | 2,038 (45.8%) | 6,394 (75.4%) |
| $300,000 to $499,999 | 343 (7.7%) | 827 (9.8%) |
| $500,000 to $749,999 | 100 (2.2%) | 100 (1.2%) |
| $750,000 to $999,999 | 0 (0.0%) | 51 (0.6%) |
| $1,000,000 or more | 80 (1.8%) | 20 (0.2%) |
| Total | 4,447 (100.0%) | 8,474 (100.0%) |
Household Income by Mortgage Status in Hoke County
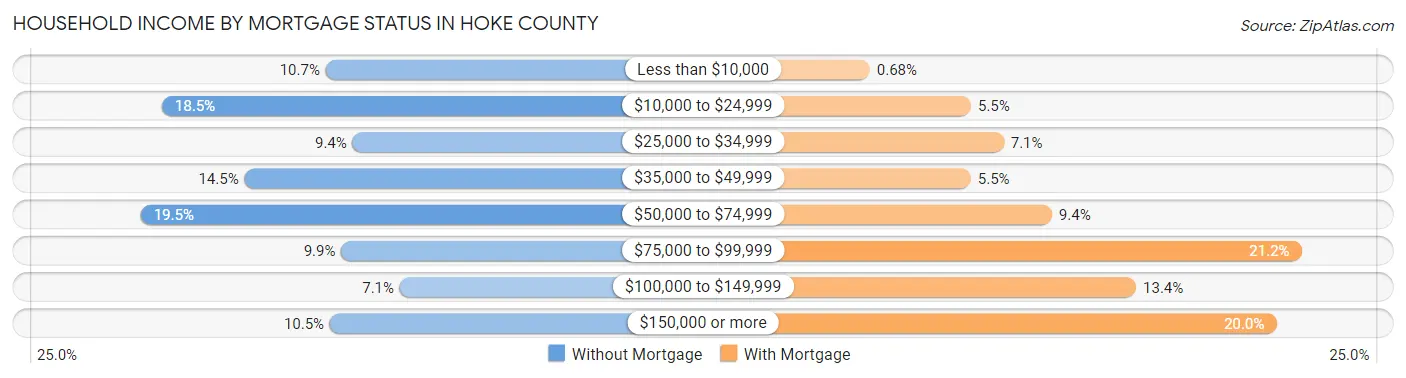
| Household Income | Without Mortgage | With Mortgage |
| Less than $10,000 | 474 (10.7%) | 58 (0.7%) |
| $10,000 to $24,999 | 821 (18.5%) | 466 (5.5%) |
| $25,000 to $34,999 | 417 (9.4%) | 598 (7.1%) |
| $35,000 to $49,999 | 646 (14.5%) | 465 (5.5%) |
| $50,000 to $74,999 | 866 (19.5%) | 792 (9.3%) |
| $75,000 to $99,999 | 441 (9.9%) | 1,799 (21.2%) |
| $100,000 to $149,999 | 317 (7.1%) | 1,132 (13.4%) |
| $150,000 or more | 465 (10.5%) | 1,697 (20.0%) |
| Total | 4,447 (100.0%) | 8,474 (100.0%) |
Property Value to Household Income Ratio in Hoke County
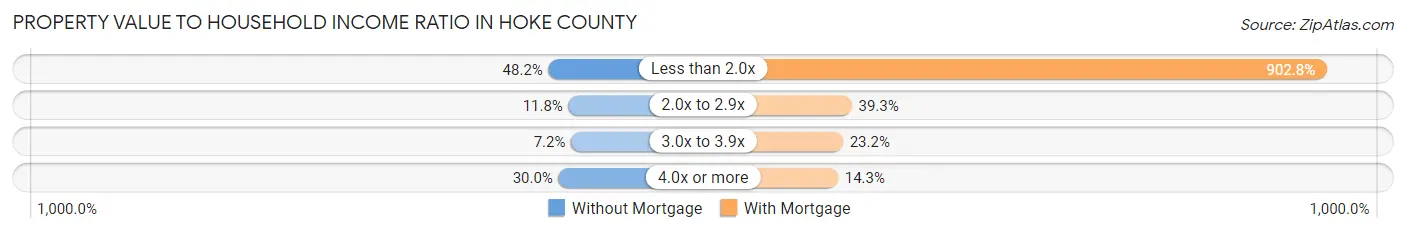
| Value-to-Income Ratio | Without Mortgage | With Mortgage |
| Less than 2.0x | 2,145 (48.2%) | 76,500 (902.8%) |
| 2.0x to 2.9x | 526 (11.8%) | 3,326 (39.3%) |
| 3.0x to 3.9x | 319 (7.2%) | 1,969 (23.2%) |
| 4.0x or more | 1,334 (30.0%) | 1,208 (14.3%) |
| Total | 4,447 (100.0%) | 8,474 (100.0%) |
Real Estate Taxes by Mortgage Status in Hoke County
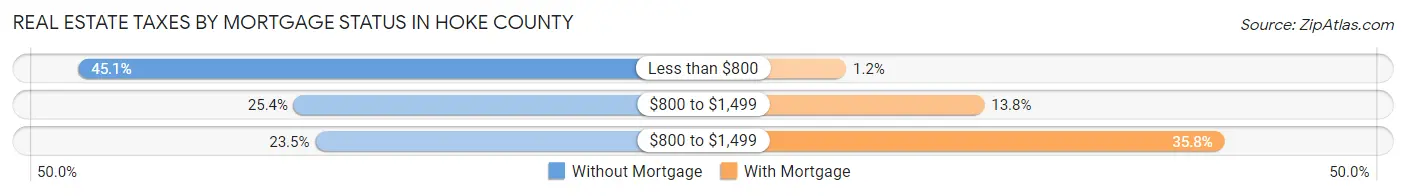
| Property Taxes | Without Mortgage | With Mortgage |
| Less than $800 | 2,005 (45.1%) | 101 (1.2%) |
| $800 to $1,499 | 1,130 (25.4%) | 1,170 (13.8%) |
| $800 to $1,499 | 1,043 (23.4%) | 3,030 (35.8%) |
| Total | 4,447 (100.0%) | 8,474 (100.0%) |
Health & Disability in Hoke County
Health Insurance Coverage by Age in Hoke County
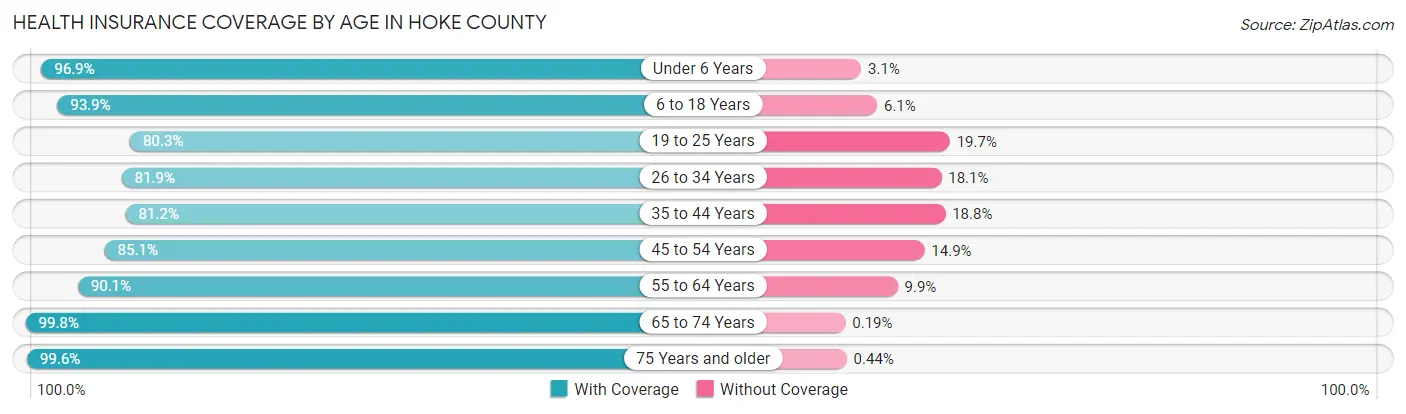
| Age Bracket | With Coverage | Without Coverage |
| Under 6 Years | 4,673 (96.9%) | 151 (3.1%) |
| 6 to 18 Years | 9,528 (93.9%) | 620 (6.1%) |
| 19 to 25 Years | 3,285 (80.3%) | 804 (19.7%) |
| 26 to 34 Years | 5,307 (81.9%) | 1,171 (18.1%) |
| 35 to 44 Years | 5,280 (81.2%) | 1,224 (18.8%) |
| 45 to 54 Years | 4,873 (85.1%) | 856 (14.9%) |
| 55 to 64 Years | 5,062 (90.1%) | 559 (9.9%) |
| 65 to 74 Years | 3,736 (99.8%) | 7 (0.2%) |
| 75 Years and older | 1,795 (99.6%) | 8 (0.4%) |
| Total | 43,539 (89.0%) | 5,400 (11.0%) |
Health Insurance Coverage by Citizenship Status in Hoke County
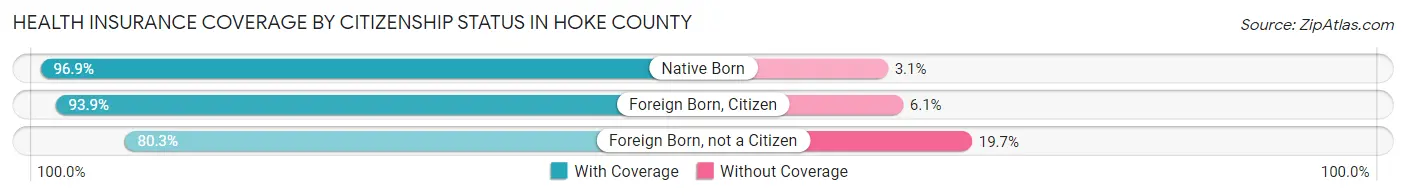
| Citizenship Status | With Coverage | Without Coverage |
| Native Born | 4,673 (96.9%) | 151 (3.1%) |
| Foreign Born, Citizen | 9,528 (93.9%) | 620 (6.1%) |
| Foreign Born, not a Citizen | 3,285 (80.3%) | 804 (19.7%) |
Health Insurance Coverage by Household Income in Hoke County
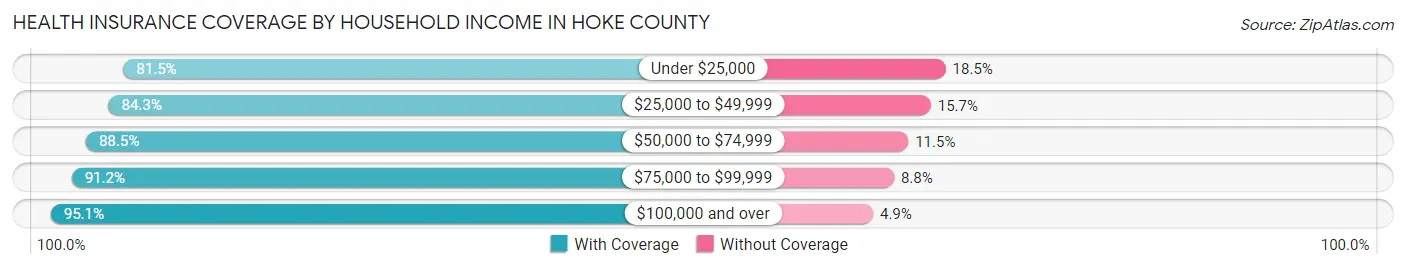
| Household Income | With Coverage | Without Coverage |
| Under $25,000 | 6,952 (81.5%) | 1,580 (18.5%) |
| $25,000 to $49,999 | 7,212 (84.3%) | 1,347 (15.7%) |
| $50,000 to $74,999 | 8,317 (88.5%) | 1,082 (11.5%) |
| $75,000 to $99,999 | 6,538 (91.2%) | 633 (8.8%) |
| $100,000 and over | 14,426 (95.1%) | 747 (4.9%) |
Public vs Private Health Insurance Coverage by Age in Hoke County
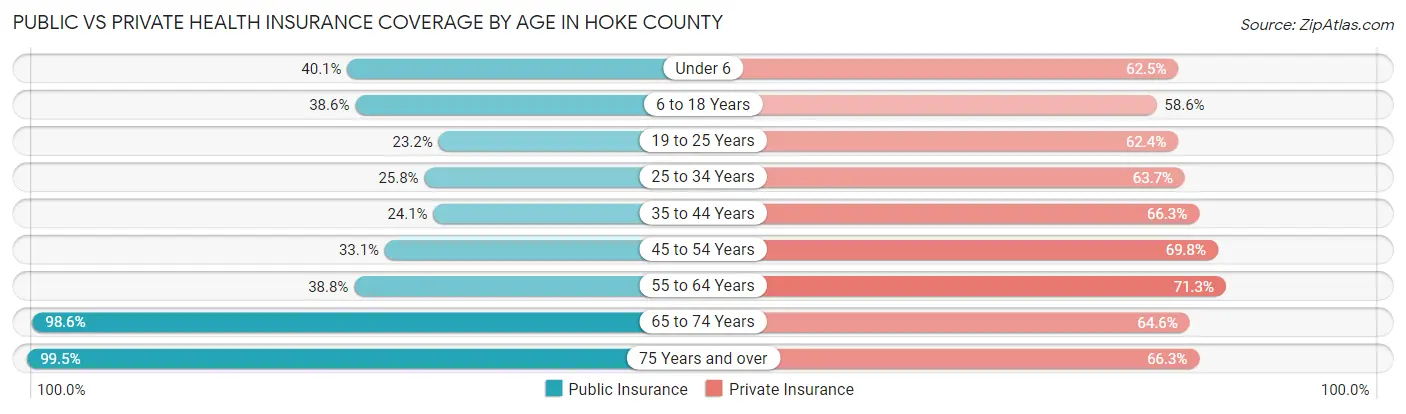
| Age Bracket | Public Insurance | Private Insurance |
| Under 6 | 1,934 (40.1%) | 3,013 (62.5%) |
| 6 to 18 Years | 3,920 (38.6%) | 5,945 (58.6%) |
| 19 to 25 Years | 947 (23.2%) | 2,552 (62.4%) |
| 25 to 34 Years | 1,670 (25.8%) | 4,125 (63.7%) |
| 35 to 44 Years | 1,568 (24.1%) | 4,312 (66.3%) |
| 45 to 54 Years | 1,897 (33.1%) | 3,998 (69.8%) |
| 55 to 64 Years | 2,182 (38.8%) | 4,006 (71.3%) |
| 65 to 74 Years | 3,689 (98.6%) | 2,416 (64.5%) |
| 75 Years and over | 1,794 (99.5%) | 1,196 (66.3%) |
| Total | 19,601 (40.1%) | 31,563 (64.5%) |
Disability Status by Sex by Age in Hoke County
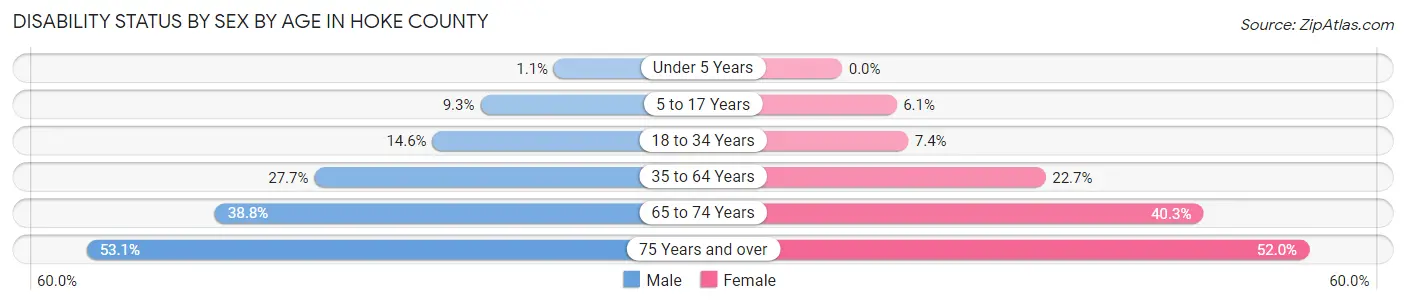
| Age Bracket | Male | Female |
| Under 5 Years | 23 (1.1%) | 0 (0.0%) |
| 5 to 17 Years | 480 (9.2%) | 290 (6.1%) |
| 18 to 34 Years | 719 (14.6%) | 467 (7.4%) |
| 35 to 64 Years | 2,220 (27.7%) | 2,232 (22.7%) |
| 65 to 74 Years | 688 (38.8%) | 793 (40.3%) |
| 75 Years and over | 405 (53.1%) | 541 (52.0%) |
Disability Class by Sex by Age in Hoke County
Disability Class: Hearing Difficulty
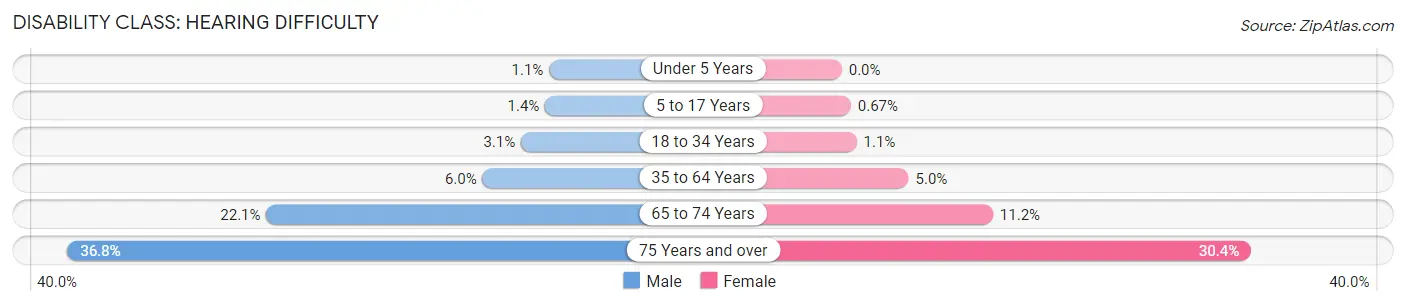
| Age Bracket | Male | Female |
| Under 5 Years | 23 (1.1%) | 0 (0.0%) |
| 5 to 17 Years | 70 (1.3%) | 32 (0.7%) |
| 18 to 34 Years | 155 (3.1%) | 70 (1.1%) |
| 35 to 64 Years | 480 (6.0%) | 489 (5.0%) |
| 65 to 74 Years | 391 (22.1%) | 221 (11.2%) |
| 75 Years and over | 281 (36.8%) | 316 (30.4%) |
Disability Class: Vision Difficulty
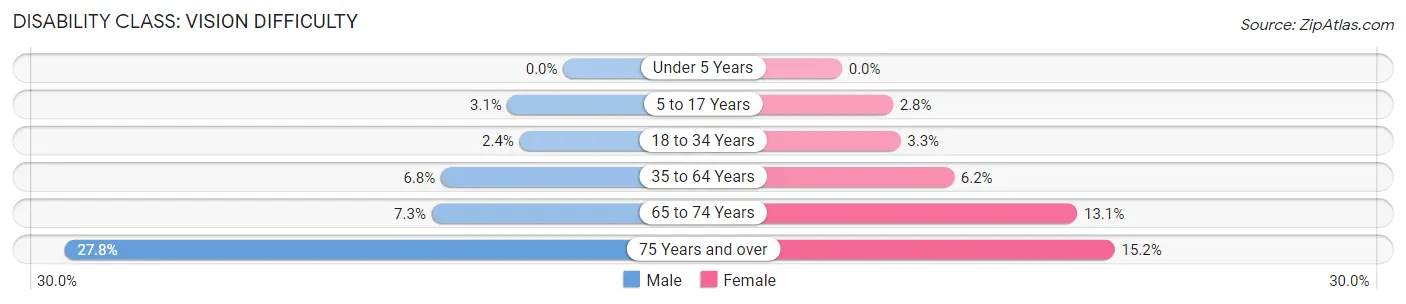
| Age Bracket | Male | Female |
| Under 5 Years | 0 (0.0%) | 0 (0.0%) |
| 5 to 17 Years | 161 (3.1%) | 136 (2.8%) |
| 18 to 34 Years | 120 (2.4%) | 207 (3.3%) |
| 35 to 64 Years | 545 (6.8%) | 615 (6.2%) |
| 65 to 74 Years | 130 (7.3%) | 258 (13.1%) |
| 75 Years and over | 212 (27.8%) | 158 (15.2%) |
Disability Class: Cognitive Difficulty
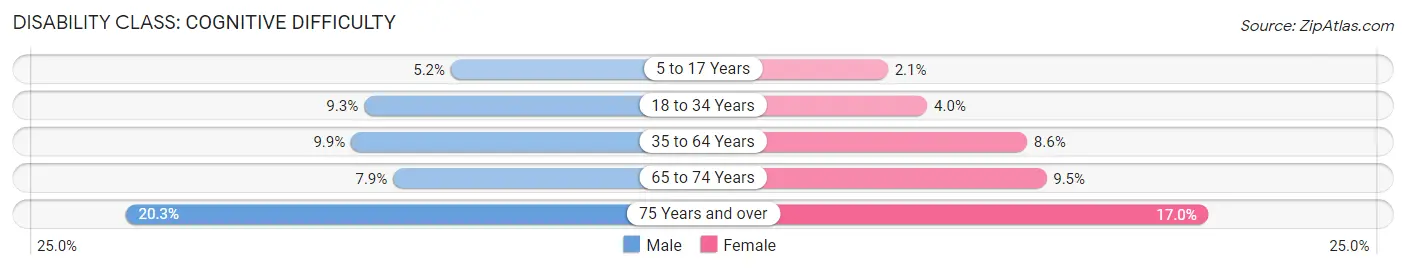
| Age Bracket | Male | Female |
| 5 to 17 Years | 271 (5.2%) | 102 (2.1%) |
| 18 to 34 Years | 456 (9.2%) | 251 (4.0%) |
| 35 to 64 Years | 788 (9.9%) | 846 (8.6%) |
| 65 to 74 Years | 140 (7.9%) | 187 (9.5%) |
| 75 Years and over | 155 (20.3%) | 177 (17.0%) |
Disability Class: Ambulatory Difficulty
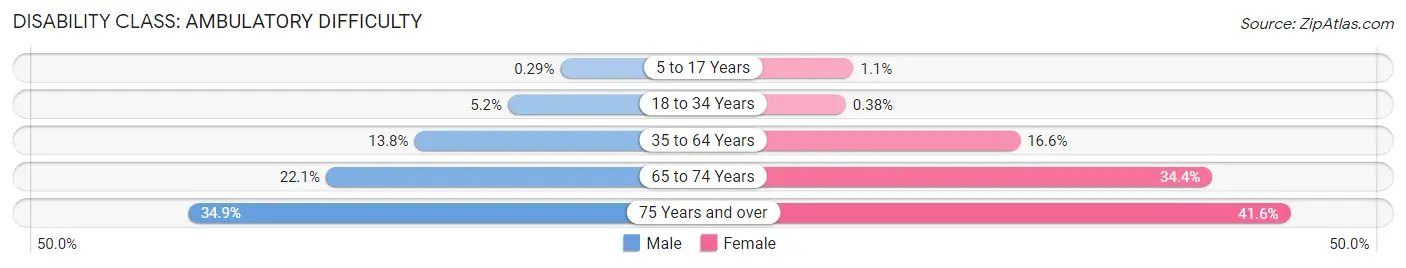
| Age Bracket | Male | Female |
| 5 to 17 Years | 15 (0.3%) | 52 (1.1%) |
| 18 to 34 Years | 254 (5.1%) | 24 (0.4%) |
| 35 to 64 Years | 1,107 (13.8%) | 1,631 (16.6%) |
| 65 to 74 Years | 391 (22.1%) | 677 (34.4%) |
| 75 Years and over | 266 (34.9%) | 433 (41.6%) |
Disability Class: Self-Care Difficulty
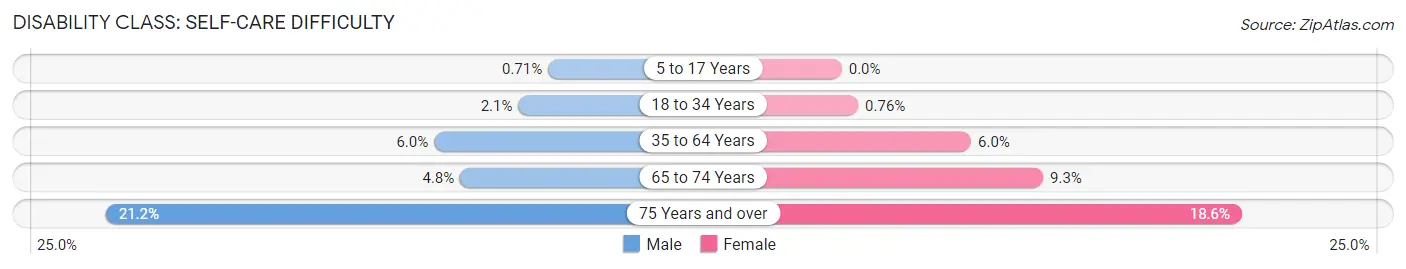
| Age Bracket | Male | Female |
| 5 to 17 Years | 37 (0.7%) | 0 (0.0%) |
| 18 to 34 Years | 103 (2.1%) | 48 (0.8%) |
| 35 to 64 Years | 480 (6.0%) | 591 (6.0%) |
| 65 to 74 Years | 85 (4.8%) | 184 (9.3%) |
| 75 Years and over | 162 (21.2%) | 193 (18.6%) |
Technology Access in Hoke County
Computing Device Access in Hoke County
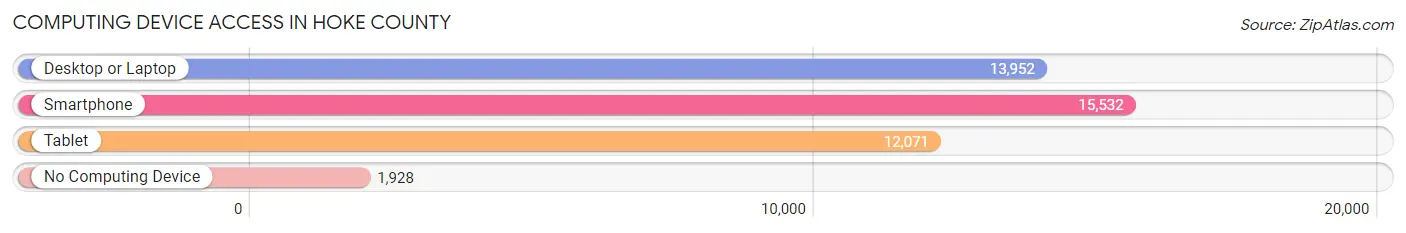
| Device Type | # Households | % Households |
| Desktop or Laptop | 13,952 | 75.5% |
| Smartphone | 15,532 | 84.0% |
| Tablet | 12,071 | 65.3% |
| No Computing Device | 1,928 | 10.4% |
| Total | 18,481 | 100.0% |
Internet Access in Hoke County
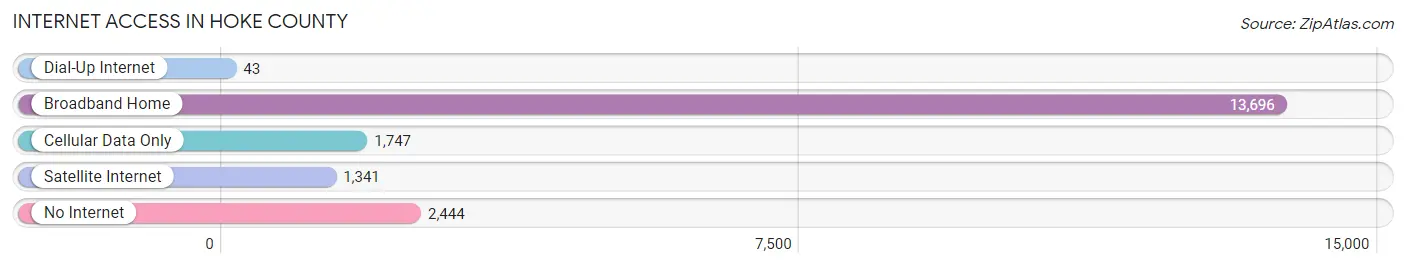
| Internet Type | # Households | % Households |
| Dial-Up Internet | 43 | 0.2% |
| Broadband Home | 13,696 | 74.1% |
| Cellular Data Only | 1,747 | 9.5% |
| Satellite Internet | 1,341 | 7.3% |
| No Internet | 2,444 | 13.2% |
| Total | 18,481 | 100.0% |
Hoke County Summary
Hoke County is located in the southern part of North Carolina, and is part of the Fayetteville Metropolitan Statistical Area. It is bordered by Scotland County to the north, Robeson County to the east, Cumberland County to the south, and Moore County to the west. The county seat is Raeford, and the county was formed in 1911 from parts of Cumberland and Scotland counties.
Geography
Hoke County covers an area of 545 square miles, and is located in the Coastal Plain region of North Carolina. The terrain is mostly flat, with some rolling hills in the northern part of the county. The county is drained by the Little River and its tributaries, which flow into the Lumber River. The county is home to several state parks, including Lumber River State Park, Jones Lake State Park, and Raven Rock State Park.
Climate
Hoke County has a humid subtropical climate, with hot, humid summers and mild winters. The average annual temperature is around 68°F, and the average annual precipitation is around 47 inches.
Demographics
As of the 2010 census, Hoke County had a population of 46,952. The racial makeup of the county was 68.3% White, 25.2% African American, 0.5% Native American, 1.2% Asian, 0.1% Pacific Islander, 3.2% from other races, and 1.7% from two or more races. Hispanic or Latino of any race were 6.2% of the population.
The median household income in Hoke County was $37,845, and the median family income was $45,945. The per capita income was $17,945. About 17.2% of the population was below the poverty line.
Economy
Hoke County's economy is largely based on agriculture, with tobacco, cotton, and soybeans being the main crops. The county is also home to several manufacturing companies, including Hoke County Manufacturing, which produces furniture, and Hoke County Textiles, which produces textiles. The county is also home to several military bases, including Fort Bragg and Pope Air Force Base.
Education
Hoke County is served by the Hoke County Schools system, which consists of 14 elementary schools, four middle schools, and four high schools. The county is also home to several private schools, including Hoke Christian Academy and Hoke County Academy. The county is also home to Sandhills Community College, which offers associate's degrees and certificate programs.
Conclusion
Hoke County is a rural county located in the southern part of North Carolina. It is home to several state parks, military bases, and manufacturing companies, and its economy is largely based on agriculture. The county is served by the Hoke County Schools system, as well as several private schools, and Sandhills Community College.
Common Questions
What is Per Capita Income in Hoke County?
Per Capita income in Hoke County is $27,991.
What is the Median Family Income in Hoke County?
Median Family Income in Hoke County is $70,671.
What is the Median Household income in Hoke County?
Median Household Income in Hoke County is $57,141.
What is Income or Wage Gap in Hoke County?
Income or Wage Gap in Hoke County is 30.5%.
Women in Hoke County earn 69.5 cents for every dollar earned by a man.
What is Family Income Deficit in Hoke County?
Family Income Deficit in Hoke County is $12,568.
Families that are below poverty line in Hoke County earn $12,568 less on average than the poverty threshold level.
What is Inequality or Gini Index in Hoke County?
Inequality or Gini Index in Hoke County is 0.48.
What is the Total Population of Hoke County?
Total Population of Hoke County is 52,612.
What is the Total Male Population of Hoke County?
Total Male Population of Hoke County is 26,017.
What is the Total Female Population of Hoke County?
Total Female Population of Hoke County is 26,595.
What is the Ratio of Males per 100 Females in Hoke County?
There are 97.83 Males per 100 Females in Hoke County.
What is the Ratio of Females per 100 Males in Hoke County?
There are 102.22 Females per 100 Males in Hoke County.
What is the Median Population Age in Hoke County?
Median Population Age in Hoke County is 33.5 Years.
What is the Average Family Size in Hoke County
Average Family Size in Hoke County is 3.5 People.
What is the Average Household Size in Hoke County
Average Household Size in Hoke County is 2.8 People.
How Large is the Labor Force in Hoke County?
There are 23,129 People in the Labor Forcein in Hoke County.
What is the Percentage of People in the Labor Force in Hoke County?
58.3% of People are in the Labor Force in Hoke County.
What is the Unemployment Rate in Hoke County?
Unemployment Rate in Hoke County is 6.4%.