Duplin County, NC Map & Demographics
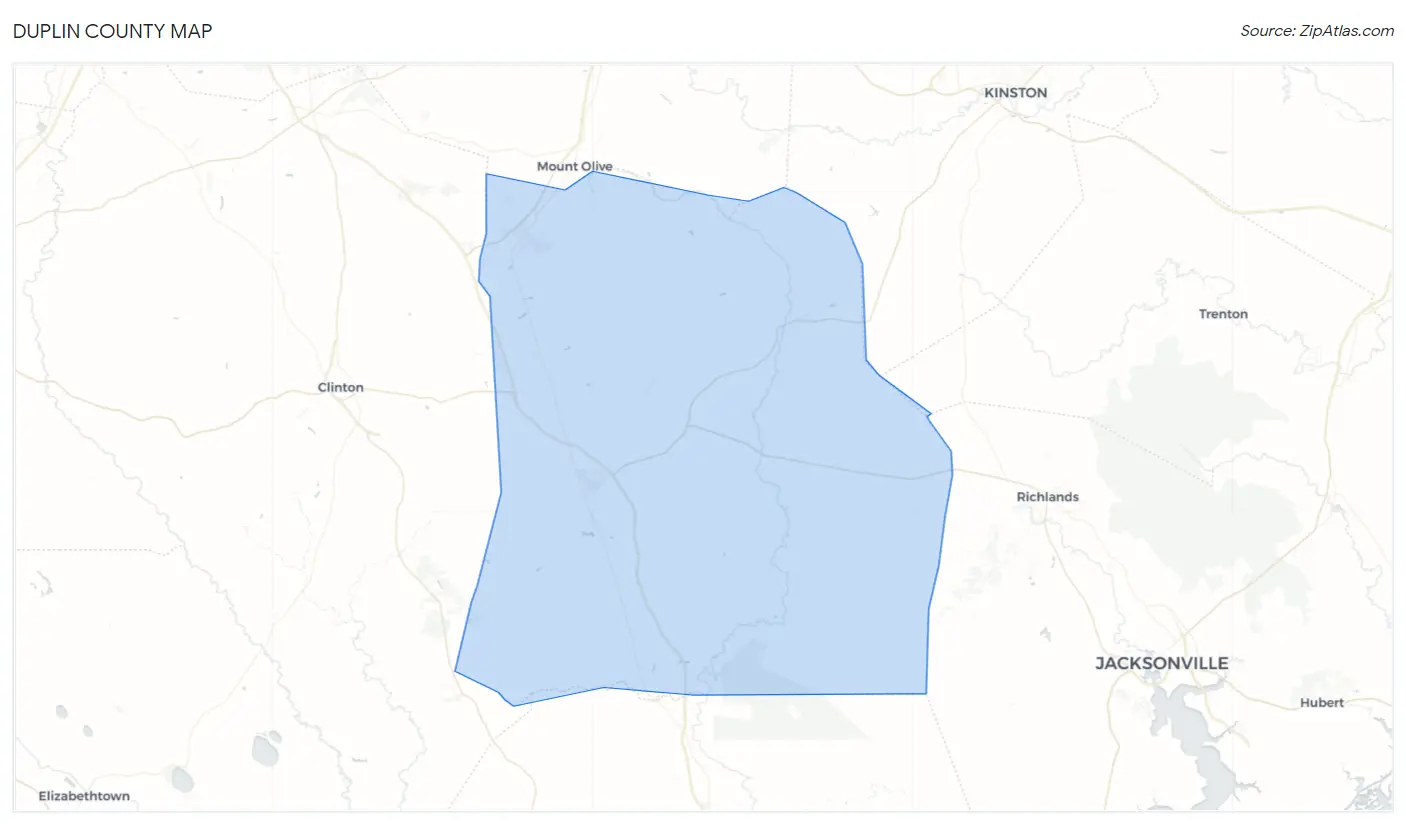
Duplin County Map
Duplin County Overview
$25,428
PER CAPITA INCOME
$63,982
AVG FAMILY INCOME
$49,376
AVG HOUSEHOLD INCOME
27.4%
WAGE / INCOME GAP [ % ]
72.6¢/ $1
WAGE / INCOME GAP [ $ ]
$11,802
FAMILY INCOME DEFICIT
0.42
INEQUALITY / GINI INDEX
49,312
TOTAL POPULATION
24,368
MALE POPULATION
24,944
FEMALE POPULATION
97.69
MALES / 100 FEMALES
102.36
FEMALES / 100 MALES
40.6
MEDIAN AGE
2.9
AVG FAMILY SIZE
2.4
AVG HOUSEHOLD SIZE
23,003
LABOR FORCE [ PEOPLE ]
58.9%
PERCENT IN LABOR FORCE
5.4%
UNEMPLOYMENT RATE
Income in Duplin County
Income Overview in Duplin County
Per Capita Income in Duplin County is $25,428, while median incomes of families and households are $63,982 and $49,376 respectively.
| Characteristic | Number | Measure |
| Per Capita Income | 49,312 | $25,428 |
| Median Family Income | 13,843 | $63,982 |
| Mean Family Income | 13,843 | $73,525 |
| Median Household Income | 20,289 | $49,376 |
| Mean Household Income | 20,289 | $63,219 |
| Income Deficit | 13,843 | $11,802 |
| Wage / Income Gap (%) | 49,312 | 27.38% |
| Wage / Income Gap ($) | 49,312 | 72.62¢ per $1 |
| Gini / Inequality Index | 49,312 | 0.42 |
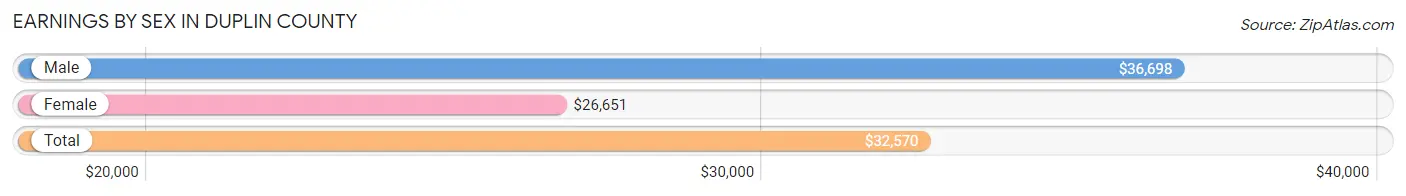
Earnings by Sex in Duplin County
Average Earnings in Duplin County are $32,570, $36,698 for men and $26,651 for women, a difference of 27.4%.
| Sex | Number | Average Earnings |
| Male | 12,950 (54.0%) | $36,698 |
| Female | 11,023 (46.0%) | $26,651 |
| Total | 23,973 (100.0%) | $32,570 |
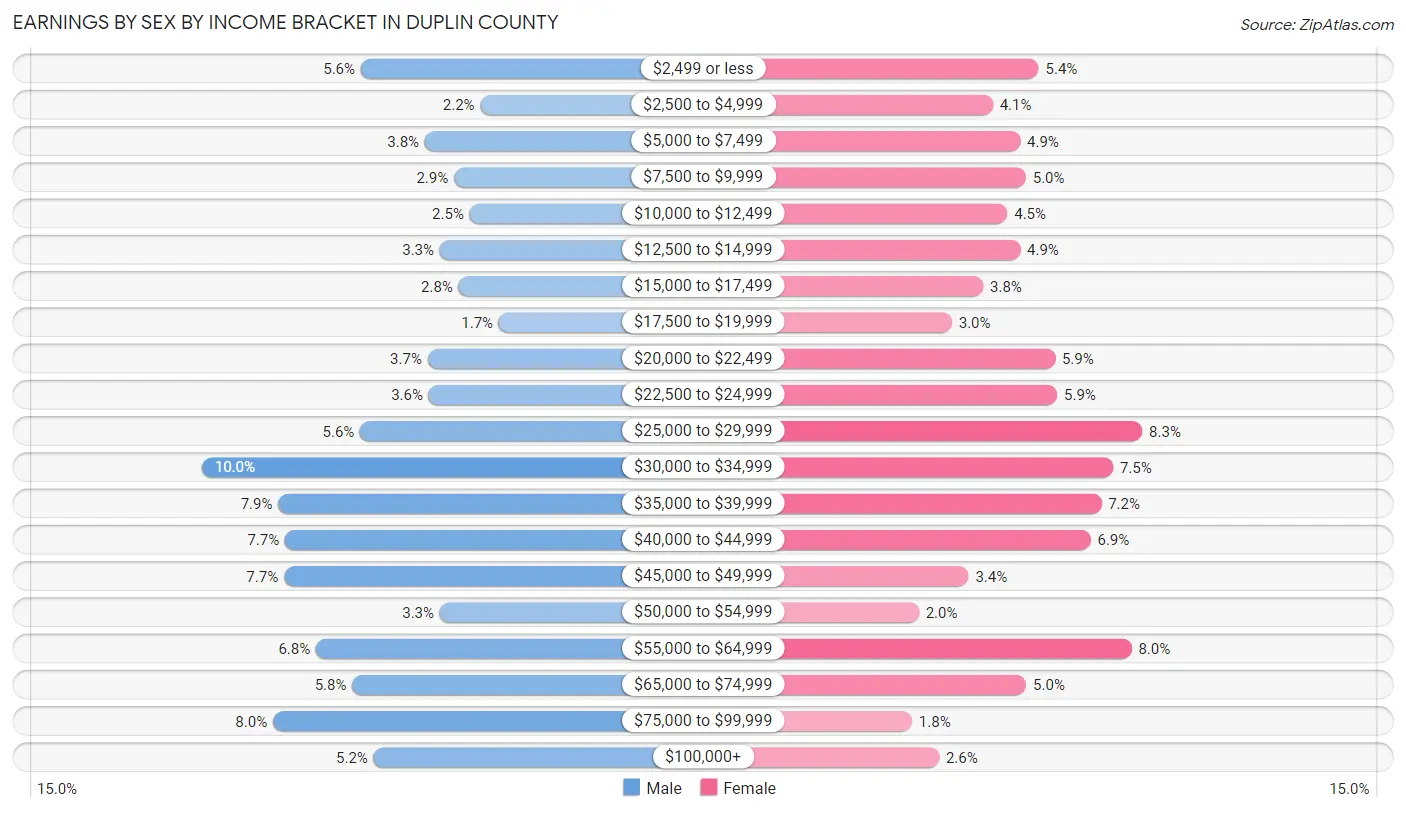
Earnings by Sex by Income Bracket in Duplin County
The most common earnings brackets in Duplin County are $30,000 to $34,999 for men (1,298 | 10.0%) and $25,000 to $29,999 for women (915 | 8.3%).
| Income | Male | Female |
| $2,499 or less | 719 (5.6%) | 594 (5.4%) |
| $2,500 to $4,999 | 283 (2.2%) | 452 (4.1%) |
| $5,000 to $7,499 | 486 (3.7%) | 537 (4.9%) |
| $7,500 to $9,999 | 380 (2.9%) | 555 (5.0%) |
| $10,000 to $12,499 | 323 (2.5%) | 497 (4.5%) |
| $12,500 to $14,999 | 431 (3.3%) | 537 (4.9%) |
| $15,000 to $17,499 | 362 (2.8%) | 422 (3.8%) |
| $17,500 to $19,999 | 216 (1.7%) | 325 (2.9%) |
| $20,000 to $22,499 | 475 (3.7%) | 645 (5.9%) |
| $22,500 to $24,999 | 472 (3.6%) | 651 (5.9%) |
| $25,000 to $29,999 | 721 (5.6%) | 915 (8.3%) |
| $30,000 to $34,999 | 1,298 (10.0%) | 825 (7.5%) |
| $35,000 to $39,999 | 1,019 (7.9%) | 788 (7.1%) |
| $40,000 to $44,999 | 994 (7.7%) | 755 (6.9%) |
| $45,000 to $49,999 | 998 (7.7%) | 377 (3.4%) |
| $50,000 to $54,999 | 431 (3.3%) | 223 (2.0%) |
| $55,000 to $64,999 | 882 (6.8%) | 882 (8.0%) |
| $65,000 to $74,999 | 750 (5.8%) | 556 (5.0%) |
| $75,000 to $99,999 | 1,038 (8.0%) | 202 (1.8%) |
| $100,000+ | 672 (5.2%) | 285 (2.6%) |
| Total | 12,950 (100.0%) | 11,023 (100.0%) |
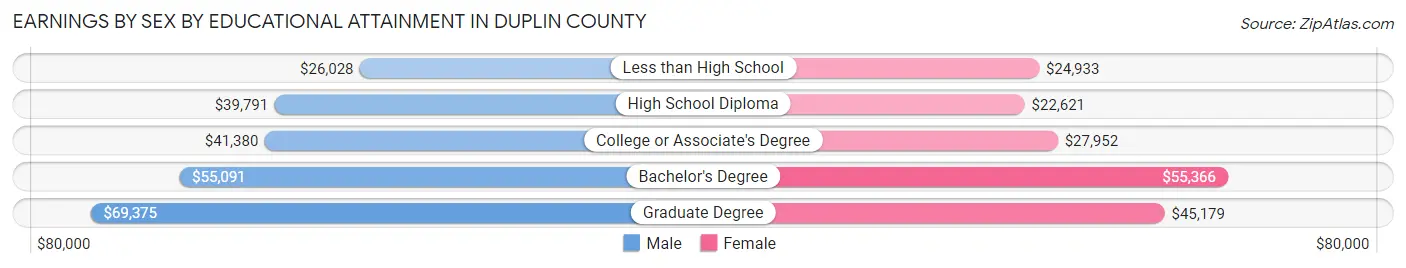
Earnings by Sex by Educational Attainment in Duplin County
Average earnings in Duplin County are $40,053 for men and $29,458 for women, a difference of 26.5%. Men with an educational attainment of graduate degree enjoy the highest average annual earnings of $69,375, while those with less than high school education earn the least with $26,028. Women with an educational attainment of bachelor's degree earn the most with the average annual earnings of $55,366, while those with high school diploma education have the smallest earnings of $22,621.
| Educational Attainment | Male Income | Female Income |
| Less than High School | $26,028 | $24,933 |
| High School Diploma | $39,791 | $22,621 |
| College or Associate's Degree | $41,380 | $27,952 |
| Bachelor's Degree | $55,091 | $55,366 |
| Graduate Degree | $69,375 | $45,179 |
| Total | $40,053 | $29,458 |
Family Income in Duplin County
Family Income Brackets in Duplin County
According to the Duplin County family income data, there are 2,962 families falling into the $50,000 to $74,999 income range, which is the most common income bracket and makes up 21.4% of all families. Conversely, the $200,000+ income bracket is the least frequent group with only 401 families (2.9%) belonging to this category.
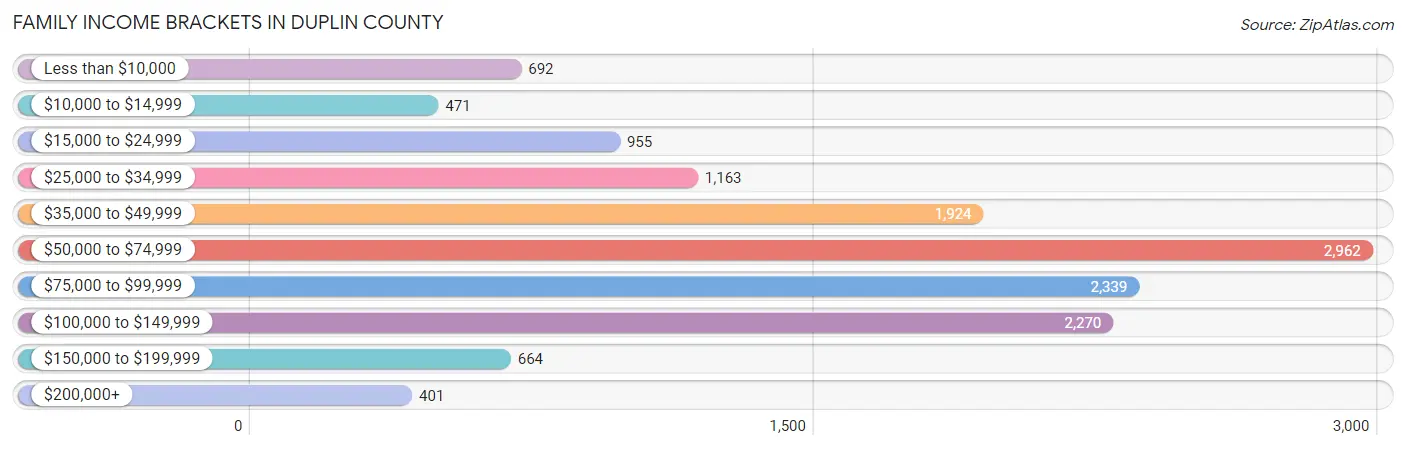
| Income Bracket | # Families | % Families |
| Less than $10,000 | 692 | 5.0% |
| $10,000 to $14,999 | 471 | 3.4% |
| $15,000 to $24,999 | 955 | 6.9% |
| $25,000 to $34,999 | 1,163 | 8.4% |
| $35,000 to $49,999 | 1,924 | 13.9% |
| $50,000 to $74,999 | 2,962 | 21.4% |
| $75,000 to $99,999 | 2,339 | 16.9% |
| $100,000 to $149,999 | 2,270 | 16.4% |
| $150,000 to $199,999 | 664 | 4.8% |
| $200,000+ | 401 | 2.9% |
Family Income by Famaliy Size in Duplin County
7+ person families (142 | 1.0%) account for the highest median family income in Duplin County with $106,643 per family, while 2-person families (6,834 | 49.4%) have the highest median income of $30,416 per family member.
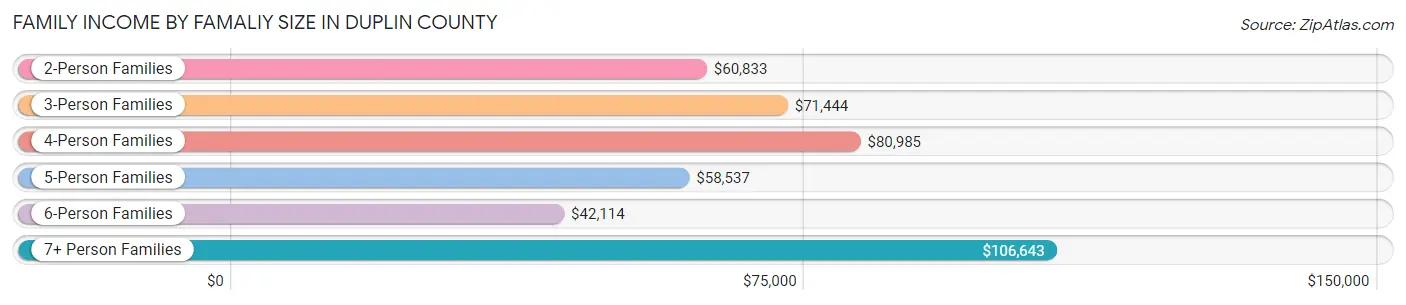
| Income Bracket | # Families | Median Income |
| 2-Person Families | 6,834 (49.4%) | $60,833 |
| 3-Person Families | 3,091 (22.3%) | $71,444 |
| 4-Person Families | 2,440 (17.6%) | $80,985 |
| 5-Person Families | 957 (6.9%) | $58,537 |
| 6-Person Families | 379 (2.7%) | $42,114 |
| 7+ Person Families | 142 (1.0%) | $106,643 |
| Total | 13,843 (100.0%) | $63,982 |
Family Income by Number of Earners in Duplin County
The median family income in Duplin County is $63,982, with families comprising 3+ earners (1,645) having the highest median family income of $108,682, while families with no earners (2,437) have the lowest median family income of $37,386, accounting for 11.9% and 17.6% of families, respectively.
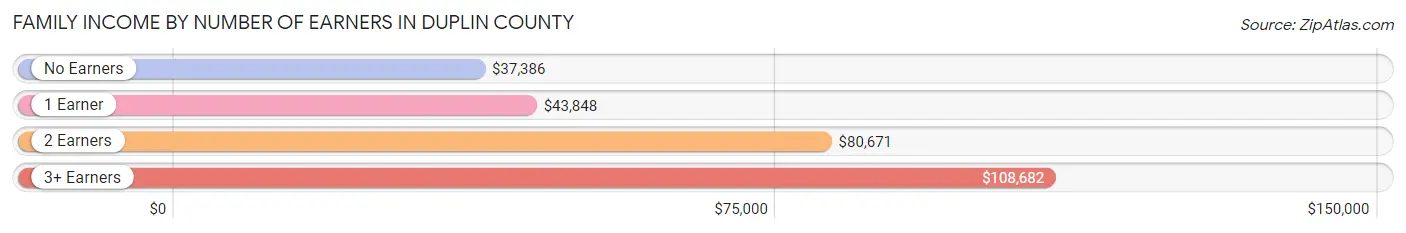
| Number of Earners | # Families | Median Income |
| No Earners | 2,437 (17.6%) | $37,386 |
| 1 Earner | 4,670 (33.7%) | $43,848 |
| 2 Earners | 5,091 (36.8%) | $80,671 |
| 3+ Earners | 1,645 (11.9%) | $108,682 |
| Total | 13,843 (100.0%) | $63,982 |
Household Income in Duplin County
Household Income Brackets in Duplin County
With 3,632 households falling in the category, the $50,000 to $74,999 income range is the most frequent in Duplin County, accounting for 17.9% of all households. In contrast, only 446 households (2.2%) fall into the $200,000+ income bracket, making it the least populous group.
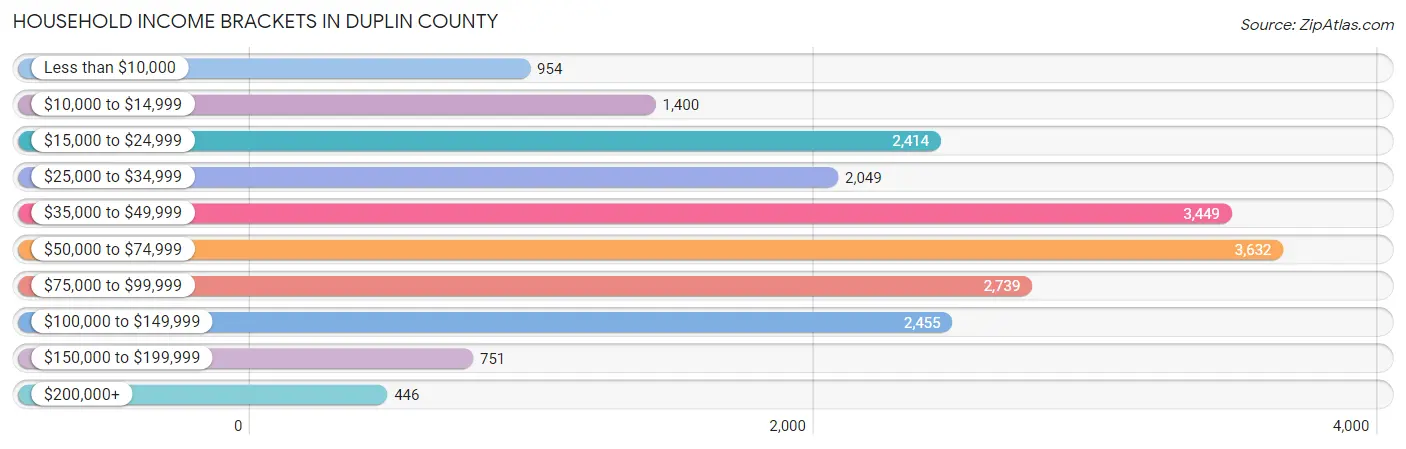
| Income Bracket | # Households | % Households |
| Less than $10,000 | 954 | 4.7% |
| $10,000 to $14,999 | 1,400 | 6.9% |
| $15,000 to $24,999 | 2,414 | 11.9% |
| $25,000 to $34,999 | 2,049 | 10.1% |
| $35,000 to $49,999 | 3,449 | 17.0% |
| $50,000 to $74,999 | 3,632 | 17.9% |
| $75,000 to $99,999 | 2,739 | 13.5% |
| $100,000 to $149,999 | 2,455 | 12.1% |
| $150,000 to $199,999 | 751 | 3.7% |
| $200,000+ | 446 | 2.2% |
Household Income by Householder Age in Duplin County
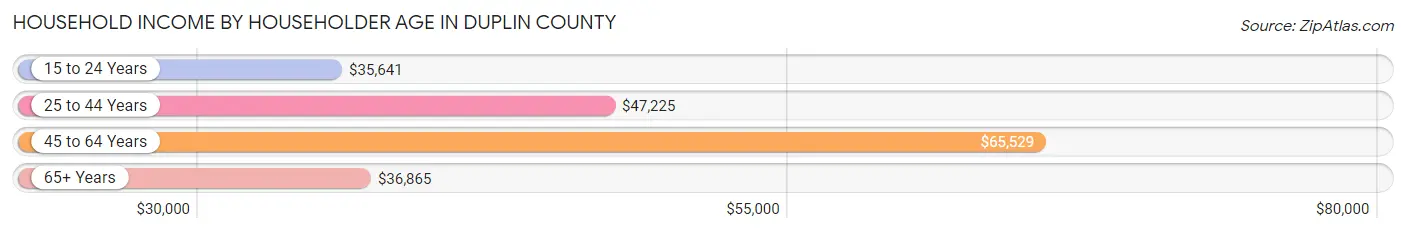
The median household income in Duplin County is $49,376, with the highest median household income of $65,529 found in the 45 to 64 years age bracket for the primary householder. A total of 7,967 households (39.3%) fall into this category. Meanwhile, the 15 to 24 years age bracket for the primary householder has the lowest median household income of $35,641, with 690 households (3.4%) in this group.
| Income Bracket | # Households | Median Income |
| 15 to 24 Years | 690 (3.4%) | $35,641 |
| 25 to 44 Years | 5,698 (28.1%) | $47,225 |
| 45 to 64 Years | 7,967 (39.3%) | $65,529 |
| 65+ Years | 5,934 (29.2%) | $36,865 |
| Total | 20,289 (100.0%) | $49,376 |
Poverty in Duplin County
Income Below Poverty by Sex and Age in Duplin County
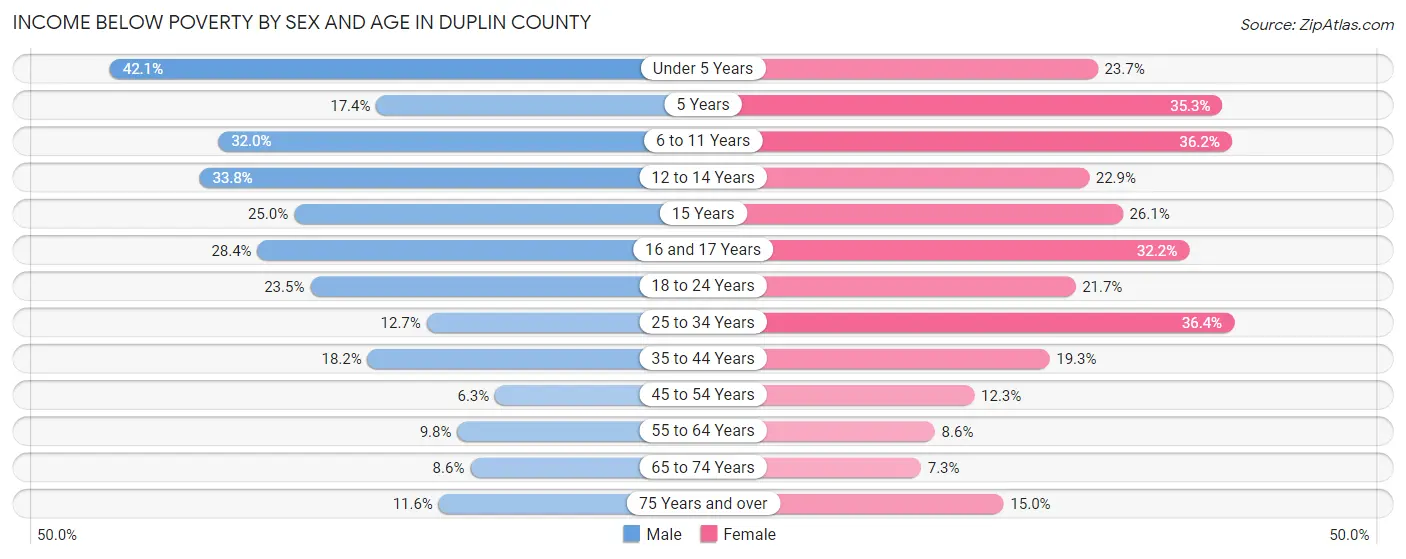
With 17.6% poverty level for males and 19.4% for females among the residents of Duplin County, under 5 year old males and 25 to 34 year old females are the most vulnerable to poverty, with 633 males (42.1%) and 997 females (36.4%) in their respective age groups living below the poverty level.
| Age Bracket | Male | Female |
| Under 5 Years | 633 (42.1%) | 331 (23.7%) |
| 5 Years | 54 (17.4%) | 119 (35.3%) |
| 6 to 11 Years | 704 (32.0%) | 605 (36.2%) |
| 12 to 14 Years | 255 (33.8%) | 256 (22.9%) |
| 15 Years | 67 (25.0%) | 105 (26.1%) |
| 16 and 17 Years | 251 (28.4%) | 176 (32.2%) |
| 18 to 24 Years | 524 (23.5%) | 435 (21.7%) |
| 25 to 34 Years | 345 (12.7%) | 997 (36.4%) |
| 35 to 44 Years | 503 (18.2%) | 523 (19.3%) |
| 45 to 54 Years | 196 (6.3%) | 383 (12.3%) |
| 55 to 64 Years | 320 (9.8%) | 298 (8.6%) |
| 65 to 74 Years | 223 (8.6%) | 214 (7.3%) |
| 75 Years and over | 178 (11.6%) | 329 (15.0%) |
| Total | 4,253 (17.6%) | 4,771 (19.4%) |
Income Above Poverty by Sex and Age in Duplin County
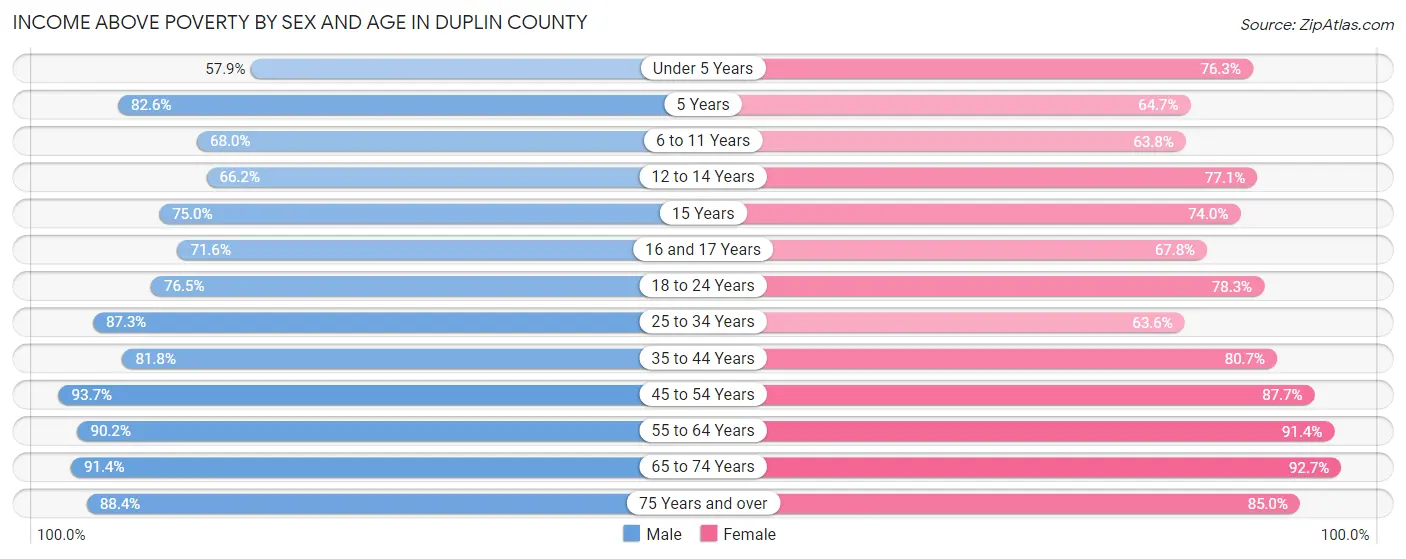
According to the poverty statistics in Duplin County, males aged 45 to 54 years and females aged 65 to 74 years are the age groups that are most secure financially, with 93.7% of males and 92.7% of females in these age groups living above the poverty line.
| Age Bracket | Male | Female |
| Under 5 Years | 871 (57.9%) | 1,064 (76.3%) |
| 5 Years | 257 (82.6%) | 218 (64.7%) |
| 6 to 11 Years | 1,494 (68.0%) | 1,067 (63.8%) |
| 12 to 14 Years | 500 (66.2%) | 861 (77.1%) |
| 15 Years | 201 (75.0%) | 298 (74.0%) |
| 16 and 17 Years | 633 (71.6%) | 370 (67.8%) |
| 18 to 24 Years | 1,707 (76.5%) | 1,573 (78.3%) |
| 25 to 34 Years | 2,373 (87.3%) | 1,743 (63.6%) |
| 35 to 44 Years | 2,266 (81.8%) | 2,192 (80.7%) |
| 45 to 54 Years | 2,899 (93.7%) | 2,735 (87.7%) |
| 55 to 64 Years | 2,931 (90.2%) | 3,158 (91.4%) |
| 65 to 74 Years | 2,358 (91.4%) | 2,704 (92.7%) |
| 75 Years and over | 1,360 (88.4%) | 1,865 (85.0%) |
| Total | 19,850 (82.4%) | 19,848 (80.6%) |
Income Below Poverty Among Married-Couple Families in Duplin County
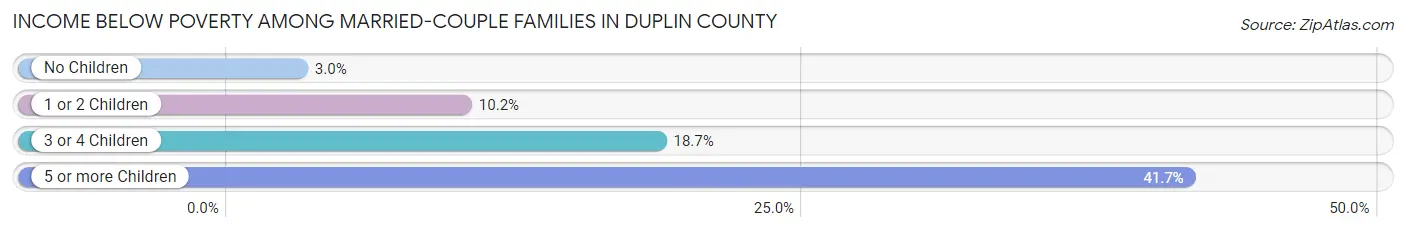
The poverty statistics for married-couple families in Duplin County show that 6.2% or 628 of the total 10,059 families live below the poverty line. Families with 5 or more children have the highest poverty rate of 41.7%, comprising of 10 families. On the other hand, families with no children have the lowest poverty rate of 3.0%, which includes 194 families.
| Children | Above Poverty | Below Poverty |
| No Children | 6,192 (97.0%) | 194 (3.0%) |
| 1 or 2 Children | 2,719 (89.8%) | 308 (10.2%) |
| 3 or 4 Children | 506 (81.4%) | 116 (18.6%) |
| 5 or more Children | 14 (58.3%) | 10 (41.7%) |
| Total | 9,431 (93.8%) | 628 (6.2%) |
Income Below Poverty Among Single-Parent Households in Duplin County
According to the poverty data in Duplin County, 25.1% or 281 single-father households and 39.0% or 1,039 single-mother households are living below the poverty line. Among single-father households, those with 5 or more children have the highest poverty rate, with 17 households (85.0%) experiencing poverty. Likewise, among single-mother households, those with 5 or more children have the highest poverty rate, with 13 households (100.0%) falling below the poverty line.
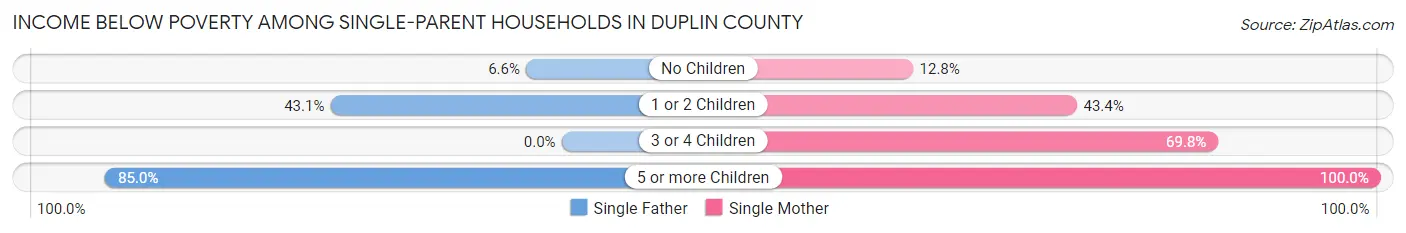
| Children | Single Father | Single Mother |
| No Children | 34 (6.6%) | 110 (12.8%) |
| 1 or 2 Children | 230 (43.1%) | 554 (43.4%) |
| 3 or 4 Children | 0 (0.0%) | 362 (69.8%) |
| 5 or more Children | 17 (85.0%) | 13 (100.0%) |
| Total | 281 (25.1%) | 1,039 (39.0%) |
Income Below Poverty Among Married-Couple vs Single-Parent Households in Duplin County
The poverty data for Duplin County shows that 628 of the married-couple family households (6.2%) and 1,320 of the single-parent households (34.9%) are living below the poverty level. Within the married-couple family households, those with 5 or more children have the highest poverty rate, with 10 households (41.7%) falling below the poverty line. Among the single-parent households, those with 5 or more children have the highest poverty rate, with 30 household (90.9%) living below poverty.
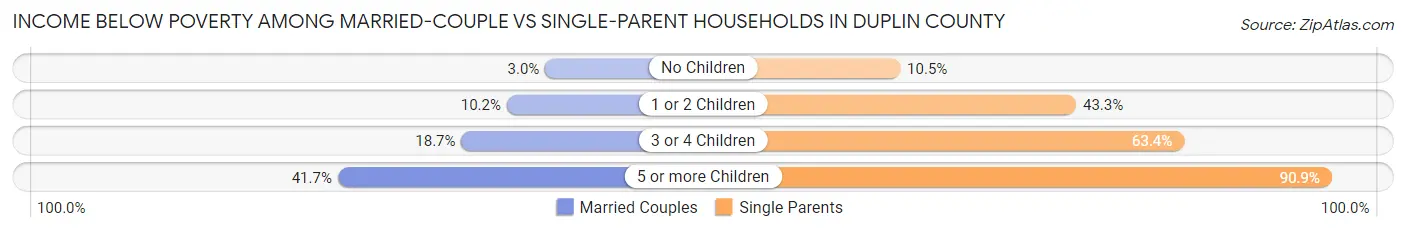
| Children | Married-Couple Families | Single-Parent Households |
| No Children | 194 (3.0%) | 144 (10.5%) |
| 1 or 2 Children | 308 (10.2%) | 784 (43.3%) |
| 3 or 4 Children | 116 (18.6%) | 362 (63.4%) |
| 5 or more Children | 10 (41.7%) | 30 (90.9%) |
| Total | 628 (6.2%) | 1,320 (34.9%) |
Race in Duplin County
The most populous races in Duplin County are White / Caucasian (30,070 | 61.0%), Hispanic or Latino (11,446 | 23.2%), and Black / African American (10,598 | 21.5%).
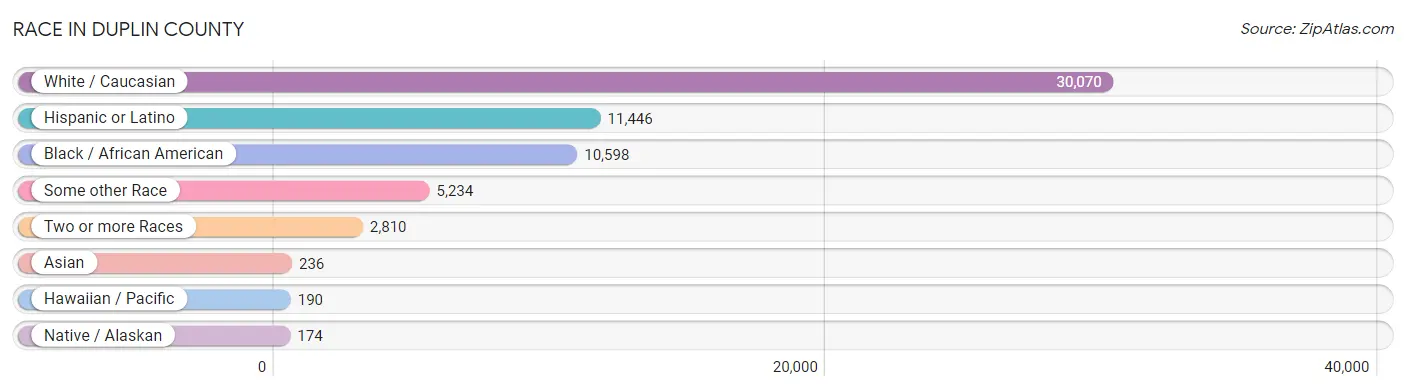
| Race | # Population | % Population |
| Asian | 236 | 0.5% |
| Black / African American | 10,598 | 21.5% |
| Hawaiian / Pacific | 190 | 0.4% |
| Hispanic or Latino | 11,446 | 23.2% |
| Native / Alaskan | 174 | 0.4% |
| White / Caucasian | 30,070 | 61.0% |
| Two or more Races | 2,810 | 5.7% |
| Some other Race | 5,234 | 10.6% |
| Total | 49,312 | 100.0% |
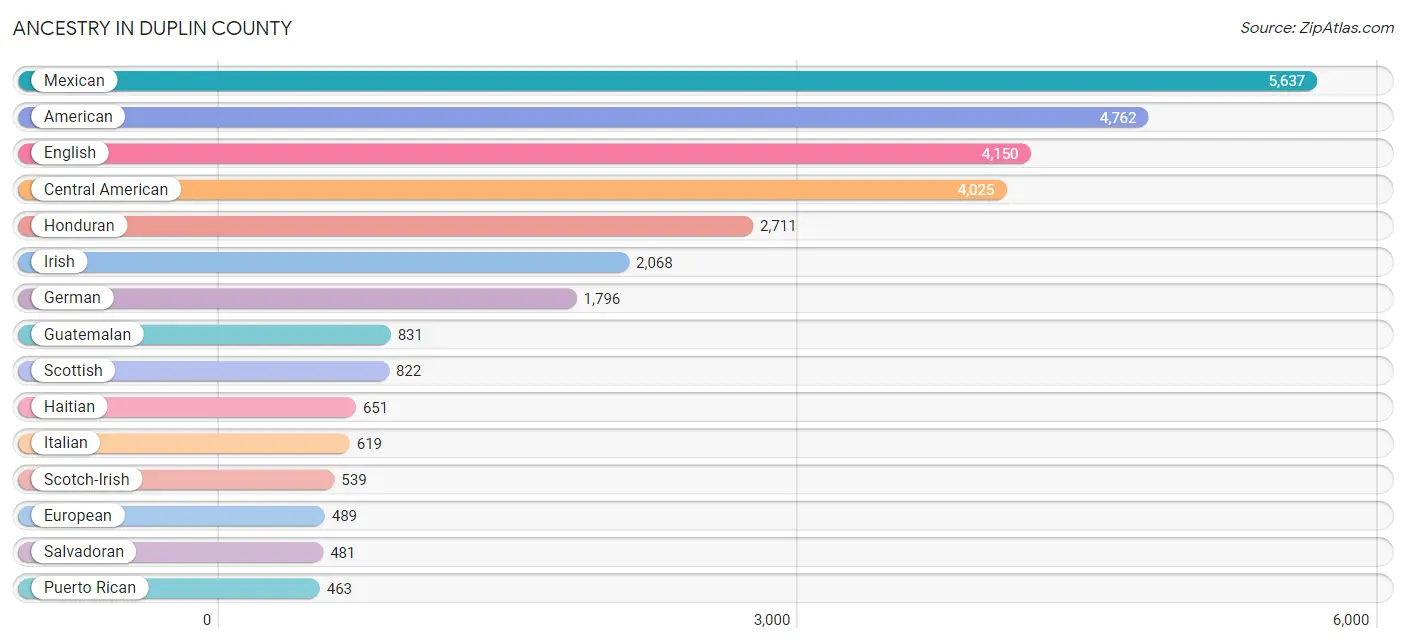
Ancestry in Duplin County
The most populous ancestries reported in Duplin County are Mexican (5,637 | 11.4%), American (4,762 | 9.7%), English (4,150 | 8.4%), Central American (4,025 | 8.2%), and Honduran (2,711 | 5.5%), together accounting for 43.2% of all Duplin County residents.
| Ancestry | # Population | % Population |
| African | 94 | 0.2% |
| American | 4,762 | 9.7% |
| Arab | 50 | 0.1% |
| Austrian | 13 | 0.0% |
| Blackfeet | 1 | 0.0% |
| British | 122 | 0.3% |
| Bulgarian | 1 | 0.0% |
| Burmese | 129 | 0.3% |
| Canadian | 22 | 0.0% |
| Celtic | 7 | 0.0% |
| Central American | 4,025 | 8.2% |
| Central American Indian | 32 | 0.1% |
| Cherokee | 98 | 0.2% |
| Chippewa | 4 | 0.0% |
| Colombian | 5 | 0.0% |
| Croatian | 7 | 0.0% |
| Cuban | 258 | 0.5% |
| Czech | 36 | 0.1% |
| Danish | 14 | 0.0% |
| Delaware | 12 | 0.0% |
| Dominican | 36 | 0.1% |
| Dutch | 98 | 0.2% |
| Eastern European | 28 | 0.1% |
| Ecuadorian | 27 | 0.1% |
| English | 4,150 | 8.4% |
| Ethiopian | 1 | 0.0% |
| European | 489 | 1.0% |
| Finnish | 21 | 0.0% |
| French | 343 | 0.7% |
| French Canadian | 32 | 0.1% |
| German | 1,796 | 3.6% |
| Guatemalan | 831 | 1.7% |
| Haitian | 651 | 1.3% |
| Honduran | 2,711 | 5.5% |
| Hungarian | 15 | 0.0% |
| Indian (Asian) | 41 | 0.1% |
| Irish | 2,068 | 4.2% |
| Iroquois | 122 | 0.3% |
| Italian | 619 | 1.3% |
| Jamaican | 165 | 0.3% |
| Korean | 49 | 0.1% |
| Lumbee | 121 | 0.3% |
| Mexican | 5,637 | 11.4% |
| Mexican American Indian | 44 | 0.1% |
| Native Hawaiian | 70 | 0.1% |
| Nigerian | 29 | 0.1% |
| Northern European | 55 | 0.1% |
| Norwegian | 40 | 0.1% |
| Pakistani | 8 | 0.0% |
| Palestinian | 50 | 0.1% |
| Panamanian | 2 | 0.0% |
| Pennsylvania German | 14 | 0.0% |
| Polish | 244 | 0.5% |
| Puerto Rican | 463 | 0.9% |
| Russian | 65 | 0.1% |
| Salvadoran | 481 | 1.0% |
| Scandinavian | 135 | 0.3% |
| Scotch-Irish | 539 | 1.1% |
| Scottish | 822 | 1.7% |
| Slovak | 7 | 0.0% |
| South American | 32 | 0.1% |
| Spaniard | 6 | 0.0% |
| Spanish | 1 | 0.0% |
| Spanish American Indian | 1 | 0.0% |
| Sri Lankan | 48 | 0.1% |
| Subsaharan African | 124 | 0.3% |
| Swedish | 46 | 0.1% |
| Thai | 51 | 0.1% |
| Tongan | 154 | 0.3% |
| Ukrainian | 7 | 0.0% |
| Welsh | 228 | 0.5% |
| West Indian | 10 | 0.0% |
| Yugoslavian | 48 | 0.1% | View All 73 Rows |
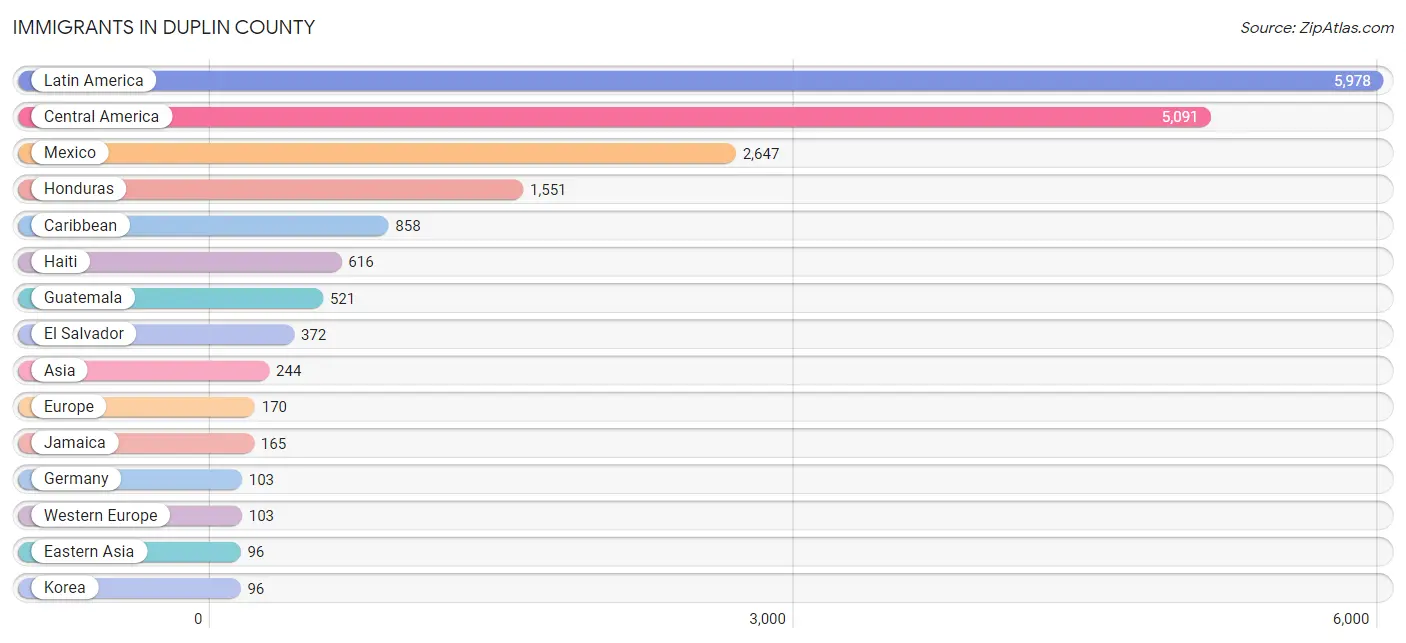
Immigrants in Duplin County
The most numerous immigrant groups reported in Duplin County came from Latin America (5,978 | 12.1%), Central America (5,091 | 10.3%), Mexico (2,647 | 5.4%), Honduras (1,551 | 3.2%), and Caribbean (858 | 1.7%), together accounting for 32.7% of all Duplin County residents.
| Immigration Origin | # Population | % Population |
| Africa | 5 | 0.0% |
| Asia | 244 | 0.5% |
| Bulgaria | 1 | 0.0% |
| Canada | 21 | 0.0% |
| Caribbean | 858 | 1.7% |
| Central America | 5,091 | 10.3% |
| Colombia | 2 | 0.0% |
| Cuba | 45 | 0.1% |
| Dominican Republic | 32 | 0.1% |
| Eastern Africa | 5 | 0.0% |
| Eastern Asia | 96 | 0.2% |
| Eastern Europe | 30 | 0.1% |
| Ecuador | 27 | 0.1% |
| El Salvador | 372 | 0.7% |
| Ethiopia | 1 | 0.0% |
| Europe | 170 | 0.3% |
| Germany | 103 | 0.2% |
| Guatemala | 521 | 1.1% |
| Haiti | 616 | 1.3% |
| Honduras | 1,551 | 3.2% |
| India | 32 | 0.1% |
| Ireland | 3 | 0.0% |
| Jamaica | 165 | 0.3% |
| Korea | 96 | 0.2% |
| Latin America | 5,978 | 12.1% |
| Mexico | 2,647 | 5.4% |
| Northern Europe | 37 | 0.1% |
| Philippines | 32 | 0.1% |
| Russia | 29 | 0.1% |
| Scotland | 27 | 0.1% |
| South America | 29 | 0.1% |
| South Central Asia | 32 | 0.1% |
| South Eastern Asia | 88 | 0.2% |
| Sweden | 7 | 0.0% |
| Thailand | 8 | 0.0% |
| Vietnam | 48 | 0.1% |
| Western Europe | 103 | 0.2% | View All 37 Rows |
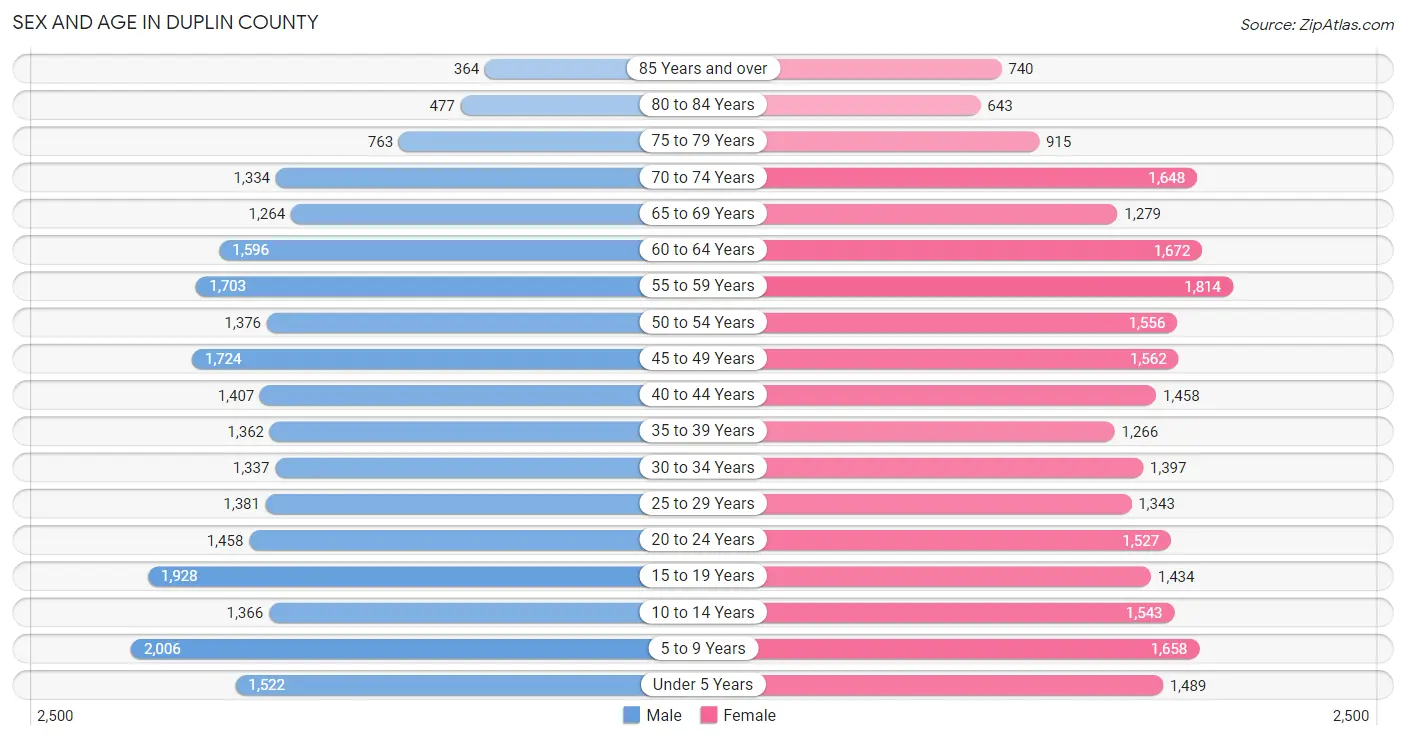
Sex and Age in Duplin County
Sex and Age in Duplin County
The most populous age groups in Duplin County are 5 to 9 Years (2,006 | 8.2%) for men and 55 to 59 Years (1,814 | 7.3%) for women.
| Age Bracket | Male | Female |
| Under 5 Years | 1,522 (6.2%) | 1,489 (6.0%) |
| 5 to 9 Years | 2,006 (8.2%) | 1,658 (6.7%) |
| 10 to 14 Years | 1,366 (5.6%) | 1,543 (6.2%) |
| 15 to 19 Years | 1,928 (7.9%) | 1,434 (5.8%) |
| 20 to 24 Years | 1,458 (6.0%) | 1,527 (6.1%) |
| 25 to 29 Years | 1,381 (5.7%) | 1,343 (5.4%) |
| 30 to 34 Years | 1,337 (5.5%) | 1,397 (5.6%) |
| 35 to 39 Years | 1,362 (5.6%) | 1,266 (5.1%) |
| 40 to 44 Years | 1,407 (5.8%) | 1,458 (5.9%) |
| 45 to 49 Years | 1,724 (7.1%) | 1,562 (6.3%) |
| 50 to 54 Years | 1,376 (5.7%) | 1,556 (6.2%) |
| 55 to 59 Years | 1,703 (7.0%) | 1,814 (7.3%) |
| 60 to 64 Years | 1,596 (6.6%) | 1,672 (6.7%) |
| 65 to 69 Years | 1,264 (5.2%) | 1,279 (5.1%) |
| 70 to 74 Years | 1,334 (5.5%) | 1,648 (6.6%) |
| 75 to 79 Years | 763 (3.1%) | 915 (3.7%) |
| 80 to 84 Years | 477 (2.0%) | 643 (2.6%) |
| 85 Years and over | 364 (1.5%) | 740 (3.0%) |
| Total | 24,368 (100.0%) | 24,944 (100.0%) |
Families and Households in Duplin County
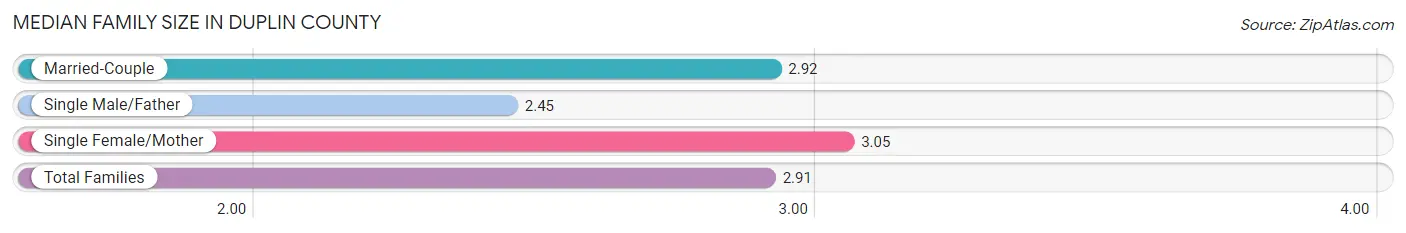
Median Family Size in Duplin County
The median family size in Duplin County is 2.91 persons per family, with single female/mother families (2,666 | 19.3%) accounting for the largest median family size of 3.05 persons per family. On the other hand, single male/father families (1,118 | 8.1%) represent the smallest median family size with 2.45 persons per family.
| Family Type | # Families | Family Size |
| Married-Couple | 10,059 (72.7%) | 2.92 |
| Single Male/Father | 1,118 (8.1%) | 2.45 |
| Single Female/Mother | 2,666 (19.3%) | 3.05 |
| Total Families | 13,843 (100.0%) | 2.91 |
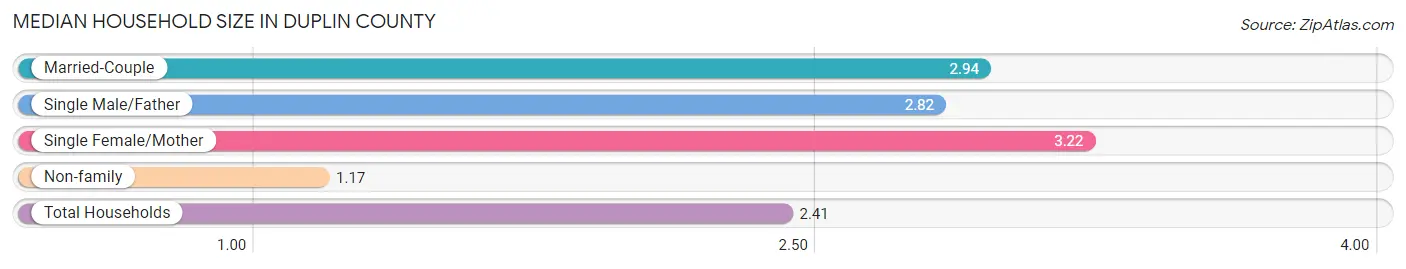
Median Household Size in Duplin County
The median household size in Duplin County is 2.41 persons per household, with single female/mother households (2,666 | 13.1%) accounting for the largest median household size of 3.22 persons per household. non-family households (6,446 | 31.8%) represent the smallest median household size with 1.17 persons per household.
| Household Type | # Households | Household Size |
| Married-Couple | 10,059 (49.6%) | 2.94 |
| Single Male/Father | 1,118 (5.5%) | 2.82 |
| Single Female/Mother | 2,666 (13.1%) | 3.22 |
| Non-family | 6,446 (31.8%) | 1.17 |
| Total Households | 20,289 (100.0%) | 2.41 |
Household Size by Marriage Status in Duplin County
Out of a total of 20,289 households in Duplin County, 13,843 (68.2%) are family households, while 6,446 (31.8%) are nonfamily households. The most numerous type of family households are 2-person households, comprising 6,382, and the most common type of nonfamily households are 1-person households, comprising 5,515.
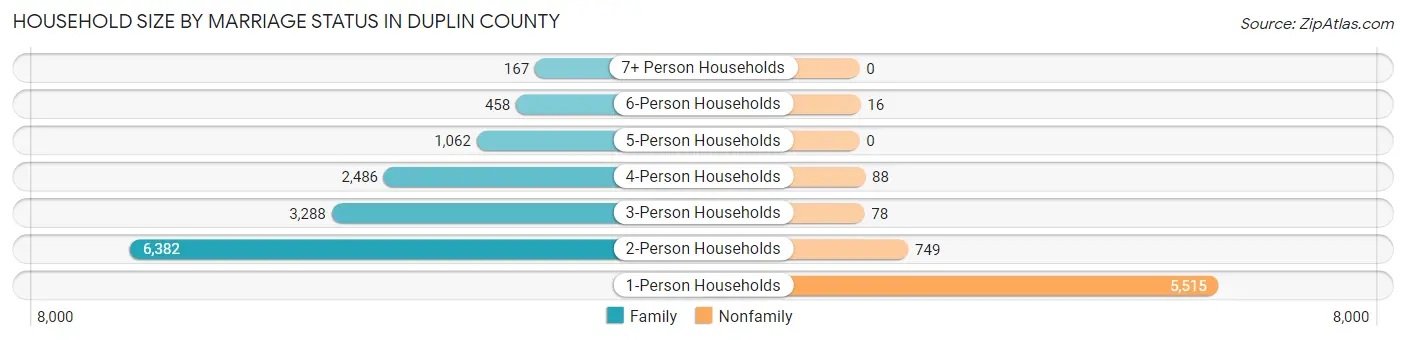
| Household Size | Family Households | Nonfamily Households |
| 1-Person Households | - | 5,515 (27.2%) |
| 2-Person Households | 6,382 (31.5%) | 749 (3.7%) |
| 3-Person Households | 3,288 (16.2%) | 78 (0.4%) |
| 4-Person Households | 2,486 (12.2%) | 88 (0.4%) |
| 5-Person Households | 1,062 (5.2%) | 0 (0.0%) |
| 6-Person Households | 458 (2.3%) | 16 (0.1%) |
| 7+ Person Households | 167 (0.8%) | 0 (0.0%) |
| Total | 13,843 (68.2%) | 6,446 (31.8%) |
Female Fertility in Duplin County
Fertility by Age in Duplin County
Average fertility rate in Duplin County is 99.0 births per 1,000 women. Women in the age bracket of 20 to 34 years have the highest fertility rate with 202.0 births per 1,000 women. Women in the age bracket of 20 to 34 years acount for 84.4% of all women with births.
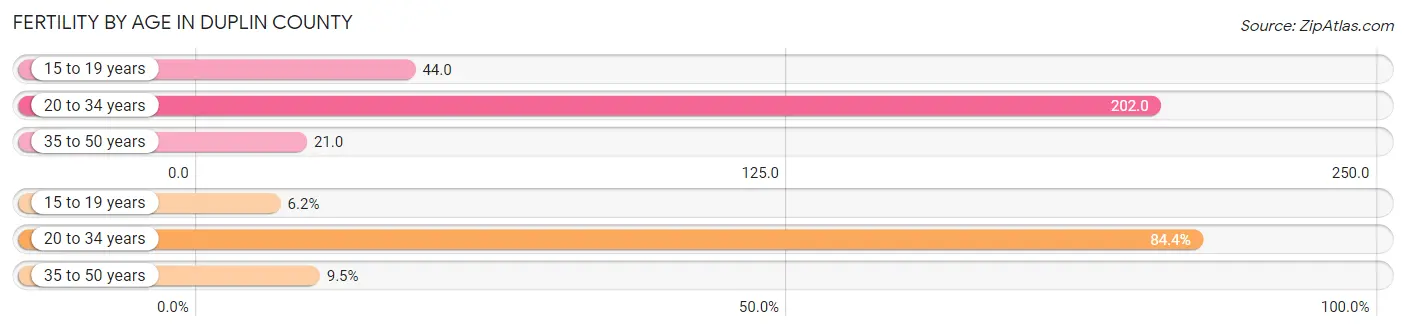
| Age Bracket | Women with Births | Births / 1,000 Women |
| 15 to 19 years | 63 (6.2%) | 44.0 |
| 20 to 34 years | 863 (84.4%) | 202.0 |
| 35 to 50 years | 97 (9.5%) | 21.0 |
| Total | 1,023 (100.0%) | 99.0 |
Fertility by Age by Marriage Status in Duplin County
51.8% of women with births (1,023) in Duplin County are married. The highest percentage of unmarried women with births falls into 15 to 19 years age bracket with 60.3% of them unmarried at the time of birth, while the lowest percentage of unmarried women with births belong to 35 to 50 years age bracket with 6.2% of them unmarried.
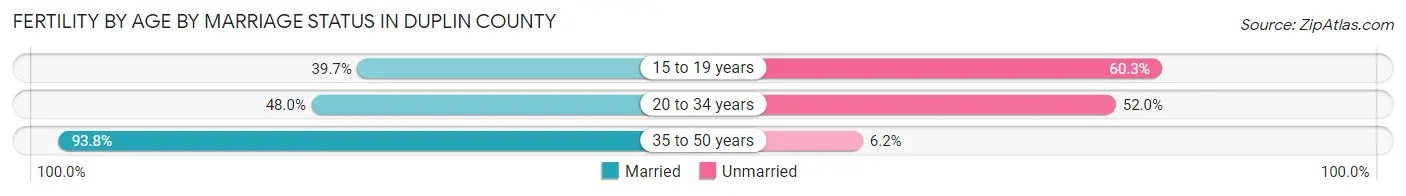
| Age Bracket | Married | Unmarried |
| 15 to 19 years | 25 (39.7%) | 38 (60.3%) |
| 20 to 34 years | 414 (48.0%) | 449 (52.0%) |
| 35 to 50 years | 91 (93.8%) | 6 (6.2%) |
| Total | 530 (51.8%) | 493 (48.2%) |
Fertility by Education in Duplin County
Average fertility rate in Duplin County is 99.0 births per 1,000 women. Women with the education attainment of graduate degree have the highest fertility rate of 202.0 births per 1,000 women, while women with the education attainment of high school diploma have the lowest fertility at 28.0 births per 1,000 women. Women with the education attainment of college or associate's degree represent 59.7% of all women with births.
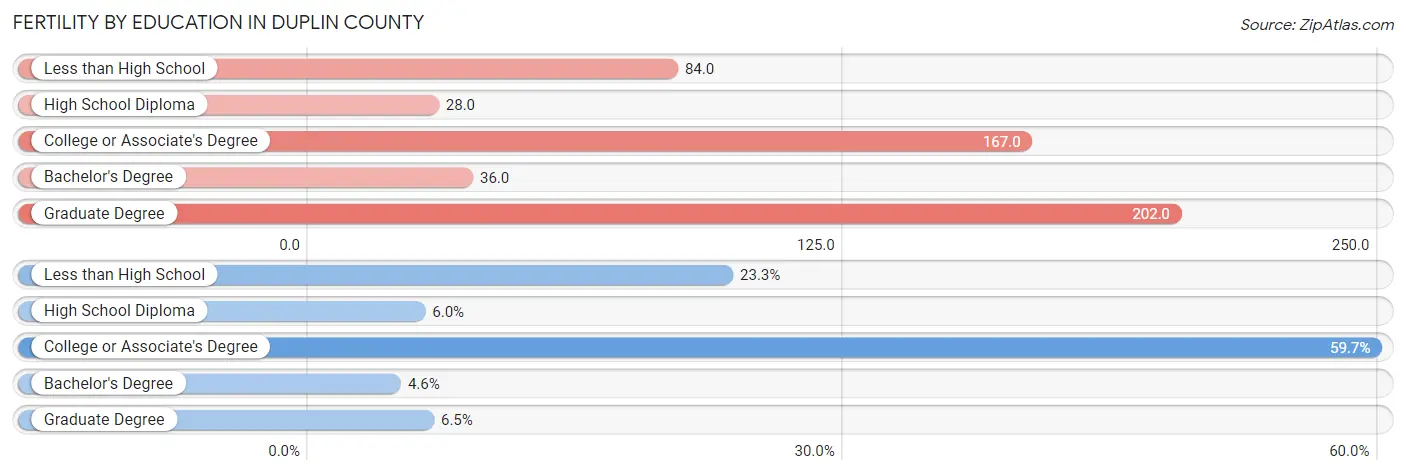
| Educational Attainment | Women with Births | Births / 1,000 Women |
| Less than High School | 238 (23.3%) | 84.0 |
| High School Diploma | 61 (6.0%) | 28.0 |
| College or Associate's Degree | 611 (59.7%) | 167.0 |
| Bachelor's Degree | 47 (4.6%) | 36.0 |
| Graduate Degree | 66 (6.5%) | 202.0 |
| Total | 1,023 (100.0%) | 99.0 |
Fertility by Education by Marriage Status in Duplin County
48.2% of women with births in Duplin County are unmarried. Women with the educational attainment of bachelor's degree are most likely to be married with 100.0% of them married at childbirth, while women with the educational attainment of less than high school are least likely to be married with 73.1% of them unmarried at childbirth.
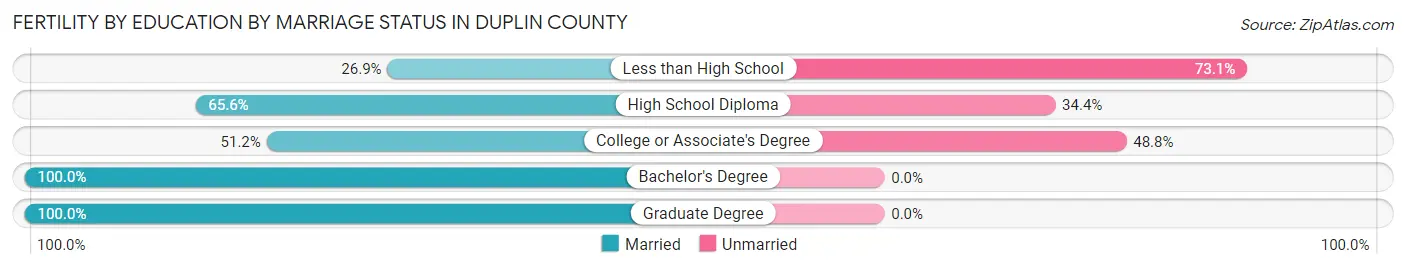
| Educational Attainment | Married | Unmarried |
| Less than High School | 64 (26.9%) | 174 (73.1%) |
| High School Diploma | 40 (65.6%) | 21 (34.4%) |
| College or Associate's Degree | 313 (51.2%) | 298 (48.8%) |
| Bachelor's Degree | 47 (100.0%) | 0 (0.0%) |
| Graduate Degree | 66 (100.0%) | 0 (0.0%) |
| Total | 530 (51.8%) | 493 (48.2%) |
Employment Characteristics in Duplin County
Employment by Class of Employer in Duplin County
Among the 21,072 employed individuals in Duplin County, private company employees (14,624 | 69.4%), self-employed (not incorporated) (1,745 | 8.3%), and local government employees (1,680 | 8.0%) make up the most common classes of employment.
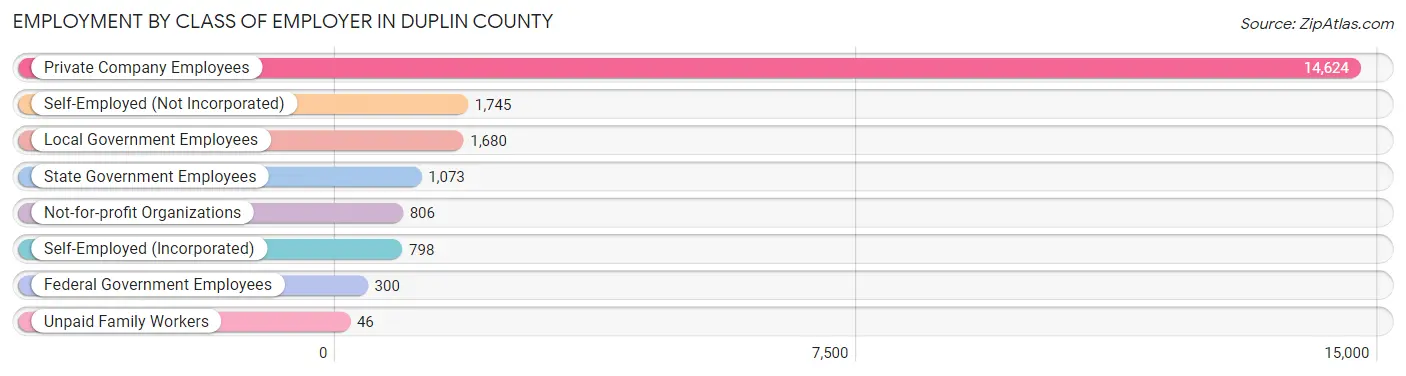
| Employer Class | # Employees | % Employees |
| Private Company Employees | 14,624 | 69.4% |
| Self-Employed (Incorporated) | 798 | 3.8% |
| Self-Employed (Not Incorporated) | 1,745 | 8.3% |
| Not-for-profit Organizations | 806 | 3.8% |
| Local Government Employees | 1,680 | 8.0% |
| State Government Employees | 1,073 | 5.1% |
| Federal Government Employees | 300 | 1.4% |
| Unpaid Family Workers | 46 | 0.2% |
| Total | 21,072 | 100.0% |
Employment Status by Age in Duplin County
According to the labor force statistics for Duplin County, out of the total population over 16 years of age (39,054), 58.9% or 23,003 individuals are in the labor force, with 5.4% or 1,242 of them unemployed. The age group with the highest labor force participation rate is 30 to 34 years, with 85.6% or 2,340 individuals in the labor force. Within the labor force, the 16 to 19 years age range has the highest percentage of unemployed individuals, with 20.6% or 220 of them being unemployed.
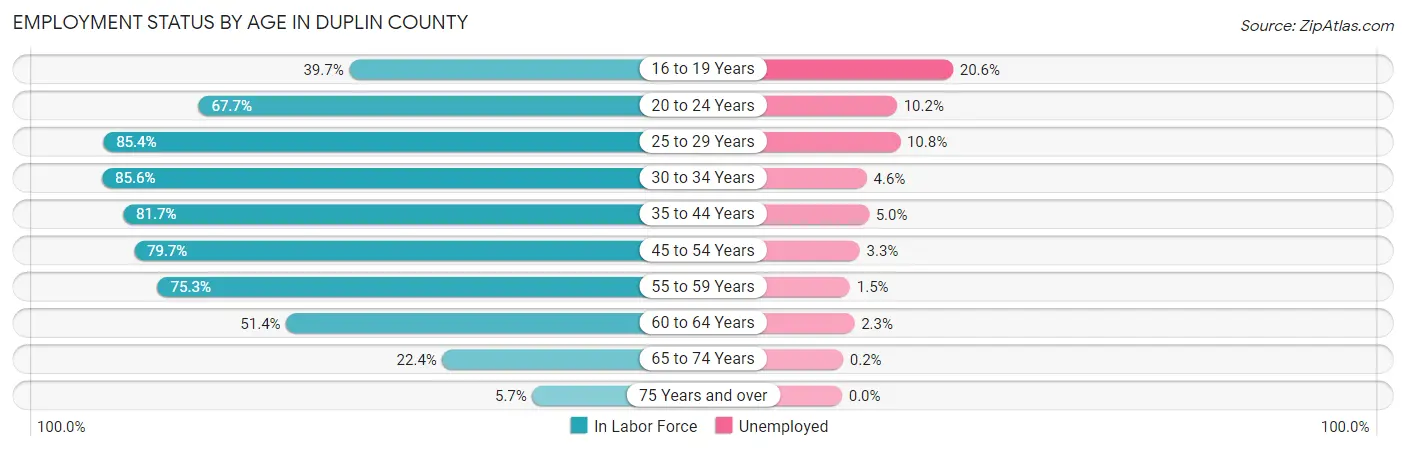
| Age Bracket | In Labor Force | Unemployed |
| 16 to 19 Years | 1,067 (39.7%) | 220 (20.6%) |
| 20 to 24 Years | 2,021 (67.7%) | 206 (10.2%) |
| 25 to 29 Years | 2,326 (85.4%) | 251 (10.8%) |
| 30 to 34 Years | 2,340 (85.6%) | 108 (4.6%) |
| 35 to 44 Years | 4,488 (81.7%) | 224 (5.0%) |
| 45 to 54 Years | 4,956 (79.7%) | 164 (3.3%) |
| 55 to 59 Years | 2,648 (75.3%) | 40 (1.5%) |
| 60 to 64 Years | 1,680 (51.4%) | 39 (2.3%) |
| 65 to 74 Years | 1,238 (22.4%) | 2 (0.2%) |
| 75 Years and over | 222 (5.7%) | 0 (0.0%) |
| Total | 23,003 (58.9%) | 1,242 (5.4%) |
Employment Status by Educational Attainment in Duplin County
According to labor force statistics for Duplin County, 77.0% of individuals (18,445) out of the total population between 25 and 64 years of age (23,954) are in the labor force, with 4.5% or 830 of them being unemployed. The group with the highest labor force participation rate are those with the educational attainment of bachelor's degree or higher, with 84.3% or 3,274 individuals in the labor force. Within the labor force, individuals with less than high school education have the highest percentage of unemployment, with 8.0% or 256 of them being unemployed.
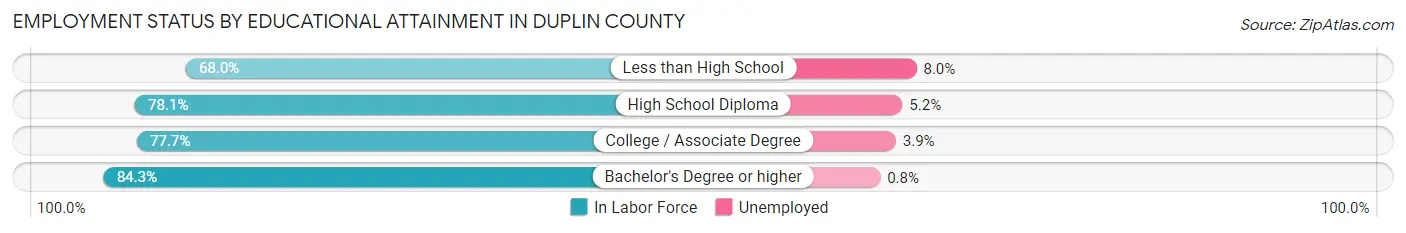
| Educational Attainment | In Labor Force | Unemployed |
| Less than High School | 3,204 (68.0%) | 377 (8.0%) |
| High School Diploma | 5,449 (78.1%) | 363 (5.2%) |
| College / Associate Degree | 6,512 (77.7%) | 327 (3.9%) |
| Bachelor's Degree or higher | 3,274 (84.3%) | 31 (0.8%) |
| Total | 18,445 (77.0%) | 1,078 (4.5%) |
Employment Occupations by Sex in Duplin County
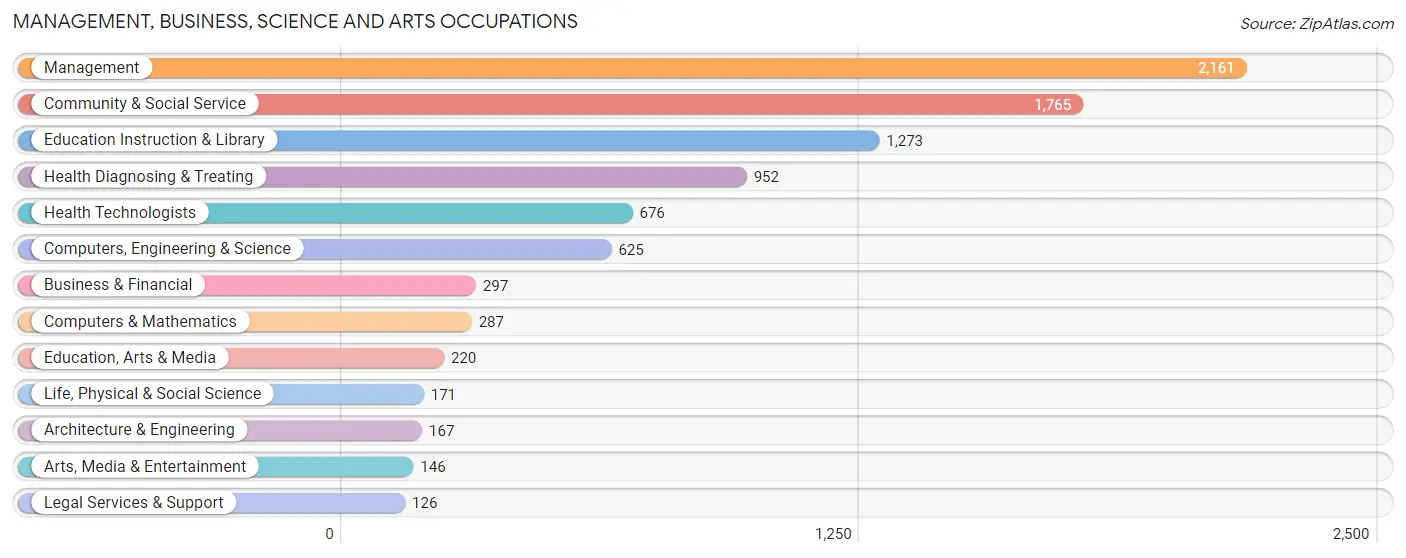
Management, Business, Science and Arts Occupations
The most common Management, Business, Science and Arts occupations in Duplin County are Management (2,161 | 10.0%), Community & Social Service (1,765 | 8.1%), Education Instruction & Library (1,273 | 5.9%), Health Diagnosing & Treating (952 | 4.4%), and Health Technologists (676 | 3.1%).
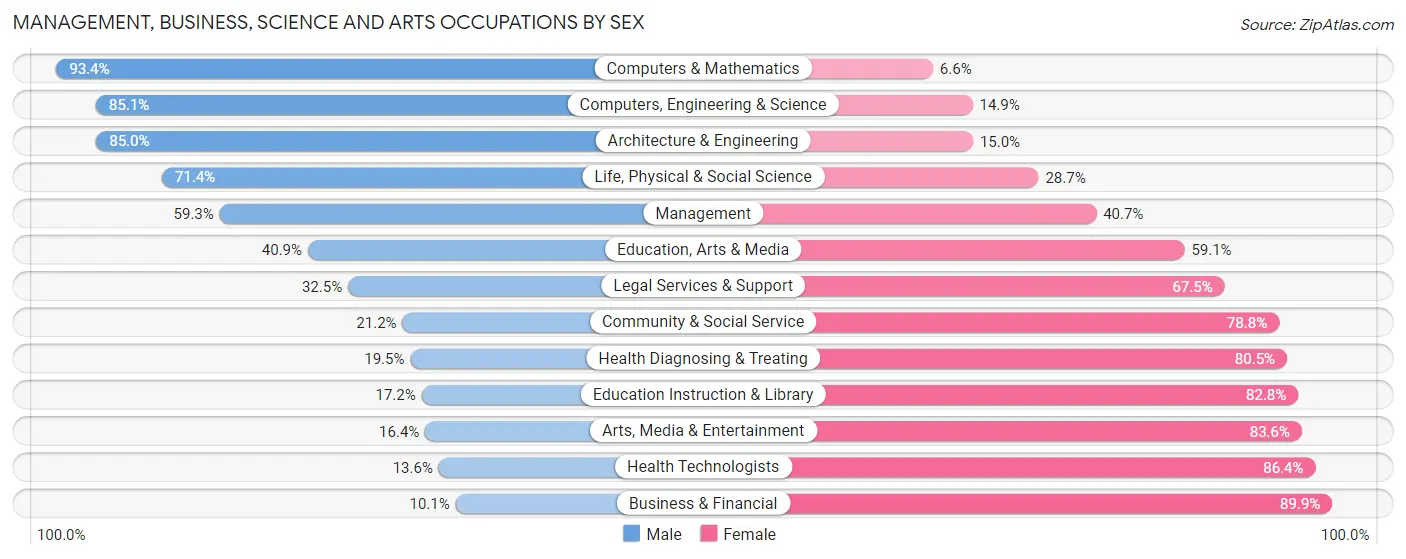
Management, Business, Science and Arts Occupations by Sex
Within the Management, Business, Science and Arts occupations in Duplin County, the most male-oriented occupations are Computers & Mathematics (93.4%), Computers, Engineering & Science (85.1%), and Architecture & Engineering (85.0%), while the most female-oriented occupations are Business & Financial (89.9%), Health Technologists (86.4%), and Arts, Media & Entertainment (83.6%).
| Occupation | Male | Female |
| Management | 1,282 (59.3%) | 879 (40.7%) |
| Business & Financial | 30 (10.1%) | 267 (89.9%) |
| Computers, Engineering & Science | 532 (85.1%) | 93 (14.9%) |
| Computers & Mathematics | 268 (93.4%) | 19 (6.6%) |
| Architecture & Engineering | 142 (85.0%) | 25 (15.0%) |
| Life, Physical & Social Science | 122 (71.4%) | 49 (28.6%) |
| Community & Social Service | 374 (21.2%) | 1,391 (78.8%) |
| Education, Arts & Media | 90 (40.9%) | 130 (59.1%) |
| Legal Services & Support | 41 (32.5%) | 85 (67.5%) |
| Education Instruction & Library | 219 (17.2%) | 1,054 (82.8%) |
| Arts, Media & Entertainment | 24 (16.4%) | 122 (83.6%) |
| Health Diagnosing & Treating | 186 (19.5%) | 766 (80.5%) |
| Health Technologists | 92 (13.6%) | 584 (86.4%) |
| Total (Category) | 2,404 (41.4%) | 3,396 (58.6%) |
| Total (Overall) | 12,038 (55.5%) | 9,641 (44.5%) |
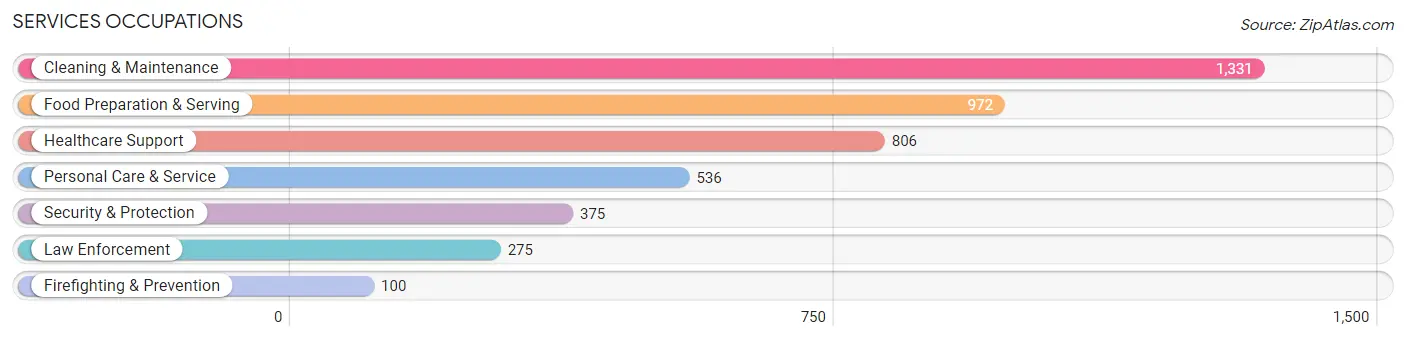
Services Occupations
The most common Services occupations in Duplin County are Cleaning & Maintenance (1,331 | 6.1%), Food Preparation & Serving (972 | 4.5%), Healthcare Support (806 | 3.7%), Personal Care & Service (536 | 2.5%), and Security & Protection (375 | 1.7%).
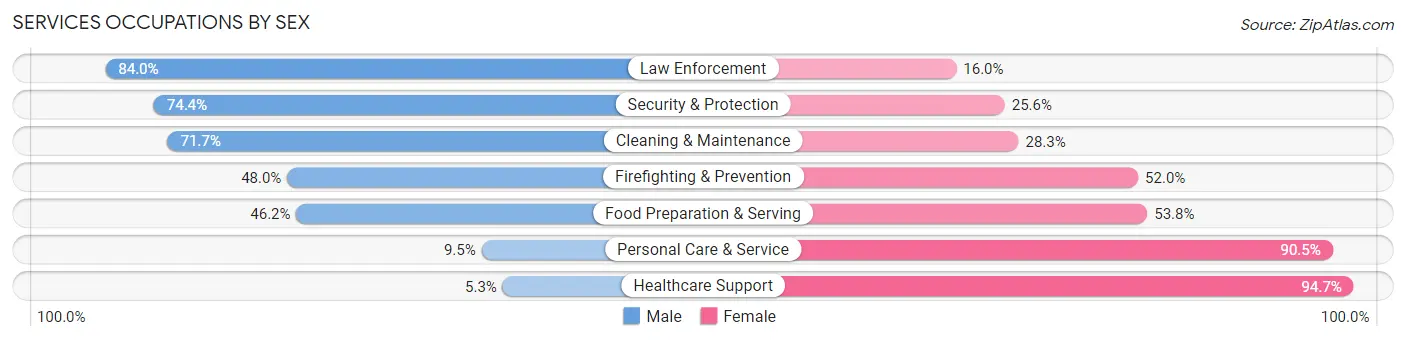
Services Occupations by Sex
Within the Services occupations in Duplin County, the most male-oriented occupations are Law Enforcement (84.0%), Security & Protection (74.4%), and Cleaning & Maintenance (71.7%), while the most female-oriented occupations are Healthcare Support (94.7%), Personal Care & Service (90.5%), and Food Preparation & Serving (53.8%).
| Occupation | Male | Female |
| Healthcare Support | 43 (5.3%) | 763 (94.7%) |
| Security & Protection | 279 (74.4%) | 96 (25.6%) |
| Firefighting & Prevention | 48 (48.0%) | 52 (52.0%) |
| Law Enforcement | 231 (84.0%) | 44 (16.0%) |
| Food Preparation & Serving | 449 (46.2%) | 523 (53.8%) |
| Cleaning & Maintenance | 954 (71.7%) | 377 (28.3%) |
| Personal Care & Service | 51 (9.5%) | 485 (90.5%) |
| Total (Category) | 1,776 (44.2%) | 2,244 (55.8%) |
| Total (Overall) | 12,038 (55.5%) | 9,641 (44.5%) |
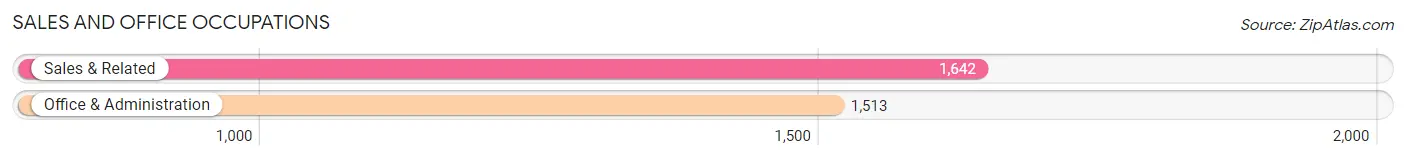
Sales and Office Occupations
The most common Sales and Office occupations in Duplin County are Sales & Related (1,642 | 7.6%), and Office & Administration (1,513 | 7.0%).
Sales and Office Occupations by Sex
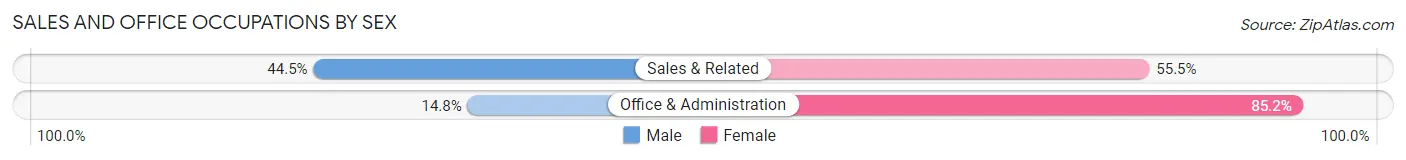
| Occupation | Male | Female |
| Sales & Related | 730 (44.5%) | 912 (55.5%) |
| Office & Administration | 224 (14.8%) | 1,289 (85.2%) |
| Total (Category) | 954 (30.2%) | 2,201 (69.8%) |
| Total (Overall) | 12,038 (55.5%) | 9,641 (44.5%) |
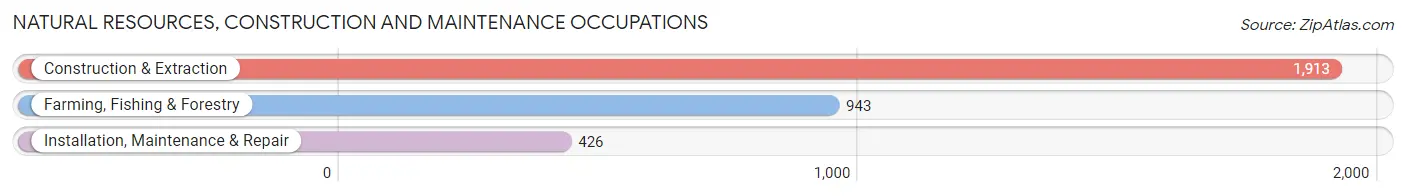
Natural Resources, Construction and Maintenance Occupations
The most common Natural Resources, Construction and Maintenance occupations in Duplin County are Construction & Extraction (1,913 | 8.8%), Farming, Fishing & Forestry (943 | 4.3%), and Installation, Maintenance & Repair (426 | 2.0%).
Natural Resources, Construction and Maintenance Occupations by Sex
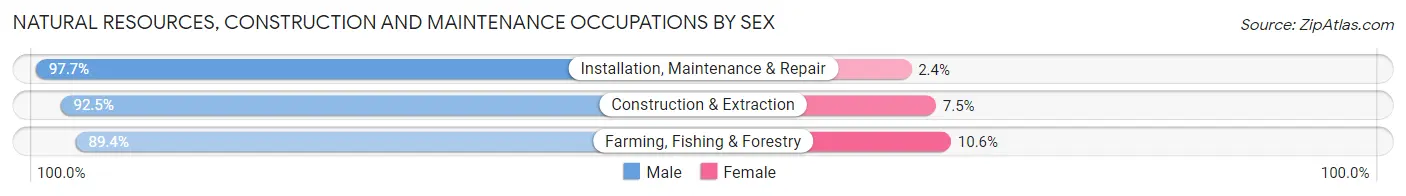
| Occupation | Male | Female |
| Farming, Fishing & Forestry | 843 (89.4%) | 100 (10.6%) |
| Construction & Extraction | 1,770 (92.5%) | 143 (7.5%) |
| Installation, Maintenance & Repair | 416 (97.7%) | 10 (2.4%) |
| Total (Category) | 3,029 (92.3%) | 253 (7.7%) |
| Total (Overall) | 12,038 (55.5%) | 9,641 (44.5%) |
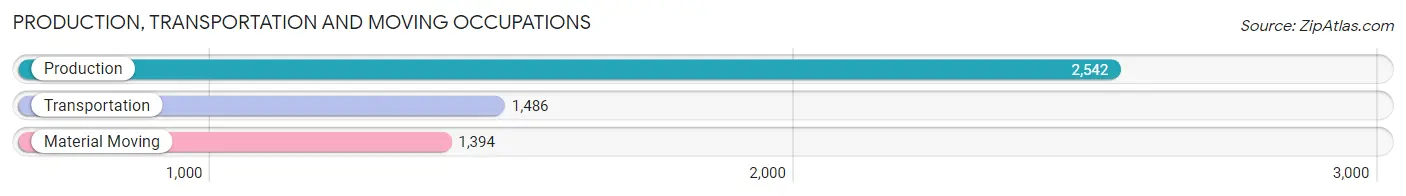
Production, Transportation and Moving Occupations
The most common Production, Transportation and Moving occupations in Duplin County are Production (2,542 | 11.7%), Transportation (1,486 | 6.9%), and Material Moving (1,394 | 6.4%).
Production, Transportation and Moving Occupations by Sex
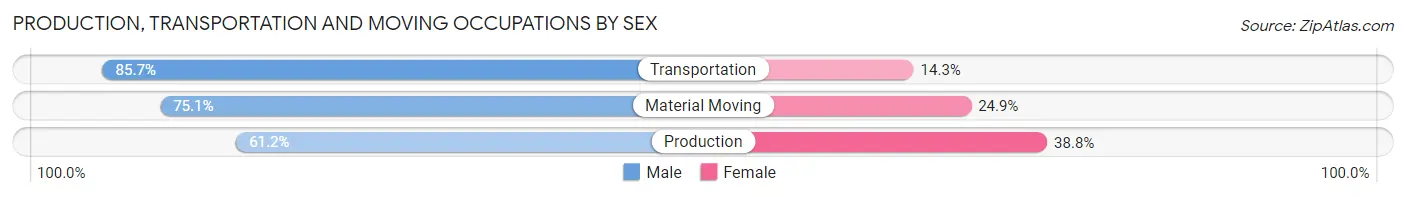
| Occupation | Male | Female |
| Production | 1,555 (61.2%) | 987 (38.8%) |
| Transportation | 1,273 (85.7%) | 213 (14.3%) |
| Material Moving | 1,047 (75.1%) | 347 (24.9%) |
| Total (Category) | 3,875 (71.5%) | 1,547 (28.5%) |
| Total (Overall) | 12,038 (55.5%) | 9,641 (44.5%) |
Employment Industries by Sex in Duplin County
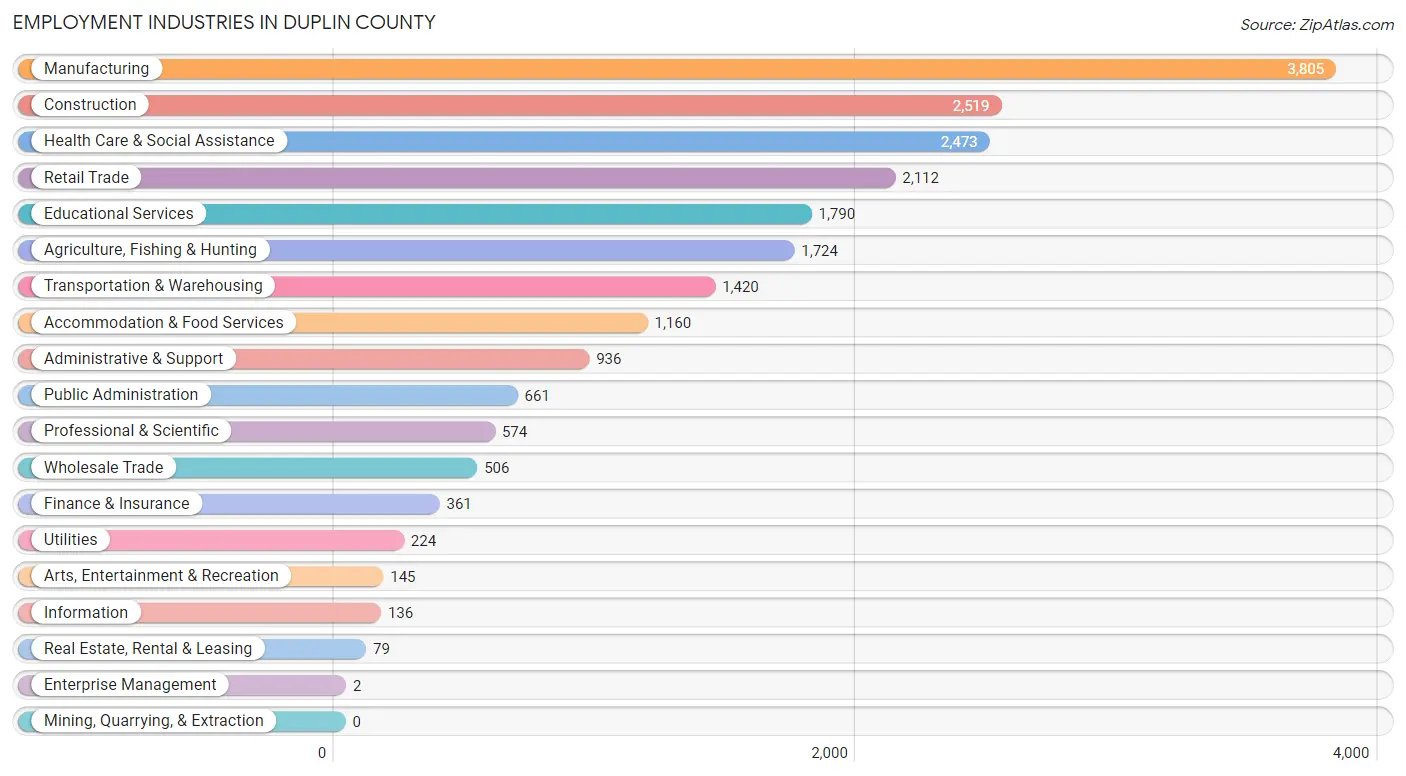
Employment Industries in Duplin County
The major employment industries in Duplin County include Manufacturing (3,805 | 17.5%), Construction (2,519 | 11.6%), Health Care & Social Assistance (2,473 | 11.4%), Retail Trade (2,112 | 9.7%), and Educational Services (1,790 | 8.3%).
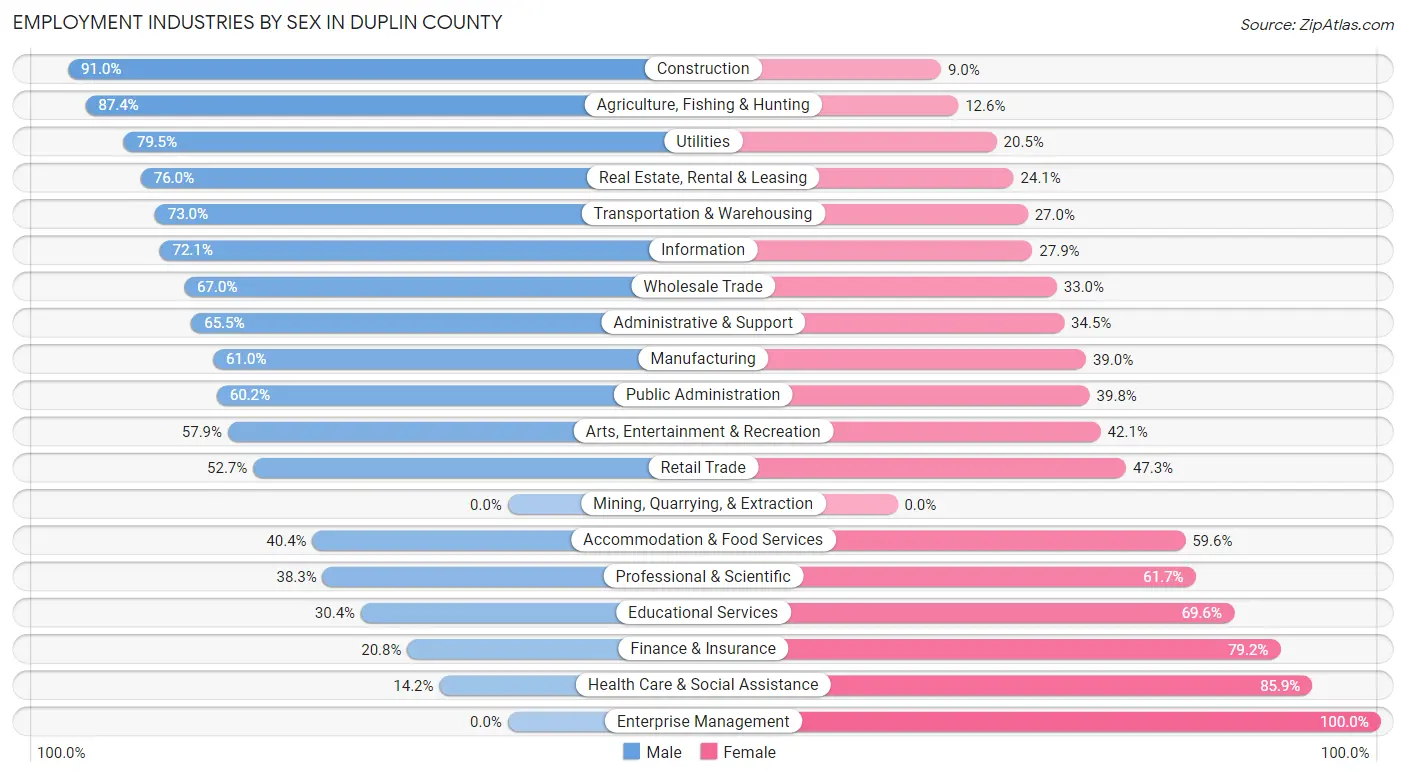
Employment Industries by Sex in Duplin County
The Duplin County industries that see more men than women are Construction (91.0%), Agriculture, Fishing & Hunting (87.4%), and Utilities (79.5%), whereas the industries that tend to have a higher number of women are Enterprise Management (100.0%), Health Care & Social Assistance (85.9%), and Finance & Insurance (79.2%).
| Industry | Male | Female |
| Agriculture, Fishing & Hunting | 1,507 (87.4%) | 217 (12.6%) |
| Mining, Quarrying, & Extraction | 0 (0.0%) | 0 (0.0%) |
| Construction | 2,292 (91.0%) | 227 (9.0%) |
| Manufacturing | 2,320 (61.0%) | 1,485 (39.0%) |
| Wholesale Trade | 339 (67.0%) | 167 (33.0%) |
| Retail Trade | 1,113 (52.7%) | 999 (47.3%) |
| Transportation & Warehousing | 1,037 (73.0%) | 383 (27.0%) |
| Utilities | 178 (79.5%) | 46 (20.5%) |
| Information | 98 (72.1%) | 38 (27.9%) |
| Finance & Insurance | 75 (20.8%) | 286 (79.2%) |
| Real Estate, Rental & Leasing | 60 (75.9%) | 19 (24.0%) |
| Professional & Scientific | 220 (38.3%) | 354 (61.7%) |
| Enterprise Management | 0 (0.0%) | 2 (100.0%) |
| Administrative & Support | 613 (65.5%) | 323 (34.5%) |
| Educational Services | 544 (30.4%) | 1,246 (69.6%) |
| Health Care & Social Assistance | 350 (14.1%) | 2,123 (85.9%) |
| Arts, Entertainment & Recreation | 84 (57.9%) | 61 (42.1%) |
| Accommodation & Food Services | 469 (40.4%) | 691 (59.6%) |
| Public Administration | 398 (60.2%) | 263 (39.8%) |
| Total | 12,038 (55.5%) | 9,641 (44.5%) |
Education in Duplin County
School Enrollment in Duplin County
The most common levels of schooling among the 11,878 students in Duplin County are elementary school (2,760 | 23.2%), high school (2,644 | 22.3%), and middle school (2,602 | 21.9%).
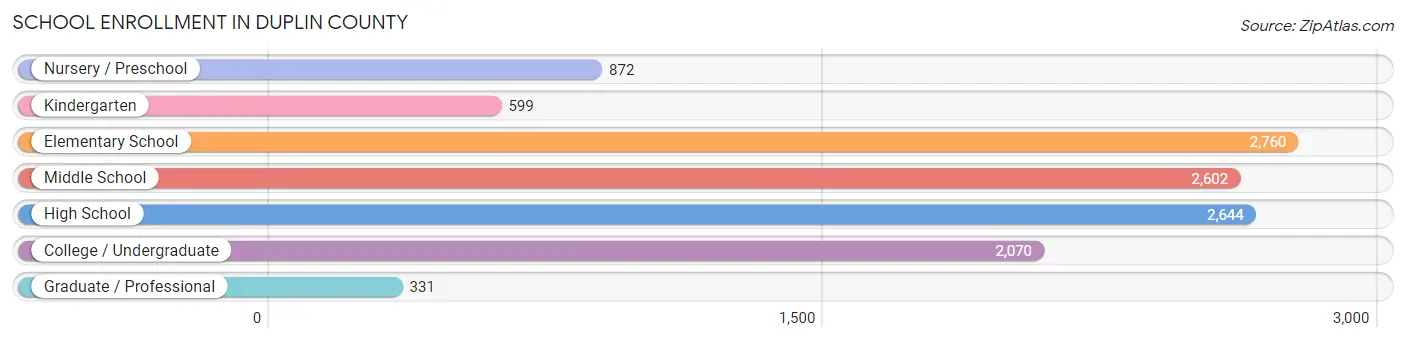
| School Level | # Students | % Students |
| Nursery / Preschool | 872 | 7.3% |
| Kindergarten | 599 | 5.0% |
| Elementary School | 2,760 | 23.2% |
| Middle School | 2,602 | 21.9% |
| High School | 2,644 | 22.3% |
| College / Undergraduate | 2,070 | 17.4% |
| Graduate / Professional | 331 | 2.8% |
| Total | 11,878 | 100.0% |
School Enrollment by Age by Funding Source in Duplin County
Out of a total of 11,878 students who are enrolled in schools in Duplin County, 1,045 (8.8%) attend a private institution, while the remaining 10,833 (91.2%) are enrolled in public schools. The age group of 25 to 34 year olds has the highest likelihood of being enrolled in private schools, with 206 (30.2% in the age bracket) enrolled. Conversely, the age group of 5 to 9 year old has the lowest likelihood of being enrolled in a private school, with 3,334 (95.4% in the age bracket) attending a public institution.
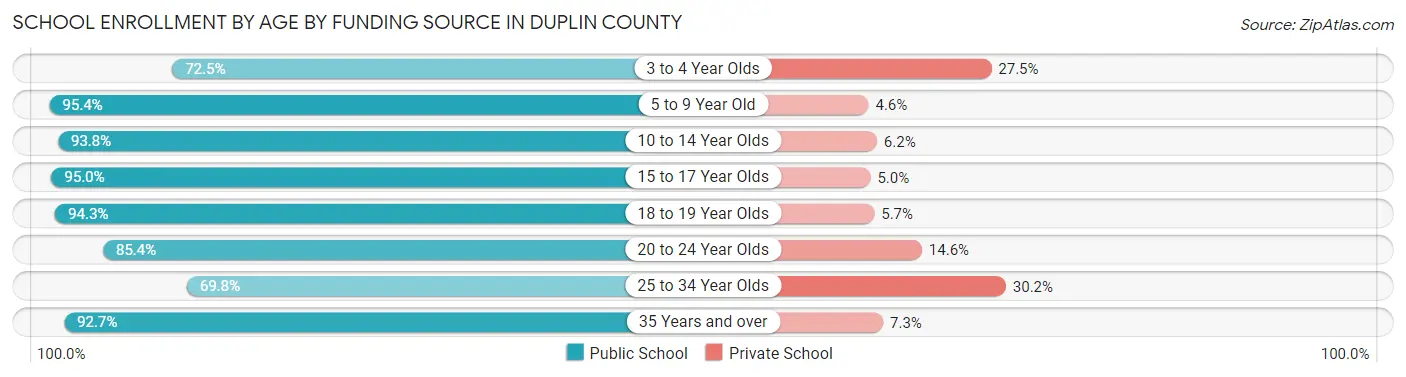
| Age Bracket | Public School | Private School |
| 3 to 4 Year Olds | 490 (72.5%) | 186 (27.5%) |
| 5 to 9 Year Old | 3,334 (95.4%) | 162 (4.6%) |
| 10 to 14 Year Olds | 2,729 (93.8%) | 180 (6.2%) |
| 15 to 17 Year Olds | 1,941 (95.0%) | 102 (5.0%) |
| 18 to 19 Year Olds | 695 (94.3%) | 42 (5.7%) |
| 20 to 24 Year Olds | 803 (85.4%) | 137 (14.6%) |
| 25 to 34 Year Olds | 476 (69.8%) | 206 (30.2%) |
| 35 Years and over | 366 (92.7%) | 29 (7.3%) |
| Total | 10,833 (91.2%) | 1,045 (8.8%) |
Educational Attainment by Field of Study in Duplin County
Business (1,233 | 21.3%), education (1,127 | 19.5%), science & technology (680 | 11.7%), arts & humanities (495 | 8.5%), and social sciences (408 | 7.0%) are the most common fields of study among 5,794 individuals in Duplin County who have obtained a bachelor's degree or higher.
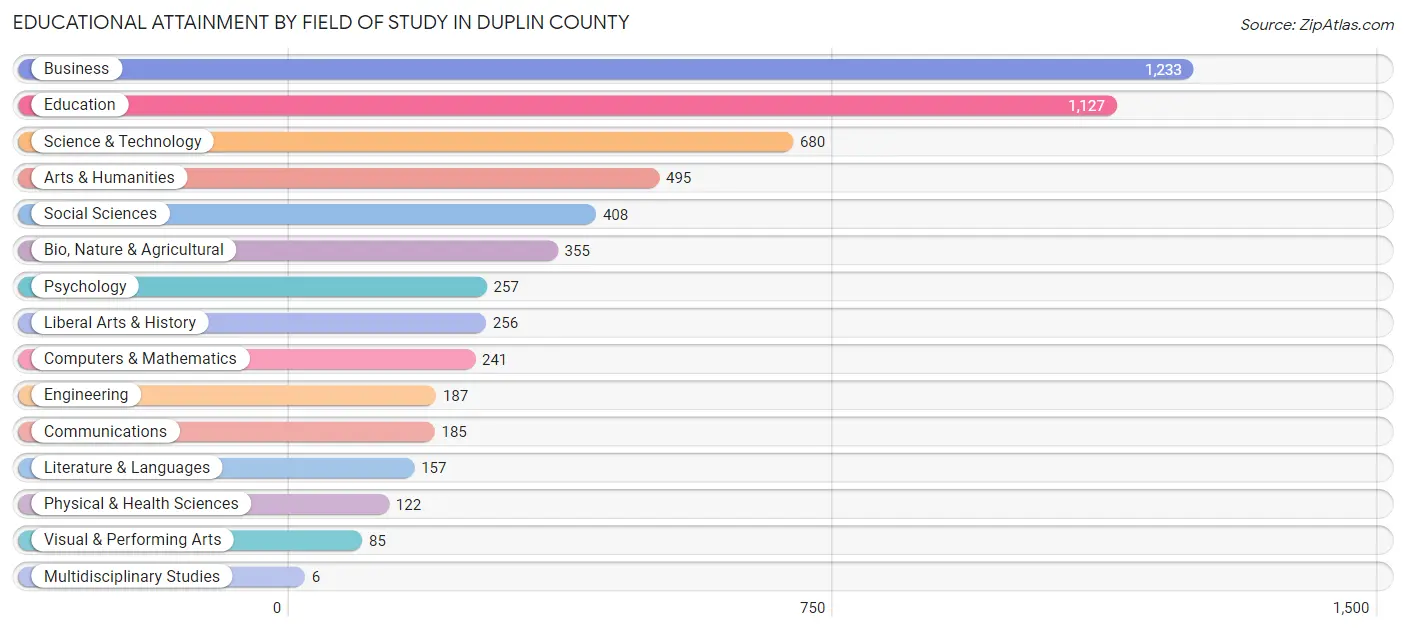
| Field of Study | # Graduates | % Graduates |
| Computers & Mathematics | 241 | 4.2% |
| Bio, Nature & Agricultural | 355 | 6.1% |
| Physical & Health Sciences | 122 | 2.1% |
| Psychology | 257 | 4.4% |
| Social Sciences | 408 | 7.0% |
| Engineering | 187 | 3.2% |
| Multidisciplinary Studies | 6 | 0.1% |
| Science & Technology | 680 | 11.7% |
| Business | 1,233 | 21.3% |
| Education | 1,127 | 19.5% |
| Literature & Languages | 157 | 2.7% |
| Liberal Arts & History | 256 | 4.4% |
| Visual & Performing Arts | 85 | 1.5% |
| Communications | 185 | 3.2% |
| Arts & Humanities | 495 | 8.5% |
| Total | 5,794 | 100.0% |
Transportation & Commute in Duplin County
Vehicle Availability by Sex in Duplin County
The most prevalent vehicle ownership categories in Duplin County are males with 2 vehicles (4,363, accounting for 36.6%) and females with 2 vehicles (3,633, making up 47.8%).
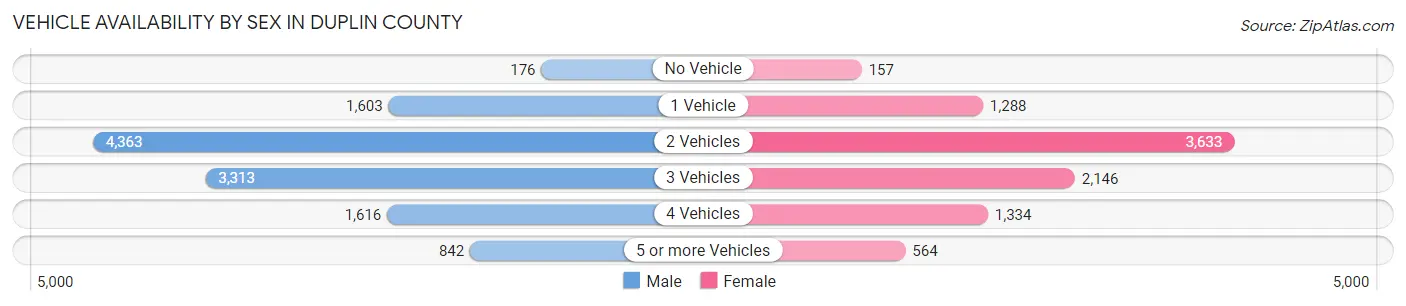
| Vehicles Available | Male | Female |
| No Vehicle | 176 (1.5%) | 157 (1.7%) |
| 1 Vehicle | 1,603 (13.5%) | 1,288 (14.1%) |
| 2 Vehicles | 4,363 (36.6%) | 3,633 (39.8%) |
| 3 Vehicles | 3,313 (27.8%) | 2,146 (23.5%) |
| 4 Vehicles | 1,616 (13.6%) | 1,334 (14.6%) |
| 5 or more Vehicles | 842 (7.1%) | 564 (6.2%) |
| Total | 11,913 (100.0%) | 9,122 (100.0%) |
Commute Time in Duplin County
The most frequently occuring commute durations in Duplin County are 5 to 9 minutes (2,734 commuters, 13.6%), 20 to 24 minutes (2,656 commuters, 13.2%), and 15 to 19 minutes (2,624 commuters, 13.0%).
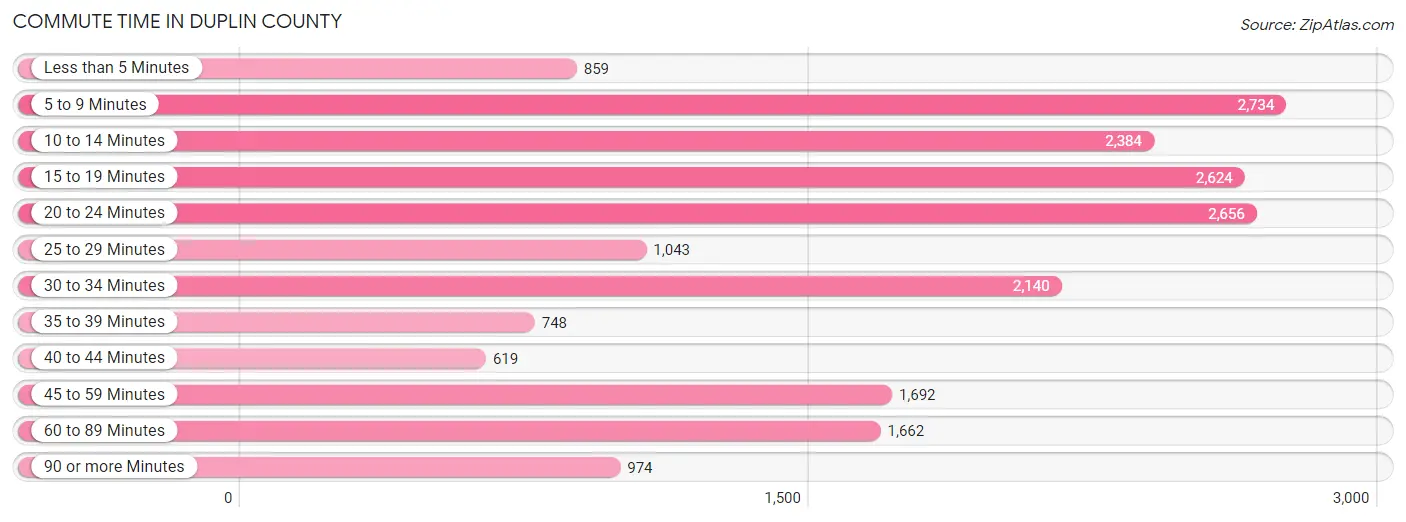
| Commute Time | # Commuters | % Commuters |
| Less than 5 Minutes | 859 | 4.3% |
| 5 to 9 Minutes | 2,734 | 13.6% |
| 10 to 14 Minutes | 2,384 | 11.8% |
| 15 to 19 Minutes | 2,624 | 13.0% |
| 20 to 24 Minutes | 2,656 | 13.2% |
| 25 to 29 Minutes | 1,043 | 5.2% |
| 30 to 34 Minutes | 2,140 | 10.6% |
| 35 to 39 Minutes | 748 | 3.7% |
| 40 to 44 Minutes | 619 | 3.1% |
| 45 to 59 Minutes | 1,692 | 8.4% |
| 60 to 89 Minutes | 1,662 | 8.3% |
| 90 or more Minutes | 974 | 4.8% |
Commute Time by Sex in Duplin County
The most common commute times in Duplin County are 20 to 24 minutes (1,447 commuters, 12.5%) for males and 5 to 9 minutes (1,306 commuters, 15.2%) for females.
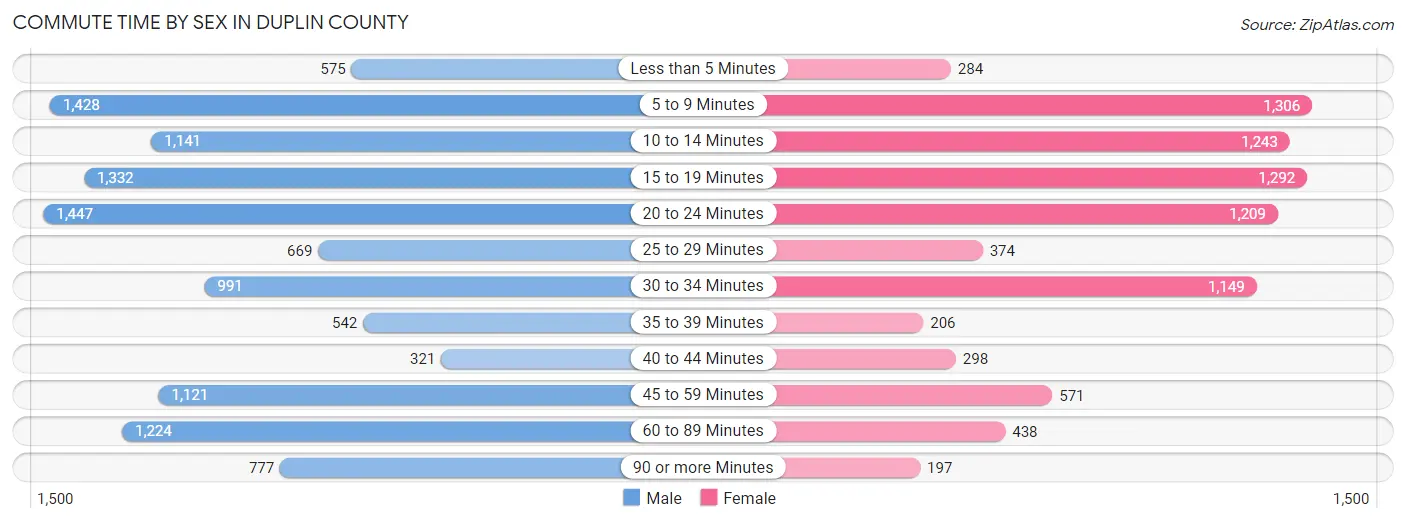
| Commute Time | Male | Female |
| Less than 5 Minutes | 575 (5.0%) | 284 (3.3%) |
| 5 to 9 Minutes | 1,428 (12.3%) | 1,306 (15.2%) |
| 10 to 14 Minutes | 1,141 (9.9%) | 1,243 (14.5%) |
| 15 to 19 Minutes | 1,332 (11.5%) | 1,292 (15.1%) |
| 20 to 24 Minutes | 1,447 (12.5%) | 1,209 (14.1%) |
| 25 to 29 Minutes | 669 (5.8%) | 374 (4.4%) |
| 30 to 34 Minutes | 991 (8.6%) | 1,149 (13.4%) |
| 35 to 39 Minutes | 542 (4.7%) | 206 (2.4%) |
| 40 to 44 Minutes | 321 (2.8%) | 298 (3.5%) |
| 45 to 59 Minutes | 1,121 (9.7%) | 571 (6.7%) |
| 60 to 89 Minutes | 1,224 (10.6%) | 438 (5.1%) |
| 90 or more Minutes | 777 (6.7%) | 197 (2.3%) |
Time of Departure to Work by Sex in Duplin County
The most frequent times of departure to work in Duplin County are 6:00 AM to 6:29 AM (1,760, 15.2%) for males and 7:00 AM to 7:29 AM (1,436, 16.8%) for females.
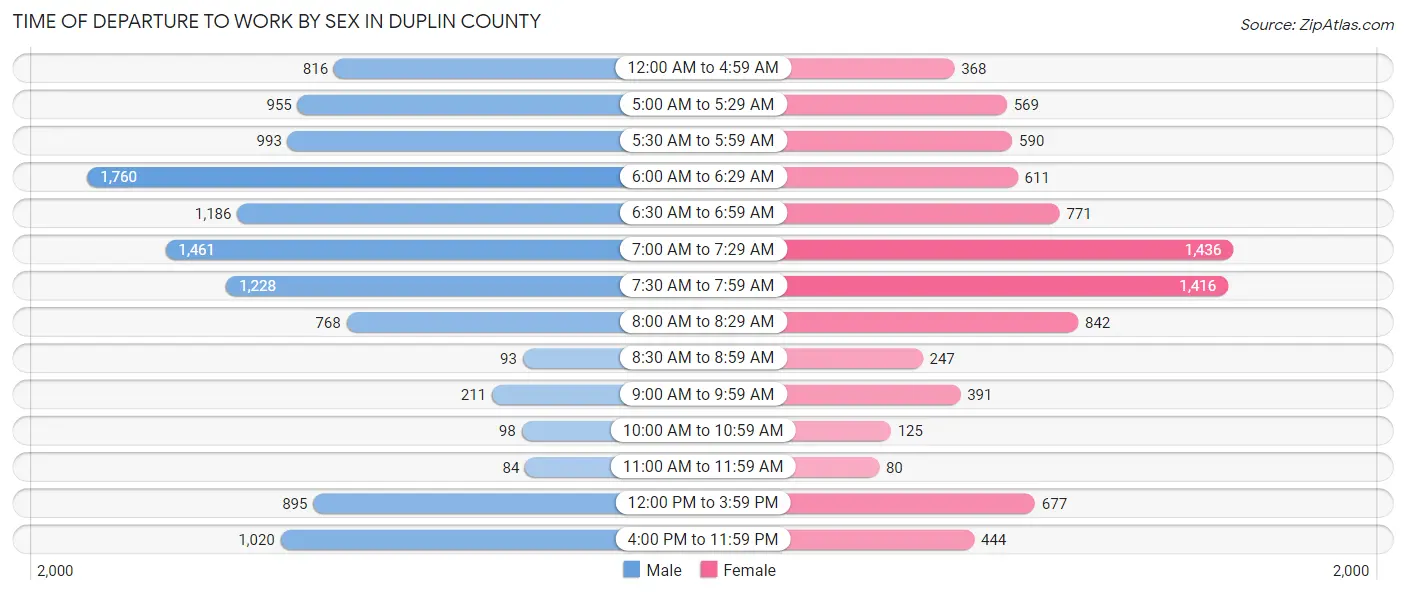
| Time of Departure | Male | Female |
| 12:00 AM to 4:59 AM | 816 (7.0%) | 368 (4.3%) |
| 5:00 AM to 5:29 AM | 955 (8.3%) | 569 (6.6%) |
| 5:30 AM to 5:59 AM | 993 (8.6%) | 590 (6.9%) |
| 6:00 AM to 6:29 AM | 1,760 (15.2%) | 611 (7.1%) |
| 6:30 AM to 6:59 AM | 1,186 (10.2%) | 771 (9.0%) |
| 7:00 AM to 7:29 AM | 1,461 (12.6%) | 1,436 (16.8%) |
| 7:30 AM to 7:59 AM | 1,228 (10.6%) | 1,416 (16.5%) |
| 8:00 AM to 8:29 AM | 768 (6.6%) | 842 (9.8%) |
| 8:30 AM to 8:59 AM | 93 (0.8%) | 247 (2.9%) |
| 9:00 AM to 9:59 AM | 211 (1.8%) | 391 (4.6%) |
| 10:00 AM to 10:59 AM | 98 (0.9%) | 125 (1.5%) |
| 11:00 AM to 11:59 AM | 84 (0.7%) | 80 (0.9%) |
| 12:00 PM to 3:59 PM | 895 (7.7%) | 677 (7.9%) |
| 4:00 PM to 11:59 PM | 1,020 (8.8%) | 444 (5.2%) |
| Total | 11,568 (100.0%) | 8,567 (100.0%) |
Housing Occupancy in Duplin County
Occupancy by Ownership in Duplin County
Of the total 20,289 dwellings in Duplin County, owner-occupied units account for 14,077 (69.4%), while renter-occupied units make up 6,212 (30.6%).
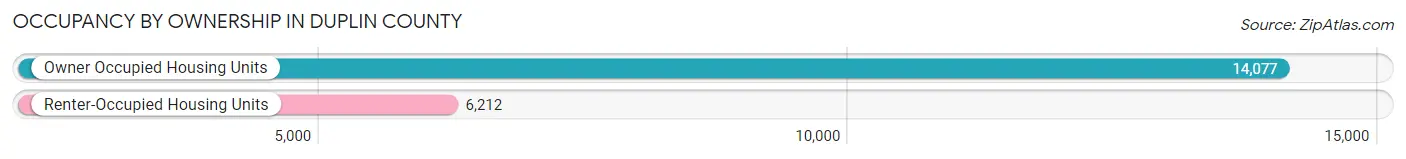
| Occupancy | # Housing Units | % Housing Units |
| Owner Occupied Housing Units | 14,077 | 69.4% |
| Renter-Occupied Housing Units | 6,212 | 30.6% |
| Total Occupied Housing Units | 20,289 | 100.0% |
Occupancy by Household Size in Duplin County
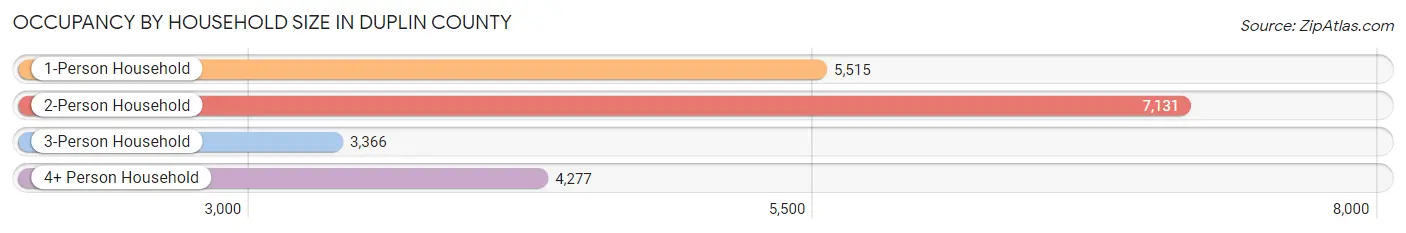
| Household Size | # Housing Units | % Housing Units |
| 1-Person Household | 5,515 | 27.2% |
| 2-Person Household | 7,131 | 35.1% |
| 3-Person Household | 3,366 | 16.6% |
| 4+ Person Household | 4,277 | 21.1% |
| Total Housing Units | 20,289 | 100.0% |
Occupancy by Ownership by Household Size in Duplin County
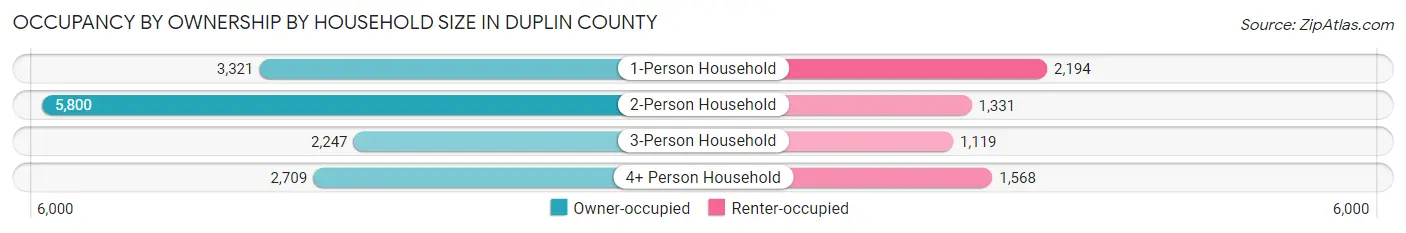
| Household Size | Owner-occupied | Renter-occupied |
| 1-Person Household | 3,321 (60.2%) | 2,194 (39.8%) |
| 2-Person Household | 5,800 (81.3%) | 1,331 (18.7%) |
| 3-Person Household | 2,247 (66.8%) | 1,119 (33.2%) |
| 4+ Person Household | 2,709 (63.3%) | 1,568 (36.7%) |
| Total Housing Units | 14,077 (69.4%) | 6,212 (30.6%) |
Occupancy by Educational Attainment in Duplin County
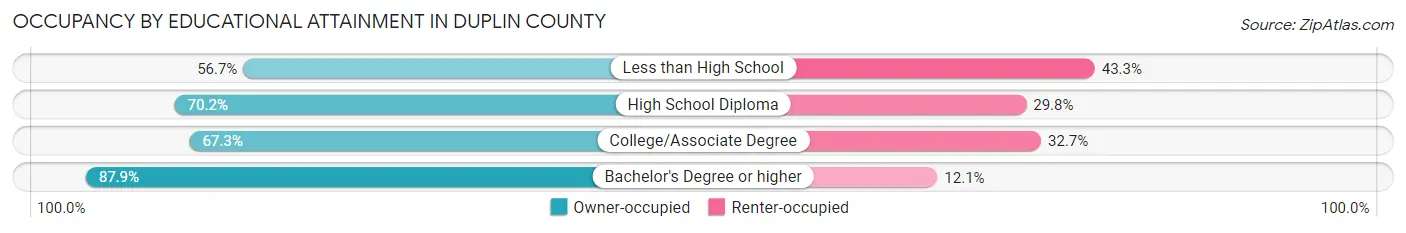
| Household Size | Owner-occupied | Renter-occupied |
| Less than High School | 2,166 (56.7%) | 1,657 (43.3%) |
| High School Diploma | 4,144 (70.2%) | 1,756 (29.8%) |
| College/Associate Degree | 4,965 (67.3%) | 2,412 (32.7%) |
| Bachelor's Degree or higher | 2,802 (87.9%) | 387 (12.1%) |
Occupancy by Age of Householder in Duplin County
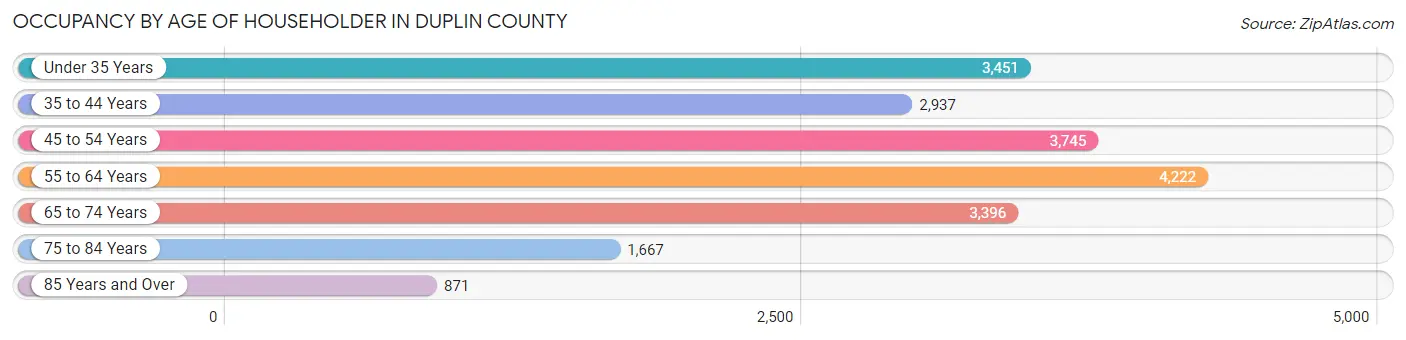
| Age Bracket | # Households | % Households |
| Under 35 Years | 3,451 | 17.0% |
| 35 to 44 Years | 2,937 | 14.5% |
| 45 to 54 Years | 3,745 | 18.5% |
| 55 to 64 Years | 4,222 | 20.8% |
| 65 to 74 Years | 3,396 | 16.7% |
| 75 to 84 Years | 1,667 | 8.2% |
| 85 Years and Over | 871 | 4.3% |
| Total | 20,289 | 100.0% |
Housing Finances in Duplin County
Median Income by Occupancy in Duplin County
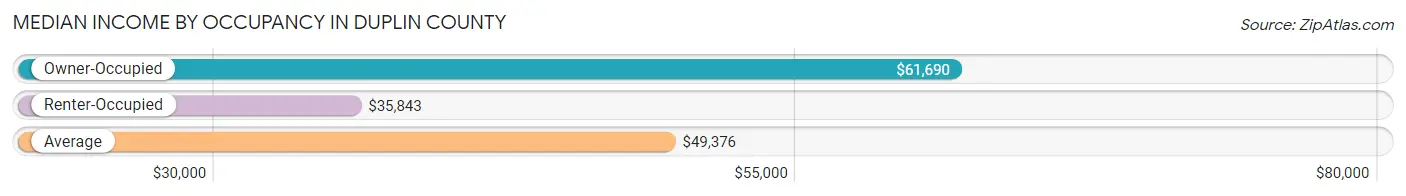
| Occupancy Type | # Households | Median Income |
| Owner-Occupied | 14,077 (69.4%) | $61,690 |
| Renter-Occupied | 6,212 (30.6%) | $35,843 |
| Average | 20,289 (100.0%) | $49,376 |
Occupancy by Householder Income Bracket in Duplin County
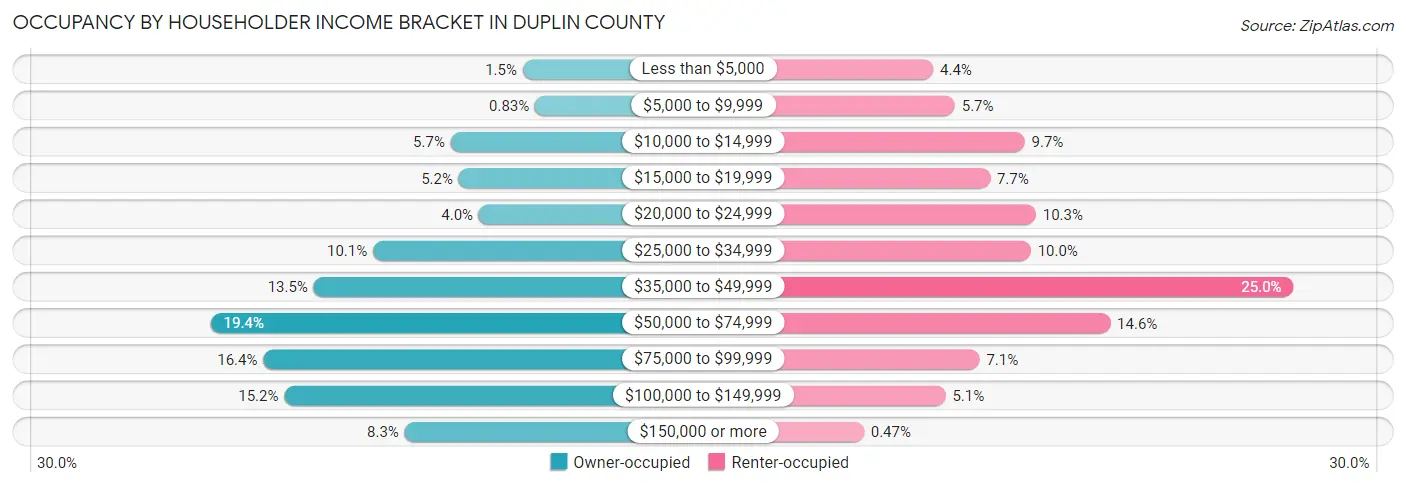
| Income Bracket | Owner-occupied | Renter-occupied |
| Less than $5,000 | 215 (1.5%) | 275 (4.4%) |
| $5,000 to $9,999 | 117 (0.8%) | 352 (5.7%) |
| $10,000 to $14,999 | 796 (5.7%) | 600 (9.7%) |
| $15,000 to $19,999 | 731 (5.2%) | 477 (7.7%) |
| $20,000 to $24,999 | 569 (4.0%) | 640 (10.3%) |
| $25,000 to $34,999 | 1,421 (10.1%) | 622 (10.0%) |
| $35,000 to $49,999 | 1,898 (13.5%) | 1,554 (25.0%) |
| $50,000 to $74,999 | 2,727 (19.4%) | 904 (14.5%) |
| $75,000 to $99,999 | 2,303 (16.4%) | 440 (7.1%) |
| $100,000 to $149,999 | 2,134 (15.2%) | 319 (5.1%) |
| $150,000 or more | 1,166 (8.3%) | 29 (0.5%) |
| Total | 14,077 (100.0%) | 6,212 (100.0%) |
Monthly Housing Cost Tiers in Duplin County
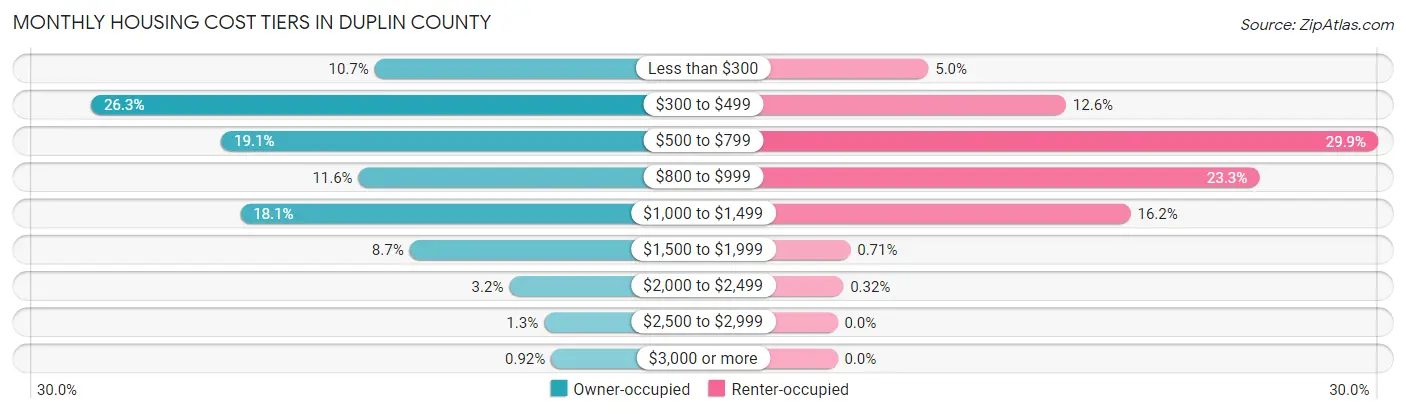
| Monthly Cost | Owner-occupied | Renter-occupied |
| Less than $300 | 1,502 (10.7%) | 312 (5.0%) |
| $300 to $499 | 3,707 (26.3%) | 784 (12.6%) |
| $500 to $799 | 2,694 (19.1%) | 1,854 (29.8%) |
| $800 to $999 | 1,627 (11.6%) | 1,447 (23.3%) |
| $1,000 to $1,499 | 2,547 (18.1%) | 1,006 (16.2%) |
| $1,500 to $1,999 | 1,231 (8.7%) | 44 (0.7%) |
| $2,000 to $2,499 | 455 (3.2%) | 20 (0.3%) |
| $2,500 to $2,999 | 185 (1.3%) | 0 (0.0%) |
| $3,000 or more | 129 (0.9%) | 0 (0.0%) |
| Total | 14,077 (100.0%) | 6,212 (100.0%) |
Physical Housing Characteristics in Duplin County
Housing Structures in Duplin County
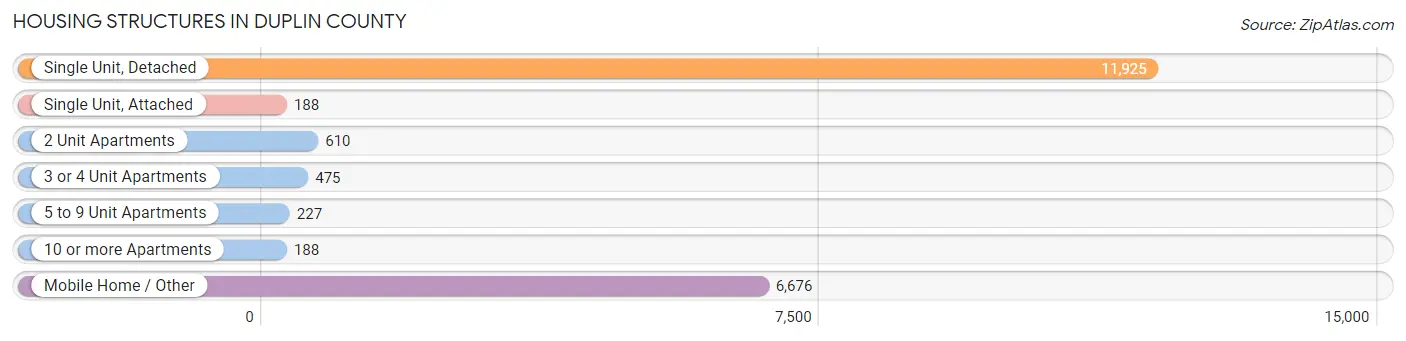
| Structure Type | # Housing Units | % Housing Units |
| Single Unit, Detached | 11,925 | 58.8% |
| Single Unit, Attached | 188 | 0.9% |
| 2 Unit Apartments | 610 | 3.0% |
| 3 or 4 Unit Apartments | 475 | 2.3% |
| 5 to 9 Unit Apartments | 227 | 1.1% |
| 10 or more Apartments | 188 | 0.9% |
| Mobile Home / Other | 6,676 | 32.9% |
| Total | 20,289 | 100.0% |
Housing Structures by Occupancy in Duplin County
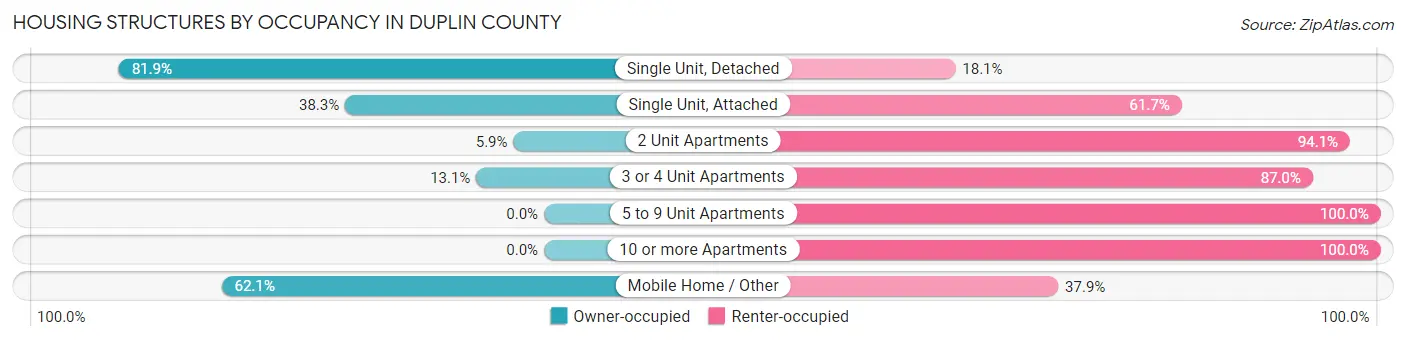
| Structure Type | Owner-occupied | Renter-occupied |
| Single Unit, Detached | 9,763 (81.9%) | 2,162 (18.1%) |
| Single Unit, Attached | 72 (38.3%) | 116 (61.7%) |
| 2 Unit Apartments | 36 (5.9%) | 574 (94.1%) |
| 3 or 4 Unit Apartments | 62 (13.1%) | 413 (87.0%) |
| 5 to 9 Unit Apartments | 0 (0.0%) | 227 (100.0%) |
| 10 or more Apartments | 0 (0.0%) | 188 (100.0%) |
| Mobile Home / Other | 4,144 (62.1%) | 2,532 (37.9%) |
| Total | 14,077 (69.4%) | 6,212 (30.6%) |
Housing Structures by Number of Rooms in Duplin County
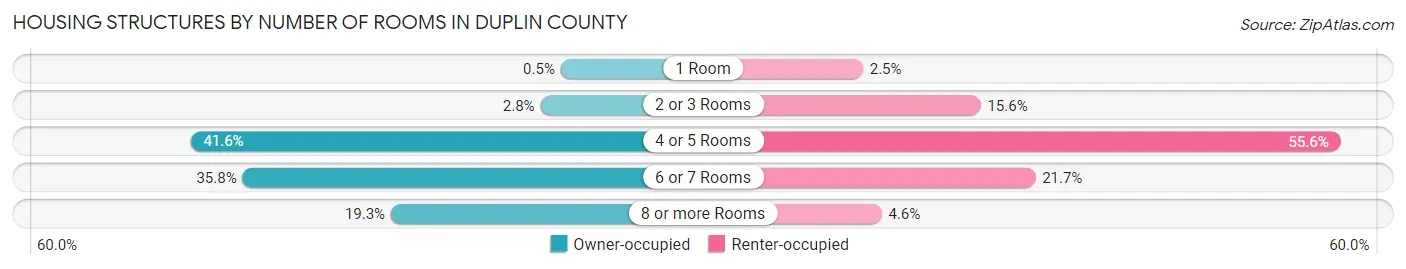
| Number of Rooms | Owner-occupied | Renter-occupied |
| 1 Room | 71 (0.5%) | 158 (2.5%) |
| 2 or 3 Rooms | 387 (2.8%) | 969 (15.6%) |
| 4 or 5 Rooms | 5,854 (41.6%) | 3,452 (55.6%) |
| 6 or 7 Rooms | 5,043 (35.8%) | 1,346 (21.7%) |
| 8 or more Rooms | 2,722 (19.3%) | 287 (4.6%) |
| Total | 14,077 (100.0%) | 6,212 (100.0%) |
Housing Structure by Heating Type in Duplin County
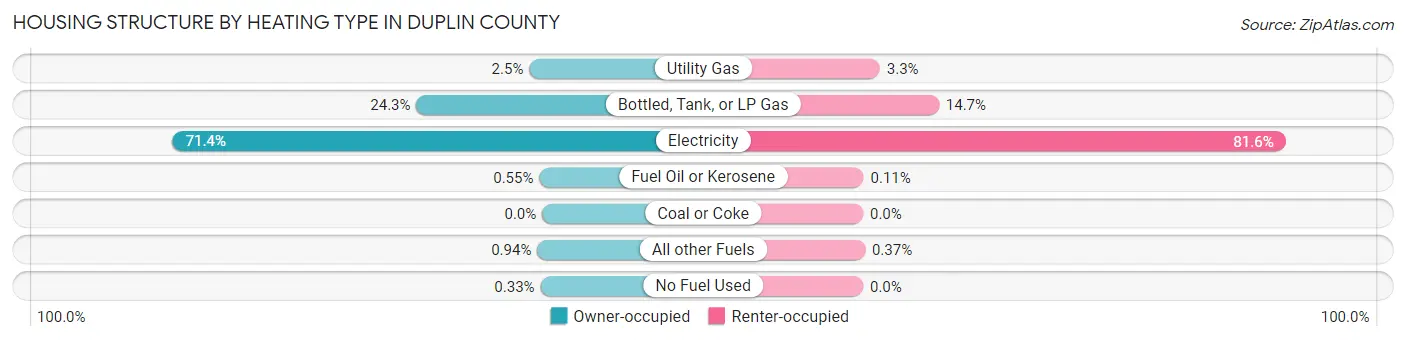
| Heating Type | Owner-occupied | Renter-occupied |
| Utility Gas | 349 (2.5%) | 202 (3.3%) |
| Bottled, Tank, or LP Gas | 3,421 (24.3%) | 910 (14.6%) |
| Electricity | 10,049 (71.4%) | 5,070 (81.6%) |
| Fuel Oil or Kerosene | 78 (0.5%) | 7 (0.1%) |
| Coal or Coke | 0 (0.0%) | 0 (0.0%) |
| All other Fuels | 133 (0.9%) | 23 (0.4%) |
| No Fuel Used | 47 (0.3%) | 0 (0.0%) |
| Total | 14,077 (100.0%) | 6,212 (100.0%) |
Household Vehicle Usage in Duplin County
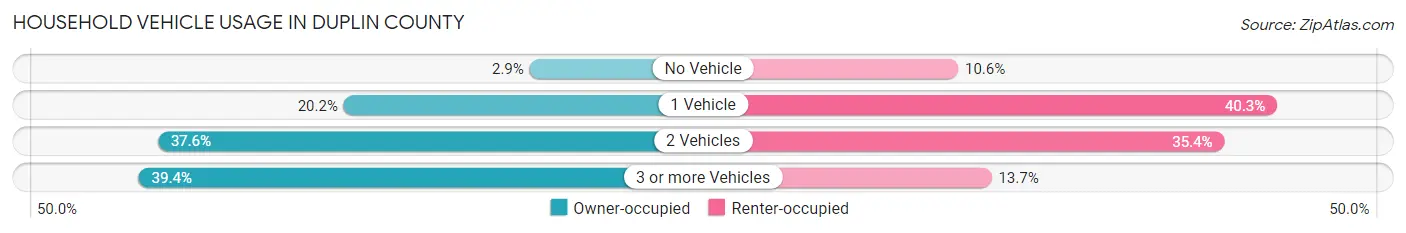
| Vehicles per Household | Owner-occupied | Renter-occupied |
| No Vehicle | 403 (2.9%) | 656 (10.6%) |
| 1 Vehicle | 2,845 (20.2%) | 2,506 (40.3%) |
| 2 Vehicles | 5,289 (37.6%) | 2,200 (35.4%) |
| 3 or more Vehicles | 5,540 (39.4%) | 850 (13.7%) |
| Total | 14,077 (100.0%) | 6,212 (100.0%) |
Real Estate & Mortgages in Duplin County
Real Estate and Mortgage Overview in Duplin County
| Characteristic | Without Mortgage | With Mortgage |
| Housing Units | 7,860 | 6,217 |
| Median Property Value | $81,900 | $147,500 |
| Median Household Income | $46,303 | $709 |
| Monthly Housing Costs | $429 | $129 |
| Real Estate Taxes | $678 | $194 |
Property Value by Mortgage Status in Duplin County
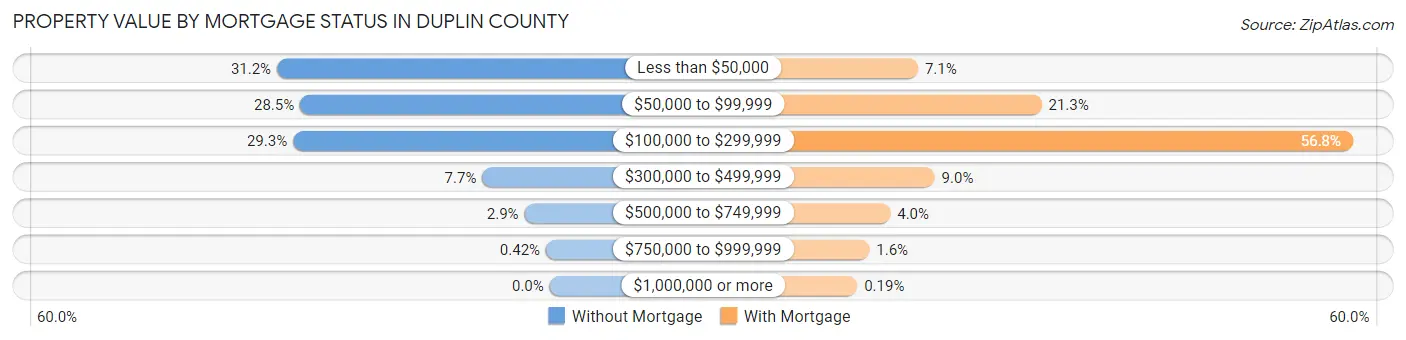
| Property Value | Without Mortgage | With Mortgage |
| Less than $50,000 | 2,449 (31.2%) | 443 (7.1%) |
| $50,000 to $99,999 | 2,242 (28.5%) | 1,322 (21.3%) |
| $100,000 to $299,999 | 2,305 (29.3%) | 3,533 (56.8%) |
| $300,000 to $499,999 | 605 (7.7%) | 562 (9.0%) |
| $500,000 to $749,999 | 226 (2.9%) | 247 (4.0%) |
| $750,000 to $999,999 | 33 (0.4%) | 98 (1.6%) |
| $1,000,000 or more | 0 (0.0%) | 12 (0.2%) |
| Total | 7,860 (100.0%) | 6,217 (100.0%) |
Household Income by Mortgage Status in Duplin County
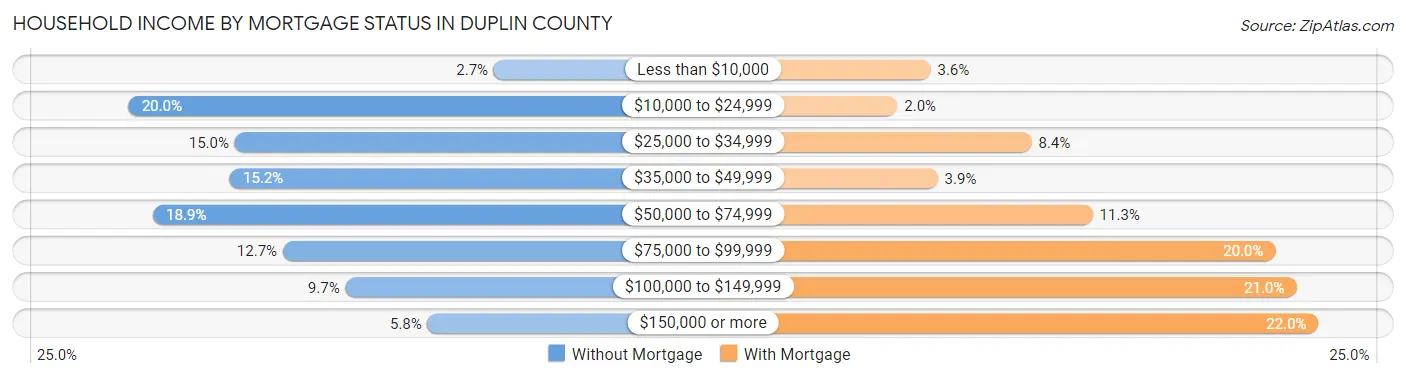
| Household Income | Without Mortgage | With Mortgage |
| Less than $10,000 | 208 (2.6%) | 222 (3.6%) |
| $10,000 to $24,999 | 1,575 (20.0%) | 124 (2.0%) |
| $25,000 to $34,999 | 1,178 (15.0%) | 521 (8.4%) |
| $35,000 to $49,999 | 1,196 (15.2%) | 243 (3.9%) |
| $50,000 to $74,999 | 1,484 (18.9%) | 702 (11.3%) |
| $75,000 to $99,999 | 998 (12.7%) | 1,243 (20.0%) |
| $100,000 to $149,999 | 764 (9.7%) | 1,305 (21.0%) |
| $150,000 or more | 457 (5.8%) | 1,370 (22.0%) |
| Total | 7,860 (100.0%) | 6,217 (100.0%) |
Property Value to Household Income Ratio in Duplin County
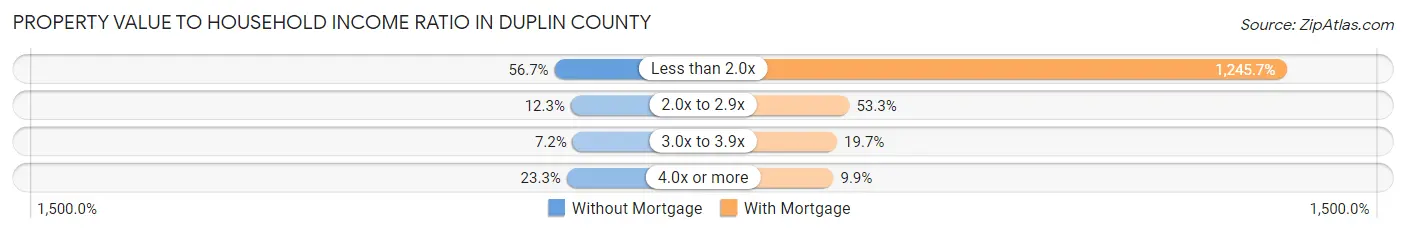
| Value-to-Income Ratio | Without Mortgage | With Mortgage |
| Less than 2.0x | 4,453 (56.7%) | 77,442 (1,245.7%) |
| 2.0x to 2.9x | 963 (12.2%) | 3,316 (53.3%) |
| 3.0x to 3.9x | 568 (7.2%) | 1,227 (19.7%) |
| 4.0x or more | 1,834 (23.3%) | 615 (9.9%) |
| Total | 7,860 (100.0%) | 6,217 (100.0%) |
Real Estate Taxes by Mortgage Status in Duplin County
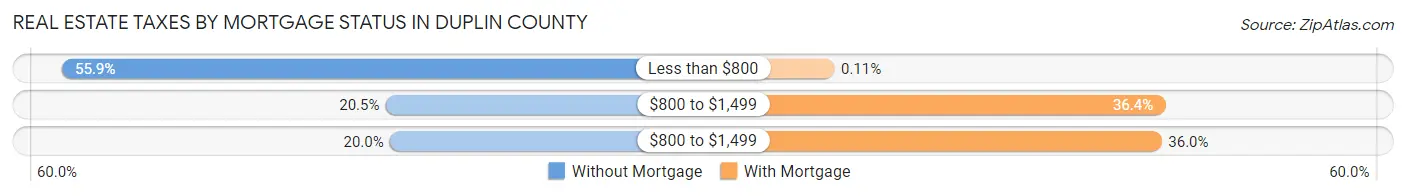
| Property Taxes | Without Mortgage | With Mortgage |
| Less than $800 | 4,393 (55.9%) | 7 (0.1%) |
| $800 to $1,499 | 1,609 (20.5%) | 2,262 (36.4%) |
| $800 to $1,499 | 1,573 (20.0%) | 2,237 (36.0%) |
| Total | 7,860 (100.0%) | 6,217 (100.0%) |
Health & Disability in Duplin County
Health Insurance Coverage by Age in Duplin County
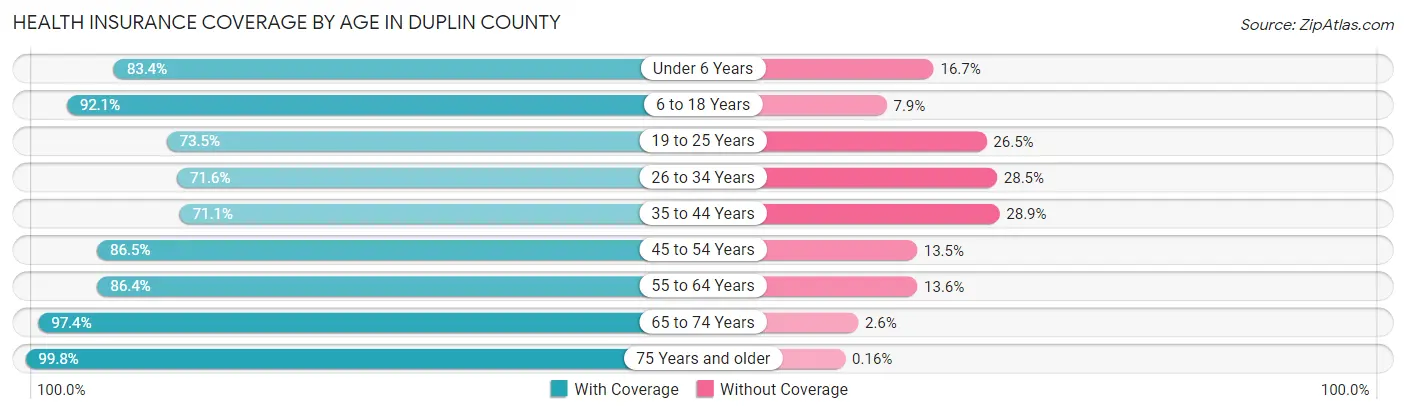
| Age Bracket | With Coverage | Without Coverage |
| Under 6 Years | 3,058 (83.4%) | 611 (16.7%) |
| 6 to 18 Years | 7,997 (92.1%) | 684 (7.9%) |
| 19 to 25 Years | 3,006 (73.5%) | 1,084 (26.5%) |
| 26 to 34 Years | 3,494 (71.6%) | 1,389 (28.4%) |
| 35 to 44 Years | 3,896 (71.1%) | 1,585 (28.9%) |
| 45 to 54 Years | 5,373 (86.5%) | 840 (13.5%) |
| 55 to 64 Years | 5,796 (86.4%) | 911 (13.6%) |
| 65 to 74 Years | 5,358 (97.4%) | 141 (2.6%) |
| 75 Years and older | 3,726 (99.8%) | 6 (0.2%) |
| Total | 41,704 (85.2%) | 7,251 (14.8%) |
Health Insurance Coverage by Citizenship Status in Duplin County
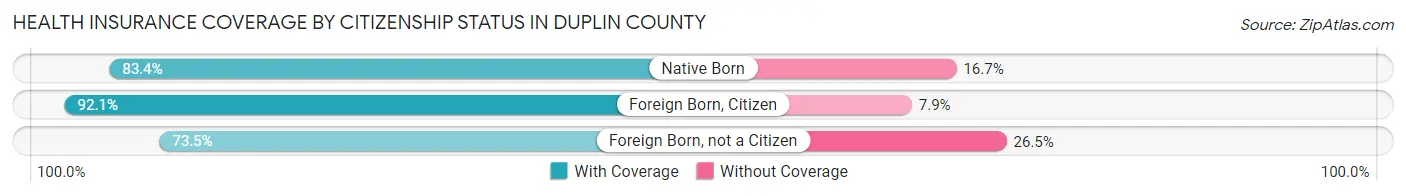
| Citizenship Status | With Coverage | Without Coverage |
| Native Born | 3,058 (83.4%) | 611 (16.7%) |
| Foreign Born, Citizen | 7,997 (92.1%) | 684 (7.9%) |
| Foreign Born, not a Citizen | 3,006 (73.5%) | 1,084 (26.5%) |
Health Insurance Coverage by Household Income in Duplin County
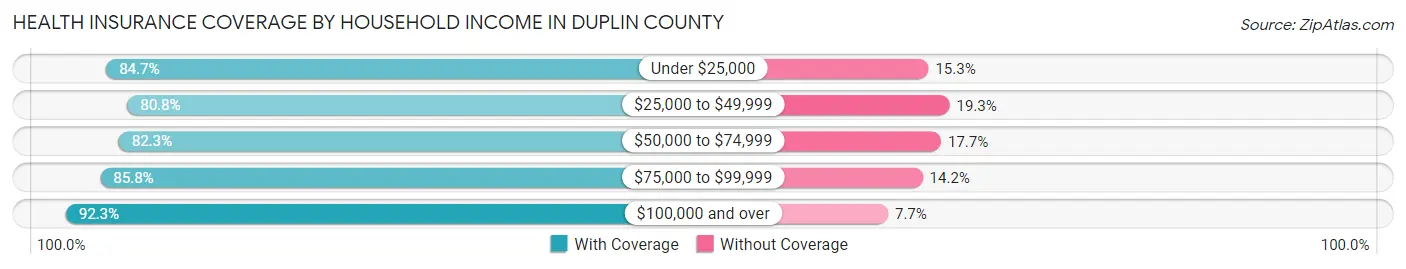
| Household Income | With Coverage | Without Coverage |
| Under $25,000 | 7,575 (84.7%) | 1,368 (15.3%) |
| $25,000 to $49,999 | 9,910 (80.7%) | 2,363 (19.3%) |
| $50,000 to $74,999 | 7,608 (82.3%) | 1,632 (17.7%) |
| $75,000 to $99,999 | 6,099 (85.8%) | 1,010 (14.2%) |
| $100,000 and over | 10,360 (92.3%) | 868 (7.7%) |
Public vs Private Health Insurance Coverage by Age in Duplin County
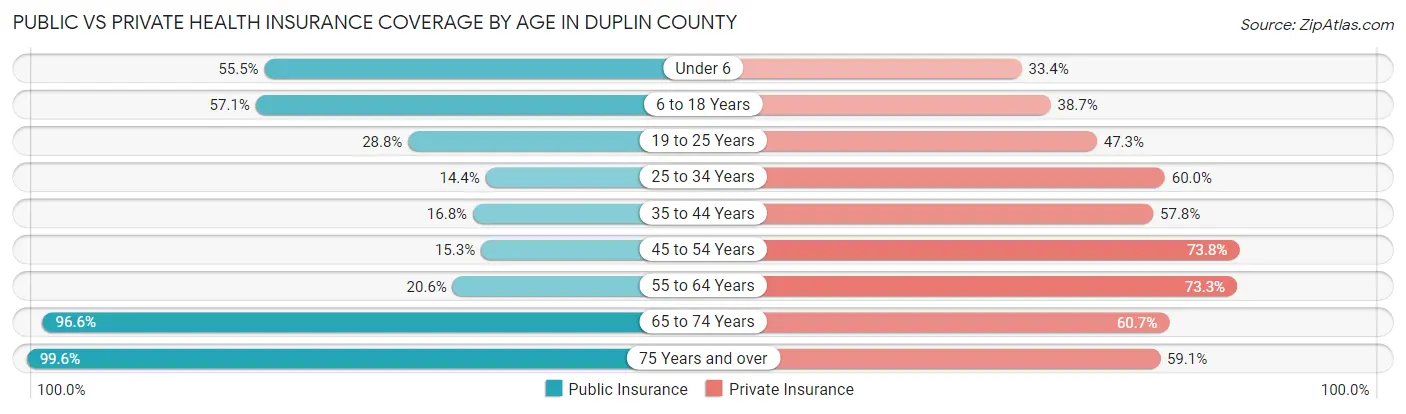
| Age Bracket | Public Insurance | Private Insurance |
| Under 6 | 2,036 (55.5%) | 1,224 (33.4%) |
| 6 to 18 Years | 4,958 (57.1%) | 3,363 (38.7%) |
| 19 to 25 Years | 1,178 (28.8%) | 1,936 (47.3%) |
| 25 to 34 Years | 705 (14.4%) | 2,928 (60.0%) |
| 35 to 44 Years | 920 (16.8%) | 3,167 (57.8%) |
| 45 to 54 Years | 950 (15.3%) | 4,583 (73.8%) |
| 55 to 64 Years | 1,378 (20.5%) | 4,919 (73.3%) |
| 65 to 74 Years | 5,314 (96.6%) | 3,339 (60.7%) |
| 75 Years and over | 3,717 (99.6%) | 2,204 (59.1%) |
| Total | 21,156 (43.2%) | 27,663 (56.5%) |
Disability Status by Sex by Age in Duplin County
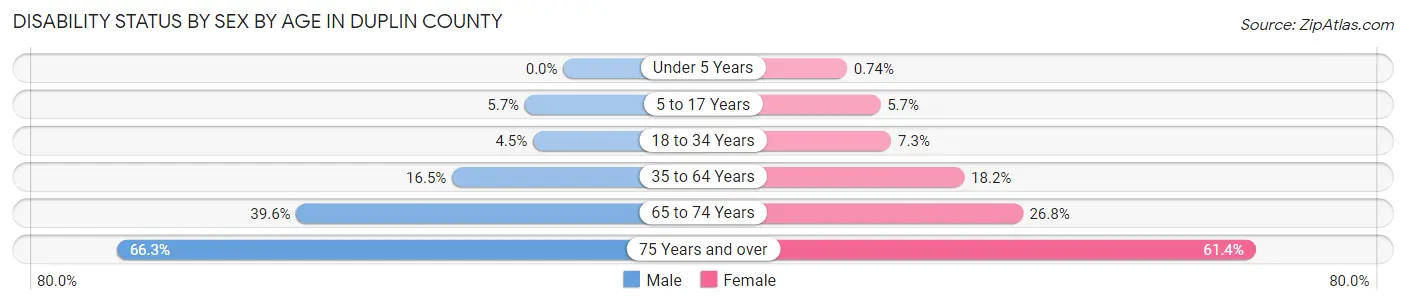
| Age Bracket | Male | Female |
| Under 5 Years | 0 (0.0%) | 11 (0.7%) |
| 5 to 17 Years | 258 (5.7%) | 237 (5.7%) |
| 18 to 34 Years | 220 (4.5%) | 348 (7.3%) |
| 35 to 64 Years | 1,504 (16.5%) | 1,688 (18.2%) |
| 65 to 74 Years | 1,023 (39.6%) | 783 (26.8%) |
| 75 Years and over | 1,020 (66.3%) | 1,348 (61.4%) |
Disability Class by Sex by Age in Duplin County
Disability Class: Hearing Difficulty
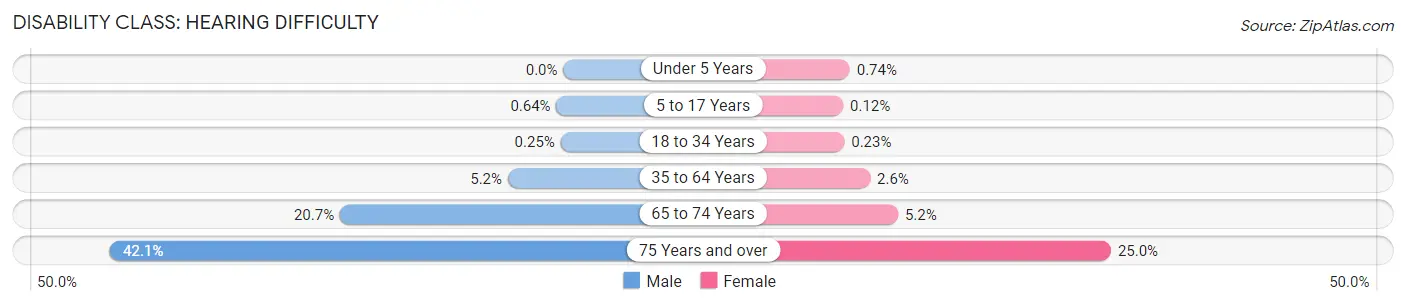
| Age Bracket | Male | Female |
| Under 5 Years | 0 (0.0%) | 11 (0.7%) |
| 5 to 17 Years | 29 (0.6%) | 5 (0.1%) |
| 18 to 34 Years | 12 (0.3%) | 11 (0.2%) |
| 35 to 64 Years | 469 (5.1%) | 244 (2.6%) |
| 65 to 74 Years | 535 (20.7%) | 152 (5.2%) |
| 75 Years and over | 647 (42.1%) | 548 (25.0%) |
Disability Class: Vision Difficulty
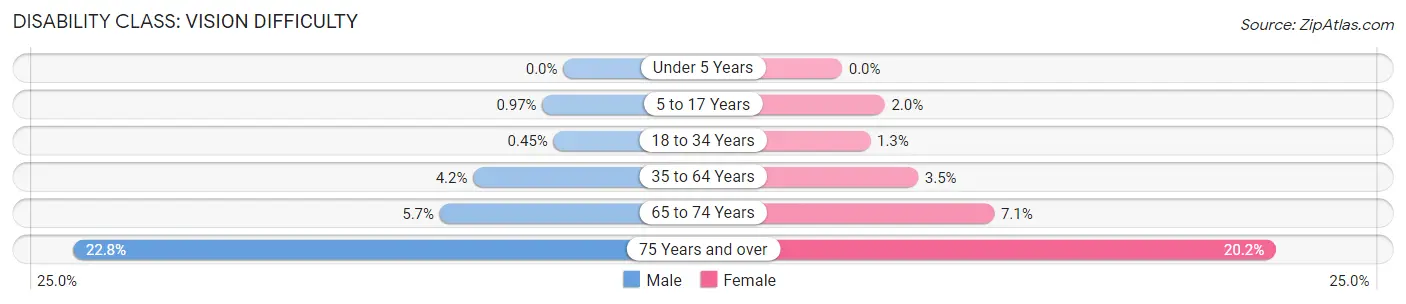
| Age Bracket | Male | Female |
| Under 5 Years | 0 (0.0%) | 0 (0.0%) |
| 5 to 17 Years | 44 (1.0%) | 82 (2.0%) |
| 18 to 34 Years | 22 (0.4%) | 62 (1.3%) |
| 35 to 64 Years | 381 (4.2%) | 328 (3.5%) |
| 65 to 74 Years | 148 (5.7%) | 206 (7.1%) |
| 75 Years and over | 350 (22.8%) | 442 (20.2%) |
Disability Class: Cognitive Difficulty
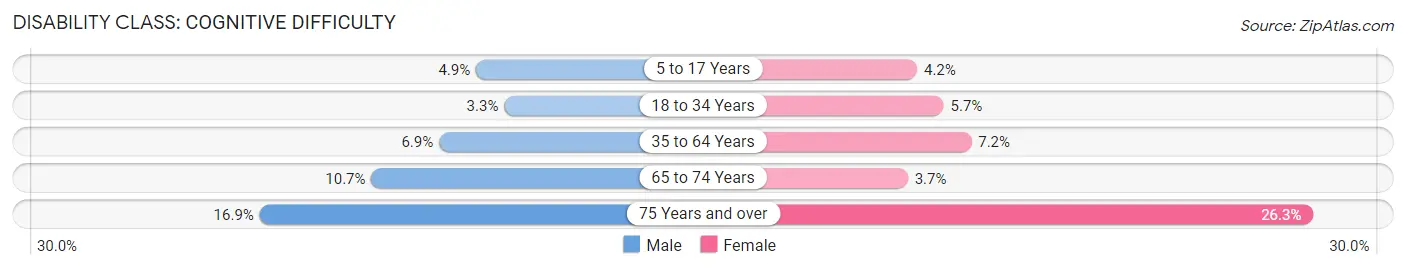
| Age Bracket | Male | Female |
| 5 to 17 Years | 220 (4.9%) | 174 (4.2%) |
| 18 to 34 Years | 161 (3.3%) | 269 (5.7%) |
| 35 to 64 Years | 631 (6.9%) | 670 (7.2%) |
| 65 to 74 Years | 276 (10.7%) | 107 (3.7%) |
| 75 Years and over | 260 (16.9%) | 576 (26.3%) |
Disability Class: Ambulatory Difficulty
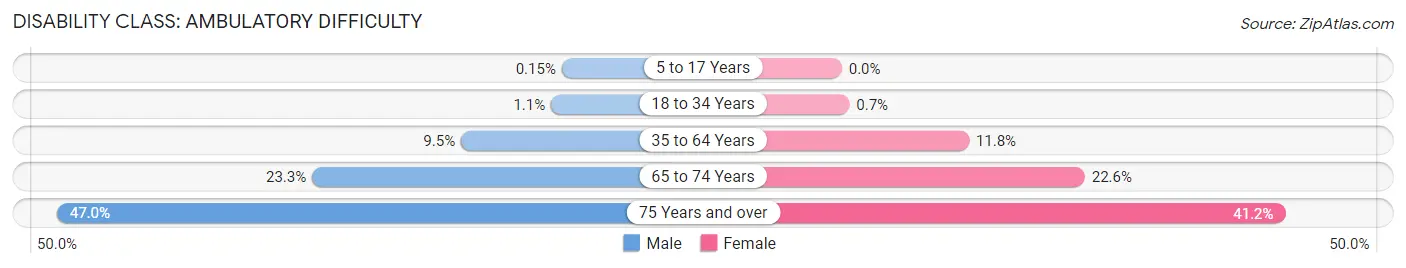
| Age Bracket | Male | Female |
| 5 to 17 Years | 7 (0.2%) | 0 (0.0%) |
| 18 to 34 Years | 56 (1.1%) | 33 (0.7%) |
| 35 to 64 Years | 866 (9.5%) | 1,096 (11.8%) |
| 65 to 74 Years | 602 (23.3%) | 658 (22.6%) |
| 75 Years and over | 723 (47.0%) | 903 (41.2%) |
Disability Class: Self-Care Difficulty
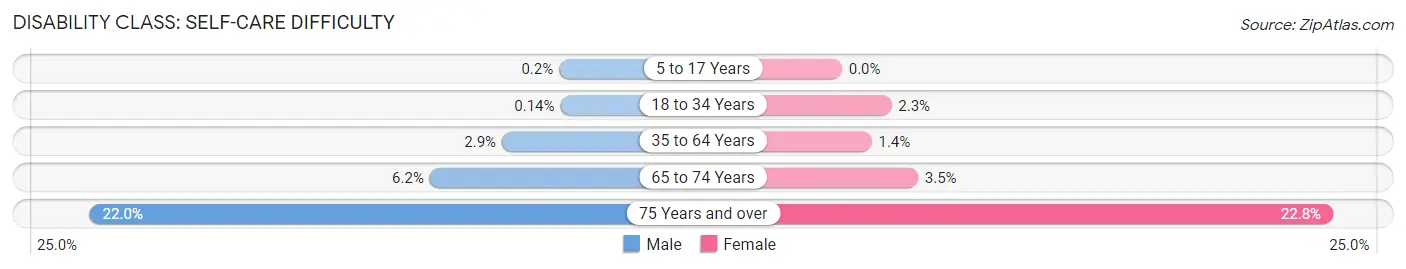
| Age Bracket | Male | Female |
| 5 to 17 Years | 9 (0.2%) | 0 (0.0%) |
| 18 to 34 Years | 7 (0.1%) | 109 (2.3%) |
| 35 to 64 Years | 260 (2.9%) | 128 (1.4%) |
| 65 to 74 Years | 160 (6.2%) | 103 (3.5%) |
| 75 Years and over | 338 (22.0%) | 500 (22.8%) |
Technology Access in Duplin County
Computing Device Access in Duplin County
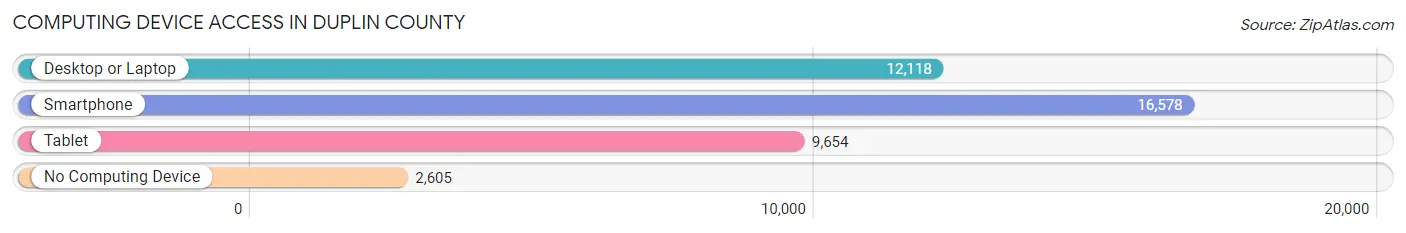
| Device Type | # Households | % Households |
| Desktop or Laptop | 12,118 | 59.7% |
| Smartphone | 16,578 | 81.7% |
| Tablet | 9,654 | 47.6% |
| No Computing Device | 2,605 | 12.8% |
| Total | 20,289 | 100.0% |
Internet Access in Duplin County
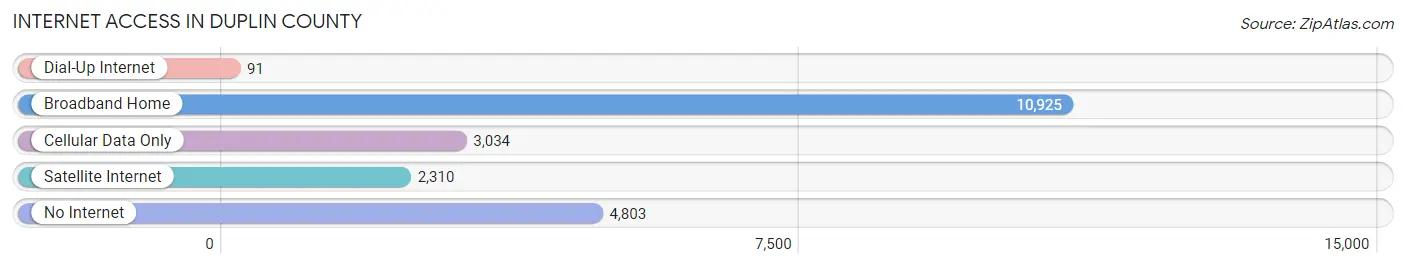
| Internet Type | # Households | % Households |
| Dial-Up Internet | 91 | 0.4% |
| Broadband Home | 10,925 | 53.8% |
| Cellular Data Only | 3,034 | 14.9% |
| Satellite Internet | 2,310 | 11.4% |
| No Internet | 4,803 | 23.7% |
| Total | 20,289 | 100.0% |
Duplin County Summary
Duplin County is located in the southeastern part of North Carolina, and is part of the Wilmington Metropolitan Statistical Area. The county was formed in 1750 from New Hanover County and is named after Thomas Hay, the Earl of Duplin. The county seat is Kenansville, and the largest city is Wallace. As of the 2010 census, the population was 58,505.
Geography
Duplin County is located in the Coastal Plain region of North Carolina, and is bordered by Sampson County to the north, Pender County to the east, New Hanover County to the south, and Jones County to the west. The county covers an area of 590 square miles, and is mostly flat with some rolling hills. The Northeast Cape Fear River runs through the county, and there are several small lakes and ponds. The county is home to the Croatan National Forest, which covers over 160,000 acres.
Economy
Duplin County’s economy is largely based on agriculture, with tobacco, corn, soybeans, and sweet potatoes being the main crops. The county is also home to several large hog farms, which produce pork products for the local and national markets. The county is also home to several manufacturing companies, including a furniture factory, a paper mill, and a plastics plant. Tourism is also an important part of the economy, with visitors coming to the county to enjoy the beaches, fishing, and hunting.
Demographics
As of the 2010 census, there were 58,505 people, 21,845 households, and 15,845 families living in the county. The population density was 99.2 people per square mile. The racial makeup of the county was 68.2% White, 25.2% African American, 0.5% Native American, 0.7% Asian, 0.1% Pacific Islander, 4.2% from other races, and 1.1% from two or more races. Hispanic or Latino of any race were 8.3% of the population.
The median income for a household in the county was $32,917, and the median income for a family was $40,845. The per capita income for the county was $16,845. About 17.2% of families and 21.3% of the population were below the poverty line, including 28.2% of those under age 18 and 17.2% of those age 65 or over.
Conclusion
Duplin County is a rural county located in the southeastern part of North Carolina. The county is largely agricultural, with tobacco, corn, soybeans, and sweet potatoes being the main crops. The county is also home to several manufacturing companies, and tourism is an important part of the economy. The population of the county is mostly white, with African Americans making up the largest minority group. The median income for a household in the county is lower than the state average, and the poverty rate is higher than the state average.
Common Questions
What is Per Capita Income in Duplin County?
Per Capita income in Duplin County is $25,428.
What is the Median Family Income in Duplin County?
Median Family Income in Duplin County is $63,982.
What is the Median Household income in Duplin County?
Median Household Income in Duplin County is $49,376.
What is Income or Wage Gap in Duplin County?
Income or Wage Gap in Duplin County is 27.4%.
Women in Duplin County earn 72.6 cents for every dollar earned by a man.
What is Family Income Deficit in Duplin County?
Family Income Deficit in Duplin County is $11,802.
Families that are below poverty line in Duplin County earn $11,802 less on average than the poverty threshold level.
What is Inequality or Gini Index in Duplin County?
Inequality or Gini Index in Duplin County is 0.42.
What is the Total Population of Duplin County?
Total Population of Duplin County is 49,312.
What is the Total Male Population of Duplin County?
Total Male Population of Duplin County is 24,368.
What is the Total Female Population of Duplin County?
Total Female Population of Duplin County is 24,944.
What is the Ratio of Males per 100 Females in Duplin County?
There are 97.69 Males per 100 Females in Duplin County.
What is the Ratio of Females per 100 Males in Duplin County?
There are 102.36 Females per 100 Males in Duplin County.
What is the Median Population Age in Duplin County?
Median Population Age in Duplin County is 40.6 Years.
What is the Average Family Size in Duplin County
Average Family Size in Duplin County is 2.9 People.
What is the Average Household Size in Duplin County
Average Household Size in Duplin County is 2.4 People.
How Large is the Labor Force in Duplin County?
There are 23,003 People in the Labor Forcein in Duplin County.
What is the Percentage of People in the Labor Force in Duplin County?
58.9% of People are in the Labor Force in Duplin County.
What is the Unemployment Rate in Duplin County?
Unemployment Rate in Duplin County is 5.4%.