Chatham County, NC Map & Demographics
Chatham County Map
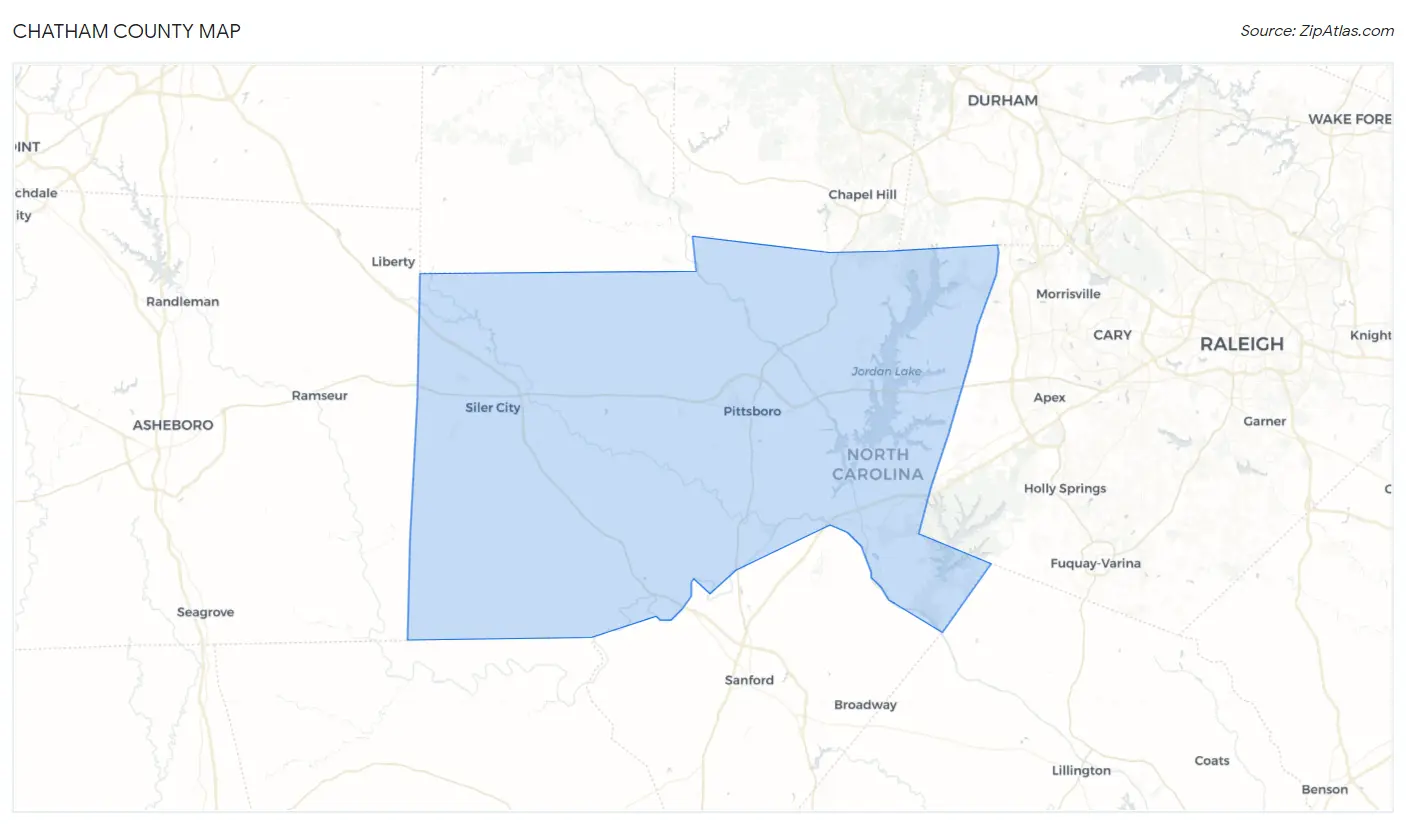
Chatham County Overview
$53,291
PER CAPITA INCOME
$104,609
AVG FAMILY INCOME
$84,222
AVG HOUSEHOLD INCOME
18.2%
WAGE / INCOME GAP [ % ]
81.8¢/ $1
WAGE / INCOME GAP [ $ ]
$8,075
FAMILY INCOME DEFICIT
0.50
INEQUALITY / GINI INDEX
76,754
TOTAL POPULATION
36,955
MALE POPULATION
39,799
FEMALE POPULATION
92.85
MALES / 100 FEMALES
107.70
FEMALES / 100 MALES
47.6
MEDIAN AGE
2.9
AVG FAMILY SIZE
2.4
AVG HOUSEHOLD SIZE
36,498
LABOR FORCE [ PEOPLE ]
57.2%
PERCENT IN LABOR FORCE
2.8%
UNEMPLOYMENT RATE
Income in Chatham County
Income Overview in Chatham County
Per Capita Income in Chatham County is $53,291, while median incomes of families and households are $104,609 and $84,222 respectively.
| Characteristic | Number | Measure |
| Per Capita Income | 76,754 | $53,291 |
| Median Family Income | 21,725 | $104,609 |
| Mean Family Income | 21,725 | $146,045 |
| Median Household Income | 31,131 | $84,222 |
| Mean Household Income | 31,131 | $126,028 |
| Income Deficit | 21,725 | $8,075 |
| Wage / Income Gap (%) | 76,754 | 18.23% |
| Wage / Income Gap ($) | 76,754 | 81.77¢ per $1 |
| Gini / Inequality Index | 76,754 | 0.50 |
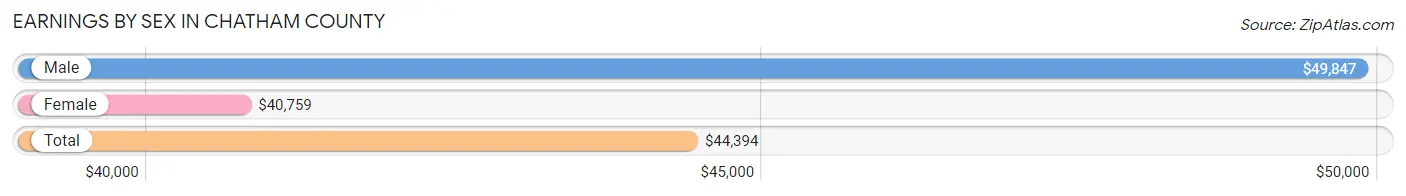
Earnings by Sex in Chatham County
Average Earnings in Chatham County are $44,394, $49,847 for men and $40,759 for women, a difference of 18.2%.
| Sex | Number | Average Earnings |
| Male | 20,757 (53.5%) | $49,847 |
| Female | 18,023 (46.5%) | $40,759 |
| Total | 38,780 (100.0%) | $44,394 |
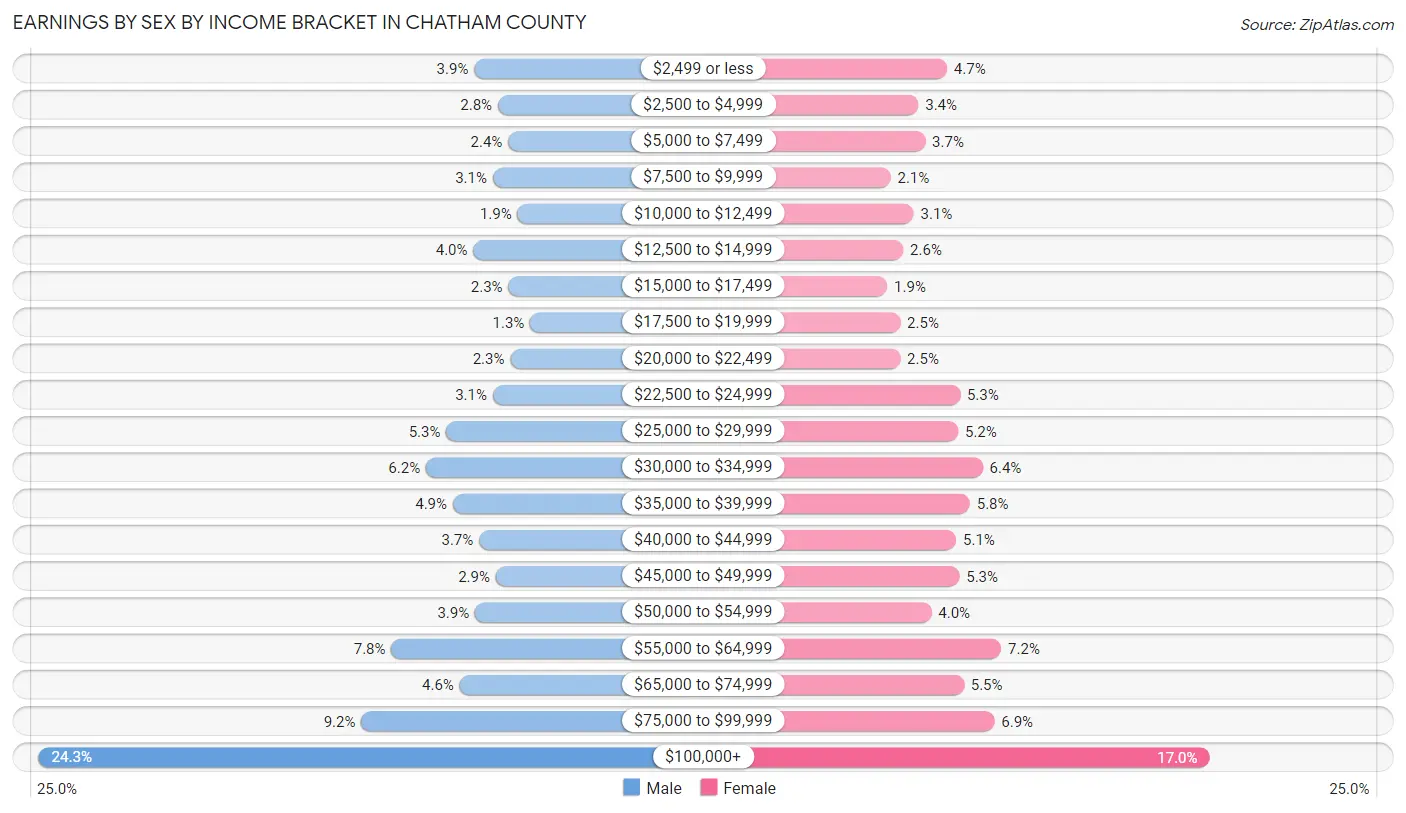
Earnings by Sex by Income Bracket in Chatham County
The most common earnings brackets in Chatham County are $100,000+ for men (5,053 | 24.3%) and $100,000+ for women (3,060 | 17.0%).
| Income | Male | Female |
| $2,499 or less | 818 (3.9%) | 846 (4.7%) |
| $2,500 to $4,999 | 587 (2.8%) | 603 (3.4%) |
| $5,000 to $7,499 | 487 (2.4%) | 662 (3.7%) |
| $7,500 to $9,999 | 637 (3.1%) | 369 (2.1%) |
| $10,000 to $12,499 | 396 (1.9%) | 565 (3.1%) |
| $12,500 to $14,999 | 826 (4.0%) | 476 (2.6%) |
| $15,000 to $17,499 | 486 (2.3%) | 341 (1.9%) |
| $17,500 to $19,999 | 273 (1.3%) | 450 (2.5%) |
| $20,000 to $22,499 | 468 (2.2%) | 450 (2.5%) |
| $22,500 to $24,999 | 637 (3.1%) | 956 (5.3%) |
| $25,000 to $29,999 | 1,089 (5.2%) | 939 (5.2%) |
| $30,000 to $34,999 | 1,287 (6.2%) | 1,146 (6.4%) |
| $35,000 to $39,999 | 1,026 (4.9%) | 1,039 (5.8%) |
| $40,000 to $44,999 | 771 (3.7%) | 922 (5.1%) |
| $45,000 to $49,999 | 609 (2.9%) | 950 (5.3%) |
| $50,000 to $54,999 | 810 (3.9%) | 713 (4.0%) |
| $55,000 to $64,999 | 1,624 (7.8%) | 1,303 (7.2%) |
| $65,000 to $74,999 | 958 (4.6%) | 988 (5.5%) |
| $75,000 to $99,999 | 1,915 (9.2%) | 1,245 (6.9%) |
| $100,000+ | 5,053 (24.3%) | 3,060 (17.0%) |
| Total | 20,757 (100.0%) | 18,023 (100.0%) |
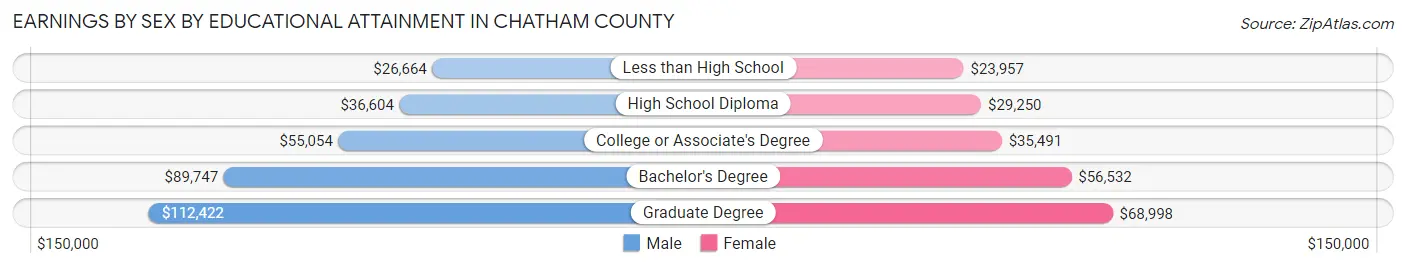
Earnings by Sex by Educational Attainment in Chatham County
Average earnings in Chatham County are $56,097 for men and $46,634 for women, a difference of 16.9%. Men with an educational attainment of graduate degree enjoy the highest average annual earnings of $112,422, while those with less than high school education earn the least with $26,664. Women with an educational attainment of graduate degree earn the most with the average annual earnings of $68,998, while those with less than high school education have the smallest earnings of $23,957.
| Educational Attainment | Male Income | Female Income |
| Less than High School | $26,664 | $23,957 |
| High School Diploma | $36,604 | $29,250 |
| College or Associate's Degree | $55,054 | $35,491 |
| Bachelor's Degree | $89,747 | $56,532 |
| Graduate Degree | $112,422 | $68,998 |
| Total | $56,097 | $46,634 |
Family Income in Chatham County
Family Income Brackets in Chatham County
According to the Chatham County family income data, there are 4,910 families falling into the $200,000+ income range, which is the most common income bracket and makes up 22.6% of all families. Conversely, the less than $10,000 income bracket is the least frequent group with only 434 families (2.0%) belonging to this category.
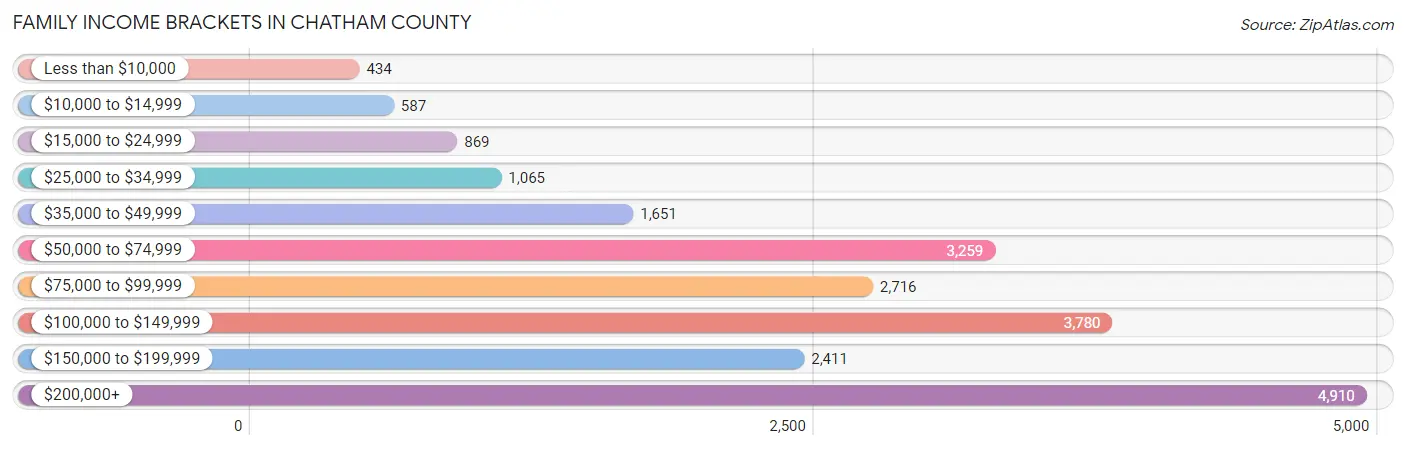
| Income Bracket | # Families | % Families |
| Less than $10,000 | 434 | 2.0% |
| $10,000 to $14,999 | 587 | 2.7% |
| $15,000 to $24,999 | 869 | 4.0% |
| $25,000 to $34,999 | 1,065 | 4.9% |
| $35,000 to $49,999 | 1,651 | 7.6% |
| $50,000 to $74,999 | 3,259 | 15.0% |
| $75,000 to $99,999 | 2,716 | 12.5% |
| $100,000 to $149,999 | 3,780 | 17.4% |
| $150,000 to $199,999 | 2,411 | 11.1% |
| $200,000+ | 4,910 | 22.6% |
Family Income by Famaliy Size in Chatham County
4-person families (3,243 | 14.9%) account for the highest median family income in Chatham County with $165,344 per family, while 2-person families (12,358 | 56.9%) have the highest median income of $47,110 per family member.
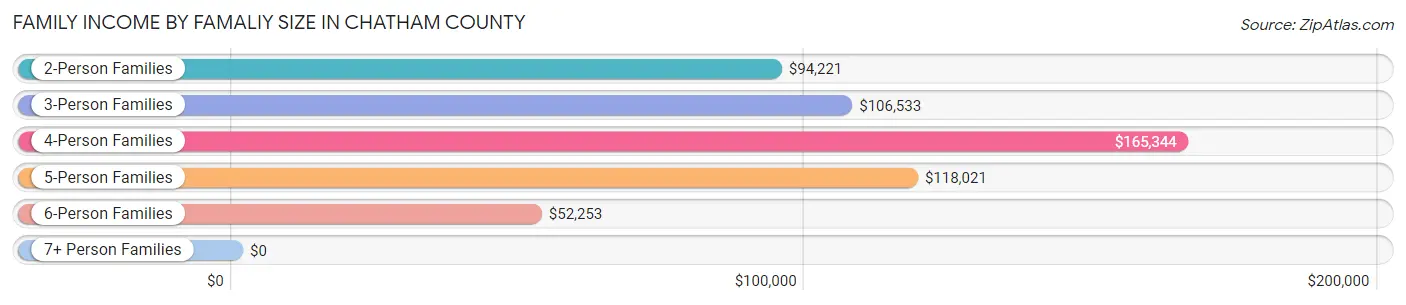
| Income Bracket | # Families | Median Income |
| 2-Person Families | 12,358 (56.9%) | $94,221 |
| 3-Person Families | 3,903 (18.0%) | $106,533 |
| 4-Person Families | 3,243 (14.9%) | $165,344 |
| 5-Person Families | 1,543 (7.1%) | $118,021 |
| 6-Person Families | 405 (1.9%) | $52,253 |
| 7+ Person Families | 273 (1.3%) | $0 |
| Total | 21,725 (100.0%) | $104,609 |
Family Income by Number of Earners in Chatham County
The median family income in Chatham County is $104,609, with families comprising 3+ earners (1,818) having the highest median family income of $151,250, while families with 1 earner (6,373) have the lowest median family income of $67,170, accounting for 8.4% and 29.3% of families, respectively.
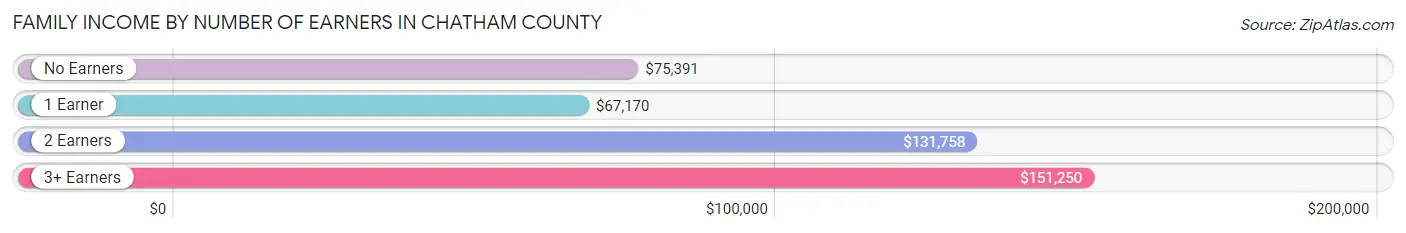
| Number of Earners | # Families | Median Income |
| No Earners | 4,523 (20.8%) | $75,391 |
| 1 Earner | 6,373 (29.3%) | $67,170 |
| 2 Earners | 9,011 (41.5%) | $131,758 |
| 3+ Earners | 1,818 (8.4%) | $151,250 |
| Total | 21,725 (100.0%) | $104,609 |
Household Income in Chatham County
Household Income Brackets in Chatham County
With 5,572 households falling in the category, the $200,000+ income range is the most frequent in Chatham County, accounting for 17.9% of all households. In contrast, only 778 households (2.5%) fall into the less than $10,000 income bracket, making it the least populous group.
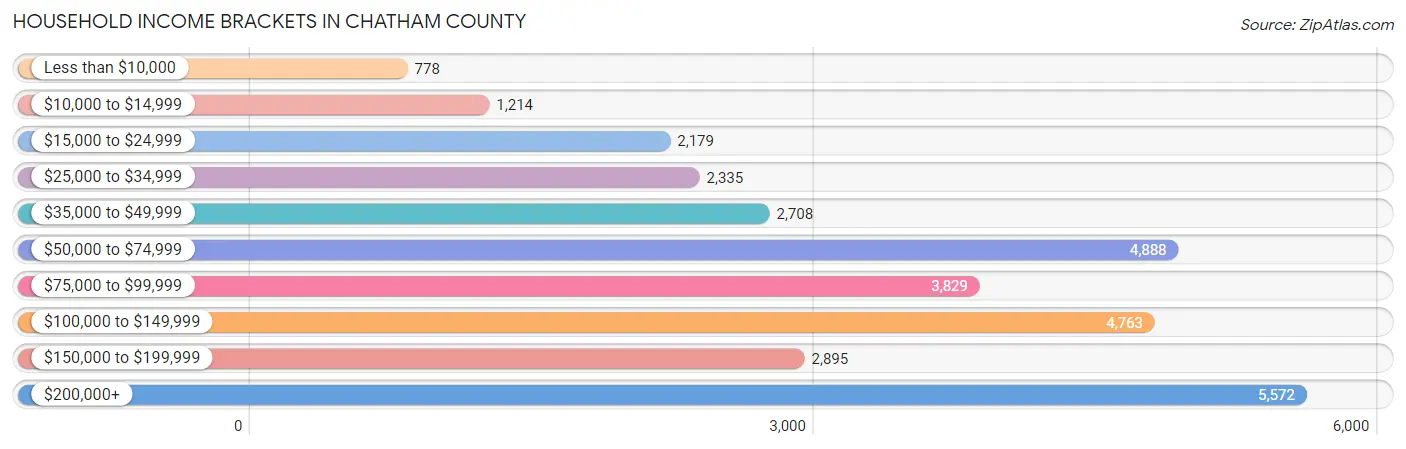
| Income Bracket | # Households | % Households |
| Less than $10,000 | 778 | 2.5% |
| $10,000 to $14,999 | 1,214 | 3.9% |
| $15,000 to $24,999 | 2,179 | 7.0% |
| $25,000 to $34,999 | 2,335 | 7.5% |
| $35,000 to $49,999 | 2,708 | 8.7% |
| $50,000 to $74,999 | 4,888 | 15.7% |
| $75,000 to $99,999 | 3,829 | 12.3% |
| $100,000 to $149,999 | 4,763 | 15.3% |
| $150,000 to $199,999 | 2,895 | 9.3% |
| $200,000+ | 5,572 | 17.9% |
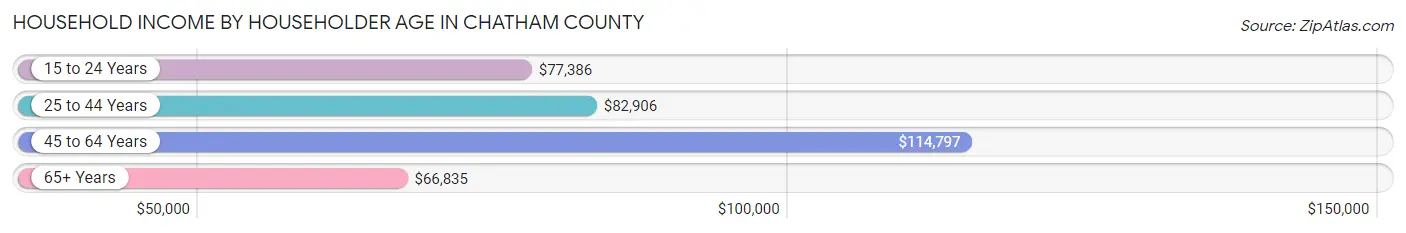
Household Income by Householder Age in Chatham County
The median household income in Chatham County is $84,222, with the highest median household income of $114,797 found in the 45 to 64 years age bracket for the primary householder. A total of 12,028 households (38.6%) fall into this category. Meanwhile, the 65+ years age bracket for the primary householder has the lowest median household income of $66,835, with 11,539 households (37.1%) in this group.
| Income Bracket | # Households | Median Income |
| 15 to 24 Years | 572 (1.8%) | $77,386 |
| 25 to 44 Years | 6,992 (22.5%) | $82,906 |
| 45 to 64 Years | 12,028 (38.6%) | $114,797 |
| 65+ Years | 11,539 (37.1%) | $66,835 |
| Total | 31,131 (100.0%) | $84,222 |
Poverty in Chatham County
Income Below Poverty by Sex and Age in Chatham County
With 9.7% poverty level for males and 11.1% for females among the residents of Chatham County, 25 to 34 year old males and 5 year old females are the most vulnerable to poverty, with 787 males (23.0%) and 145 females (50.3%) in their respective age groups living below the poverty level.
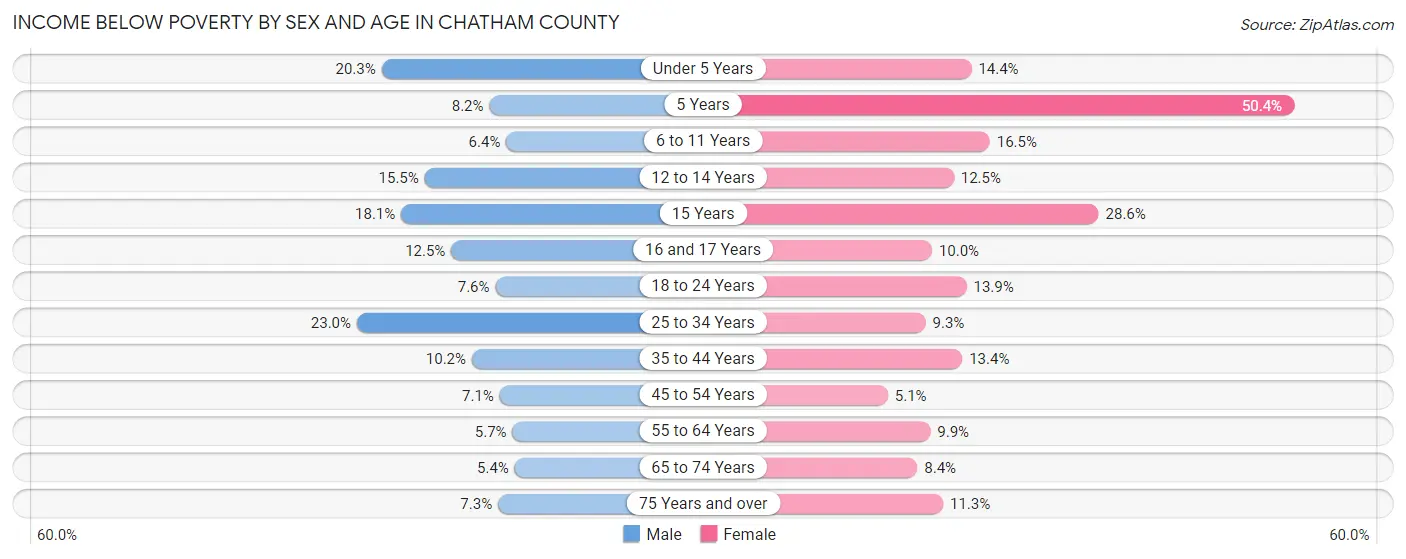
| Age Bracket | Male | Female |
| Under 5 Years | 340 (20.3%) | 255 (14.4%) |
| 5 Years | 22 (8.2%) | 145 (50.3%) |
| 6 to 11 Years | 170 (6.4%) | 390 (16.5%) |
| 12 to 14 Years | 187 (15.4%) | 175 (12.5%) |
| 15 Years | 73 (18.1%) | 167 (28.6%) |
| 16 and 17 Years | 124 (12.5%) | 104 (10.0%) |
| 18 to 24 Years | 183 (7.6%) | 362 (13.9%) |
| 25 to 34 Years | 787 (23.0%) | 337 (9.3%) |
| 35 to 44 Years | 453 (10.2%) | 557 (13.4%) |
| 45 to 54 Years | 355 (7.1%) | 270 (5.1%) |
| 55 to 64 Years | 317 (5.7%) | 595 (9.9%) |
| 65 to 74 Years | 271 (5.4%) | 484 (8.4%) |
| 75 Years and over | 252 (7.3%) | 502 (11.3%) |
| Total | 3,534 (9.7%) | 4,343 (11.1%) |
Income Above Poverty by Sex and Age in Chatham County
According to the poverty statistics in Chatham County, males aged 65 to 74 years and females aged 45 to 54 years are the age groups that are most secure financially, with 94.6% of males and 94.9% of females in these age groups living above the poverty line.
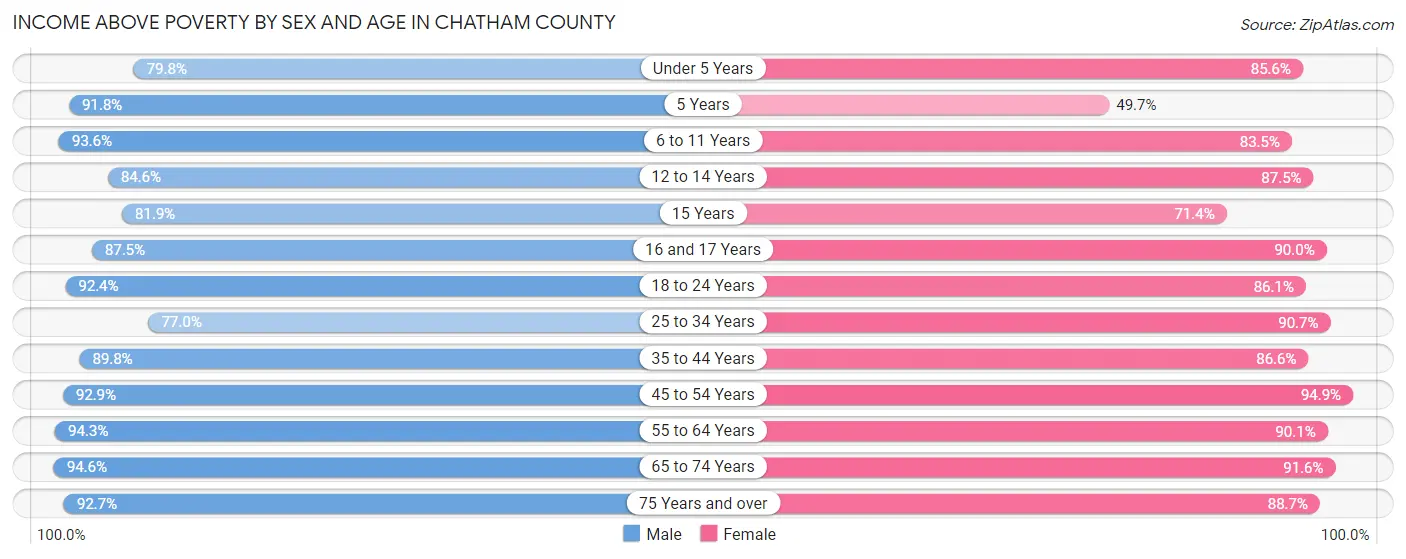
| Age Bracket | Male | Female |
| Under 5 Years | 1,339 (79.7%) | 1,511 (85.6%) |
| 5 Years | 245 (91.8%) | 143 (49.6%) |
| 6 to 11 Years | 2,502 (93.6%) | 1,977 (83.5%) |
| 12 to 14 Years | 1,023 (84.6%) | 1,228 (87.5%) |
| 15 Years | 331 (81.9%) | 417 (71.4%) |
| 16 and 17 Years | 869 (87.5%) | 932 (90.0%) |
| 18 to 24 Years | 2,235 (92.4%) | 2,245 (86.1%) |
| 25 to 34 Years | 2,635 (77.0%) | 3,275 (90.7%) |
| 35 to 44 Years | 3,993 (89.8%) | 3,598 (86.6%) |
| 45 to 54 Years | 4,650 (92.9%) | 4,994 (94.9%) |
| 55 to 64 Years | 5,274 (94.3%) | 5,438 (90.1%) |
| 65 to 74 Years | 4,725 (94.6%) | 5,269 (91.6%) |
| 75 Years and over | 3,208 (92.7%) | 3,950 (88.7%) |
| Total | 33,029 (90.3%) | 34,977 (88.9%) |
Income Below Poverty Among Married-Couple Families in Chatham County
The poverty statistics for married-couple families in Chatham County show that 4.3% or 763 of the total 17,924 families live below the poverty line. Families with 3 or 4 children have the highest poverty rate of 14.6%, comprising of 135 families. On the other hand, families with 5 or more children have the lowest poverty rate of 0.0%, which includes 0 families.
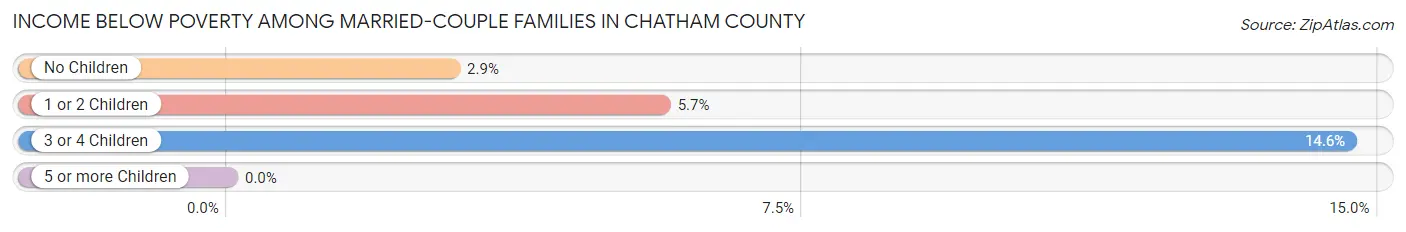
| Children | Above Poverty | Below Poverty |
| No Children | 11,368 (97.1%) | 340 (2.9%) |
| 1 or 2 Children | 4,813 (94.4%) | 288 (5.7%) |
| 3 or 4 Children | 789 (85.4%) | 135 (14.6%) |
| 5 or more Children | 191 (100.0%) | 0 (0.0%) |
| Total | 17,161 (95.7%) | 763 (4.3%) |
Income Below Poverty Among Single-Parent Households in Chatham County
According to the poverty data in Chatham County, 16.2% or 169 single-father households and 29.0% or 800 single-mother households are living below the poverty line. Among single-father households, those with 5 or more children have the highest poverty rate, with 18 households (100.0%) experiencing poverty. Likewise, among single-mother households, those with 5 or more children have the highest poverty rate, with 18 households (100.0%) falling below the poverty line.
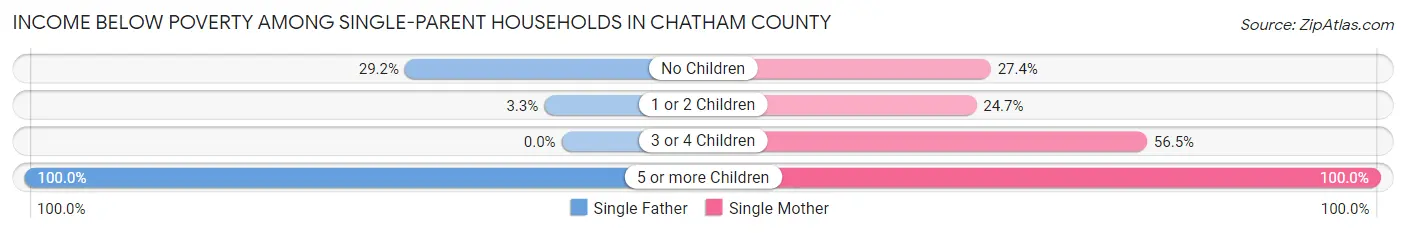
| Children | Single Father | Single Mother |
| No Children | 136 (29.2%) | 367 (27.4%) |
| 1 or 2 Children | 15 (3.3%) | 293 (24.7%) |
| 3 or 4 Children | 0 (0.0%) | 122 (56.5%) |
| 5 or more Children | 18 (100.0%) | 18 (100.0%) |
| Total | 169 (16.2%) | 800 (29.0%) |
Income Below Poverty Among Married-Couple vs Single-Parent Households in Chatham County
The poverty data for Chatham County shows that 763 of the married-couple family households (4.3%) and 969 of the single-parent households (25.5%) are living below the poverty level. Within the married-couple family households, those with 3 or 4 children have the highest poverty rate, with 135 households (14.6%) falling below the poverty line. Among the single-parent households, those with 5 or more children have the highest poverty rate, with 36 household (100.0%) living below poverty.
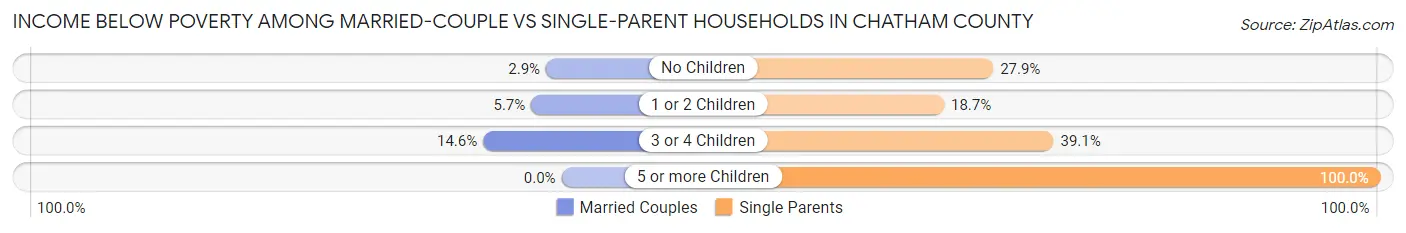
| Children | Married-Couple Families | Single-Parent Households |
| No Children | 340 (2.9%) | 503 (27.9%) |
| 1 or 2 Children | 288 (5.7%) | 308 (18.7%) |
| 3 or 4 Children | 135 (14.6%) | 122 (39.1%) |
| 5 or more Children | 0 (0.0%) | 36 (100.0%) |
| Total | 763 (4.3%) | 969 (25.5%) |
Race in Chatham County
The most populous races in Chatham County are White / Caucasian (57,509 | 74.9%), Hispanic or Latino (9,332 | 12.2%), and Black / African American (8,280 | 10.8%).
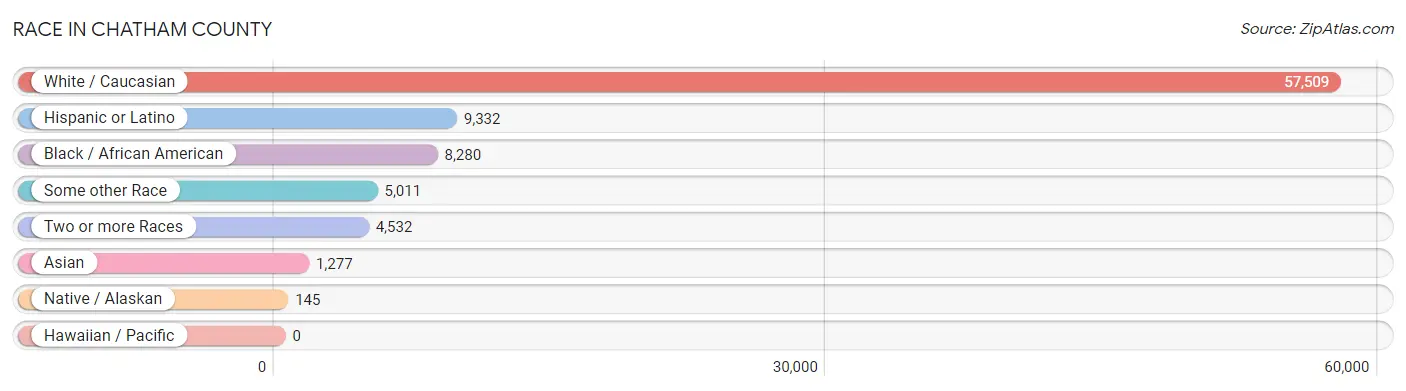
| Race | # Population | % Population |
| Asian | 1,277 | 1.7% |
| Black / African American | 8,280 | 10.8% |
| Hawaiian / Pacific | 0 | 0.0% |
| Hispanic or Latino | 9,332 | 12.2% |
| Native / Alaskan | 145 | 0.2% |
| White / Caucasian | 57,509 | 74.9% |
| Two or more Races | 4,532 | 5.9% |
| Some other Race | 5,011 | 6.5% |
| Total | 76,754 | 100.0% |
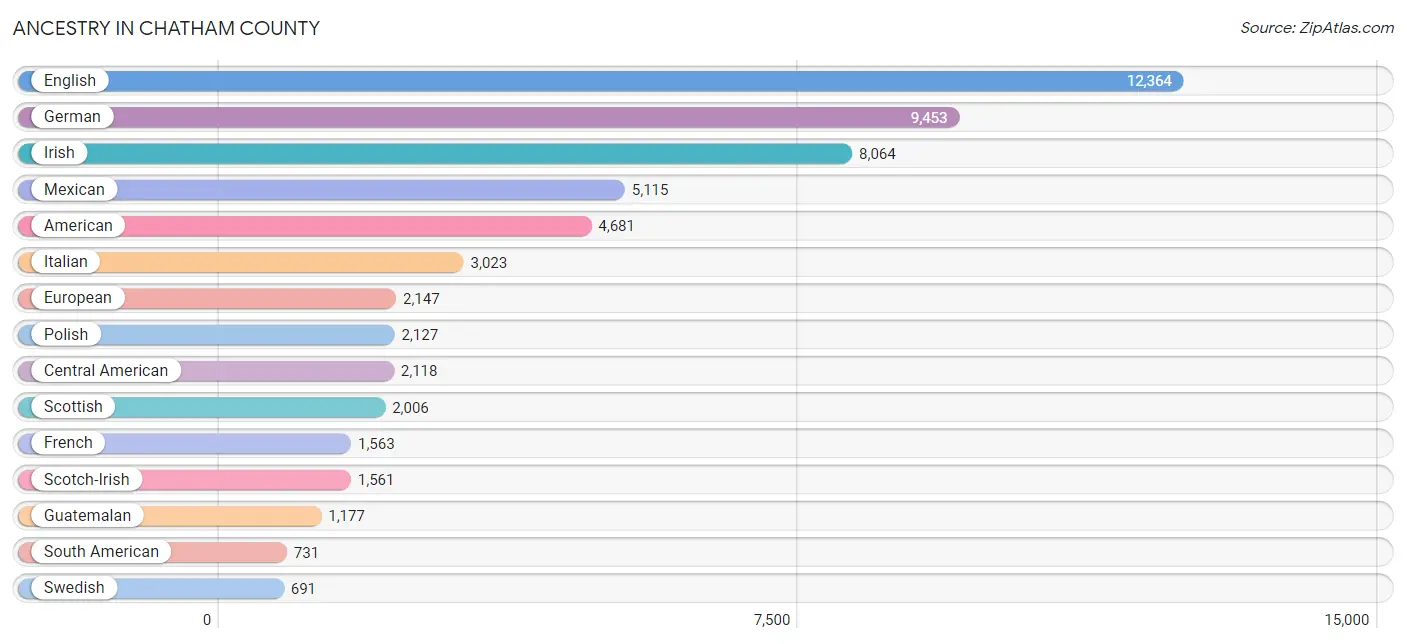
Ancestry in Chatham County
The most populous ancestries reported in Chatham County are English (12,364 | 16.1%), German (9,453 | 12.3%), Irish (8,064 | 10.5%), Mexican (5,115 | 6.7%), and American (4,681 | 6.1%), together accounting for 51.7% of all Chatham County residents.
| Ancestry | # Population | % Population |
| African | 92 | 0.1% |
| Albanian | 35 | 0.1% |
| American | 4,681 | 6.1% |
| Arab | 147 | 0.2% |
| Argentinean | 72 | 0.1% |
| Armenian | 60 | 0.1% |
| Australian | 12 | 0.0% |
| Austrian | 192 | 0.3% |
| Belgian | 254 | 0.3% |
| Bhutanese | 243 | 0.3% |
| Blackfeet | 14 | 0.0% |
| Brazilian | 61 | 0.1% |
| British | 356 | 0.5% |
| British West Indian | 26 | 0.0% |
| Bulgarian | 7 | 0.0% |
| Burmese | 183 | 0.2% |
| Canadian | 215 | 0.3% |
| Celtic | 116 | 0.2% |
| Central American | 2,118 | 2.8% |
| Cherokee | 350 | 0.5% |
| Chilean | 21 | 0.0% |
| Choctaw | 6 | 0.0% |
| Colombian | 549 | 0.7% |
| Croatian | 61 | 0.1% |
| Cuban | 220 | 0.3% |
| Cypriot | 13 | 0.0% |
| Czech | 254 | 0.3% |
| Czechoslovakian | 40 | 0.1% |
| Danish | 407 | 0.5% |
| Dominican | 72 | 0.1% |
| Dutch | 597 | 0.8% |
| Eastern European | 513 | 0.7% |
| Egyptian | 52 | 0.1% |
| English | 12,364 | 16.1% |
| European | 2,147 | 2.8% |
| Finnish | 141 | 0.2% |
| French | 1,563 | 2.0% |
| French Canadian | 333 | 0.4% |
| German | 9,453 | 12.3% |
| Greek | 166 | 0.2% |
| Guatemalan | 1,177 | 1.5% |
| Haitian | 42 | 0.1% |
| Honduran | 626 | 0.8% |
| Hungarian | 363 | 0.5% |
| Icelander | 6 | 0.0% |
| Indian (Asian) | 637 | 0.8% |
| Iranian | 97 | 0.1% |
| Irish | 8,064 | 10.5% |
| Israeli | 37 | 0.1% |
| Italian | 3,023 | 3.9% |
| Jamaican | 50 | 0.1% |
| Japanese | 59 | 0.1% |
| Korean | 400 | 0.5% |
| Latvian | 32 | 0.0% |
| Lebanese | 86 | 0.1% |
| Lithuanian | 140 | 0.2% |
| Lumbee | 39 | 0.1% |
| Luxembourger | 8 | 0.0% |
| Mexican | 5,115 | 6.7% |
| Mexican American Indian | 7 | 0.0% |
| Native Hawaiian | 36 | 0.1% |
| Northern European | 112 | 0.2% |
| Norwegian | 402 | 0.5% |
| Pakistani | 43 | 0.1% |
| Panamanian | 28 | 0.0% |
| Pennsylvania German | 31 | 0.0% |
| Peruvian | 7 | 0.0% |
| Polish | 2,127 | 2.8% |
| Portuguese | 115 | 0.2% |
| Puerto Rican | 429 | 0.6% |
| Romanian | 160 | 0.2% |
| Russian | 610 | 0.8% |
| Salvadoran | 287 | 0.4% |
| Scandinavian | 250 | 0.3% |
| Scotch-Irish | 1,561 | 2.0% |
| Scottish | 2,006 | 2.6% |
| Serbian | 17 | 0.0% |
| Slovak | 126 | 0.2% |
| Slovene | 10 | 0.0% |
| South American | 731 | 0.9% |
| Spaniard | 117 | 0.2% |
| Spanish | 123 | 0.2% |
| Sri Lankan | 139 | 0.2% |
| Subsaharan African | 121 | 0.2% |
| Swedish | 691 | 0.9% |
| Swiss | 98 | 0.1% |
| Thai | 353 | 0.5% |
| Turkish | 23 | 0.0% |
| Ukrainian | 246 | 0.3% |
| Venezuelan | 82 | 0.1% |
| Welsh | 587 | 0.8% |
| West Indian | 9 | 0.0% |
| Yugoslavian | 29 | 0.0% | View All 93 Rows |
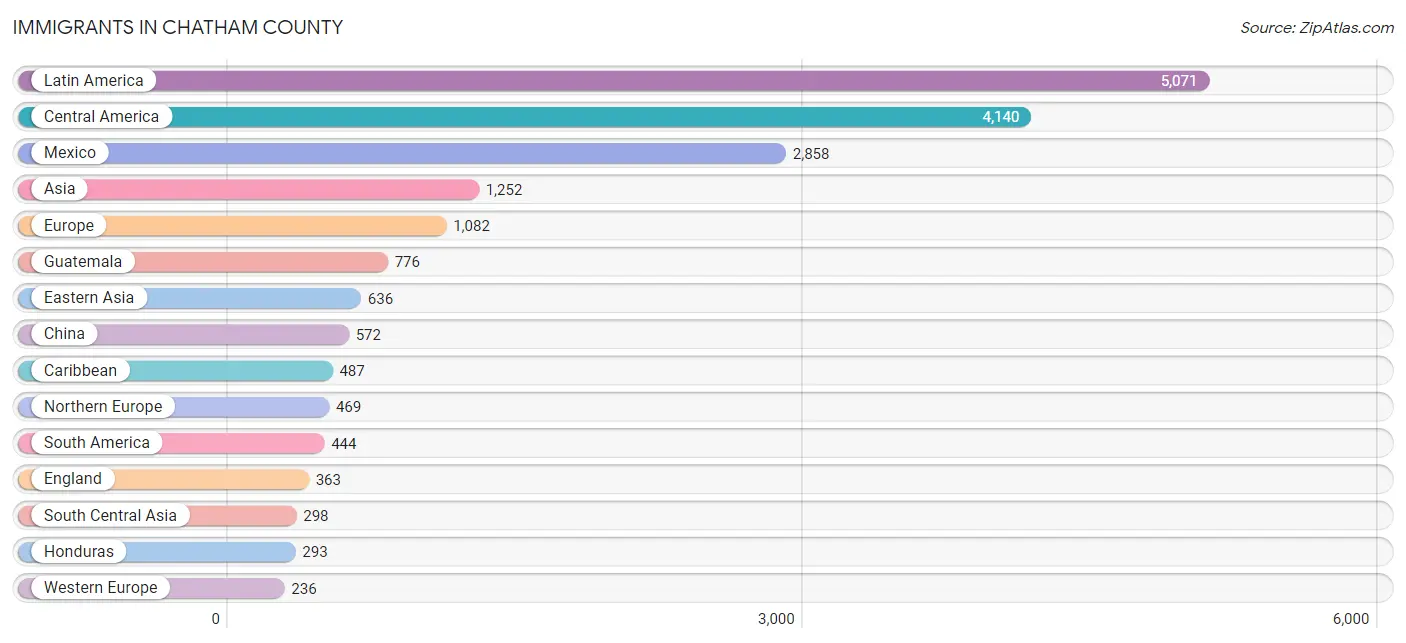
Immigrants in Chatham County
The most numerous immigrant groups reported in Chatham County came from Latin America (5,071 | 6.6%), Central America (4,140 | 5.4%), Mexico (2,858 | 3.7%), Asia (1,252 | 1.6%), and Europe (1,082 | 1.4%), together accounting for 18.8% of all Chatham County residents.
| Immigration Origin | # Population | % Population |
| Africa | 81 | 0.1% |
| Albania | 25 | 0.0% |
| Argentina | 72 | 0.1% |
| Armenia | 16 | 0.0% |
| Asia | 1,252 | 1.6% |
| Australia | 12 | 0.0% |
| Bahamas | 36 | 0.1% |
| Brazil | 79 | 0.1% |
| Canada | 119 | 0.2% |
| Caribbean | 487 | 0.6% |
| Central America | 4,140 | 5.4% |
| Chile | 21 | 0.0% |
| China | 572 | 0.7% |
| Colombia | 167 | 0.2% |
| Cuba | 215 | 0.3% |
| Czechoslovakia | 10 | 0.0% |
| Dominican Republic | 99 | 0.1% |
| Eastern Africa | 24 | 0.0% |
| Eastern Asia | 636 | 0.8% |
| Eastern Europe | 224 | 0.3% |
| Egypt | 28 | 0.0% |
| El Salvador | 198 | 0.3% |
| England | 363 | 0.5% |
| Europe | 1,082 | 1.4% |
| France | 75 | 0.1% |
| Germany | 139 | 0.2% |
| Grenada | 17 | 0.0% |
| Guatemala | 776 | 1.0% |
| Guyana | 24 | 0.0% |
| Haiti | 42 | 0.1% |
| Honduras | 293 | 0.4% |
| Hungary | 19 | 0.0% |
| India | 214 | 0.3% |
| Iran | 79 | 0.1% |
| Iraq | 39 | 0.1% |
| Ireland | 54 | 0.1% |
| Israel | 13 | 0.0% |
| Italy | 11 | 0.0% |
| Jamaica | 38 | 0.1% |
| Japan | 50 | 0.1% |
| Korea | 14 | 0.0% |
| Laos | 3 | 0.0% |
| Latin America | 5,071 | 6.6% |
| Mexico | 2,858 | 3.7% |
| Middle Africa | 14 | 0.0% |
| Moldova | 16 | 0.0% |
| Netherlands | 8 | 0.0% |
| Northern Africa | 28 | 0.0% |
| Northern Europe | 469 | 0.6% |
| Oceania | 12 | 0.0% |
| Panama | 15 | 0.0% |
| Philippines | 99 | 0.1% |
| Romania | 26 | 0.0% |
| Russia | 104 | 0.1% |
| South America | 444 | 0.6% |
| South Central Asia | 298 | 0.4% |
| South Eastern Asia | 161 | 0.2% |
| Southern Europe | 153 | 0.2% |
| Spain | 142 | 0.2% |
| Sri Lanka | 5 | 0.0% |
| Sweden | 28 | 0.0% |
| Switzerland | 14 | 0.0% |
| Taiwan | 118 | 0.2% |
| Turkey | 76 | 0.1% |
| Uganda | 24 | 0.0% |
| Ukraine | 24 | 0.0% |
| Venezuela | 81 | 0.1% |
| Vietnam | 59 | 0.1% |
| Western Africa | 15 | 0.0% |
| Western Asia | 157 | 0.2% |
| Western Europe | 236 | 0.3% | View All 71 Rows |
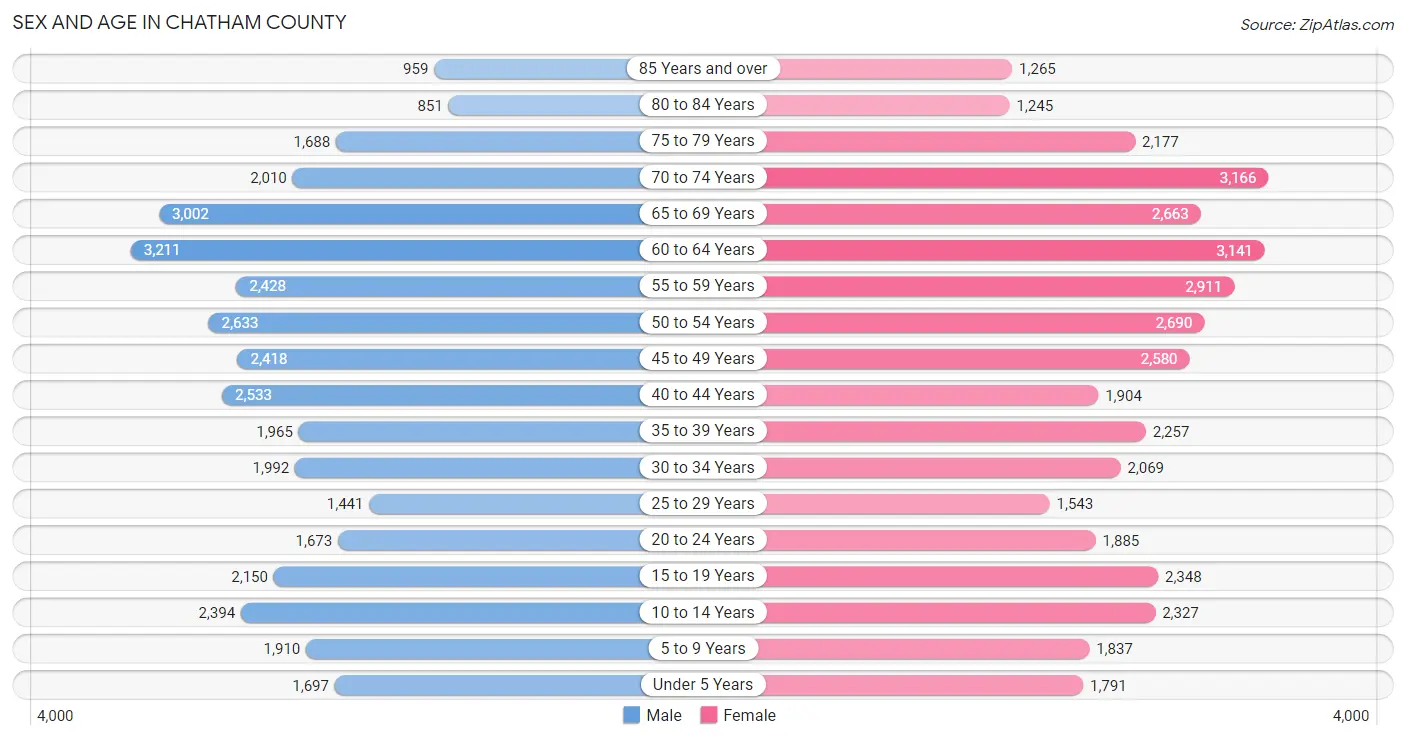
Sex and Age in Chatham County
Sex and Age in Chatham County
The most populous age groups in Chatham County are 60 to 64 Years (3,211 | 8.7%) for men and 70 to 74 Years (3,166 | 8.0%) for women.
| Age Bracket | Male | Female |
| Under 5 Years | 1,697 (4.6%) | 1,791 (4.5%) |
| 5 to 9 Years | 1,910 (5.2%) | 1,837 (4.6%) |
| 10 to 14 Years | 2,394 (6.5%) | 2,327 (5.9%) |
| 15 to 19 Years | 2,150 (5.8%) | 2,348 (5.9%) |
| 20 to 24 Years | 1,673 (4.5%) | 1,885 (4.7%) |
| 25 to 29 Years | 1,441 (3.9%) | 1,543 (3.9%) |
| 30 to 34 Years | 1,992 (5.4%) | 2,069 (5.2%) |
| 35 to 39 Years | 1,965 (5.3%) | 2,257 (5.7%) |
| 40 to 44 Years | 2,533 (6.9%) | 1,904 (4.8%) |
| 45 to 49 Years | 2,418 (6.5%) | 2,580 (6.5%) |
| 50 to 54 Years | 2,633 (7.1%) | 2,690 (6.8%) |
| 55 to 59 Years | 2,428 (6.6%) | 2,911 (7.3%) |
| 60 to 64 Years | 3,211 (8.7%) | 3,141 (7.9%) |
| 65 to 69 Years | 3,002 (8.1%) | 2,663 (6.7%) |
| 70 to 74 Years | 2,010 (5.4%) | 3,166 (8.0%) |
| 75 to 79 Years | 1,688 (4.6%) | 2,177 (5.5%) |
| 80 to 84 Years | 851 (2.3%) | 1,245 (3.1%) |
| 85 Years and over | 959 (2.6%) | 1,265 (3.2%) |
| Total | 36,955 (100.0%) | 39,799 (100.0%) |
Families and Households in Chatham County
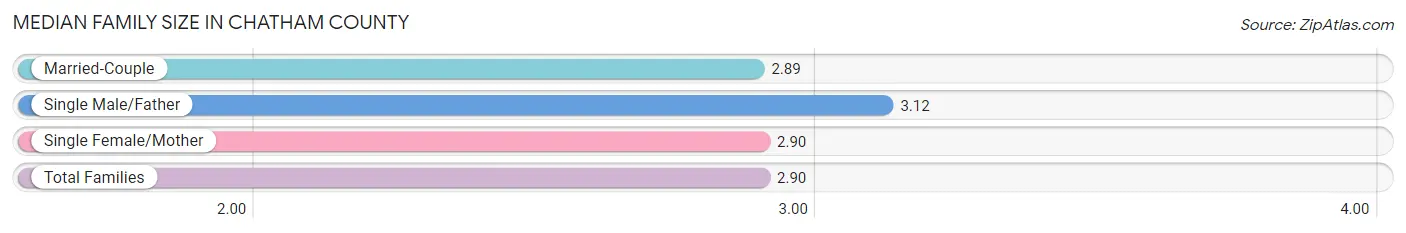
Median Family Size in Chatham County
The median family size in Chatham County is 2.90 persons per family, with single male/father families (1,041 | 4.8%) accounting for the largest median family size of 3.12 persons per family. On the other hand, married-couple families (17,924 | 82.5%) represent the smallest median family size with 2.89 persons per family.
| Family Type | # Families | Family Size |
| Married-Couple | 17,924 (82.5%) | 2.89 |
| Single Male/Father | 1,041 (4.8%) | 3.12 |
| Single Female/Mother | 2,760 (12.7%) | 2.90 |
| Total Families | 21,725 (100.0%) | 2.90 |
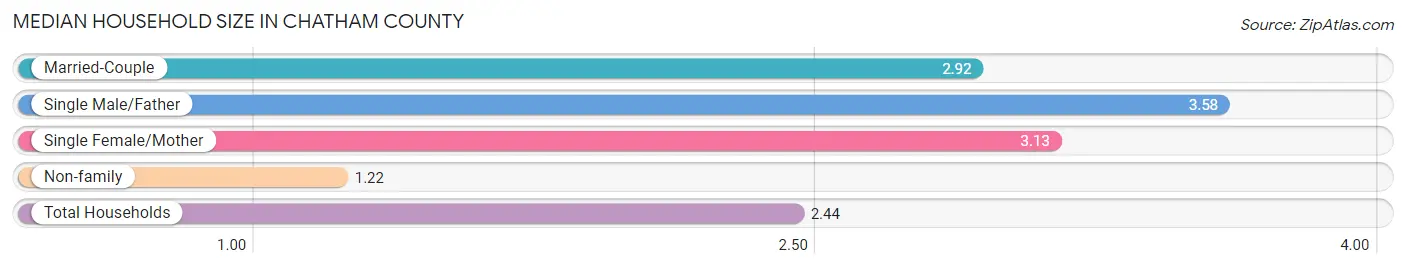
Median Household Size in Chatham County
The median household size in Chatham County is 2.44 persons per household, with single male/father households (1,041 | 3.3%) accounting for the largest median household size of 3.58 persons per household. non-family households (9,406 | 30.2%) represent the smallest median household size with 1.22 persons per household.
| Household Type | # Households | Household Size |
| Married-Couple | 17,924 (57.6%) | 2.92 |
| Single Male/Father | 1,041 (3.3%) | 3.58 |
| Single Female/Mother | 2,760 (8.9%) | 3.13 |
| Non-family | 9,406 (30.2%) | 1.22 |
| Total Households | 31,131 (100.0%) | 2.44 |
Household Size by Marriage Status in Chatham County
Out of a total of 31,131 households in Chatham County, 21,725 (69.8%) are family households, while 9,406 (30.2%) are nonfamily households. The most numerous type of family households are 2-person households, comprising 11,444, and the most common type of nonfamily households are 1-person households, comprising 7,915.
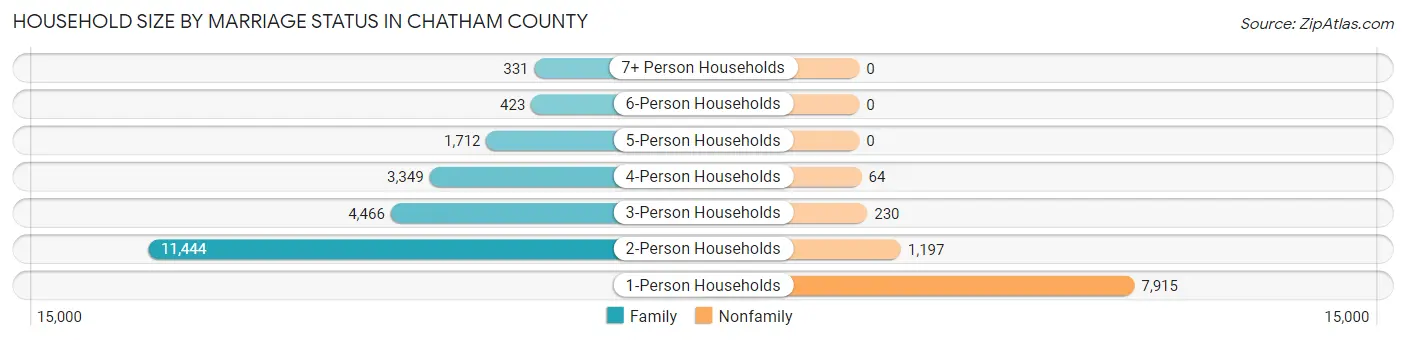
| Household Size | Family Households | Nonfamily Households |
| 1-Person Households | - | 7,915 (25.4%) |
| 2-Person Households | 11,444 (36.8%) | 1,197 (3.8%) |
| 3-Person Households | 4,466 (14.3%) | 230 (0.7%) |
| 4-Person Households | 3,349 (10.8%) | 64 (0.2%) |
| 5-Person Households | 1,712 (5.5%) | 0 (0.0%) |
| 6-Person Households | 423 (1.4%) | 0 (0.0%) |
| 7+ Person Households | 331 (1.1%) | 0 (0.0%) |
| Total | 21,725 (69.8%) | 9,406 (30.2%) |
Female Fertility in Chatham County
Fertility by Age in Chatham County
Average fertility rate in Chatham County is 53.0 births per 1,000 women. Women in the age bracket of 20 to 34 years have the highest fertility rate with 98.0 births per 1,000 women. Women in the age bracket of 20 to 34 years acount for 66.7% of all women with births.
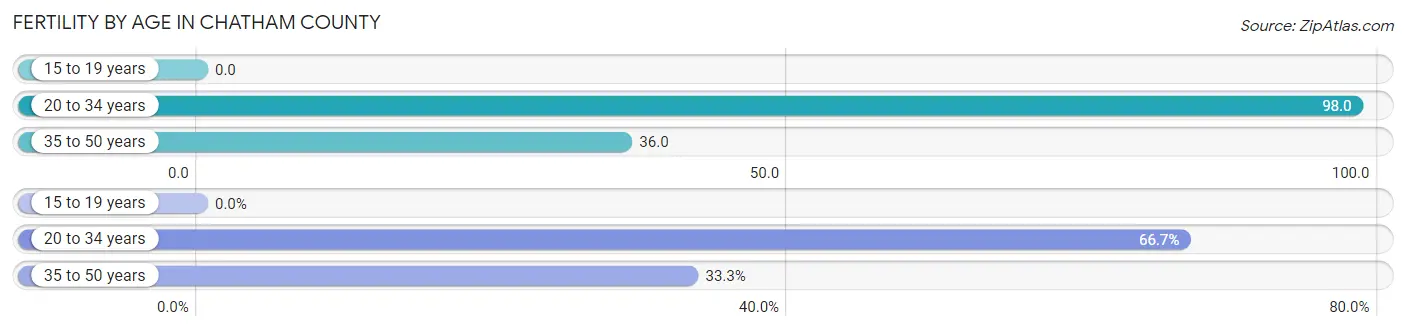
| Age Bracket | Women with Births | Births / 1,000 Women |
| 15 to 19 years | 0 (0.0%) | 0.0 |
| 20 to 34 years | 539 (66.7%) | 98.0 |
| 35 to 50 years | 269 (33.3%) | 36.0 |
| Total | 808 (100.0%) | 53.0 |
Fertility by Age by Marriage Status in Chatham County
71.7% of women with births (808) in Chatham County are married. The highest percentage of unmarried women with births falls into 20 to 34 years age bracket with 33.8% of them unmarried at the time of birth, while the lowest percentage of unmarried women with births belong to 35 to 50 years age bracket with 17.5% of them unmarried.
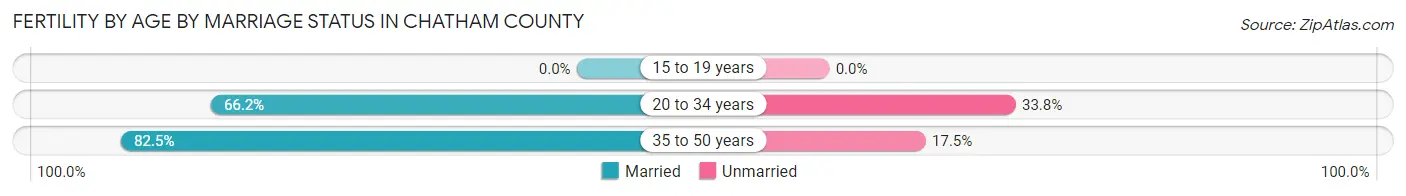
| Age Bracket | Married | Unmarried |
| 15 to 19 years | 0 (0.0%) | 0 (0.0%) |
| 20 to 34 years | 357 (66.2%) | 182 (33.8%) |
| 35 to 50 years | 222 (82.5%) | 47 (17.5%) |
| Total | 579 (71.7%) | 229 (28.3%) |
Fertility by Education in Chatham County
Average fertility rate in Chatham County is 53.0 births per 1,000 women. Women with the education attainment of college or associate's degree have the highest fertility rate of 84.0 births per 1,000 women, while women with the education attainment of less than high school have the lowest fertility at 16.0 births per 1,000 women. Women with the education attainment of college or associate's degree represent 38.9% of all women with births.
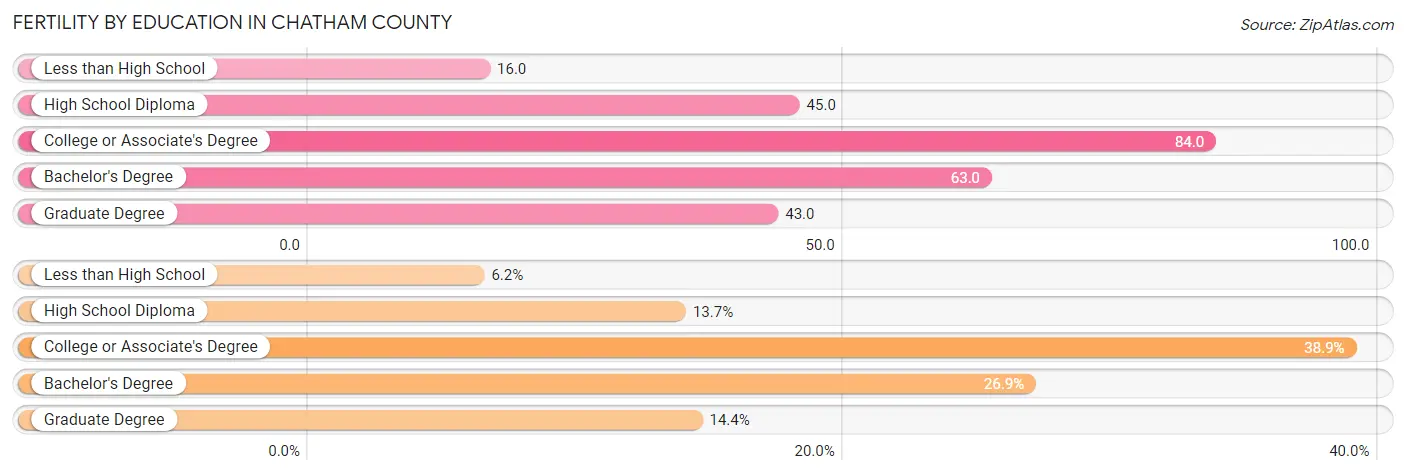
| Educational Attainment | Women with Births | Births / 1,000 Women |
| Less than High School | 50 (6.2%) | 16.0 |
| High School Diploma | 111 (13.7%) | 45.0 |
| College or Associate's Degree | 314 (38.9%) | 84.0 |
| Bachelor's Degree | 217 (26.9%) | 63.0 |
| Graduate Degree | 116 (14.4%) | 43.0 |
| Total | 808 (100.0%) | 53.0 |
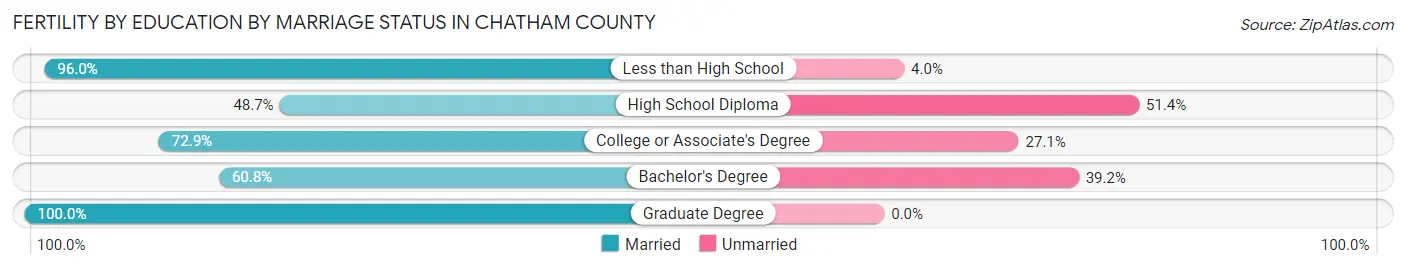
Fertility by Education by Marriage Status in Chatham County
28.3% of women with births in Chatham County are unmarried. Women with the educational attainment of graduate degree are most likely to be married with 100.0% of them married at childbirth, while women with the educational attainment of high school diploma are least likely to be married with 51.3% of them unmarried at childbirth.
| Educational Attainment | Married | Unmarried |
| Less than High School | 48 (96.0%) | 2 (4.0%) |
| High School Diploma | 54 (48.6%) | 57 (51.3%) |
| College or Associate's Degree | 229 (72.9%) | 85 (27.1%) |
| Bachelor's Degree | 132 (60.8%) | 85 (39.2%) |
| Graduate Degree | 116 (100.0%) | 0 (0.0%) |
| Total | 579 (71.7%) | 229 (28.3%) |
Employment Characteristics in Chatham County
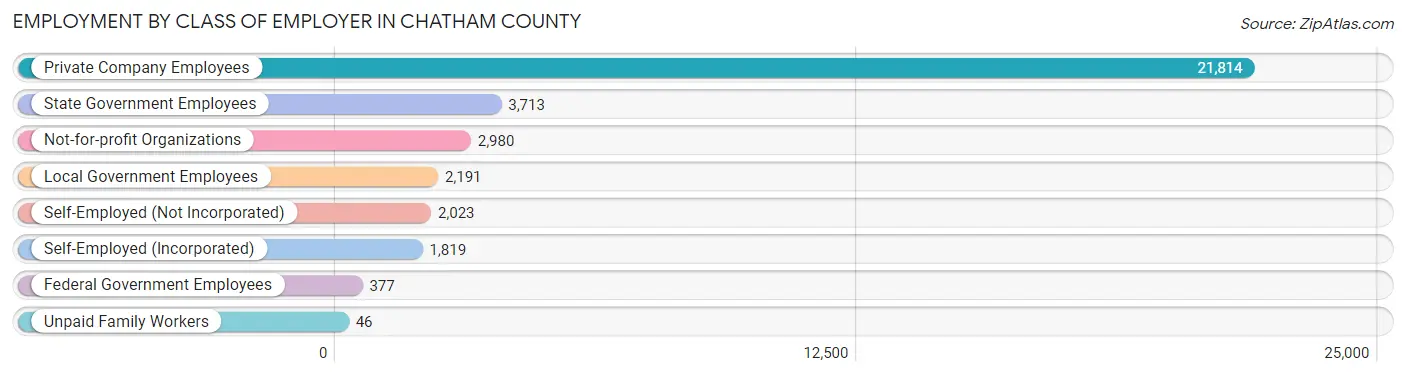
Employment by Class of Employer in Chatham County
Among the 34,963 employed individuals in Chatham County, private company employees (21,814 | 62.4%), state government employees (3,713 | 10.6%), and not-for-profit organizations (2,980 | 8.5%) make up the most common classes of employment.
| Employer Class | # Employees | % Employees |
| Private Company Employees | 21,814 | 62.4% |
| Self-Employed (Incorporated) | 1,819 | 5.2% |
| Self-Employed (Not Incorporated) | 2,023 | 5.8% |
| Not-for-profit Organizations | 2,980 | 8.5% |
| Local Government Employees | 2,191 | 6.3% |
| State Government Employees | 3,713 | 10.6% |
| Federal Government Employees | 377 | 1.1% |
| Unpaid Family Workers | 46 | 0.1% |
| Total | 34,963 | 100.0% |
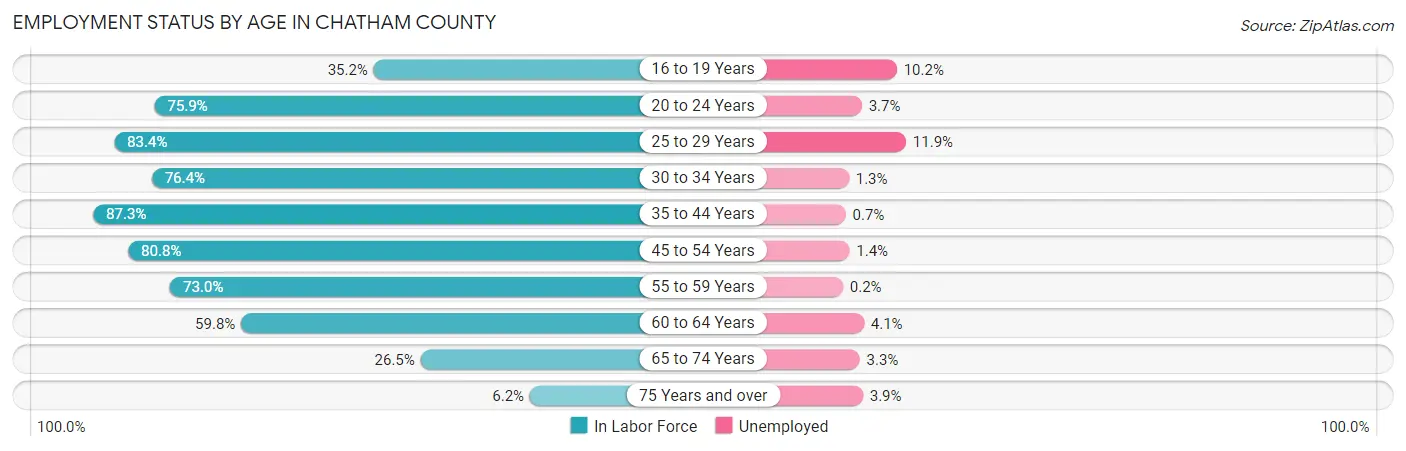
Employment Status by Age in Chatham County
According to the labor force statistics for Chatham County, out of the total population over 16 years of age (63,808), 57.2% or 36,498 individuals are in the labor force, with 2.8% or 1,022 of them unemployed. The age group with the highest labor force participation rate is 35 to 44 years, with 87.3% or 7,559 individuals in the labor force. Within the labor force, the 25 to 29 years age range has the highest percentage of unemployed individuals, with 11.9% or 296 of them being unemployed.
| Age Bracket | In Labor Force | Unemployed |
| 16 to 19 Years | 1,235 (35.2%) | 126 (10.2%) |
| 20 to 24 Years | 2,701 (75.9%) | 100 (3.7%) |
| 25 to 29 Years | 2,489 (83.4%) | 296 (11.9%) |
| 30 to 34 Years | 3,103 (76.4%) | 40 (1.3%) |
| 35 to 44 Years | 7,559 (87.3%) | 53 (0.7%) |
| 45 to 54 Years | 8,339 (80.8%) | 117 (1.4%) |
| 55 to 59 Years | 3,897 (73.0%) | 8 (0.2%) |
| 60 to 64 Years | 3,798 (59.8%) | 156 (4.1%) |
| 65 to 74 Years | 2,873 (26.5%) | 95 (3.3%) |
| 75 Years and over | 507 (6.2%) | 20 (3.9%) |
| Total | 36,498 (57.2%) | 1,022 (2.8%) |
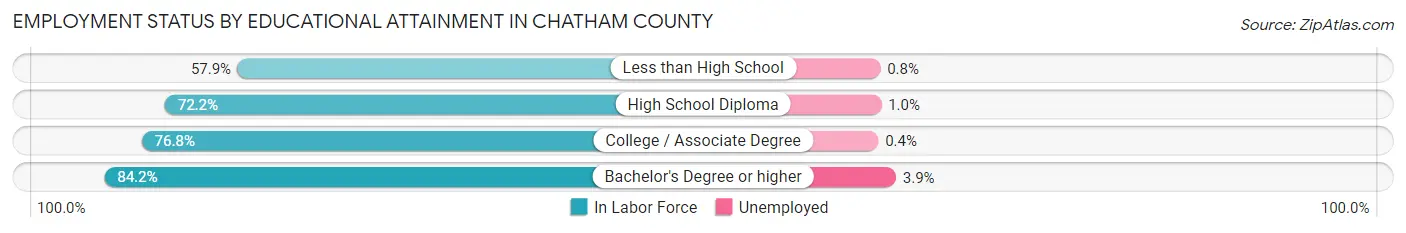
Employment Status by Educational Attainment in Chatham County
According to labor force statistics for Chatham County, 77.4% of individuals (29,192) out of the total population between 25 and 64 years of age (37,716) are in the labor force, with 2.3% or 671 of them being unemployed. The group with the highest labor force participation rate are those with the educational attainment of bachelor's degree or higher, with 84.2% or 14,657 individuals in the labor force. Within the labor force, individuals with bachelor's degree or higher education have the highest percentage of unemployment, with 3.9% or 572 of them being unemployed.
| Educational Attainment | In Labor Force | Unemployed |
| Less than High School | 2,387 (57.9%) | 33 (0.8%) |
| High School Diploma | 4,483 (72.2%) | 62 (1.0%) |
| College / Associate Degree | 7,663 (76.8%) | 40 (0.4%) |
| Bachelor's Degree or higher | 14,657 (84.2%) | 679 (3.9%) |
| Total | 29,192 (77.4%) | 867 (2.3%) |
Employment Occupations by Sex in Chatham County
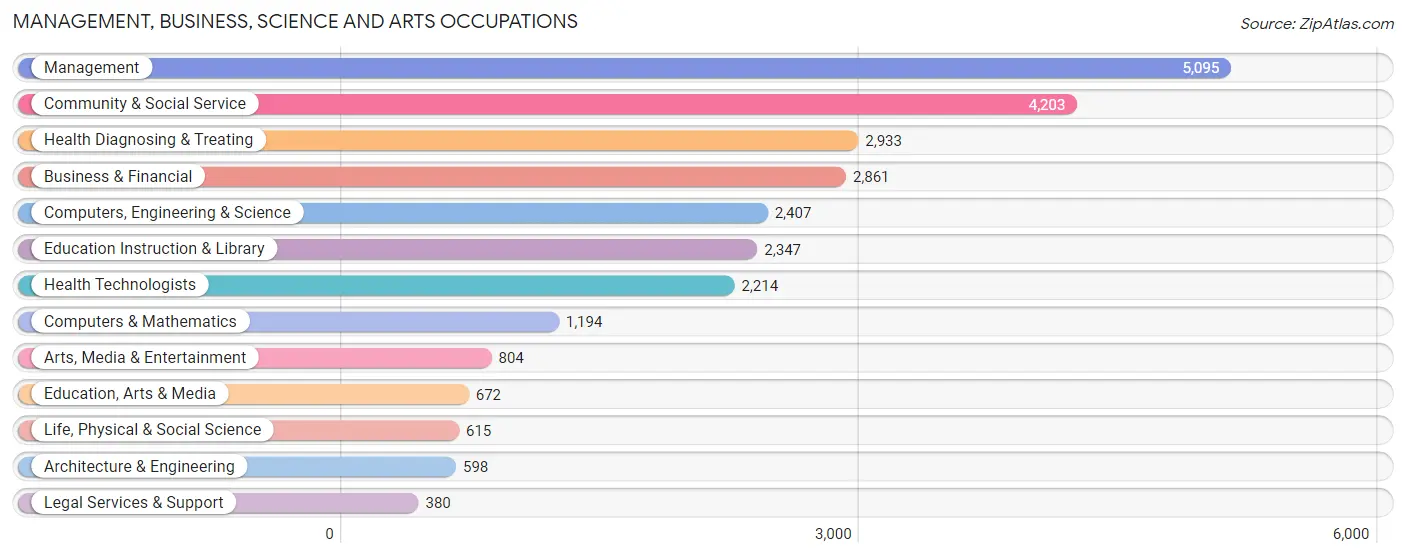
Management, Business, Science and Arts Occupations
The most common Management, Business, Science and Arts occupations in Chatham County are Management (5,095 | 14.4%), Community & Social Service (4,203 | 11.8%), Health Diagnosing & Treating (2,933 | 8.3%), Business & Financial (2,861 | 8.1%), and Computers, Engineering & Science (2,407 | 6.8%).
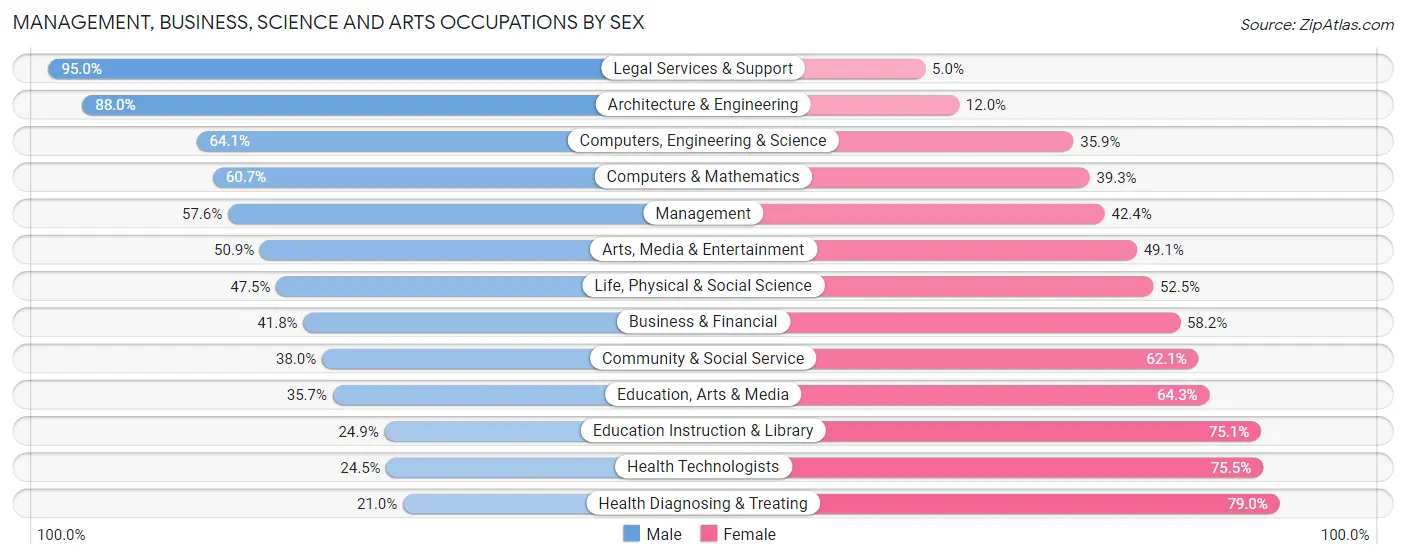
Management, Business, Science and Arts Occupations by Sex
Within the Management, Business, Science and Arts occupations in Chatham County, the most male-oriented occupations are Legal Services & Support (95.0%), Architecture & Engineering (88.0%), and Computers, Engineering & Science (64.1%), while the most female-oriented occupations are Health Diagnosing & Treating (79.0%), Health Technologists (75.5%), and Education Instruction & Library (75.1%).
| Occupation | Male | Female |
| Management | 2,933 (57.6%) | 2,162 (42.4%) |
| Business & Financial | 1,197 (41.8%) | 1,664 (58.2%) |
| Computers, Engineering & Science | 1,543 (64.1%) | 864 (35.9%) |
| Computers & Mathematics | 725 (60.7%) | 469 (39.3%) |
| Architecture & Engineering | 526 (88.0%) | 72 (12.0%) |
| Life, Physical & Social Science | 292 (47.5%) | 323 (52.5%) |
| Community & Social Service | 1,595 (38.0%) | 2,608 (62.1%) |
| Education, Arts & Media | 240 (35.7%) | 432 (64.3%) |
| Legal Services & Support | 361 (95.0%) | 19 (5.0%) |
| Education Instruction & Library | 585 (24.9%) | 1,762 (75.1%) |
| Arts, Media & Entertainment | 409 (50.9%) | 395 (49.1%) |
| Health Diagnosing & Treating | 617 (21.0%) | 2,316 (79.0%) |
| Health Technologists | 543 (24.5%) | 1,671 (75.5%) |
| Total (Category) | 7,885 (45.1%) | 9,614 (54.9%) |
| Total (Overall) | 18,586 (52.4%) | 16,872 (47.6%) |
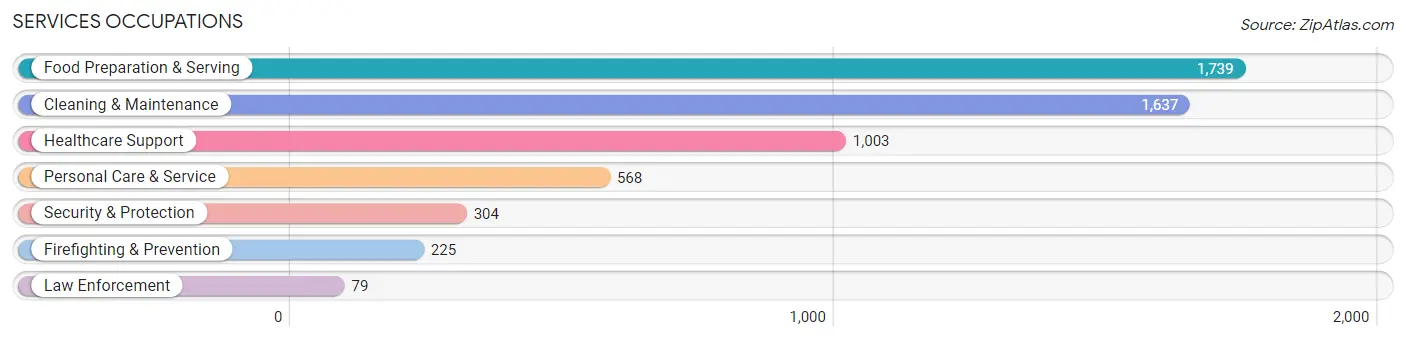
Services Occupations
The most common Services occupations in Chatham County are Food Preparation & Serving (1,739 | 4.9%), Cleaning & Maintenance (1,637 | 4.6%), Healthcare Support (1,003 | 2.8%), Personal Care & Service (568 | 1.6%), and Security & Protection (304 | 0.9%).
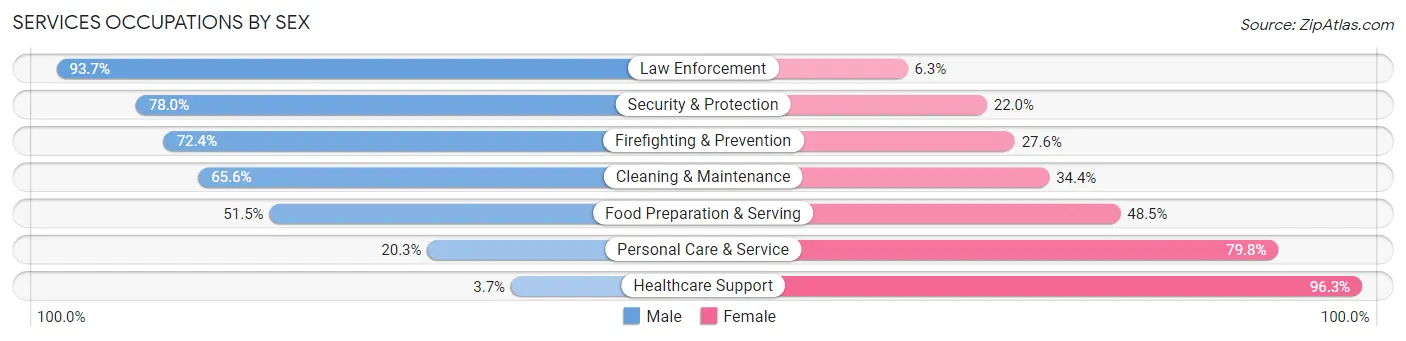
Services Occupations by Sex
Within the Services occupations in Chatham County, the most male-oriented occupations are Law Enforcement (93.7%), Security & Protection (78.0%), and Firefighting & Prevention (72.4%), while the most female-oriented occupations are Healthcare Support (96.3%), Personal Care & Service (79.7%), and Food Preparation & Serving (48.5%).
| Occupation | Male | Female |
| Healthcare Support | 37 (3.7%) | 966 (96.3%) |
| Security & Protection | 237 (78.0%) | 67 (22.0%) |
| Firefighting & Prevention | 163 (72.4%) | 62 (27.6%) |
| Law Enforcement | 74 (93.7%) | 5 (6.3%) |
| Food Preparation & Serving | 896 (51.5%) | 843 (48.5%) |
| Cleaning & Maintenance | 1,074 (65.6%) | 563 (34.4%) |
| Personal Care & Service | 115 (20.3%) | 453 (79.7%) |
| Total (Category) | 2,359 (44.9%) | 2,892 (55.1%) |
| Total (Overall) | 18,586 (52.4%) | 16,872 (47.6%) |
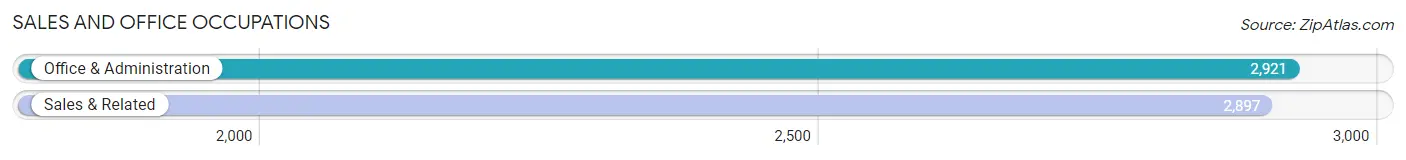
Sales and Office Occupations
The most common Sales and Office occupations in Chatham County are Office & Administration (2,921 | 8.2%), and Sales & Related (2,897 | 8.2%).
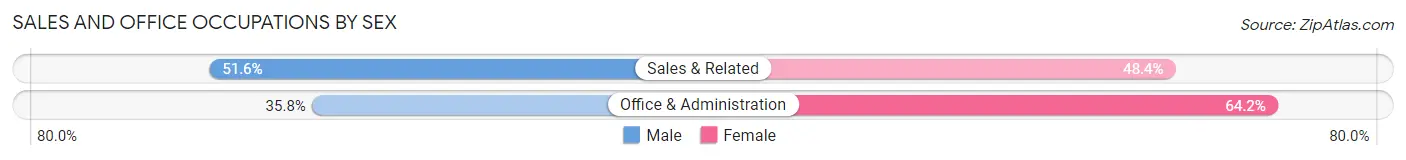
Sales and Office Occupations by Sex
| Occupation | Male | Female |
| Sales & Related | 1,494 (51.6%) | 1,403 (48.4%) |
| Office & Administration | 1,047 (35.8%) | 1,874 (64.2%) |
| Total (Category) | 2,541 (43.7%) | 3,277 (56.3%) |
| Total (Overall) | 18,586 (52.4%) | 16,872 (47.6%) |
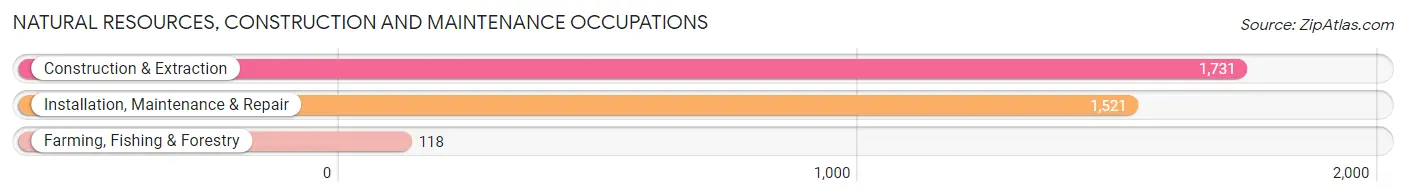
Natural Resources, Construction and Maintenance Occupations
The most common Natural Resources, Construction and Maintenance occupations in Chatham County are Construction & Extraction (1,731 | 4.9%), Installation, Maintenance & Repair (1,521 | 4.3%), and Farming, Fishing & Forestry (118 | 0.3%).
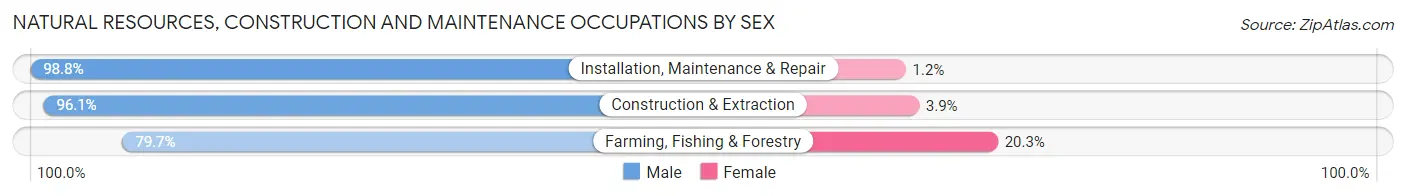
Natural Resources, Construction and Maintenance Occupations by Sex
| Occupation | Male | Female |
| Farming, Fishing & Forestry | 94 (79.7%) | 24 (20.3%) |
| Construction & Extraction | 1,663 (96.1%) | 68 (3.9%) |
| Installation, Maintenance & Repair | 1,503 (98.8%) | 18 (1.2%) |
| Total (Category) | 3,260 (96.7%) | 110 (3.3%) |
| Total (Overall) | 18,586 (52.4%) | 16,872 (47.6%) |
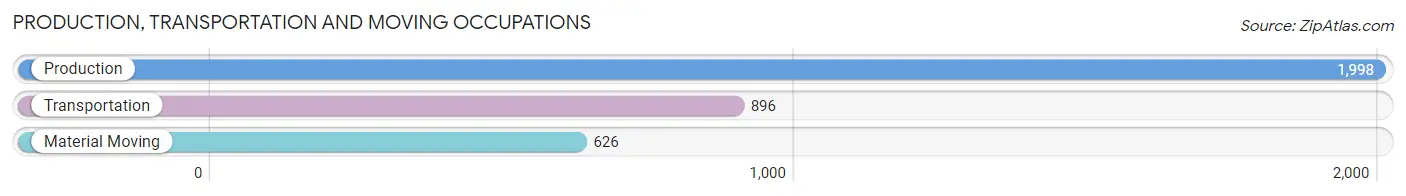
Production, Transportation and Moving Occupations
The most common Production, Transportation and Moving occupations in Chatham County are Production (1,998 | 5.6%), Transportation (896 | 2.5%), and Material Moving (626 | 1.8%).
Production, Transportation and Moving Occupations by Sex
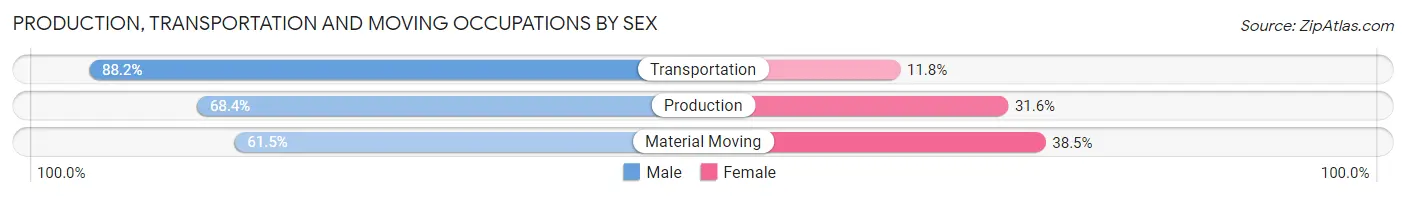
| Occupation | Male | Female |
| Production | 1,366 (68.4%) | 632 (31.6%) |
| Transportation | 790 (88.2%) | 106 (11.8%) |
| Material Moving | 385 (61.5%) | 241 (38.5%) |
| Total (Category) | 2,541 (72.2%) | 979 (27.8%) |
| Total (Overall) | 18,586 (52.4%) | 16,872 (47.6%) |
Employment Industries by Sex in Chatham County
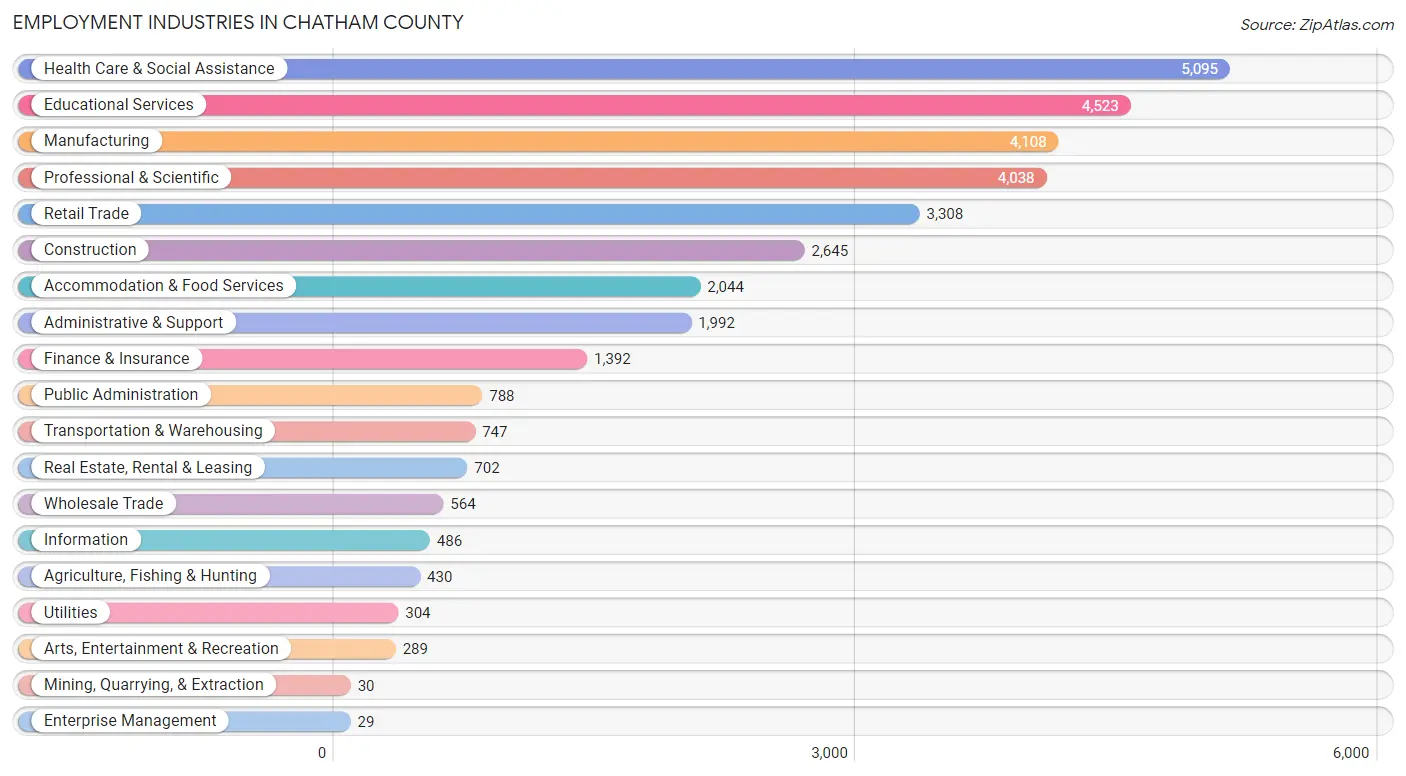
Employment Industries in Chatham County
The major employment industries in Chatham County include Health Care & Social Assistance (5,095 | 14.4%), Educational Services (4,523 | 12.8%), Manufacturing (4,108 | 11.6%), Professional & Scientific (4,038 | 11.4%), and Retail Trade (3,308 | 9.3%).
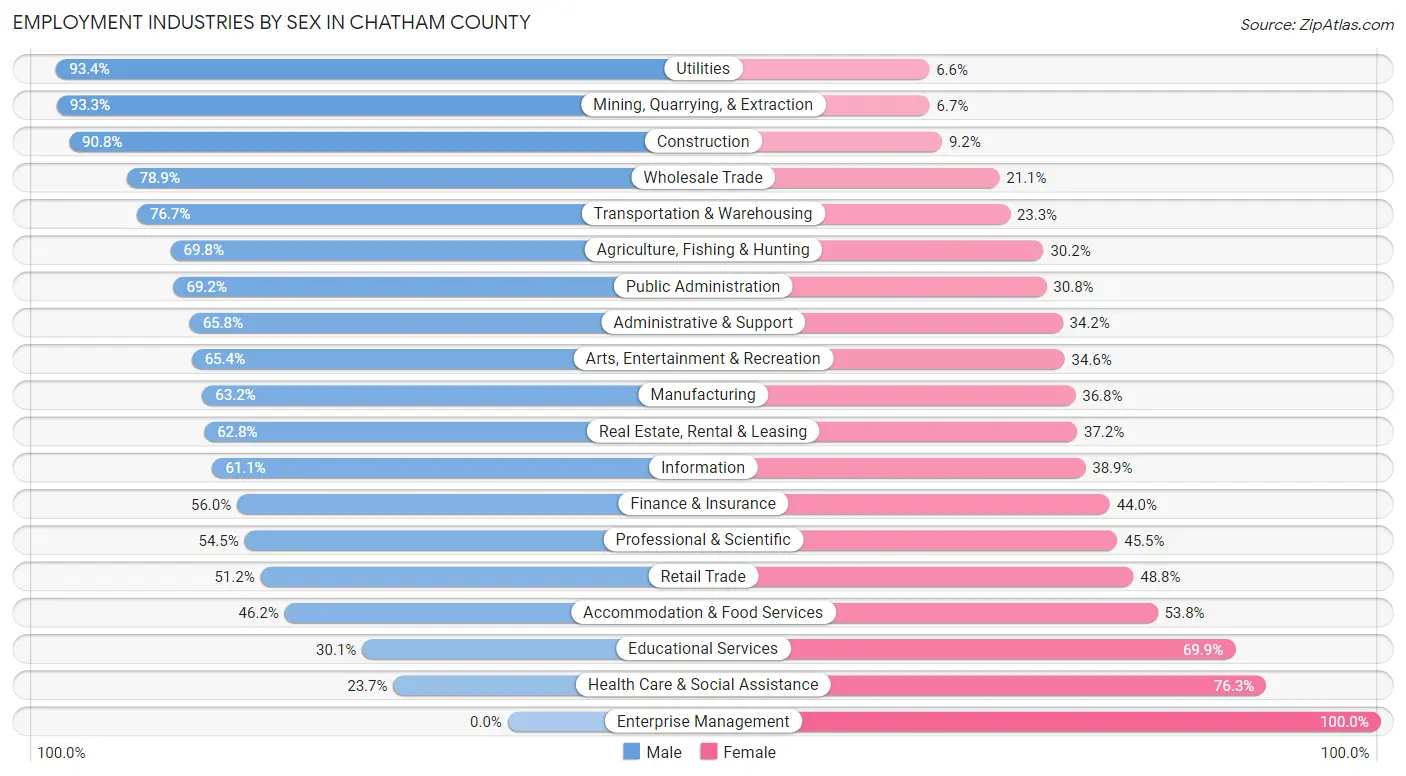
Employment Industries by Sex in Chatham County
The Chatham County industries that see more men than women are Utilities (93.4%), Mining, Quarrying, & Extraction (93.3%), and Construction (90.8%), whereas the industries that tend to have a higher number of women are Enterprise Management (100.0%), Health Care & Social Assistance (76.3%), and Educational Services (69.9%).
| Industry | Male | Female |
| Agriculture, Fishing & Hunting | 300 (69.8%) | 130 (30.2%) |
| Mining, Quarrying, & Extraction | 28 (93.3%) | 2 (6.7%) |
| Construction | 2,401 (90.8%) | 244 (9.2%) |
| Manufacturing | 2,596 (63.2%) | 1,512 (36.8%) |
| Wholesale Trade | 445 (78.9%) | 119 (21.1%) |
| Retail Trade | 1,693 (51.2%) | 1,615 (48.8%) |
| Transportation & Warehousing | 573 (76.7%) | 174 (23.3%) |
| Utilities | 284 (93.4%) | 20 (6.6%) |
| Information | 297 (61.1%) | 189 (38.9%) |
| Finance & Insurance | 780 (56.0%) | 612 (44.0%) |
| Real Estate, Rental & Leasing | 441 (62.8%) | 261 (37.2%) |
| Professional & Scientific | 2,200 (54.5%) | 1,838 (45.5%) |
| Enterprise Management | 0 (0.0%) | 29 (100.0%) |
| Administrative & Support | 1,311 (65.8%) | 681 (34.2%) |
| Educational Services | 1,363 (30.1%) | 3,160 (69.9%) |
| Health Care & Social Assistance | 1,207 (23.7%) | 3,888 (76.3%) |
| Arts, Entertainment & Recreation | 189 (65.4%) | 100 (34.6%) |
| Accommodation & Food Services | 944 (46.2%) | 1,100 (53.8%) |
| Public Administration | 545 (69.2%) | 243 (30.8%) |
| Total | 18,586 (52.4%) | 16,872 (47.6%) |
Education in Chatham County
School Enrollment in Chatham County
The most common levels of schooling among the 15,326 students in Chatham County are high school (4,290 | 28.0%), middle school (3,538 | 23.1%), and elementary school (3,050 | 19.9%).
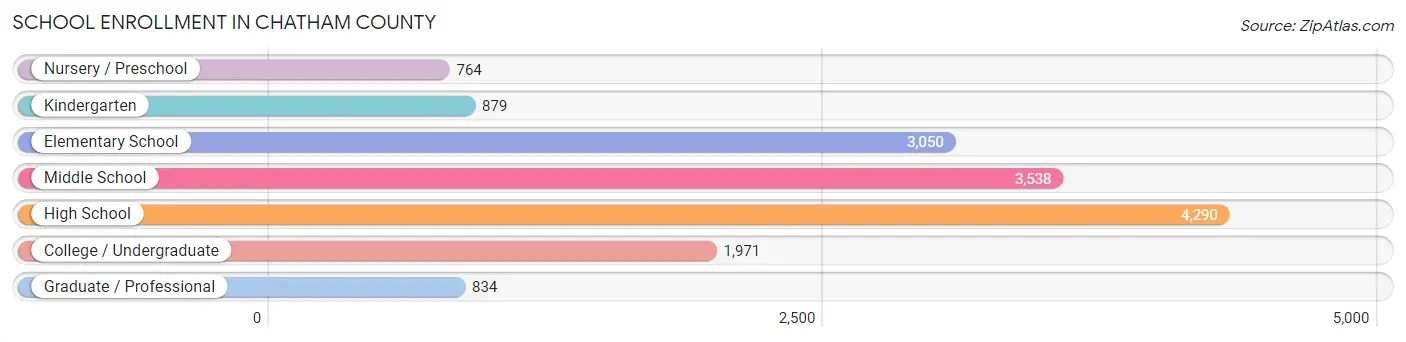
| School Level | # Students | % Students |
| Nursery / Preschool | 764 | 5.0% |
| Kindergarten | 879 | 5.7% |
| Elementary School | 3,050 | 19.9% |
| Middle School | 3,538 | 23.1% |
| High School | 4,290 | 28.0% |
| College / Undergraduate | 1,971 | 12.9% |
| Graduate / Professional | 834 | 5.4% |
| Total | 15,326 | 100.0% |
School Enrollment by Age by Funding Source in Chatham County
Out of a total of 15,326 students who are enrolled in schools in Chatham County, 2,805 (18.3%) attend a private institution, while the remaining 12,521 (81.7%) are enrolled in public schools. The age group of 3 to 4 year olds has the highest likelihood of being enrolled in private schools, with 398 (60.2% in the age bracket) enrolled. Conversely, the age group of 15 to 17 year olds has the lowest likelihood of being enrolled in a private school, with 2,834 (94.9% in the age bracket) attending a public institution.
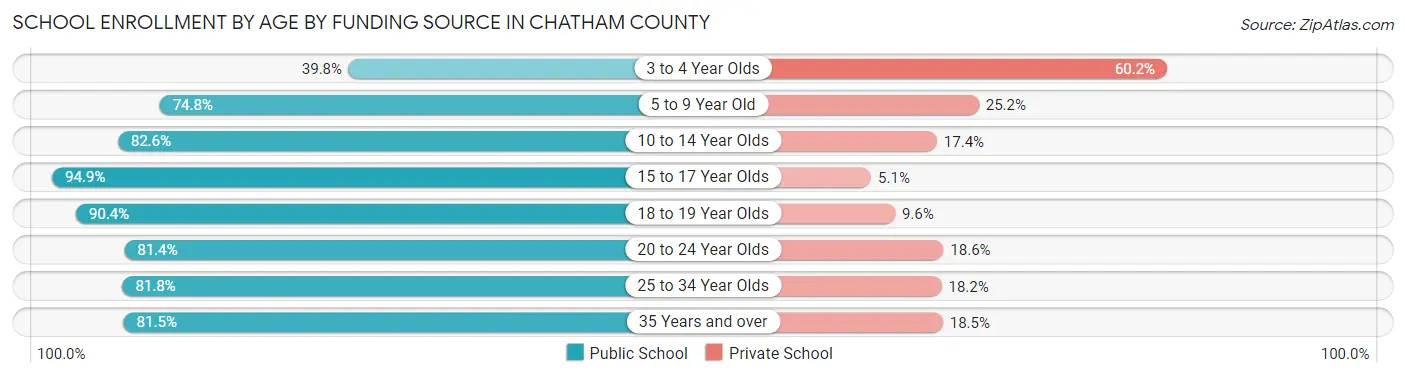
| Age Bracket | Public School | Private School |
| 3 to 4 Year Olds | 263 (39.8%) | 398 (60.2%) |
| 5 to 9 Year Old | 2,688 (74.8%) | 904 (25.2%) |
| 10 to 14 Year Olds | 3,873 (82.6%) | 814 (17.4%) |
| 15 to 17 Year Olds | 2,834 (94.9%) | 153 (5.1%) |
| 18 to 19 Year Olds | 918 (90.4%) | 97 (9.6%) |
| 20 to 24 Year Olds | 916 (81.4%) | 209 (18.6%) |
| 25 to 34 Year Olds | 489 (81.8%) | 109 (18.2%) |
| 35 Years and over | 539 (81.5%) | 122 (18.5%) |
| Total | 12,521 (81.7%) | 2,805 (18.3%) |
Educational Attainment by Field of Study in Chatham County
Business (4,819 | 16.9%), science & technology (3,326 | 11.7%), education (2,799 | 9.8%), social sciences (2,502 | 8.8%), and bio, nature & agricultural (2,219 | 7.8%) are the most common fields of study among 28,534 individuals in Chatham County who have obtained a bachelor's degree or higher.
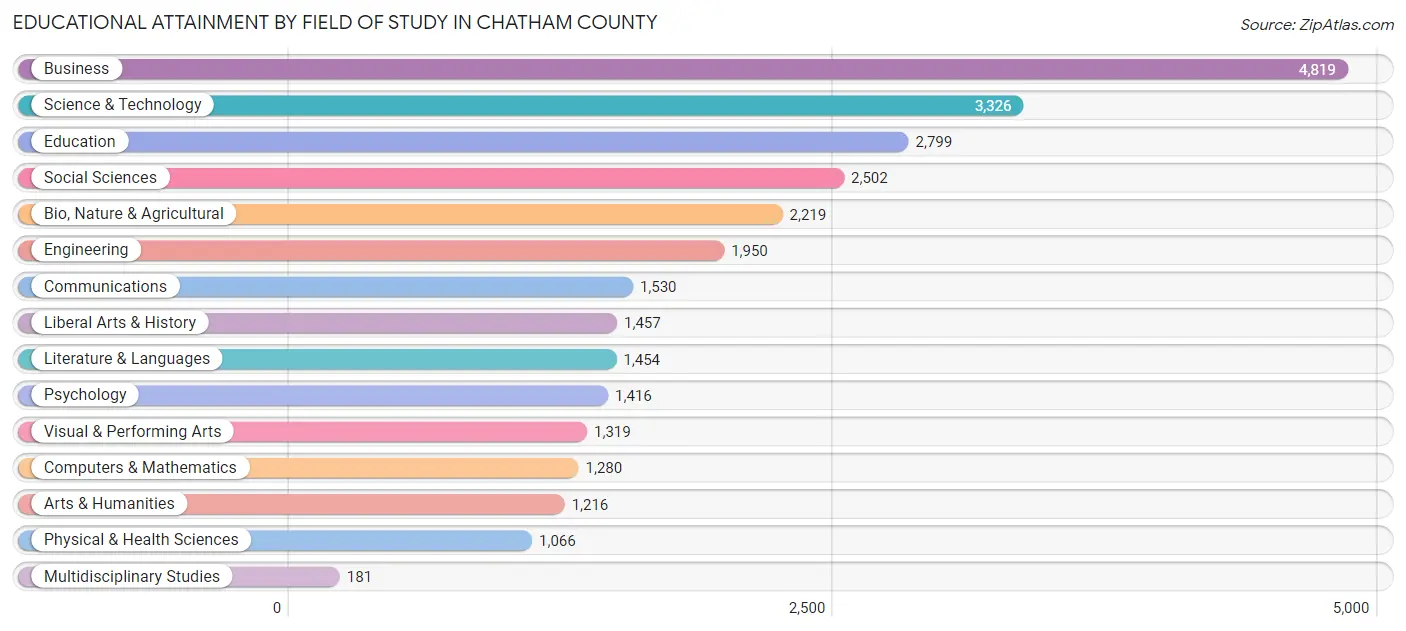
| Field of Study | # Graduates | % Graduates |
| Computers & Mathematics | 1,280 | 4.5% |
| Bio, Nature & Agricultural | 2,219 | 7.8% |
| Physical & Health Sciences | 1,066 | 3.7% |
| Psychology | 1,416 | 5.0% |
| Social Sciences | 2,502 | 8.8% |
| Engineering | 1,950 | 6.8% |
| Multidisciplinary Studies | 181 | 0.6% |
| Science & Technology | 3,326 | 11.7% |
| Business | 4,819 | 16.9% |
| Education | 2,799 | 9.8% |
| Literature & Languages | 1,454 | 5.1% |
| Liberal Arts & History | 1,457 | 5.1% |
| Visual & Performing Arts | 1,319 | 4.6% |
| Communications | 1,530 | 5.4% |
| Arts & Humanities | 1,216 | 4.3% |
| Total | 28,534 | 100.0% |
Transportation & Commute in Chatham County
Vehicle Availability by Sex in Chatham County
The most prevalent vehicle ownership categories in Chatham County are males with 2 vehicles (8,223, accounting for 44.6%) and females with 2 vehicles (6,847, making up 49.7%).
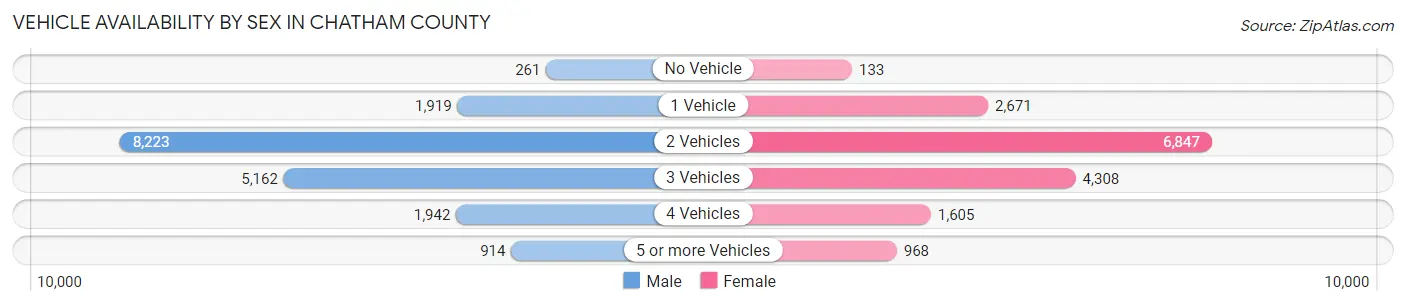
| Vehicles Available | Male | Female |
| No Vehicle | 261 (1.4%) | 133 (0.8%) |
| 1 Vehicle | 1,919 (10.4%) | 2,671 (16.2%) |
| 2 Vehicles | 8,223 (44.6%) | 6,847 (41.4%) |
| 3 Vehicles | 5,162 (28.0%) | 4,308 (26.1%) |
| 4 Vehicles | 1,942 (10.5%) | 1,605 (9.7%) |
| 5 or more Vehicles | 914 (5.0%) | 968 (5.9%) |
| Total | 18,421 (100.0%) | 16,532 (100.0%) |
Commute Time in Chatham County
The most frequently occuring commute durations in Chatham County are 20 to 24 minutes (4,569 commuters, 15.9%), 30 to 34 minutes (3,848 commuters, 13.4%), and 15 to 19 minutes (3,255 commuters, 11.3%).
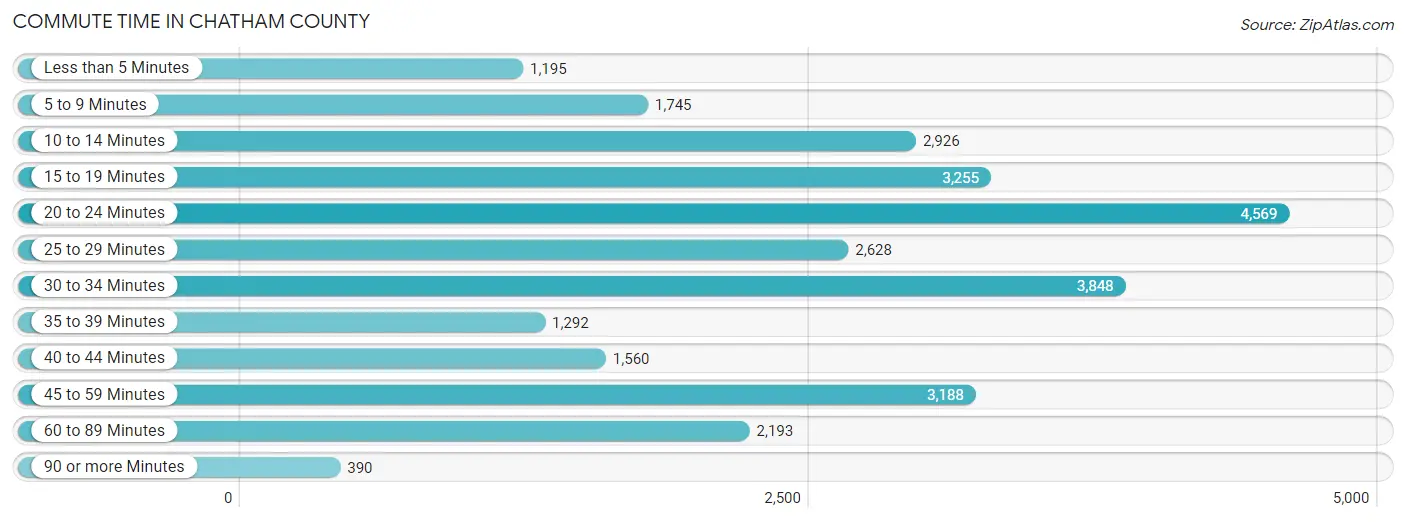
| Commute Time | # Commuters | % Commuters |
| Less than 5 Minutes | 1,195 | 4.2% |
| 5 to 9 Minutes | 1,745 | 6.1% |
| 10 to 14 Minutes | 2,926 | 10.2% |
| 15 to 19 Minutes | 3,255 | 11.3% |
| 20 to 24 Minutes | 4,569 | 15.9% |
| 25 to 29 Minutes | 2,628 | 9.1% |
| 30 to 34 Minutes | 3,848 | 13.4% |
| 35 to 39 Minutes | 1,292 | 4.5% |
| 40 to 44 Minutes | 1,560 | 5.4% |
| 45 to 59 Minutes | 3,188 | 11.1% |
| 60 to 89 Minutes | 2,193 | 7.6% |
| 90 or more Minutes | 390 | 1.3% |
Commute Time by Sex in Chatham County
The most common commute times in Chatham County are 20 to 24 minutes (2,432 commuters, 15.9%) for males and 20 to 24 minutes (2,137 commuters, 15.9%) for females.
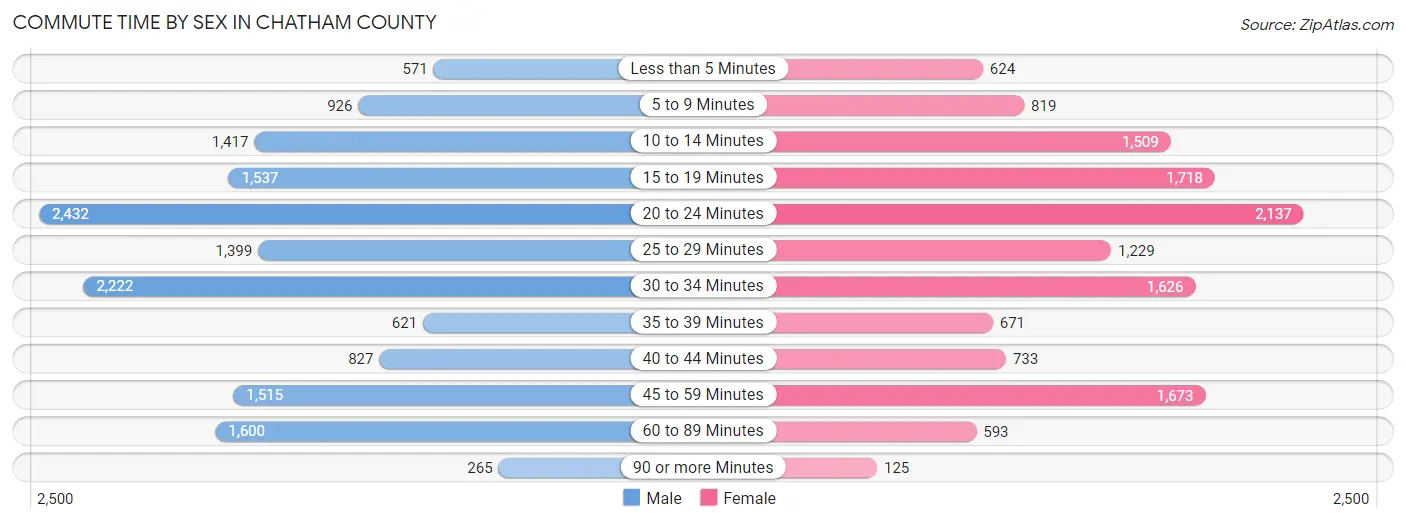
| Commute Time | Male | Female |
| Less than 5 Minutes | 571 (3.7%) | 624 (4.6%) |
| 5 to 9 Minutes | 926 (6.0%) | 819 (6.1%) |
| 10 to 14 Minutes | 1,417 (9.2%) | 1,509 (11.2%) |
| 15 to 19 Minutes | 1,537 (10.0%) | 1,718 (12.8%) |
| 20 to 24 Minutes | 2,432 (15.9%) | 2,137 (15.9%) |
| 25 to 29 Minutes | 1,399 (9.1%) | 1,229 (9.1%) |
| 30 to 34 Minutes | 2,222 (14.5%) | 1,626 (12.1%) |
| 35 to 39 Minutes | 621 (4.1%) | 671 (5.0%) |
| 40 to 44 Minutes | 827 (5.4%) | 733 (5.4%) |
| 45 to 59 Minutes | 1,515 (9.9%) | 1,673 (12.4%) |
| 60 to 89 Minutes | 1,600 (10.4%) | 593 (4.4%) |
| 90 or more Minutes | 265 (1.7%) | 125 (0.9%) |
Time of Departure to Work by Sex in Chatham County
The most frequent times of departure to work in Chatham County are 7:00 AM to 7:29 AM (2,809, 18.3%) for males and 7:00 AM to 7:29 AM (2,607, 19.4%) for females.
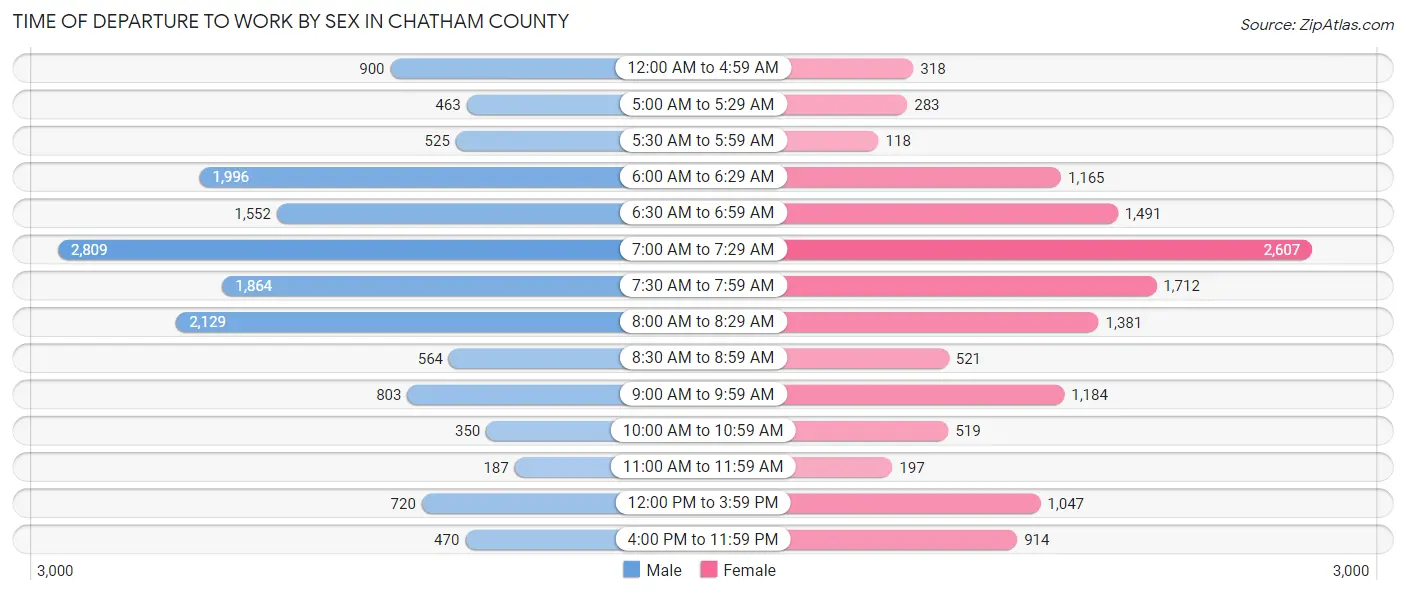
| Time of Departure | Male | Female |
| 12:00 AM to 4:59 AM | 900 (5.9%) | 318 (2.4%) |
| 5:00 AM to 5:29 AM | 463 (3.0%) | 283 (2.1%) |
| 5:30 AM to 5:59 AM | 525 (3.4%) | 118 (0.9%) |
| 6:00 AM to 6:29 AM | 1,996 (13.0%) | 1,165 (8.7%) |
| 6:30 AM to 6:59 AM | 1,552 (10.1%) | 1,491 (11.1%) |
| 7:00 AM to 7:29 AM | 2,809 (18.3%) | 2,607 (19.4%) |
| 7:30 AM to 7:59 AM | 1,864 (12.2%) | 1,712 (12.7%) |
| 8:00 AM to 8:29 AM | 2,129 (13.9%) | 1,381 (10.3%) |
| 8:30 AM to 8:59 AM | 564 (3.7%) | 521 (3.9%) |
| 9:00 AM to 9:59 AM | 803 (5.2%) | 1,184 (8.8%) |
| 10:00 AM to 10:59 AM | 350 (2.3%) | 519 (3.9%) |
| 11:00 AM to 11:59 AM | 187 (1.2%) | 197 (1.5%) |
| 12:00 PM to 3:59 PM | 720 (4.7%) | 1,047 (7.8%) |
| 4:00 PM to 11:59 PM | 470 (3.1%) | 914 (6.8%) |
| Total | 15,332 (100.0%) | 13,457 (100.0%) |
Housing Occupancy in Chatham County
Occupancy by Ownership in Chatham County
Of the total 31,131 dwellings in Chatham County, owner-occupied units account for 24,849 (79.8%), while renter-occupied units make up 6,282 (20.2%).
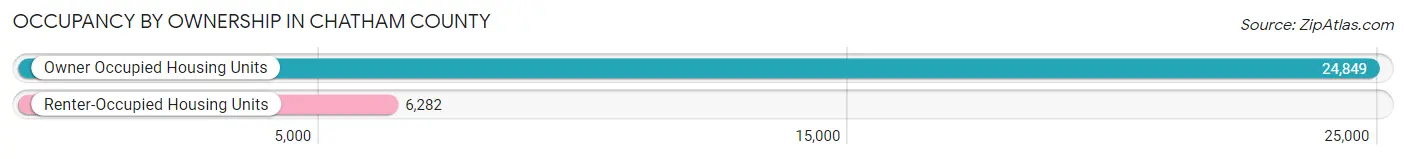
| Occupancy | # Housing Units | % Housing Units |
| Owner Occupied Housing Units | 24,849 | 79.8% |
| Renter-Occupied Housing Units | 6,282 | 20.2% |
| Total Occupied Housing Units | 31,131 | 100.0% |
Occupancy by Household Size in Chatham County
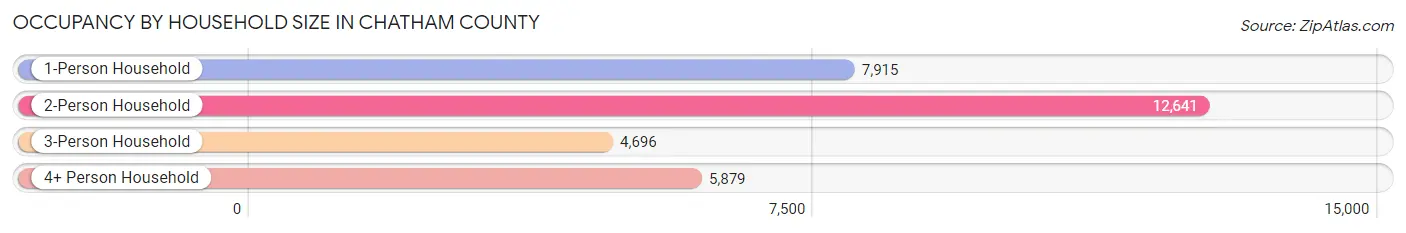
| Household Size | # Housing Units | % Housing Units |
| 1-Person Household | 7,915 | 25.4% |
| 2-Person Household | 12,641 | 40.6% |
| 3-Person Household | 4,696 | 15.1% |
| 4+ Person Household | 5,879 | 18.9% |
| Total Housing Units | 31,131 | 100.0% |
Occupancy by Ownership by Household Size in Chatham County
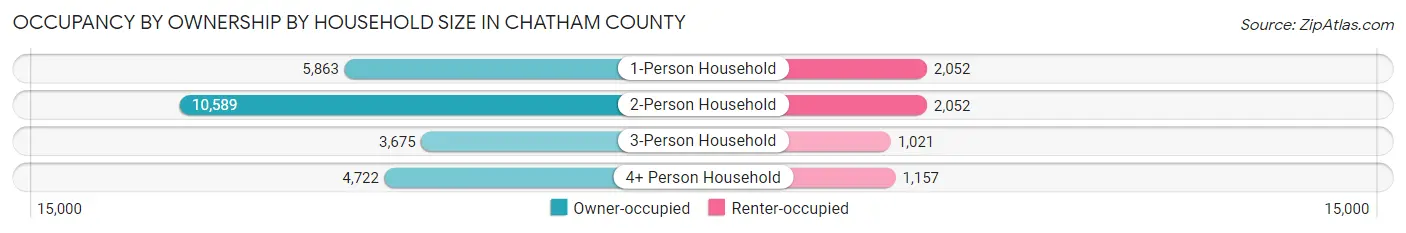
| Household Size | Owner-occupied | Renter-occupied |
| 1-Person Household | 5,863 (74.1%) | 2,052 (25.9%) |
| 2-Person Household | 10,589 (83.8%) | 2,052 (16.2%) |
| 3-Person Household | 3,675 (78.3%) | 1,021 (21.7%) |
| 4+ Person Household | 4,722 (80.3%) | 1,157 (19.7%) |
| Total Housing Units | 24,849 (79.8%) | 6,282 (20.2%) |
Occupancy by Educational Attainment in Chatham County
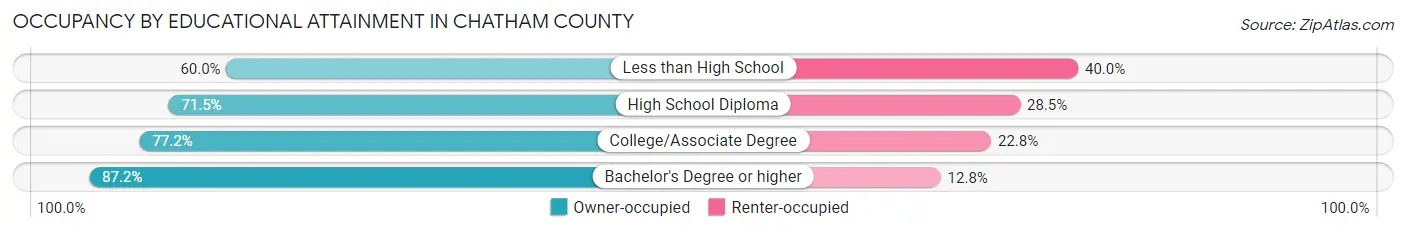
| Household Size | Owner-occupied | Renter-occupied |
| Less than High School | 1,436 (60.0%) | 958 (40.0%) |
| High School Diploma | 3,754 (71.5%) | 1,498 (28.5%) |
| College/Associate Degree | 6,355 (77.2%) | 1,875 (22.8%) |
| Bachelor's Degree or higher | 13,304 (87.2%) | 1,951 (12.8%) |
Occupancy by Age of Householder in Chatham County
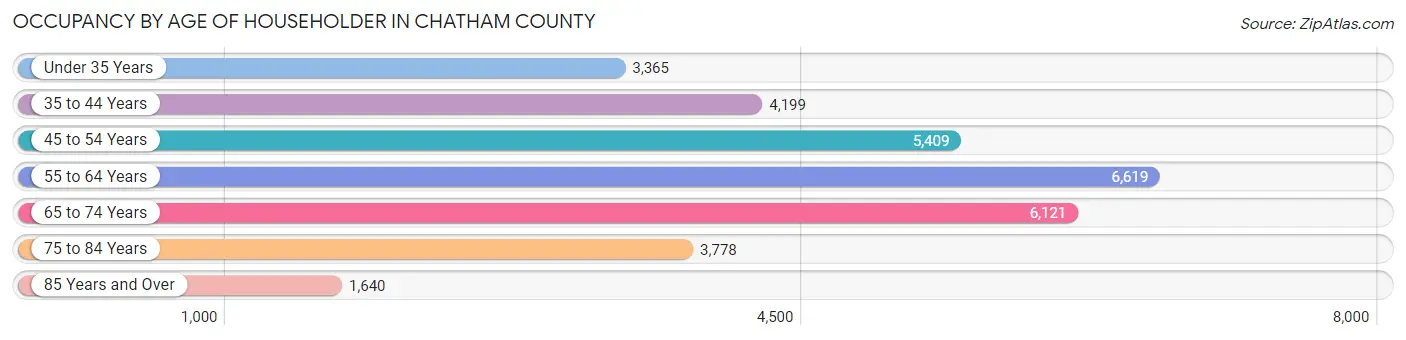
| Age Bracket | # Households | % Households |
| Under 35 Years | 3,365 | 10.8% |
| 35 to 44 Years | 4,199 | 13.5% |
| 45 to 54 Years | 5,409 | 17.4% |
| 55 to 64 Years | 6,619 | 21.3% |
| 65 to 74 Years | 6,121 | 19.7% |
| 75 to 84 Years | 3,778 | 12.1% |
| 85 Years and Over | 1,640 | 5.3% |
| Total | 31,131 | 100.0% |
Housing Finances in Chatham County
Median Income by Occupancy in Chatham County
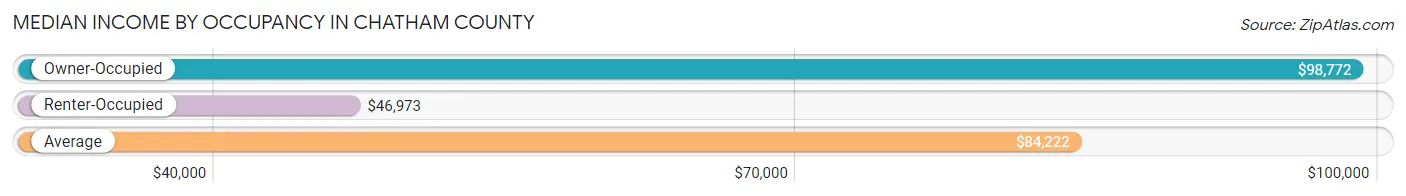
| Occupancy Type | # Households | Median Income |
| Owner-Occupied | 24,849 (79.8%) | $98,772 |
| Renter-Occupied | 6,282 (20.2%) | $46,973 |
| Average | 31,131 (100.0%) | $84,222 |
Occupancy by Householder Income Bracket in Chatham County
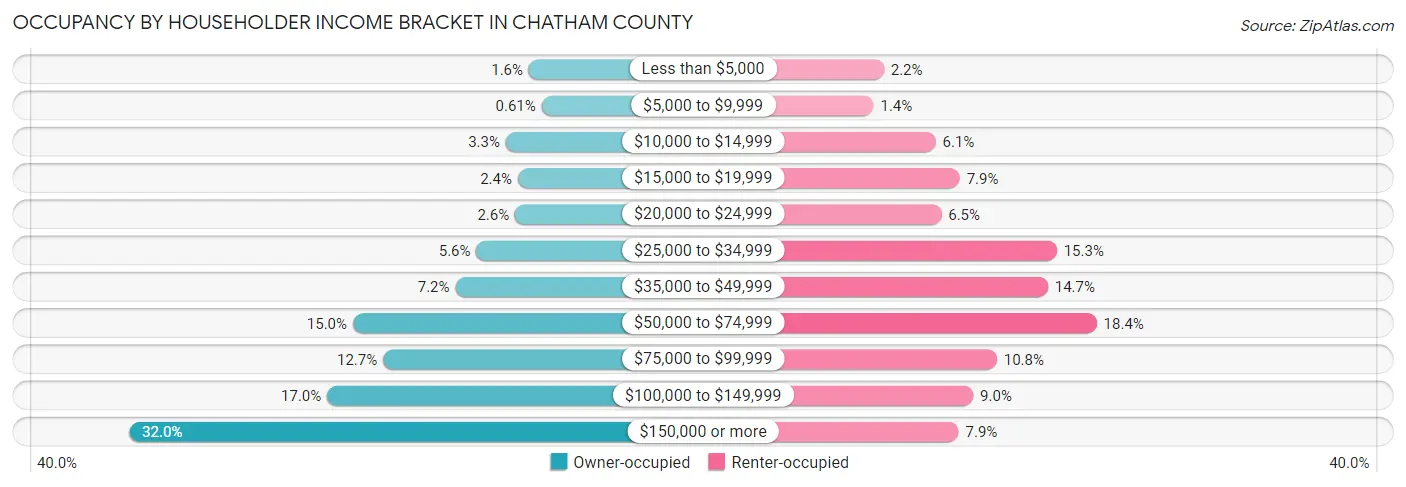
| Income Bracket | Owner-occupied | Renter-occupied |
| Less than $5,000 | 392 (1.6%) | 135 (2.1%) |
| $5,000 to $9,999 | 152 (0.6%) | 86 (1.4%) |
| $10,000 to $14,999 | 830 (3.3%) | 383 (6.1%) |
| $15,000 to $19,999 | 602 (2.4%) | 499 (7.9%) |
| $20,000 to $24,999 | 653 (2.6%) | 410 (6.5%) |
| $25,000 to $34,999 | 1,387 (5.6%) | 963 (15.3%) |
| $35,000 to $49,999 | 1,784 (7.2%) | 920 (14.6%) |
| $50,000 to $74,999 | 3,725 (15.0%) | 1,154 (18.4%) |
| $75,000 to $99,999 | 3,154 (12.7%) | 676 (10.8%) |
| $100,000 to $149,999 | 4,212 (17.0%) | 563 (9.0%) |
| $150,000 or more | 7,958 (32.0%) | 493 (7.9%) |
| Total | 24,849 (100.0%) | 6,282 (100.0%) |
Monthly Housing Cost Tiers in Chatham County
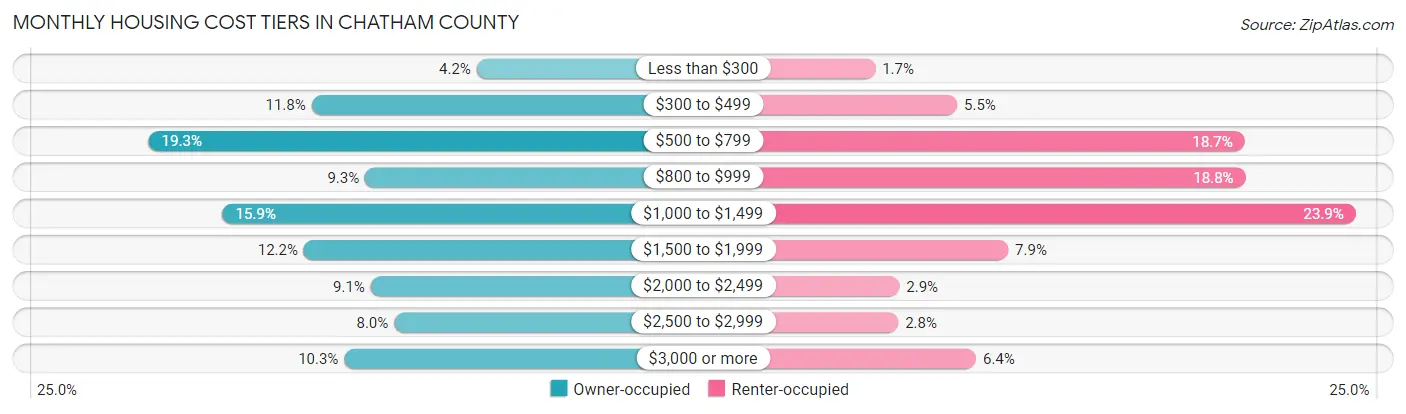
| Monthly Cost | Owner-occupied | Renter-occupied |
| Less than $300 | 1,040 (4.2%) | 109 (1.7%) |
| $300 to $499 | 2,929 (11.8%) | 346 (5.5%) |
| $500 to $799 | 4,794 (19.3%) | 1,177 (18.7%) |
| $800 to $999 | 2,319 (9.3%) | 1,180 (18.8%) |
| $1,000 to $1,499 | 3,948 (15.9%) | 1,498 (23.8%) |
| $1,500 to $1,999 | 3,020 (12.1%) | 494 (7.9%) |
| $2,000 to $2,499 | 2,255 (9.1%) | 179 (2.9%) |
| $2,500 to $2,999 | 1,986 (8.0%) | 176 (2.8%) |
| $3,000 or more | 2,558 (10.3%) | 401 (6.4%) |
| Total | 24,849 (100.0%) | 6,282 (100.0%) |
Physical Housing Characteristics in Chatham County
Housing Structures in Chatham County
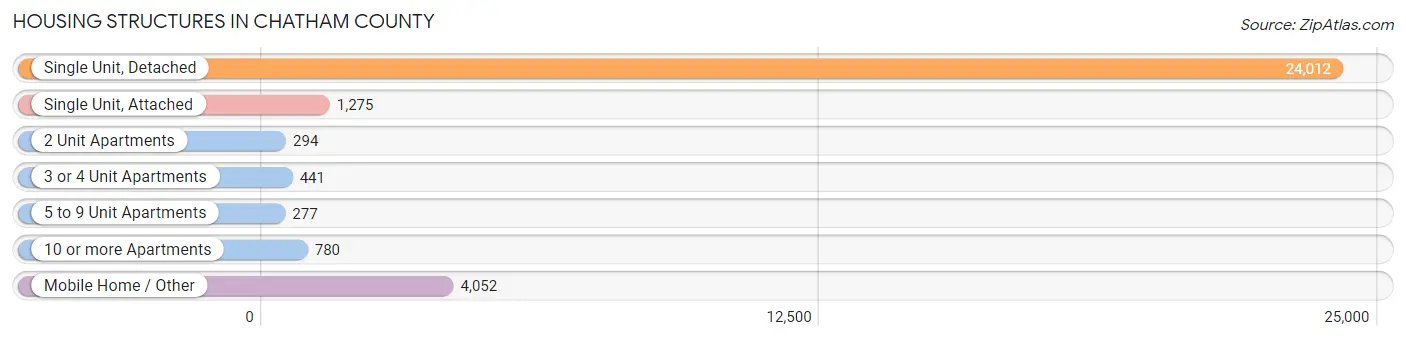
| Structure Type | # Housing Units | % Housing Units |
| Single Unit, Detached | 24,012 | 77.1% |
| Single Unit, Attached | 1,275 | 4.1% |
| 2 Unit Apartments | 294 | 0.9% |
| 3 or 4 Unit Apartments | 441 | 1.4% |
| 5 to 9 Unit Apartments | 277 | 0.9% |
| 10 or more Apartments | 780 | 2.5% |
| Mobile Home / Other | 4,052 | 13.0% |
| Total | 31,131 | 100.0% |
Housing Structures by Occupancy in Chatham County
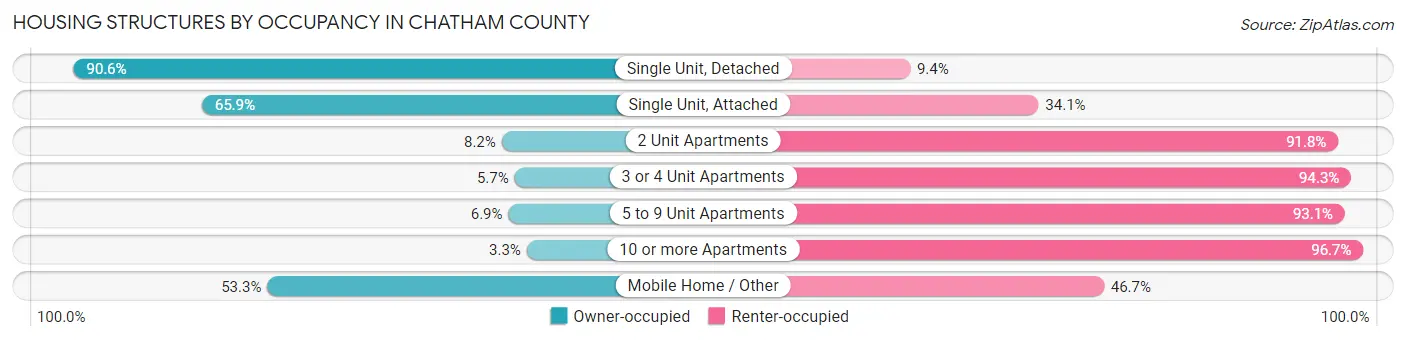
| Structure Type | Owner-occupied | Renter-occupied |
| Single Unit, Detached | 21,756 (90.6%) | 2,256 (9.4%) |
| Single Unit, Attached | 840 (65.9%) | 435 (34.1%) |
| 2 Unit Apartments | 24 (8.2%) | 270 (91.8%) |
| 3 or 4 Unit Apartments | 25 (5.7%) | 416 (94.3%) |
| 5 to 9 Unit Apartments | 19 (6.9%) | 258 (93.1%) |
| 10 or more Apartments | 26 (3.3%) | 754 (96.7%) |
| Mobile Home / Other | 2,159 (53.3%) | 1,893 (46.7%) |
| Total | 24,849 (79.8%) | 6,282 (20.2%) |
Housing Structures by Number of Rooms in Chatham County
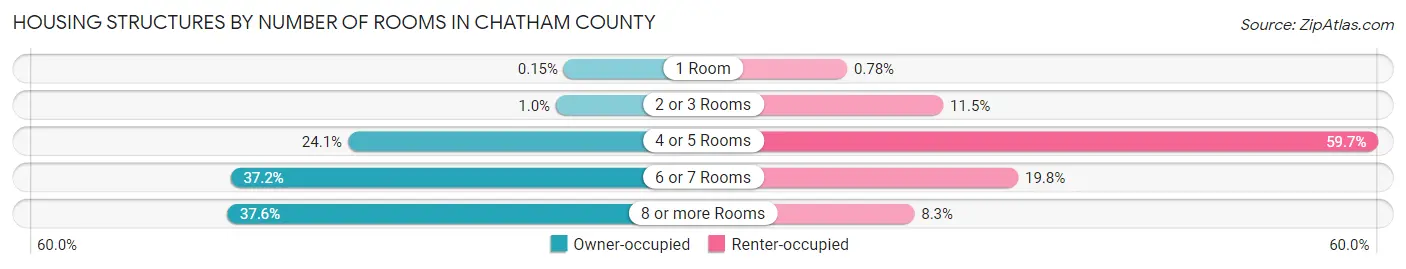
| Number of Rooms | Owner-occupied | Renter-occupied |
| 1 Room | 37 (0.2%) | 49 (0.8%) |
| 2 or 3 Rooms | 257 (1.0%) | 720 (11.5%) |
| 4 or 5 Rooms | 5,993 (24.1%) | 3,753 (59.7%) |
| 6 or 7 Rooms | 9,231 (37.1%) | 1,242 (19.8%) |
| 8 or more Rooms | 9,331 (37.6%) | 518 (8.3%) |
| Total | 24,849 (100.0%) | 6,282 (100.0%) |
Housing Structure by Heating Type in Chatham County
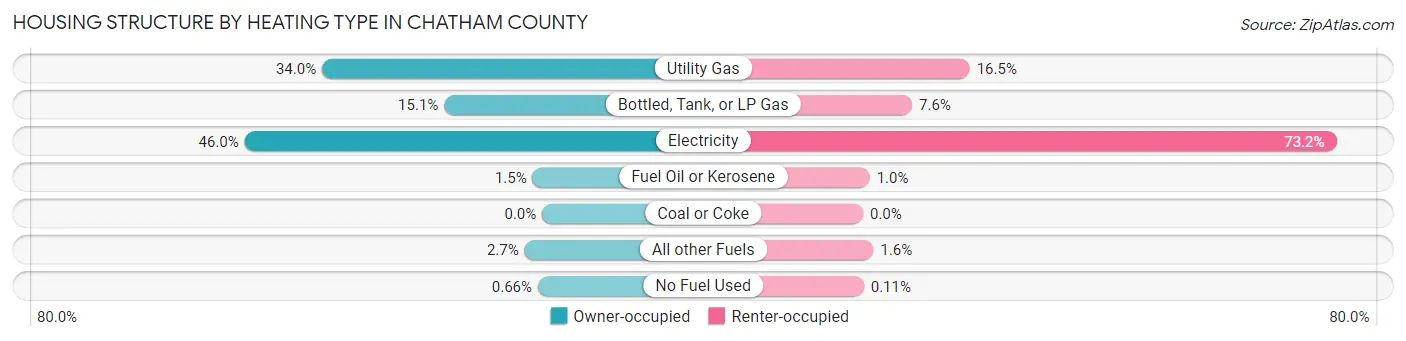
| Heating Type | Owner-occupied | Renter-occupied |
| Utility Gas | 8,455 (34.0%) | 1,036 (16.5%) |
| Bottled, Tank, or LP Gas | 3,761 (15.1%) | 476 (7.6%) |
| Electricity | 11,428 (46.0%) | 4,596 (73.2%) |
| Fuel Oil or Kerosene | 367 (1.5%) | 65 (1.0%) |
| Coal or Coke | 0 (0.0%) | 0 (0.0%) |
| All other Fuels | 673 (2.7%) | 102 (1.6%) |
| No Fuel Used | 165 (0.7%) | 7 (0.1%) |
| Total | 24,849 (100.0%) | 6,282 (100.0%) |
Household Vehicle Usage in Chatham County
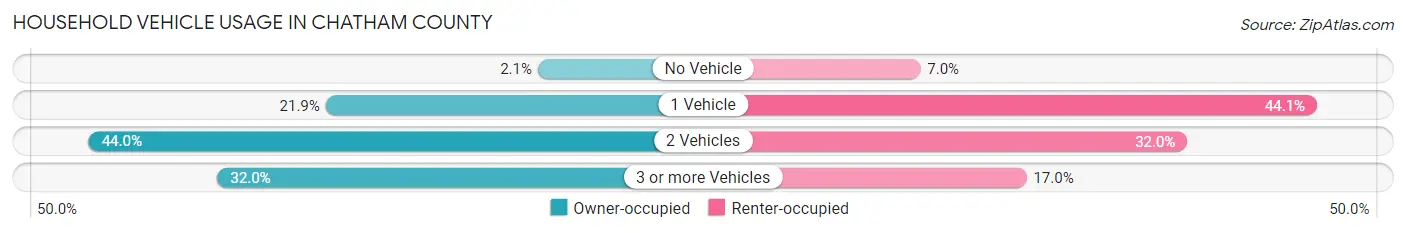
| Vehicles per Household | Owner-occupied | Renter-occupied |
| No Vehicle | 519 (2.1%) | 442 (7.0%) |
| 1 Vehicle | 5,442 (21.9%) | 2,768 (44.1%) |
| 2 Vehicles | 10,936 (44.0%) | 2,007 (32.0%) |
| 3 or more Vehicles | 7,952 (32.0%) | 1,065 (17.0%) |
| Total | 24,849 (100.0%) | 6,282 (100.0%) |
Real Estate & Mortgages in Chatham County
Real Estate and Mortgage Overview in Chatham County
| Characteristic | Without Mortgage | With Mortgage |
| Housing Units | 10,115 | 14,734 |
| Median Property Value | $321,800 | $396,100 |
| Median Household Income | $71,552 | $5,886 |
| Monthly Housing Costs | $573 | $2,503 |
| Real Estate Taxes | $2,370 | $37 |
Property Value by Mortgage Status in Chatham County
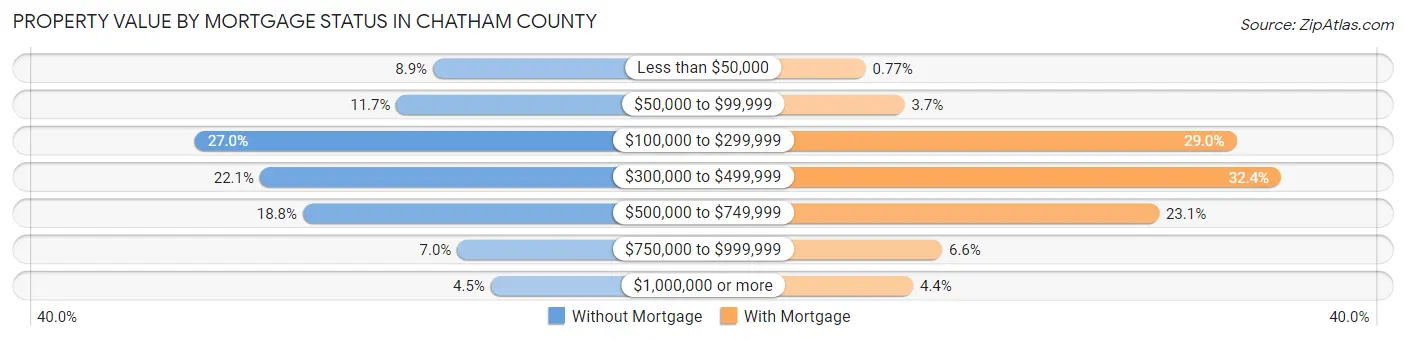
| Property Value | Without Mortgage | With Mortgage |
| Less than $50,000 | 899 (8.9%) | 113 (0.8%) |
| $50,000 to $99,999 | 1,181 (11.7%) | 549 (3.7%) |
| $100,000 to $299,999 | 2,734 (27.0%) | 4,274 (29.0%) |
| $300,000 to $499,999 | 2,233 (22.1%) | 4,775 (32.4%) |
| $500,000 to $749,999 | 1,902 (18.8%) | 3,407 (23.1%) |
| $750,000 to $999,999 | 712 (7.0%) | 971 (6.6%) |
| $1,000,000 or more | 454 (4.5%) | 645 (4.4%) |
| Total | 10,115 (100.0%) | 14,734 (100.0%) |
Household Income by Mortgage Status in Chatham County
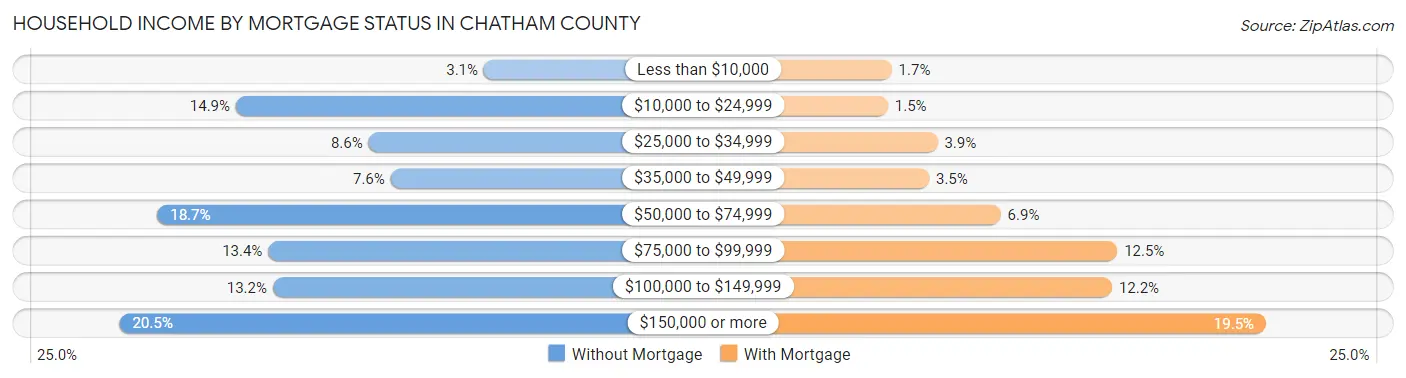
| Household Income | Without Mortgage | With Mortgage |
| Less than $10,000 | 317 (3.1%) | 254 (1.7%) |
| $10,000 to $24,999 | 1,511 (14.9%) | 227 (1.5%) |
| $25,000 to $34,999 | 872 (8.6%) | 574 (3.9%) |
| $35,000 to $49,999 | 766 (7.6%) | 515 (3.5%) |
| $50,000 to $74,999 | 1,889 (18.7%) | 1,018 (6.9%) |
| $75,000 to $99,999 | 1,355 (13.4%) | 1,836 (12.5%) |
| $100,000 to $149,999 | 1,333 (13.2%) | 1,799 (12.2%) |
| $150,000 or more | 2,072 (20.5%) | 2,879 (19.5%) |
| Total | 10,115 (100.0%) | 14,734 (100.0%) |
Property Value to Household Income Ratio in Chatham County
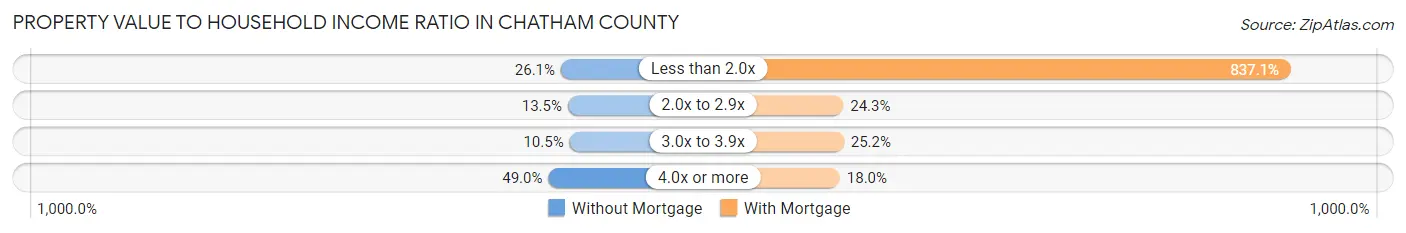
| Value-to-Income Ratio | Without Mortgage | With Mortgage |
| Less than 2.0x | 2,643 (26.1%) | 123,344 (837.1%) |
| 2.0x to 2.9x | 1,369 (13.5%) | 3,574 (24.3%) |
| 3.0x to 3.9x | 1,058 (10.5%) | 3,710 (25.2%) |
| 4.0x or more | 4,953 (49.0%) | 2,658 (18.0%) |
| Total | 10,115 (100.0%) | 14,734 (100.0%) |
Real Estate Taxes by Mortgage Status in Chatham County
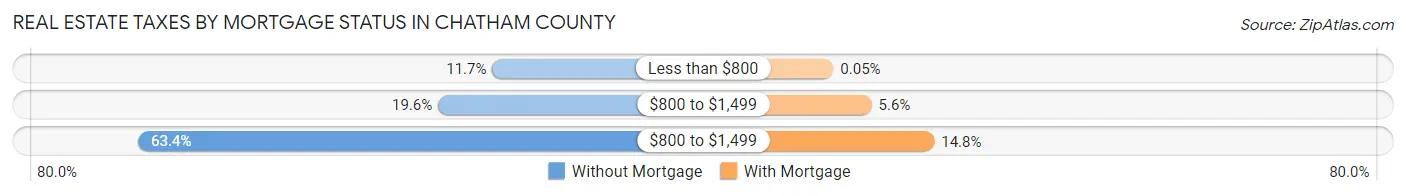
| Property Taxes | Without Mortgage | With Mortgage |
| Less than $800 | 1,179 (11.7%) | 7 (0.1%) |
| $800 to $1,499 | 1,982 (19.6%) | 830 (5.6%) |
| $800 to $1,499 | 6,414 (63.4%) | 2,179 (14.8%) |
| Total | 10,115 (100.0%) | 14,734 (100.0%) |
Health & Disability in Chatham County
Health Insurance Coverage by Age in Chatham County
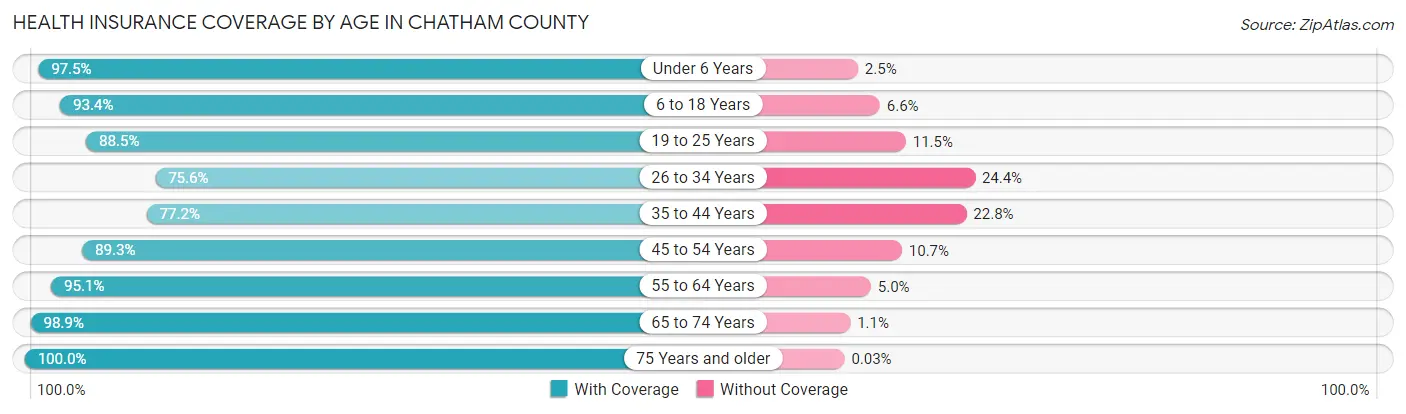
| Age Bracket | With Coverage | Without Coverage |
| Under 6 Years | 3,954 (97.5%) | 103 (2.5%) |
| 6 to 18 Years | 11,187 (93.4%) | 794 (6.6%) |
| 19 to 25 Years | 4,168 (88.5%) | 540 (11.5%) |
| 26 to 34 Years | 4,741 (75.6%) | 1,527 (24.4%) |
| 35 to 44 Years | 6,619 (77.2%) | 1,952 (22.8%) |
| 45 to 54 Years | 9,166 (89.3%) | 1,103 (10.7%) |
| 55 to 64 Years | 11,049 (95.1%) | 575 (5.0%) |
| 65 to 74 Years | 10,630 (98.9%) | 119 (1.1%) |
| 75 Years and older | 7,910 (100.0%) | 2 (0.0%) |
| Total | 69,424 (91.2%) | 6,715 (8.8%) |
Health Insurance Coverage by Citizenship Status in Chatham County
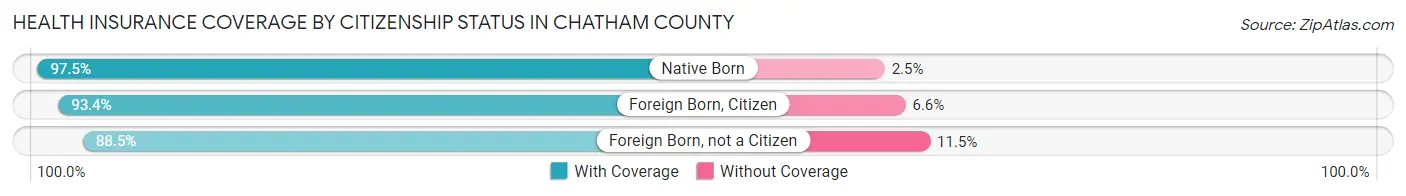
| Citizenship Status | With Coverage | Without Coverage |
| Native Born | 3,954 (97.5%) | 103 (2.5%) |
| Foreign Born, Citizen | 11,187 (93.4%) | 794 (6.6%) |
| Foreign Born, not a Citizen | 4,168 (88.5%) | 540 (11.5%) |
Health Insurance Coverage by Household Income in Chatham County
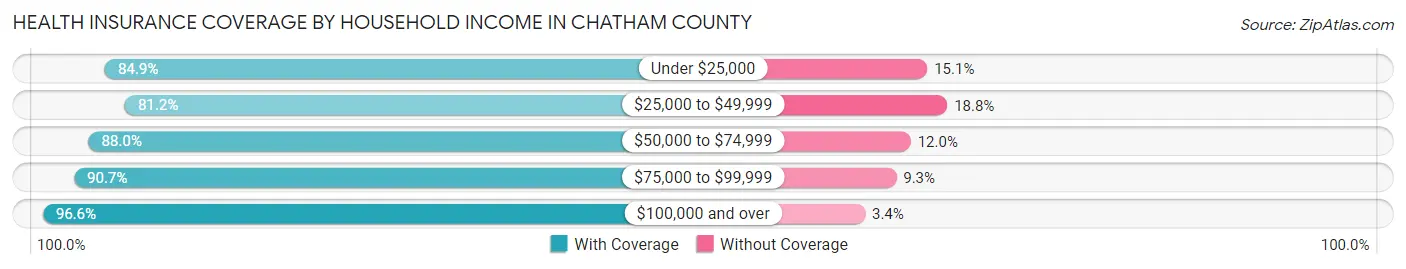
| Household Income | With Coverage | Without Coverage |
| Under $25,000 | 5,721 (84.9%) | 1,015 (15.1%) |
| $25,000 to $49,999 | 9,117 (81.2%) | 2,112 (18.8%) |
| $50,000 to $74,999 | 10,444 (88.0%) | 1,421 (12.0%) |
| $75,000 to $99,999 | 8,648 (90.7%) | 884 (9.3%) |
| $100,000 and over | 35,416 (96.6%) | 1,256 (3.4%) |
Public vs Private Health Insurance Coverage by Age in Chatham County
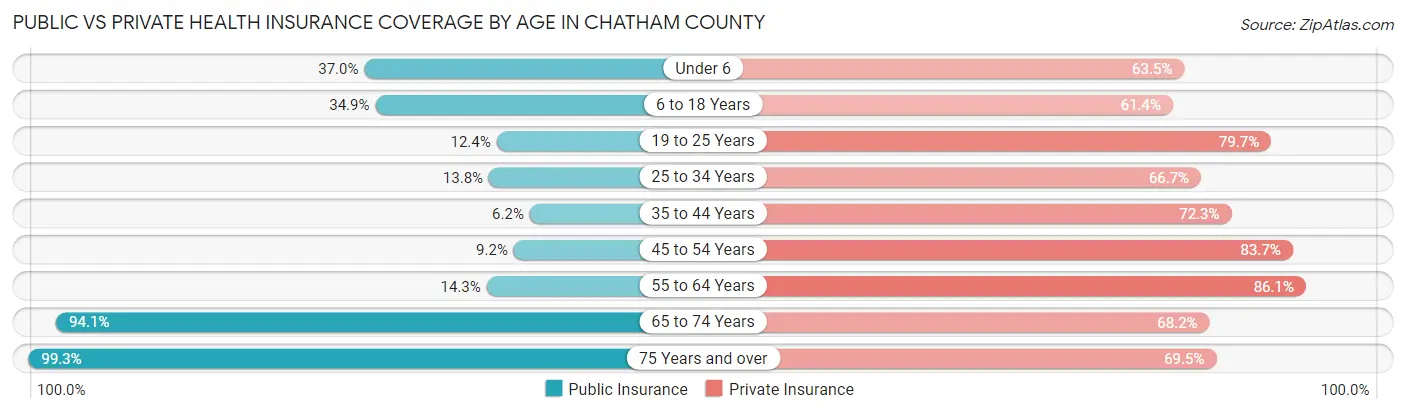
| Age Bracket | Public Insurance | Private Insurance |
| Under 6 | 1,499 (36.9%) | 2,578 (63.5%) |
| 6 to 18 Years | 4,182 (34.9%) | 7,360 (61.4%) |
| 19 to 25 Years | 584 (12.4%) | 3,751 (79.7%) |
| 25 to 34 Years | 866 (13.8%) | 4,178 (66.7%) |
| 35 to 44 Years | 535 (6.2%) | 6,196 (72.3%) |
| 45 to 54 Years | 946 (9.2%) | 8,593 (83.7%) |
| 55 to 64 Years | 1,658 (14.3%) | 10,009 (86.1%) |
| 65 to 74 Years | 10,119 (94.1%) | 7,334 (68.2%) |
| 75 Years and over | 7,856 (99.3%) | 5,498 (69.5%) |
| Total | 28,245 (37.1%) | 55,497 (72.9%) |
Disability Status by Sex by Age in Chatham County
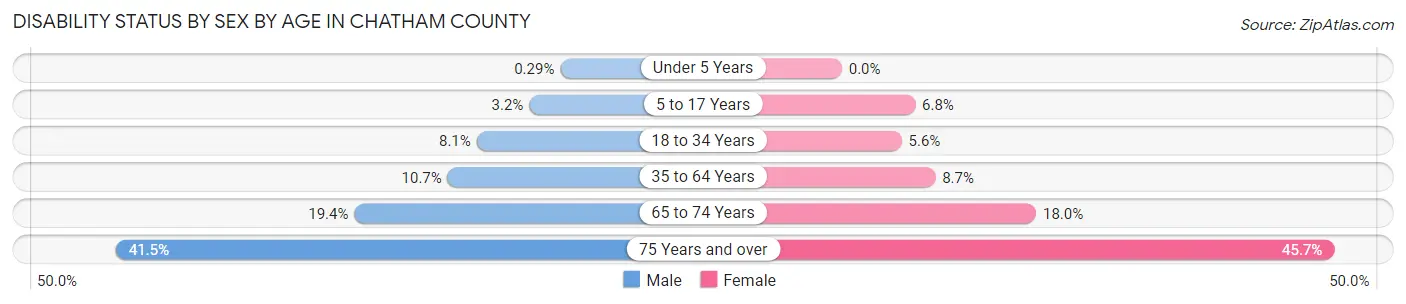
| Age Bracket | Male | Female |
| Under 5 Years | 5 (0.3%) | 0 (0.0%) |
| 5 to 17 Years | 181 (3.2%) | 393 (6.8%) |
| 18 to 34 Years | 469 (8.1%) | 345 (5.6%) |
| 35 to 64 Years | 1,612 (10.7%) | 1,339 (8.7%) |
| 65 to 74 Years | 969 (19.4%) | 1,037 (18.0%) |
| 75 Years and over | 1,437 (41.5%) | 2,034 (45.7%) |
Disability Class by Sex by Age in Chatham County
Disability Class: Hearing Difficulty
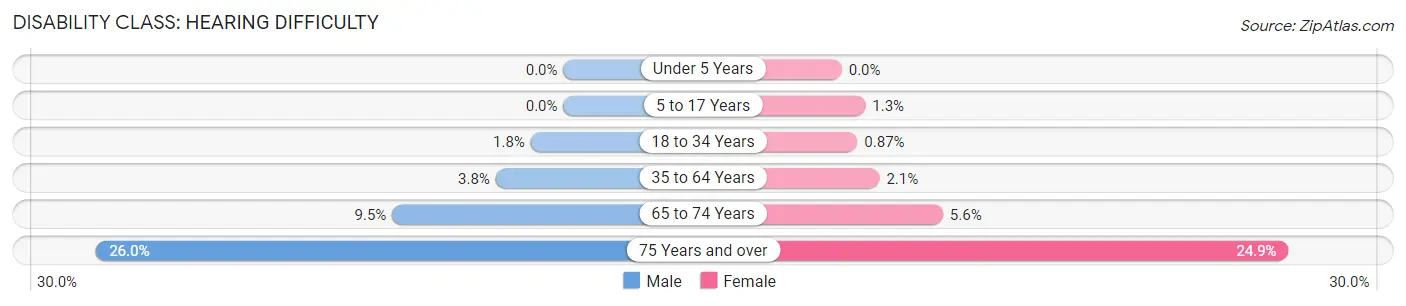
| Age Bracket | Male | Female |
| Under 5 Years | 0 (0.0%) | 0 (0.0%) |
| 5 to 17 Years | 0 (0.0%) | 76 (1.3%) |
| 18 to 34 Years | 106 (1.8%) | 54 (0.9%) |
| 35 to 64 Years | 566 (3.8%) | 325 (2.1%) |
| 65 to 74 Years | 476 (9.5%) | 324 (5.6%) |
| 75 Years and over | 900 (26.0%) | 1,107 (24.9%) |
Disability Class: Vision Difficulty
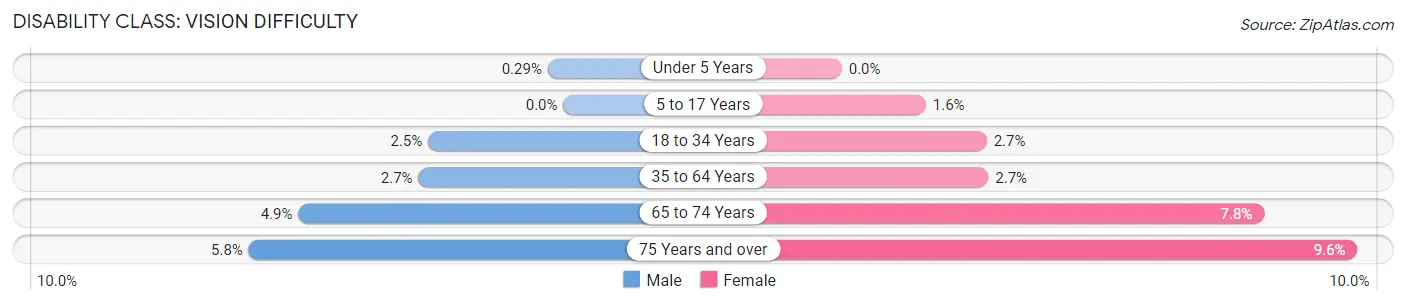
| Age Bracket | Male | Female |
| Under 5 Years | 5 (0.3%) | 0 (0.0%) |
| 5 to 17 Years | 0 (0.0%) | 90 (1.6%) |
| 18 to 34 Years | 146 (2.5%) | 167 (2.7%) |
| 35 to 64 Years | 404 (2.7%) | 420 (2.7%) |
| 65 to 74 Years | 246 (4.9%) | 451 (7.8%) |
| 75 Years and over | 202 (5.8%) | 426 (9.6%) |
Disability Class: Cognitive Difficulty
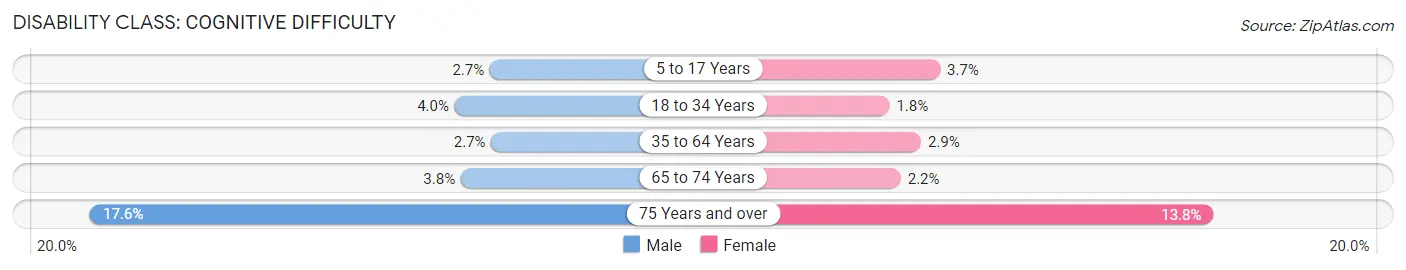
| Age Bracket | Male | Female |
| 5 to 17 Years | 155 (2.7%) | 211 (3.6%) |
| 18 to 34 Years | 235 (4.0%) | 110 (1.8%) |
| 35 to 64 Years | 401 (2.7%) | 455 (2.9%) |
| 65 to 74 Years | 190 (3.8%) | 126 (2.2%) |
| 75 Years and over | 608 (17.6%) | 614 (13.8%) |
Disability Class: Ambulatory Difficulty
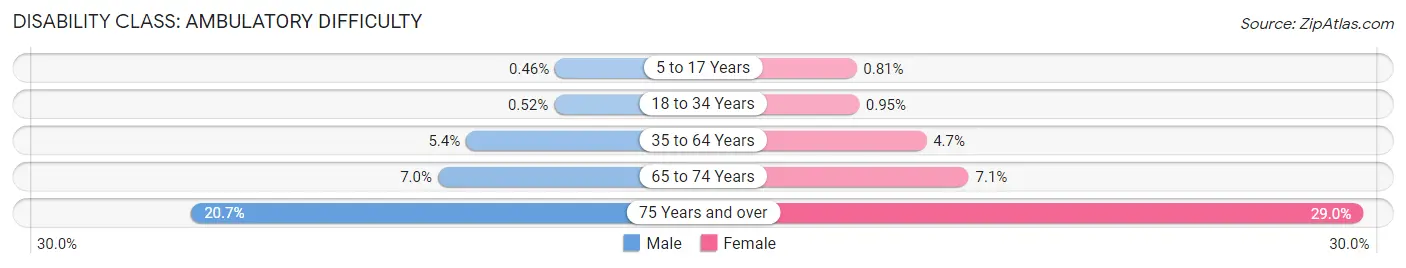
| Age Bracket | Male | Female |
| 5 to 17 Years | 26 (0.5%) | 47 (0.8%) |
| 18 to 34 Years | 30 (0.5%) | 59 (0.9%) |
| 35 to 64 Years | 813 (5.4%) | 726 (4.7%) |
| 65 to 74 Years | 349 (7.0%) | 406 (7.1%) |
| 75 Years and over | 717 (20.7%) | 1,292 (29.0%) |
Disability Class: Self-Care Difficulty
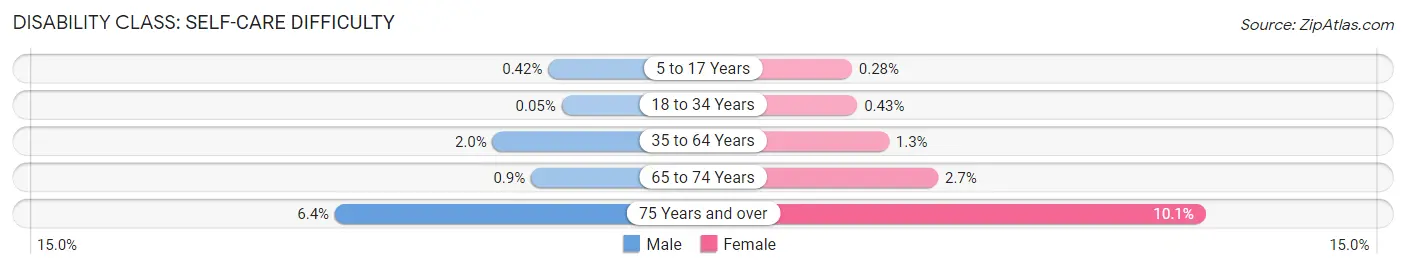
| Age Bracket | Male | Female |
| 5 to 17 Years | 24 (0.4%) | 16 (0.3%) |
| 18 to 34 Years | 3 (0.1%) | 27 (0.4%) |
| 35 to 64 Years | 295 (2.0%) | 202 (1.3%) |
| 65 to 74 Years | 45 (0.9%) | 154 (2.7%) |
| 75 Years and over | 220 (6.4%) | 451 (10.1%) |
Technology Access in Chatham County
Computing Device Access in Chatham County
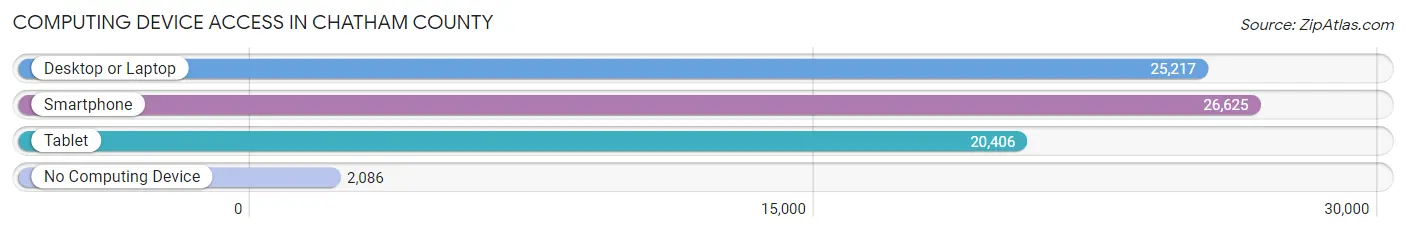
| Device Type | # Households | % Households |
| Desktop or Laptop | 25,217 | 81.0% |
| Smartphone | 26,625 | 85.5% |
| Tablet | 20,406 | 65.5% |
| No Computing Device | 2,086 | 6.7% |
| Total | 31,131 | 100.0% |
Internet Access in Chatham County
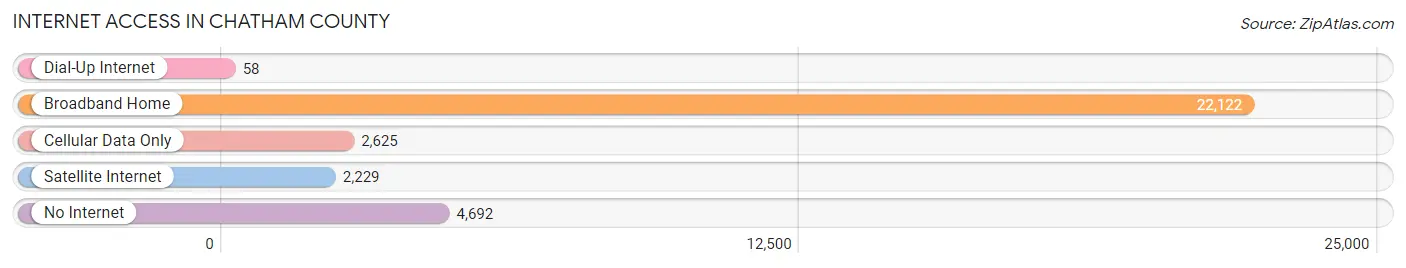
| Internet Type | # Households | % Households |
| Dial-Up Internet | 58 | 0.2% |
| Broadband Home | 22,122 | 71.1% |
| Cellular Data Only | 2,625 | 8.4% |
| Satellite Internet | 2,229 | 7.2% |
| No Internet | 4,692 | 15.1% |
| Total | 31,131 | 100.0% |
Chatham County Summary
Chatham County is located in the Piedmont region of North Carolina, and is part of the Triangle region of the state. It is bordered by Orange County to the north, Wake County to the east, Lee County to the south, and Moore County to the west. The county seat is Pittsboro, and the county is home to a population of approximately 63,505 people, as of the 2019 census.
Geography
Chatham County is located in the Piedmont region of North Carolina, and is part of the Triangle region of the state. It is bordered by Orange County to the north, Wake County to the east, Lee County to the south, and Moore County to the west. The county is home to a total area of 545 square miles, of which 543 square miles is land and 2 square miles is water. The county is home to several rivers, including the Haw River, Rocky River, Deep River, and Rocky River. The county is also home to several lakes, including Jordan Lake, Lake Tillery, and Lake Harris.
History
Chatham County was formed in 1771 from Orange County. It was named for William Pitt, 1st Earl of Chatham, who served as Prime Minister of Great Britain from 1766 to 1768. The county seat was originally located in New Hope, but was moved to Pittsboro in 1787.
The county was home to several Native American tribes, including the Occaneechi, Eno, and Saponi. The county was also home to several early settlers, including Quakers, Scots-Irish, and German immigrants.
The county was home to several important events during the American Revolution, including the Battle of Lindley's Mill and the Battle of Moore's Creek Bridge. The county was also home to several important events during the Civil War, including the Battle of Averasboro and the Battle of Bennett Place.
Economy
The economy of Chatham County is largely based on agriculture, with the county being home to several large farms and agricultural businesses. The county is also home to several manufacturing companies, including pharmaceuticals, textiles, and furniture. The county is also home to several technology companies, including software and biotechnology.
The county is home to several educational institutions, including the University of North Carolina at Chapel Hill, North Carolina State University, and Duke University. The county is also home to several hospitals, including UNC Hospitals and Duke University Medical Center.
Demographics
As of the 2019 census, Chatham County had a population of 63,505 people. The racial makeup of the county was 79.2% White, 14.3% Black or African American, 0.4% Native American, 2.2% Asian, 0.1% Pacific Islander, 1.7% from other races, and 2.1% from two or more races. Hispanic or Latino of any race were 5.2% of the population.
The median income for a household in the county was $50,945, and the median income for a family was $62,945. The per capita income for the county was $27,845. About 10.2% of families and 14.2% of the population were below the poverty line, including 19.2% of those under age 18 and 8.2% of those age 65 or over.
Common Questions
What is Per Capita Income in Chatham County?
Per Capita income in Chatham County is $53,291.
What is the Median Family Income in Chatham County?
Median Family Income in Chatham County is $104,609.
What is the Median Household income in Chatham County?
Median Household Income in Chatham County is $84,222.
What is Income or Wage Gap in Chatham County?
Income or Wage Gap in Chatham County is 18.2%.
Women in Chatham County earn 81.8 cents for every dollar earned by a man.
What is Family Income Deficit in Chatham County?
Family Income Deficit in Chatham County is $8,075.
Families that are below poverty line in Chatham County earn $8,075 less on average than the poverty threshold level.
What is Inequality or Gini Index in Chatham County?
Inequality or Gini Index in Chatham County is 0.50.
What is the Total Population of Chatham County?
Total Population of Chatham County is 76,754.
What is the Total Male Population of Chatham County?
Total Male Population of Chatham County is 36,955.
What is the Total Female Population of Chatham County?
Total Female Population of Chatham County is 39,799.
What is the Ratio of Males per 100 Females in Chatham County?
There are 92.85 Males per 100 Females in Chatham County.
What is the Ratio of Females per 100 Males in Chatham County?
There are 107.70 Females per 100 Males in Chatham County.
What is the Median Population Age in Chatham County?
Median Population Age in Chatham County is 47.6 Years.
What is the Average Family Size in Chatham County
Average Family Size in Chatham County is 2.9 People.
What is the Average Household Size in Chatham County
Average Household Size in Chatham County is 2.4 People.
How Large is the Labor Force in Chatham County?
There are 36,498 People in the Labor Forcein in Chatham County.
What is the Percentage of People in the Labor Force in Chatham County?
57.2% of People are in the Labor Force in Chatham County.
What is the Unemployment Rate in Chatham County?
Unemployment Rate in Chatham County is 2.8%.