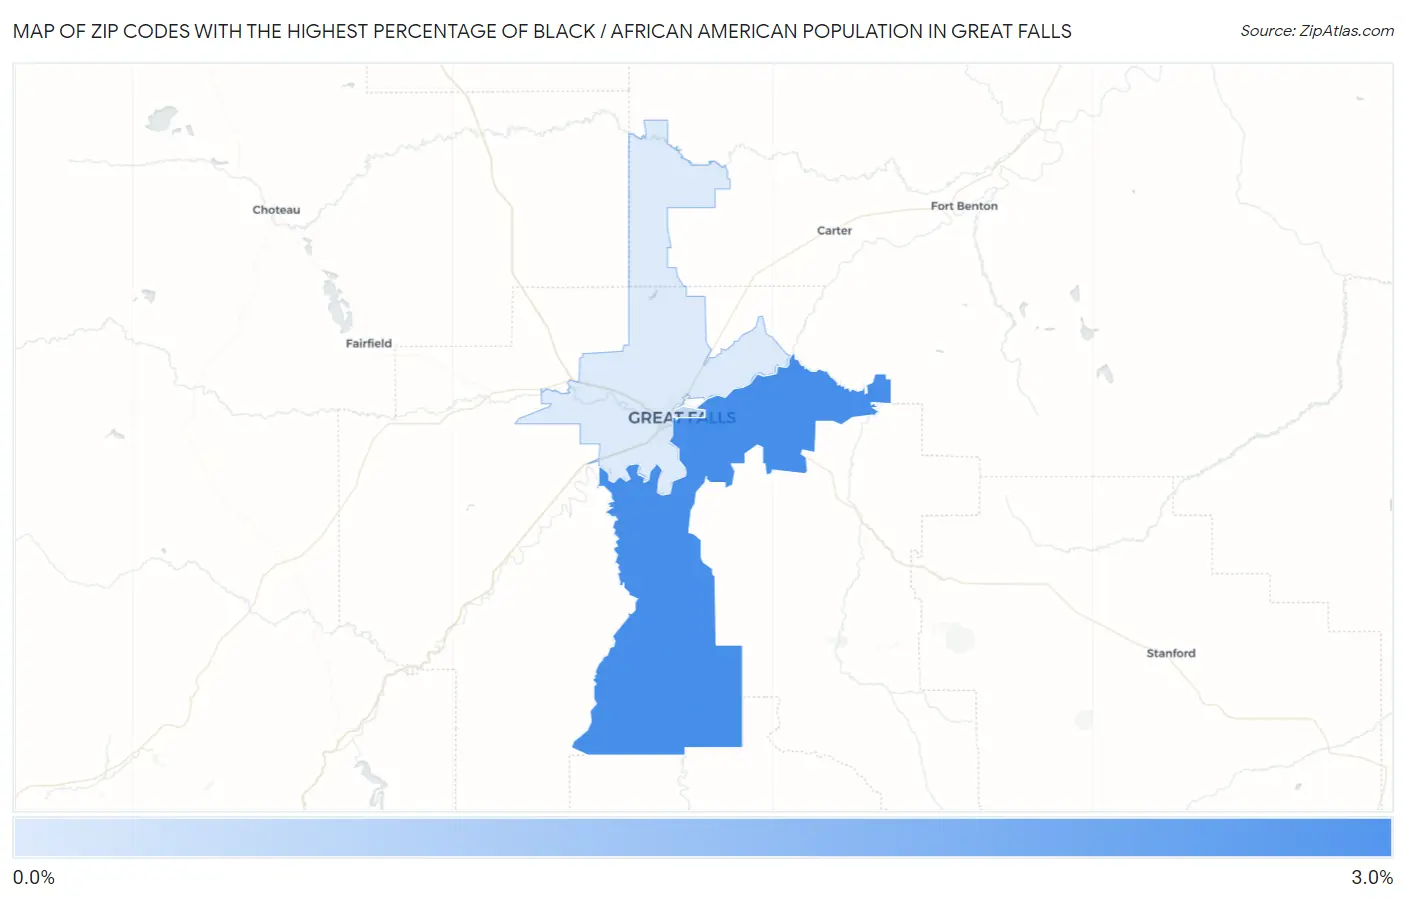
Zip Codes with the Highest Percentage of Black / African American Population in Great Falls, MT
RELATED REPORTS & OPTIONS
Black / African American
Great Falls
Compare Zip Codes
Map of Zip Codes with the Highest Percentage of Black / African American Population in Great Falls
0.63%
2.7%
Zip Codes with the Highest Percentage of Black / African American Population in Great Falls, MT
| Zip Code | Black / African American | vs State | vs National | |
| 1. | 59405 | 2.7% | 0.55%(+2.19)#8 | 12.5%(-9.73)#12,238 |
| 2. | 59401 | 1.00% | 0.55%(+0.444)#30 | 12.5%(-11.5)#16,560 |
| 3. | 59404 | 0.63% | 0.55%(+0.078)#46 | 12.5%(-11.8)#18,329 |
1
Common Questions
What are the Top Zip Codes with the Highest Percentage of Black / African American Population in Great Falls, MT?
Top Zip Codes with the Highest Percentage of Black / African American Population in Great Falls, MT are:
What zip code has the Highest Percentage of Black / African American Population in Great Falls, MT?
59405 has the Highest Percentage of Black / African American Population in Great Falls, MT with 2.7%.
What is the Percentage of Black / African American Population in Great Falls, MT?
Percentage of Black / African American Population in Great Falls is 1.1%.
What is the Percentage of Black / African American Population in Montana?
Percentage of Black / African American Population in Montana is 0.55%.
What is the Percentage of Black / African American Population in the United States?
Percentage of Black / African American Population in the United States is 12.5%.