Pope County, MN Map & Demographics
Pope County Map

Pope County Overview
$38,905
PER CAPITA INCOME
$94,375
AVG FAMILY INCOME
$71,212
AVG HOUSEHOLD INCOME
28.9%
WAGE / INCOME GAP [ % ]
71.1¢/ $1
WAGE / INCOME GAP [ $ ]
$10,342
FAMILY INCOME DEFICIT
0.42
INEQUALITY / GINI INDEX
11,312
TOTAL POPULATION
5,798
MALE POPULATION
5,514
FEMALE POPULATION
105.15
MALES / 100 FEMALES
95.10
FEMALES / 100 MALES
46.2
MEDIAN AGE
2.7
AVG FAMILY SIZE
2.3
AVG HOUSEHOLD SIZE
5,883
LABOR FORCE [ PEOPLE ]
63.9%
PERCENT IN LABOR FORCE
1.0%
UNEMPLOYMENT RATE
Pope County Area Codes
Income in Pope County
Income Overview in Pope County
Per Capita Income in Pope County is $38,905, while median incomes of families and households are $94,375 and $71,212 respectively.
| Characteristic | Number | Measure |
| Per Capita Income | 11,312 | $38,905 |
| Median Family Income | 3,222 | $94,375 |
| Mean Family Income | 3,222 | $109,587 |
| Median Household Income | 4,897 | $71,212 |
| Mean Household Income | 4,897 | $89,070 |
| Income Deficit | 3,222 | $10,342 |
| Wage / Income Gap (%) | 11,312 | 28.89% |
| Wage / Income Gap ($) | 11,312 | 71.11¢ per $1 |
| Gini / Inequality Index | 11,312 | 0.42 |
Earnings by Sex in Pope County
Average Earnings in Pope County are $41,412, $49,145 for men and $34,947 for women, a difference of 28.9%.
| Sex | Number | Average Earnings |
| Male | 3,405 (53.9%) | $49,145 |
| Female | 2,917 (46.1%) | $34,947 |
| Total | 6,322 (100.0%) | $41,412 |
Earnings by Sex by Income Bracket in Pope County
The most common earnings brackets in Pope County are $100,000+ for men (499 | 14.6%) and $55,000 to $64,999 for women (309 | 10.6%).
| Income | Male | Female |
| $2,499 or less | 195 (5.7%) | 161 (5.5%) |
| $2,500 to $4,999 | 126 (3.7%) | 83 (2.9%) |
| $5,000 to $7,499 | 121 (3.5%) | 137 (4.7%) |
| $7,500 to $9,999 | 100 (2.9%) | 95 (3.3%) |
| $10,000 to $12,499 | 93 (2.7%) | 87 (3.0%) |
| $12,500 to $14,999 | 67 (2.0%) | 78 (2.7%) |
| $15,000 to $17,499 | 48 (1.4%) | 104 (3.6%) |
| $17,500 to $19,999 | 23 (0.7%) | 105 (3.6%) |
| $20,000 to $22,499 | 81 (2.4%) | 138 (4.7%) |
| $22,500 to $24,999 | 50 (1.5%) | 86 (2.9%) |
| $25,000 to $29,999 | 129 (3.8%) | 140 (4.8%) |
| $30,000 to $34,999 | 196 (5.8%) | 248 (8.5%) |
| $35,000 to $39,999 | 184 (5.4%) | 199 (6.8%) |
| $40,000 to $44,999 | 114 (3.4%) | 211 (7.2%) |
| $45,000 to $49,999 | 195 (5.7%) | 157 (5.4%) |
| $50,000 to $54,999 | 186 (5.5%) | 79 (2.7%) |
| $55,000 to $64,999 | 367 (10.8%) | 309 (10.6%) |
| $65,000 to $74,999 | 262 (7.7%) | 181 (6.2%) |
| $75,000 to $99,999 | 369 (10.8%) | 206 (7.1%) |
| $100,000+ | 499 (14.6%) | 113 (3.9%) |
| Total | 3,405 (100.0%) | 2,917 (100.0%) |
Earnings by Sex by Educational Attainment in Pope County
Average earnings in Pope County are $54,547 for men and $38,140 for women, a difference of 30.1%. Men with an educational attainment of graduate degree enjoy the highest average annual earnings of $76,250, while those with high school diploma education earn the least with $45,434. Women with an educational attainment of bachelor's degree earn the most with the average annual earnings of $55,595, while those with high school diploma education have the smallest earnings of $20,750.
| Educational Attainment | Male Income | Female Income |
| Less than High School | $53,125 | $0 |
| High School Diploma | $45,434 | $20,750 |
| College or Associate's Degree | $57,885 | $39,838 |
| Bachelor's Degree | $71,094 | $55,595 |
| Graduate Degree | $76,250 | $54,167 |
| Total | $54,547 | $38,140 |
Family Income in Pope County
Family Income Brackets in Pope County
According to the Pope County family income data, there are 754 families falling into the $100,000 to $149,999 income range, which is the most common income bracket and makes up 23.4% of all families. Conversely, the less than $10,000 income bracket is the least frequent group with only 42 families (1.3%) belonging to this category.
| Income Bracket | # Families | % Families |
| Less than $10,000 | 42 | 1.3% |
| $10,000 to $14,999 | 45 | 1.4% |
| $15,000 to $24,999 | 110 | 3.4% |
| $25,000 to $34,999 | 174 | 5.4% |
| $35,000 to $49,999 | 235 | 7.3% |
| $50,000 to $74,999 | 612 | 19.0% |
| $75,000 to $99,999 | 541 | 16.8% |
| $100,000 to $149,999 | 754 | 23.4% |
| $150,000 to $199,999 | 429 | 13.3% |
| $200,000+ | 280 | 8.7% |
Family Income by Famaliy Size in Pope County
6-person families (96 | 3.0%) account for the highest median family income in Pope County with $155,833 per family, while 2-person families (1,884 | 58.5%) have the highest median income of $39,812 per family member.
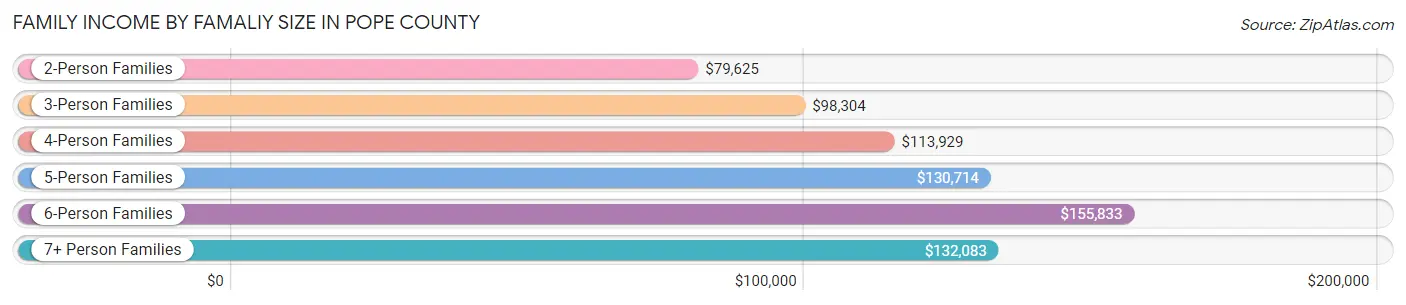
| Income Bracket | # Families | Median Income |
| 2-Person Families | 1,884 (58.5%) | $79,625 |
| 3-Person Families | 515 (16.0%) | $98,304 |
| 4-Person Families | 482 (15.0%) | $113,929 |
| 5-Person Families | 230 (7.1%) | $130,714 |
| 6-Person Families | 96 (3.0%) | $155,833 |
| 7+ Person Families | 15 (0.5%) | $132,083 |
| Total | 3,222 (100.0%) | $94,375 |
Family Income by Number of Earners in Pope County
The median family income in Pope County is $94,375, with families comprising 3+ earners (321) having the highest median family income of $156,823, while families with no earners (534) have the lowest median family income of $57,581, accounting for 10.0% and 16.6% of families, respectively.
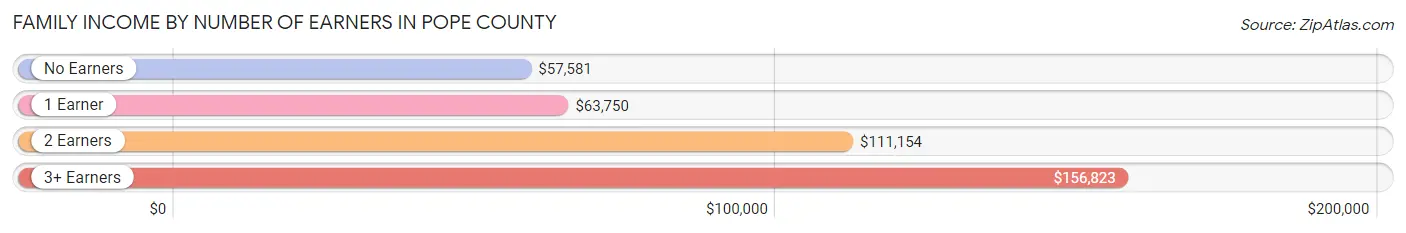
| Number of Earners | # Families | Median Income |
| No Earners | 534 (16.6%) | $57,581 |
| 1 Earner | 765 (23.7%) | $63,750 |
| 2 Earners | 1,602 (49.7%) | $111,154 |
| 3+ Earners | 321 (10.0%) | $156,823 |
| Total | 3,222 (100.0%) | $94,375 |
Household Income in Pope County
Household Income Brackets in Pope County
With 950 households falling in the category, the $50,000 to $74,999 income range is the most frequent in Pope County, accounting for 19.4% of all households. In contrast, only 186 households (3.8%) fall into the less than $10,000 income bracket, making it the least populous group.
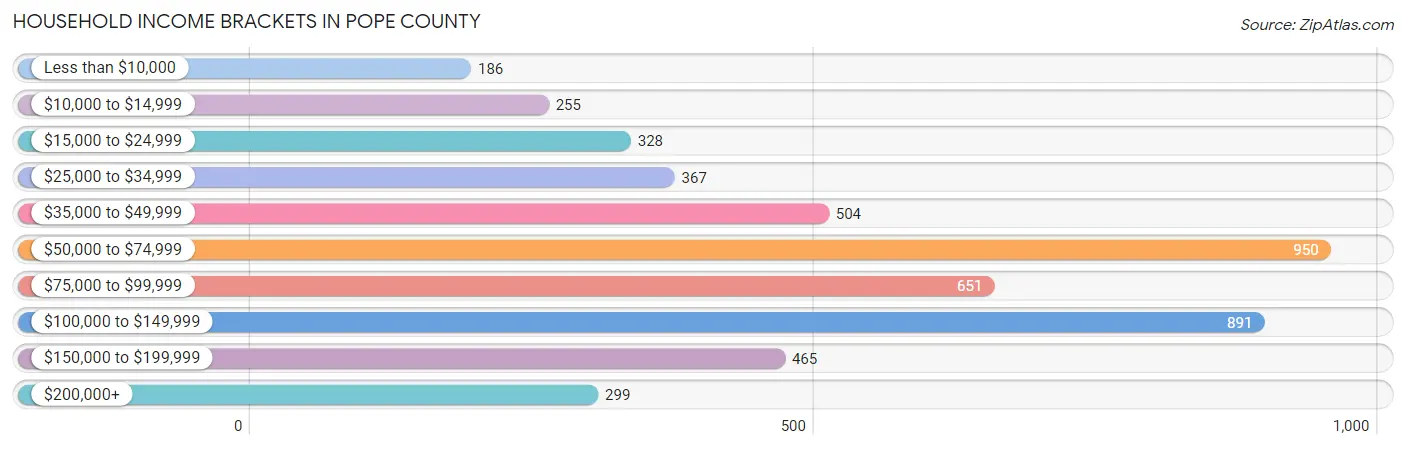
| Income Bracket | # Households | % Households |
| Less than $10,000 | 186 | 3.8% |
| $10,000 to $14,999 | 255 | 5.2% |
| $15,000 to $24,999 | 328 | 6.7% |
| $25,000 to $34,999 | 367 | 7.5% |
| $35,000 to $49,999 | 504 | 10.3% |
| $50,000 to $74,999 | 950 | 19.4% |
| $75,000 to $99,999 | 651 | 13.3% |
| $100,000 to $149,999 | 891 | 18.2% |
| $150,000 to $199,999 | 465 | 9.5% |
| $200,000+ | 299 | 6.1% |
Household Income by Householder Age in Pope County
The median household income in Pope County is $71,212, with the highest median household income of $96,333 found in the 25 to 44 years age bracket for the primary householder. A total of 1,314 households (26.8%) fall into this category. Meanwhile, the 15 to 24 years age bracket for the primary householder has the lowest median household income of $43,068, with 193 households (3.9%) in this group.

| Income Bracket | # Households | Median Income |
| 15 to 24 Years | 193 (3.9%) | $43,068 |
| 25 to 44 Years | 1,314 (26.8%) | $96,333 |
| 45 to 64 Years | 1,607 (32.8%) | $93,250 |
| 65+ Years | 1,783 (36.4%) | $51,108 |
| Total | 4,897 (100.0%) | $71,212 |
Poverty in Pope County
Income Below Poverty by Sex and Age in Pope County
With 9.8% poverty level for males and 9.4% for females among the residents of Pope County, 18 to 24 year old males and 5 year old females are the most vulnerable to poverty, with 69 males (17.3%) and 28 females (48.3%) in their respective age groups living below the poverty level.
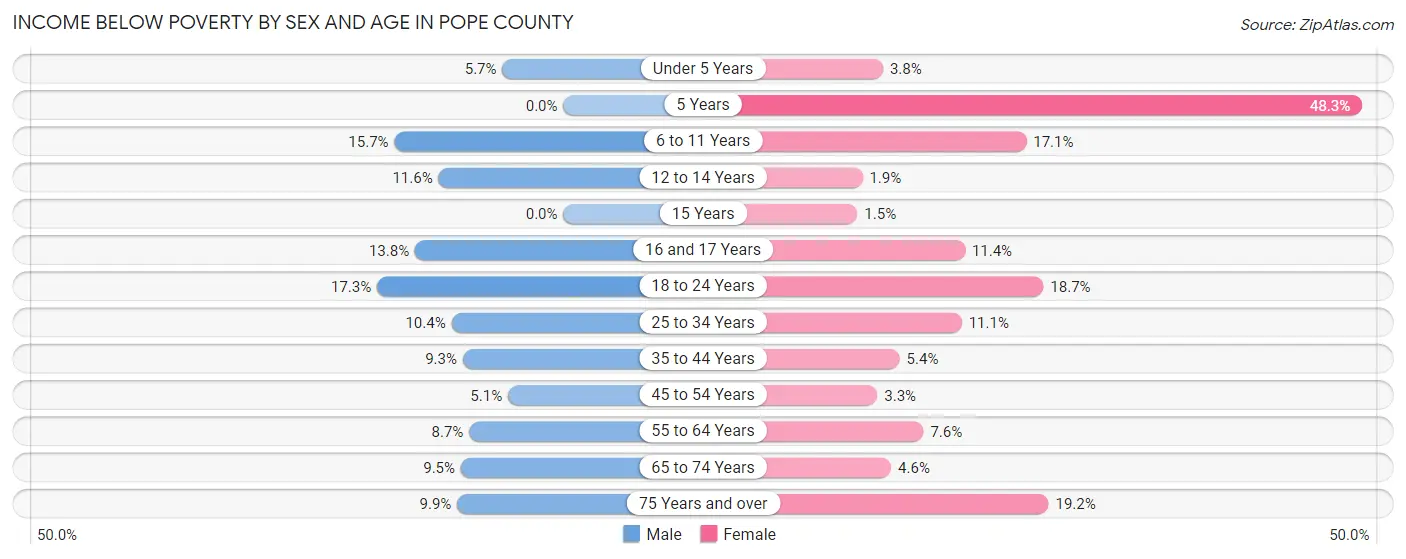
| Age Bracket | Male | Female |
| Under 5 Years | 18 (5.7%) | 10 (3.8%) |
| 5 Years | 0 (0.0%) | 28 (48.3%) |
| 6 to 11 Years | 66 (15.7%) | 63 (17.1%) |
| 12 to 14 Years | 27 (11.6%) | 4 (1.9%) |
| 15 Years | 0 (0.0%) | 1 (1.5%) |
| 16 and 17 Years | 23 (13.8%) | 12 (11.4%) |
| 18 to 24 Years | 69 (17.3%) | 58 (18.7%) |
| 25 to 34 Years | 60 (10.4%) | 65 (11.1%) |
| 35 to 44 Years | 64 (9.3%) | 33 (5.4%) |
| 45 to 54 Years | 31 (5.1%) | 18 (3.3%) |
| 55 to 64 Years | 77 (8.7%) | 68 (7.6%) |
| 65 to 74 Years | 81 (9.5%) | 35 (4.6%) |
| 75 Years and over | 47 (9.9%) | 109 (19.2%) |
| Total | 563 (9.8%) | 504 (9.4%) |
Income Above Poverty by Sex and Age in Pope County
According to the poverty statistics in Pope County, males aged 5 years and females aged 15 years are the age groups that are most secure financially, with 100.0% of males and 98.6% of females in these age groups living above the poverty line.
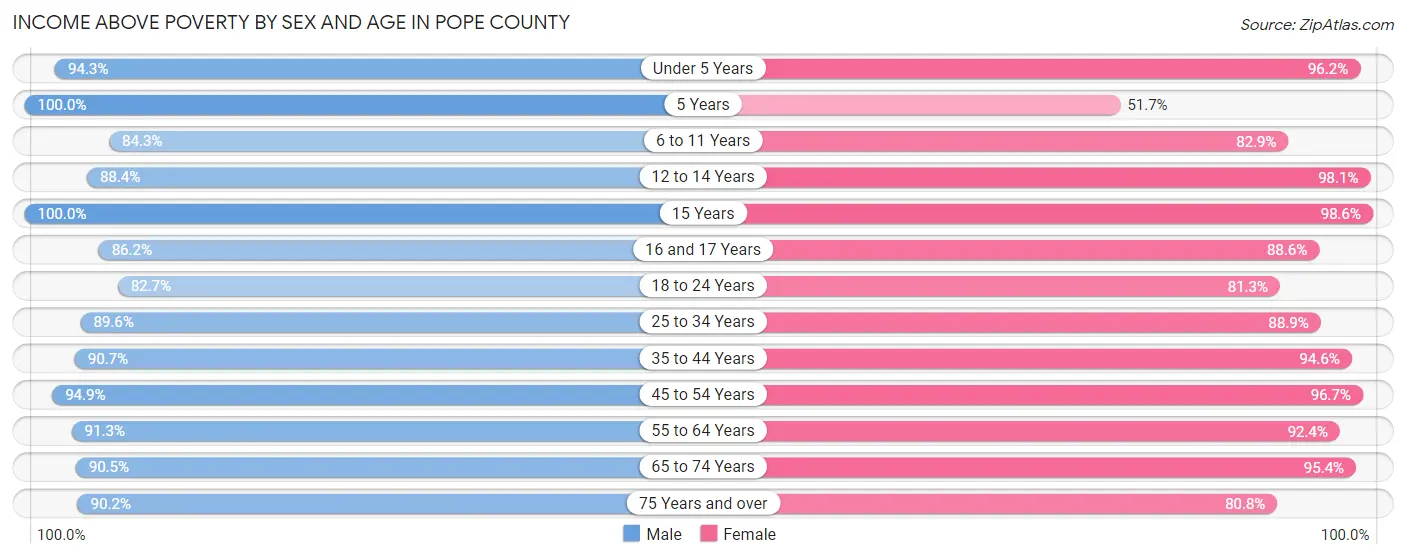
| Age Bracket | Male | Female |
| Under 5 Years | 300 (94.3%) | 252 (96.2%) |
| 5 Years | 56 (100.0%) | 30 (51.7%) |
| 6 to 11 Years | 355 (84.3%) | 305 (82.9%) |
| 12 to 14 Years | 206 (88.4%) | 204 (98.1%) |
| 15 Years | 70 (100.0%) | 68 (98.6%) |
| 16 and 17 Years | 144 (86.2%) | 93 (88.6%) |
| 18 to 24 Years | 330 (82.7%) | 252 (81.3%) |
| 25 to 34 Years | 518 (89.6%) | 519 (88.9%) |
| 35 to 44 Years | 622 (90.7%) | 581 (94.6%) |
| 45 to 54 Years | 572 (94.9%) | 527 (96.7%) |
| 55 to 64 Years | 804 (91.3%) | 829 (92.4%) |
| 65 to 74 Years | 771 (90.5%) | 729 (95.4%) |
| 75 Years and over | 430 (90.1%) | 459 (80.8%) |
| Total | 5,178 (90.2%) | 4,848 (90.6%) |
Income Below Poverty Among Married-Couple Families in Pope County
The poverty statistics for married-couple families in Pope County show that 3.6% or 100 of the total 2,795 families live below the poverty line. Families with 3 or 4 children have the highest poverty rate of 12.6%, comprising of 35 families. On the other hand, families with 5 or more children have the lowest poverty rate of 0.0%, which includes 0 families.
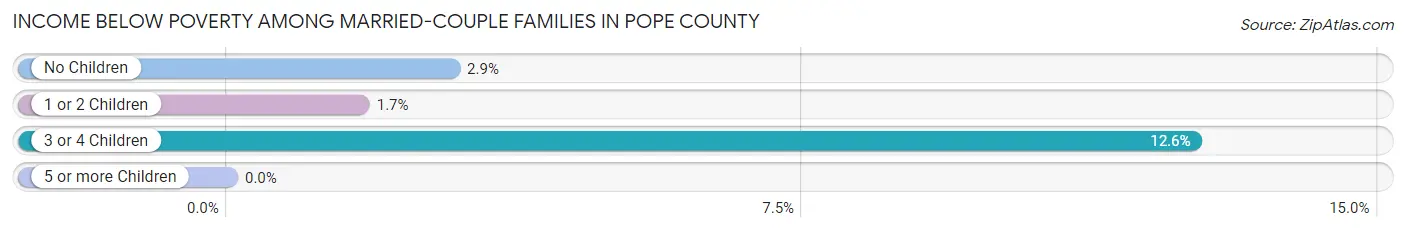
| Children | Above Poverty | Below Poverty |
| No Children | 1,810 (97.1%) | 54 (2.9%) |
| 1 or 2 Children | 630 (98.3%) | 11 (1.7%) |
| 3 or 4 Children | 243 (87.4%) | 35 (12.6%) |
| 5 or more Children | 12 (100.0%) | 0 (0.0%) |
| Total | 2,695 (96.4%) | 100 (3.6%) |
Income Below Poverty Among Single-Parent Households in Pope County
According to the poverty data in Pope County, 11.3% or 24 single-father households and 12.6% or 27 single-mother households are living below the poverty line. Among single-father households, those with 3 or 4 children have the highest poverty rate, with 1 households (25.0%) experiencing poverty. Likewise, among single-mother households, those with 3 or 4 children have the highest poverty rate, with 2 households (33.3%) falling below the poverty line.
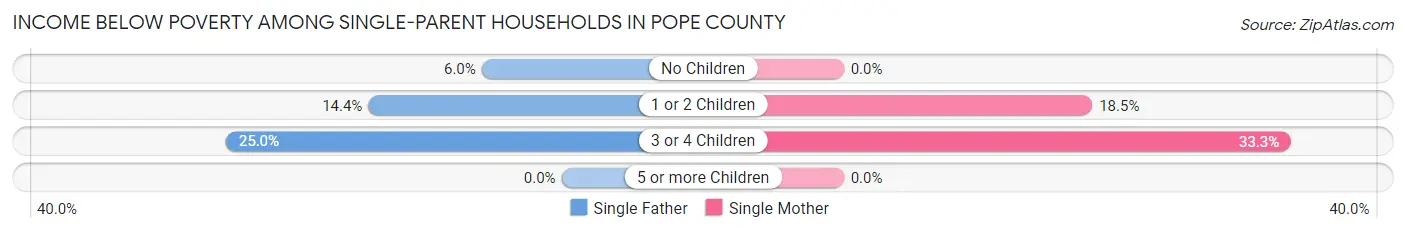
| Children | Single Father | Single Mother |
| No Children | 5 (5.9%) | 0 (0.0%) |
| 1 or 2 Children | 18 (14.4%) | 25 (18.5%) |
| 3 or 4 Children | 1 (25.0%) | 2 (33.3%) |
| 5 or more Children | 0 (0.0%) | 0 (0.0%) |
| Total | 24 (11.3%) | 27 (12.6%) |
Income Below Poverty Among Married-Couple vs Single-Parent Households in Pope County
The poverty data for Pope County shows that 100 of the married-couple family households (3.6%) and 51 of the single-parent households (11.9%) are living below the poverty level. Within the married-couple family households, those with 3 or 4 children have the highest poverty rate, with 35 households (12.6%) falling below the poverty line. Among the single-parent households, those with 3 or 4 children have the highest poverty rate, with 3 household (30.0%) living below poverty.

| Children | Married-Couple Families | Single-Parent Households |
| No Children | 54 (2.9%) | 5 (3.2%) |
| 1 or 2 Children | 11 (1.7%) | 43 (16.5%) |
| 3 or 4 Children | 35 (12.6%) | 3 (30.0%) |
| 5 or more Children | 0 (0.0%) | 0 (0.0%) |
| Total | 100 (3.6%) | 51 (11.9%) |
Race in Pope County
The most populous races in Pope County are White / Caucasian (10,712 | 94.7%), Two or more Races (335 | 3.0%), and Hispanic or Latino (210 | 1.9%).
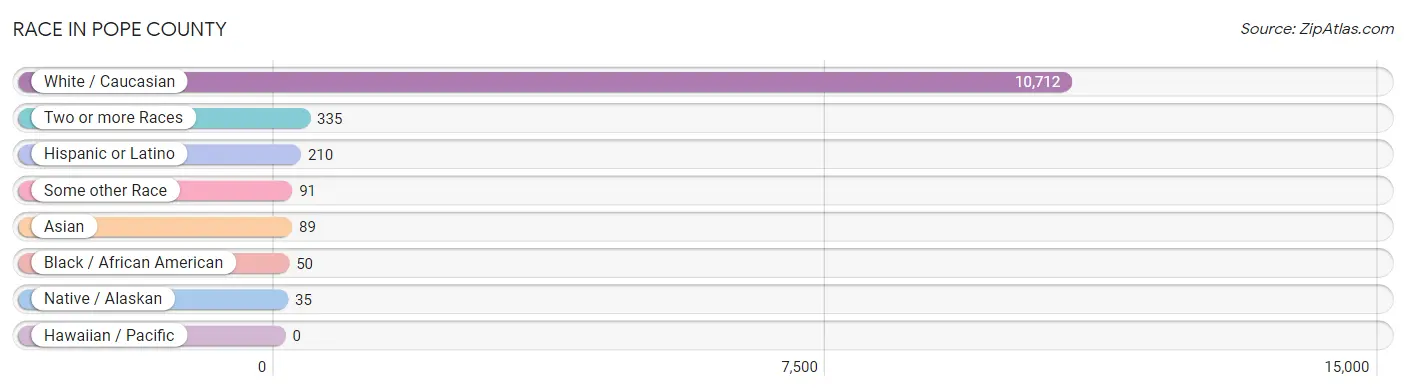
| Race | # Population | % Population |
| Asian | 89 | 0.8% |
| Black / African American | 50 | 0.4% |
| Hawaiian / Pacific | 0 | 0.0% |
| Hispanic or Latino | 210 | 1.9% |
| Native / Alaskan | 35 | 0.3% |
| White / Caucasian | 10,712 | 94.7% |
| Two or more Races | 335 | 3.0% |
| Some other Race | 91 | 0.8% |
| Total | 11,312 | 100.0% |
Ancestry in Pope County
The most populous ancestries reported in Pope County are German (4,255 | 37.6%), Norwegian (3,680 | 32.5%), Irish (800 | 7.1%), Swedish (739 | 6.5%), and English (451 | 4.0%), together accounting for 87.7% of all Pope County residents.
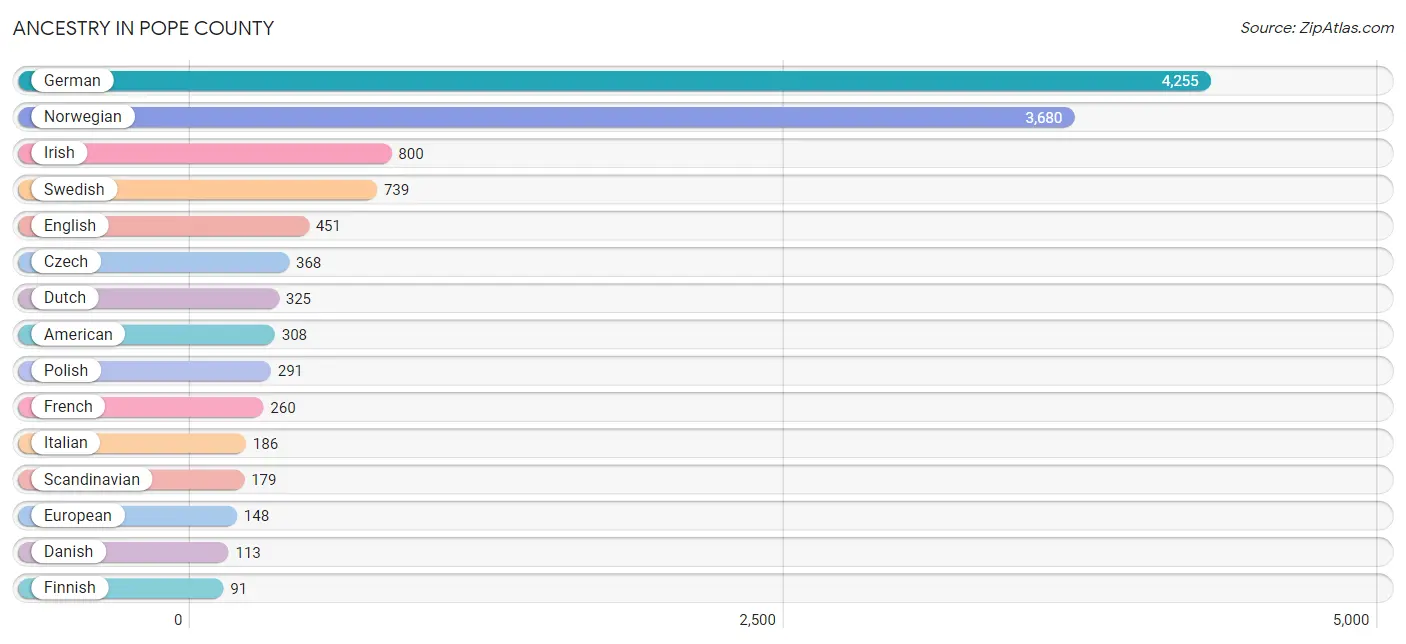
| Ancestry | # Population | % Population |
| American | 308 | 2.7% |
| Arab | 4 | 0.0% |
| Austrian | 10 | 0.1% |
| Belgian | 42 | 0.4% |
| Blackfeet | 2 | 0.0% |
| British | 9 | 0.1% |
| Bulgarian | 7 | 0.1% |
| Burmese | 18 | 0.2% |
| Cherokee | 8 | 0.1% |
| Chippewa | 12 | 0.1% |
| Choctaw | 2 | 0.0% |
| Colombian | 39 | 0.3% |
| Comanche | 1 | 0.0% |
| Croatian | 2 | 0.0% |
| Cuban | 9 | 0.1% |
| Czech | 368 | 3.3% |
| Czechoslovakian | 8 | 0.1% |
| Danish | 113 | 1.0% |
| Dutch | 325 | 2.9% |
| Eastern European | 10 | 0.1% |
| English | 451 | 4.0% |
| European | 148 | 1.3% |
| Finnish | 91 | 0.8% |
| French | 260 | 2.3% |
| French American Indian | 2 | 0.0% |
| French Canadian | 26 | 0.2% |
| German | 4,255 | 37.6% |
| Guyanese | 7 | 0.1% |
| Hungarian | 8 | 0.1% |
| Icelander | 8 | 0.1% |
| Indian (Asian) | 3 | 0.0% |
| Irish | 800 | 7.1% |
| Italian | 186 | 1.6% |
| Korean | 42 | 0.4% |
| Latvian | 5 | 0.0% |
| Lithuanian | 3 | 0.0% |
| Luxembourger | 12 | 0.1% |
| Mexican | 79 | 0.7% |
| Mexican American Indian | 12 | 0.1% |
| Native Hawaiian | 7 | 0.1% |
| Northern European | 22 | 0.2% |
| Norwegian | 3,680 | 32.5% |
| Pakistani | 1 | 0.0% |
| Palestinian | 4 | 0.0% |
| Pennsylvania German | 2 | 0.0% |
| Polish | 291 | 2.6% |
| Puerto Rican | 56 | 0.5% |
| Romanian | 2 | 0.0% |
| Russian | 18 | 0.2% |
| Scandinavian | 179 | 1.6% |
| Scotch-Irish | 42 | 0.4% |
| Scottish | 84 | 0.7% |
| Serbian | 4 | 0.0% |
| Sioux | 23 | 0.2% |
| Slovak | 5 | 0.0% |
| Slovene | 9 | 0.1% |
| Somali | 4 | 0.0% |
| South American | 39 | 0.3% |
| Spaniard | 16 | 0.1% |
| Sri Lankan | 32 | 0.3% |
| Subsaharan African | 4 | 0.0% |
| Swedish | 739 | 6.5% |
| Swiss | 35 | 0.3% |
| Ukrainian | 8 | 0.1% |
| Welsh | 31 | 0.3% | View All 65 Rows |
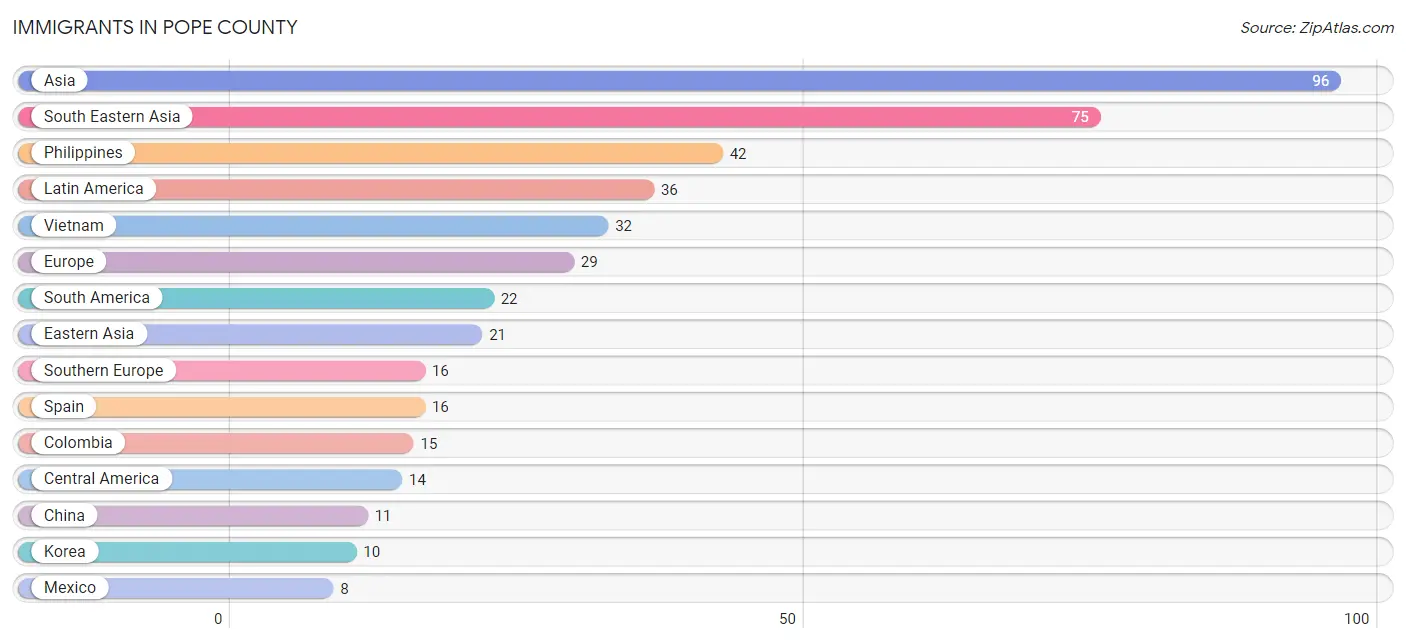
Immigrants in Pope County
The most numerous immigrant groups reported in Pope County came from Asia (96 | 0.9%), South Eastern Asia (75 | 0.7%), Philippines (42 | 0.4%), Latin America (36 | 0.3%), and Vietnam (32 | 0.3%), together accounting for 2.5% of all Pope County residents.
| Immigration Origin | # Population | % Population |
| Africa | 4 | 0.0% |
| Asia | 96 | 0.9% |
| Canada | 2 | 0.0% |
| Central America | 14 | 0.1% |
| China | 11 | 0.1% |
| Colombia | 15 | 0.1% |
| Eastern Asia | 21 | 0.2% |
| Eastern Europe | 7 | 0.1% |
| Europe | 29 | 0.3% |
| Germany | 2 | 0.0% |
| Guatemala | 6 | 0.1% |
| Guyana | 7 | 0.1% |
| Korea | 10 | 0.1% |
| Latin America | 36 | 0.3% |
| Latvia | 3 | 0.0% |
| Mexico | 8 | 0.1% |
| Netherlands | 4 | 0.0% |
| Philippines | 42 | 0.4% |
| South America | 22 | 0.2% |
| South Eastern Asia | 75 | 0.7% |
| Southern Europe | 16 | 0.1% |
| Spain | 16 | 0.1% |
| Thailand | 1 | 0.0% |
| Ukraine | 4 | 0.0% |
| Vietnam | 32 | 0.3% |
| Western Europe | 6 | 0.1% | View All 26 Rows |
Sex and Age in Pope County
Sex and Age in Pope County
The most populous age groups in Pope County are 65 to 69 Years (535 | 9.2%) for men and 60 to 64 Years (519 | 9.4%) for women.
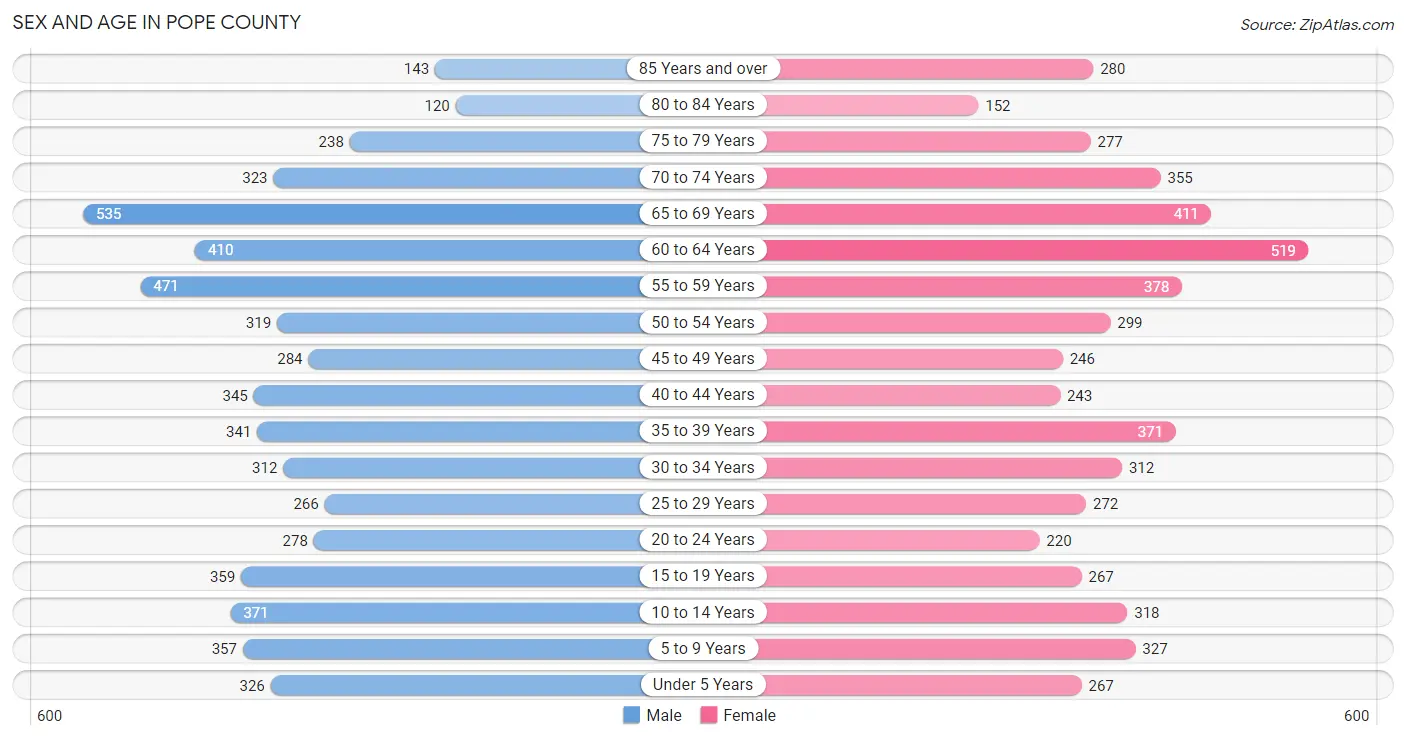
| Age Bracket | Male | Female |
| Under 5 Years | 326 (5.6%) | 267 (4.8%) |
| 5 to 9 Years | 357 (6.2%) | 327 (5.9%) |
| 10 to 14 Years | 371 (6.4%) | 318 (5.8%) |
| 15 to 19 Years | 359 (6.2%) | 267 (4.8%) |
| 20 to 24 Years | 278 (4.8%) | 220 (4.0%) |
| 25 to 29 Years | 266 (4.6%) | 272 (4.9%) |
| 30 to 34 Years | 312 (5.4%) | 312 (5.7%) |
| 35 to 39 Years | 341 (5.9%) | 371 (6.7%) |
| 40 to 44 Years | 345 (5.9%) | 243 (4.4%) |
| 45 to 49 Years | 284 (4.9%) | 246 (4.5%) |
| 50 to 54 Years | 319 (5.5%) | 299 (5.4%) |
| 55 to 59 Years | 471 (8.1%) | 378 (6.9%) |
| 60 to 64 Years | 410 (7.1%) | 519 (9.4%) |
| 65 to 69 Years | 535 (9.2%) | 411 (7.4%) |
| 70 to 74 Years | 323 (5.6%) | 355 (6.4%) |
| 75 to 79 Years | 238 (4.1%) | 277 (5.0%) |
| 80 to 84 Years | 120 (2.1%) | 152 (2.8%) |
| 85 Years and over | 143 (2.5%) | 280 (5.1%) |
| Total | 5,798 (100.0%) | 5,514 (100.0%) |
Families and Households in Pope County
Median Family Size in Pope County
The median family size in Pope County is 2.74 persons per family, with married-couple families (2,795 | 86.8%) accounting for the largest median family size of 2.8 persons per family. On the other hand, single male/father families (213 | 6.6%) represent the smallest median family size with 2.32 persons per family.

| Family Type | # Families | Family Size |
| Married-Couple | 2,795 (86.8%) | 2.80 |
| Single Male/Father | 213 (6.6%) | 2.32 |
| Single Female/Mother | 214 (6.6%) | 2.44 |
| Total Families | 3,222 (100.0%) | 2.74 |
Median Household Size in Pope County
The median household size in Pope County is 2.27 persons per household, with married-couple households (2,795 | 57.1%) accounting for the largest median household size of 2.82 persons per household. non-family households (1,675 | 34.2%) represent the smallest median household size with 1.23 persons per household.

| Household Type | # Households | Household Size |
| Married-Couple | 2,795 (57.1%) | 2.82 |
| Single Male/Father | 213 (4.3%) | 2.77 |
| Single Female/Mother | 214 (4.4%) | 2.68 |
| Non-family | 1,675 (34.2%) | 1.23 |
| Total Households | 4,897 (100.0%) | 2.27 |
Household Size by Marriage Status in Pope County
Out of a total of 4,897 households in Pope County, 3,222 (65.8%) are family households, while 1,675 (34.2%) are nonfamily households. The most numerous type of family households are 2-person households, comprising 1,836, and the most common type of nonfamily households are 1-person households, comprising 1,364.
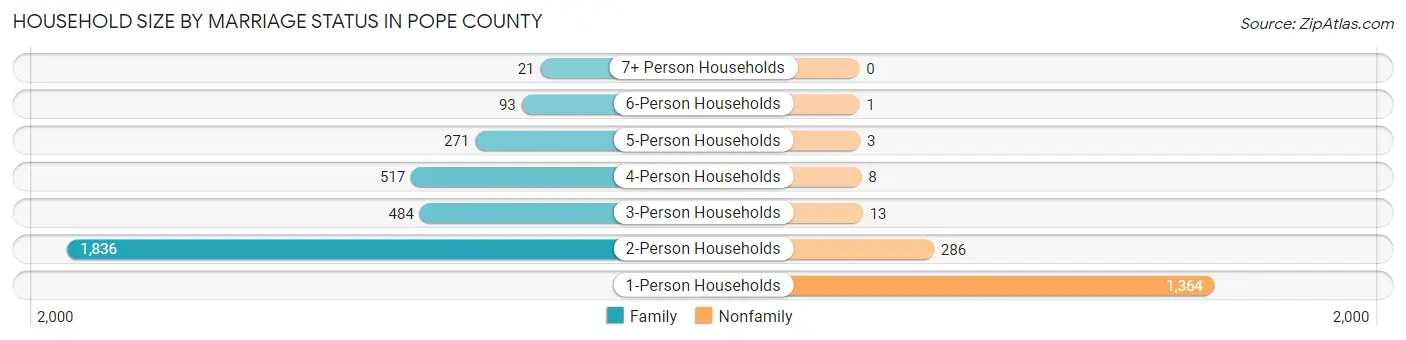
| Household Size | Family Households | Nonfamily Households |
| 1-Person Households | - | 1,364 (27.9%) |
| 2-Person Households | 1,836 (37.5%) | 286 (5.8%) |
| 3-Person Households | 484 (9.9%) | 13 (0.3%) |
| 4-Person Households | 517 (10.6%) | 8 (0.2%) |
| 5-Person Households | 271 (5.5%) | 3 (0.1%) |
| 6-Person Households | 93 (1.9%) | 1 (0.0%) |
| 7+ Person Households | 21 (0.4%) | 0 (0.0%) |
| Total | 3,222 (65.8%) | 1,675 (34.2%) |
Female Fertility in Pope County
Fertility by Age in Pope County
Average fertility rate in Pope County is 102.0 births per 1,000 women. Women in the age bracket of 20 to 34 years have the highest fertility rate with 213.0 births per 1,000 women. Women in the age bracket of 20 to 34 years acount for 84.2% of all women with births.
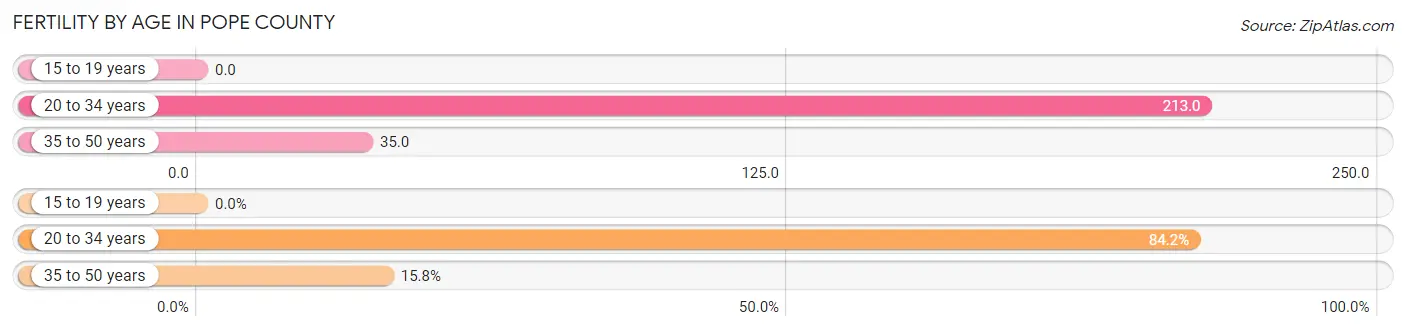
| Age Bracket | Women with Births | Births / 1,000 Women |
| 15 to 19 years | 0 (0.0%) | 0.0 |
| 20 to 34 years | 171 (84.2%) | 213.0 |
| 35 to 50 years | 32 (15.8%) | 35.0 |
| Total | 203 (100.0%) | 102.0 |
Fertility by Age by Marriage Status in Pope County
64.5% of women with births (203) in Pope County are married. The highest percentage of unmarried women with births falls into 20 to 34 years age bracket with 39.8% of them unmarried at the time of birth, while the lowest percentage of unmarried women with births belong to 35 to 50 years age bracket with 12.5% of them unmarried.
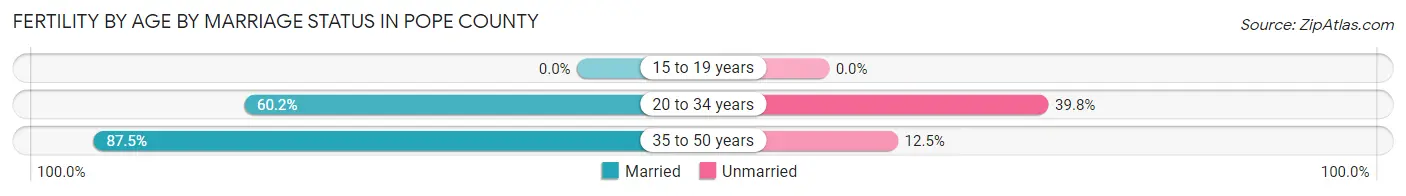
| Age Bracket | Married | Unmarried |
| 15 to 19 years | 0 (0.0%) | 0 (0.0%) |
| 20 to 34 years | 103 (60.2%) | 68 (39.8%) |
| 35 to 50 years | 28 (87.5%) | 4 (12.5%) |
| Total | 131 (64.5%) | 72 (35.5%) |
Fertility by Education in Pope County
Average fertility rate in Pope County is 102.0 births per 1,000 women. Women with the education attainment of graduate degree have the highest fertility rate of 250.0 births per 1,000 women, while women with the education attainment of less than high school have the lowest fertility at 53.0 births per 1,000 women. Women with the education attainment of college or associate's degree represent 33.5% of all women with births.
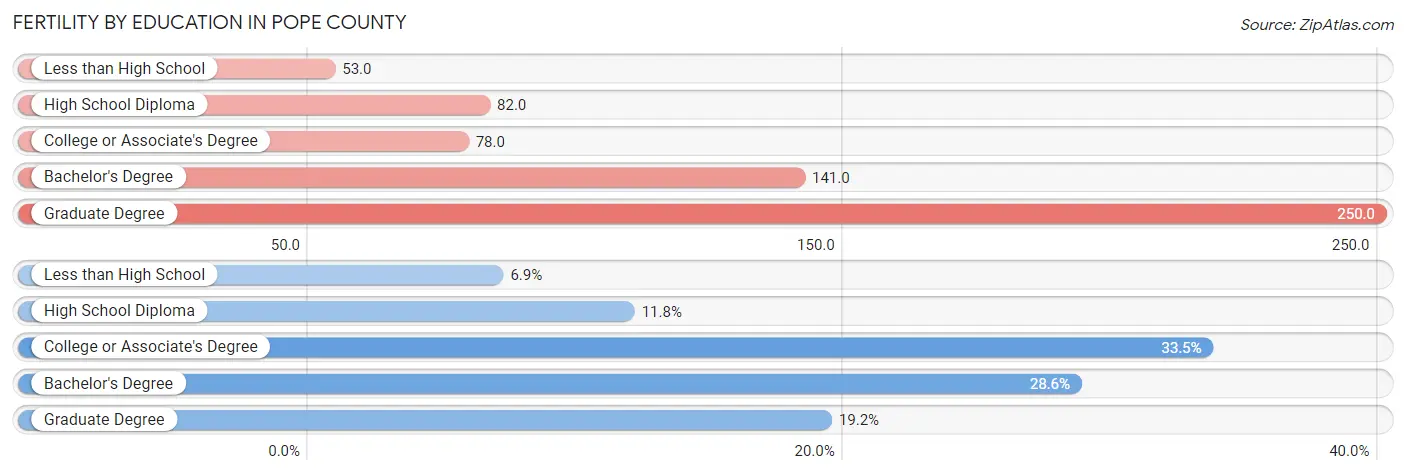
| Educational Attainment | Women with Births | Births / 1,000 Women |
| Less than High School | 14 (6.9%) | 53.0 |
| High School Diploma | 24 (11.8%) | 82.0 |
| College or Associate's Degree | 68 (33.5%) | 78.0 |
| Bachelor's Degree | 58 (28.6%) | 141.0 |
| Graduate Degree | 39 (19.2%) | 250.0 |
| Total | 203 (100.0%) | 102.0 |
Fertility by Education by Marriage Status in Pope County
35.5% of women with births in Pope County are unmarried. Women with the educational attainment of bachelor's degree are most likely to be married with 89.7% of them married at childbirth, while women with the educational attainment of high school diploma are least likely to be married with 100.0% of them unmarried at childbirth.

| Educational Attainment | Married | Unmarried |
| Less than High School | 5 (35.7%) | 9 (64.3%) |
| High School Diploma | 0 (0.0%) | 24 (100.0%) |
| College or Associate's Degree | 55 (80.9%) | 13 (19.1%) |
| Bachelor's Degree | 52 (89.7%) | 6 (10.3%) |
| Graduate Degree | 19 (48.7%) | 20 (51.3%) |
| Total | 131 (64.5%) | 72 (35.5%) |
Employment Characteristics in Pope County
Employment by Class of Employer in Pope County
Among the 5,730 employed individuals in Pope County, private company employees (3,510 | 61.3%), not-for-profit organizations (599 | 10.4%), and self-employed (not incorporated) (574 | 10.0%) make up the most common classes of employment.
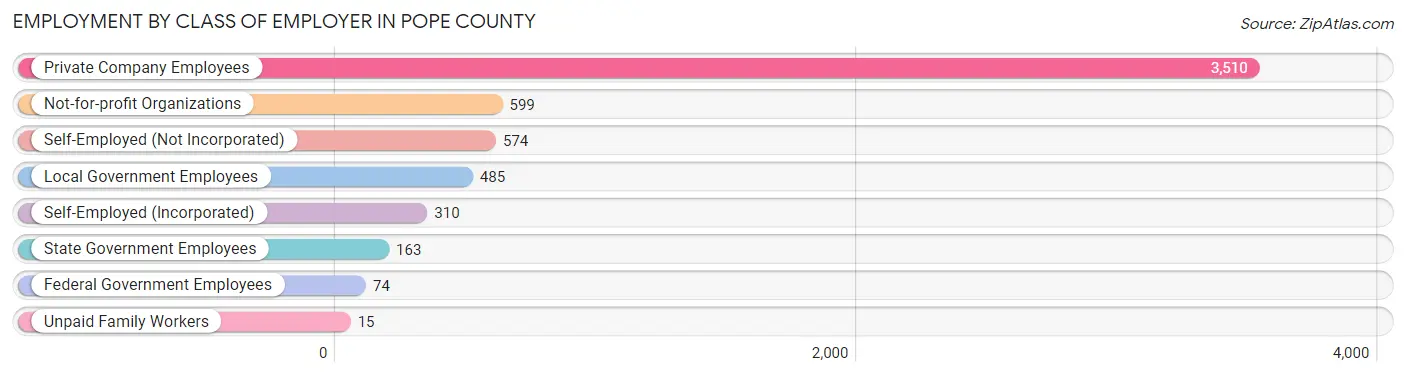
| Employer Class | # Employees | % Employees |
| Private Company Employees | 3,510 | 61.3% |
| Self-Employed (Incorporated) | 310 | 5.4% |
| Self-Employed (Not Incorporated) | 574 | 10.0% |
| Not-for-profit Organizations | 599 | 10.4% |
| Local Government Employees | 485 | 8.5% |
| State Government Employees | 163 | 2.8% |
| Federal Government Employees | 74 | 1.3% |
| Unpaid Family Workers | 15 | 0.3% |
| Total | 5,730 | 100.0% |
Employment Status by Age in Pope County
According to the labor force statistics for Pope County, out of the total population over 16 years of age (9,207), 63.9% or 5,883 individuals are in the labor force, with 1.0% or 59 of them unemployed. The age group with the highest labor force participation rate is 35 to 44 years, with 92.3% or 1,200 individuals in the labor force. Within the labor force, the 16 to 19 years age range has the highest percentage of unemployed individuals, with 2.5% or 7 of them being unemployed.

| Age Bracket | In Labor Force | Unemployed |
| 16 to 19 Years | 280 (57.5%) | 7 (2.5%) |
| 20 to 24 Years | 450 (90.4%) | 4 (0.9%) |
| 25 to 29 Years | 493 (91.6%) | 2 (0.4%) |
| 30 to 34 Years | 567 (90.9%) | 3 (0.5%) |
| 35 to 44 Years | 1,200 (92.3%) | 7 (0.6%) |
| 45 to 54 Years | 1,014 (88.3%) | 15 (1.5%) |
| 55 to 59 Years | 719 (84.7%) | 2 (0.3%) |
| 60 to 64 Years | 621 (66.8%) | 13 (2.1%) |
| 65 to 74 Years | 486 (29.9%) | 4 (0.8%) |
| 75 Years and over | 52 (4.3%) | 1 (1.9%) |
| Total | 5,883 (63.9%) | 59 (1.0%) |
Employment Status by Educational Attainment in Pope County
According to labor force statistics for Pope County, 85.6% of individuals (4,612) out of the total population between 25 and 64 years of age (5,388) are in the labor force, with 0.9% or 42 of them being unemployed. The group with the highest labor force participation rate are those with the educational attainment of bachelor's degree or higher, with 92.1% or 1,183 individuals in the labor force. Within the labor force, individuals with less than high school education have the highest percentage of unemployment, with 1.9% or 2 of them being unemployed.
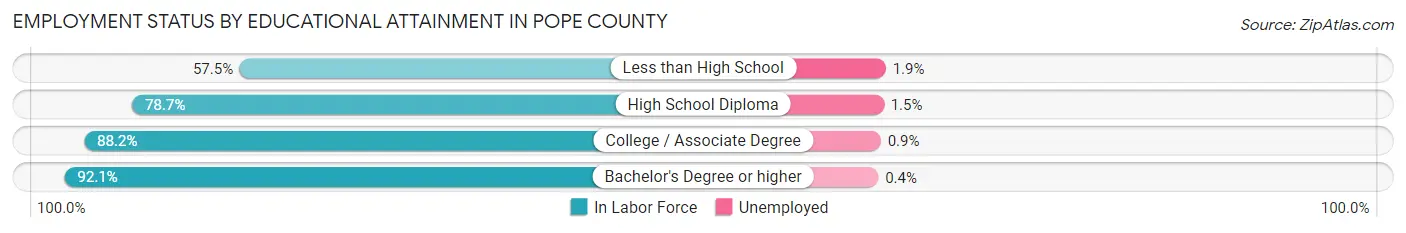
| Educational Attainment | In Labor Force | Unemployed |
| Less than High School | 104 (57.5%) | 3 (1.9%) |
| High School Diploma | 1,103 (78.7%) | 21 (1.5%) |
| College / Associate Degree | 2,224 (88.2%) | 23 (0.9%) |
| Bachelor's Degree or higher | 1,183 (92.1%) | 5 (0.4%) |
| Total | 4,612 (85.6%) | 48 (0.9%) |
Employment Occupations by Sex in Pope County
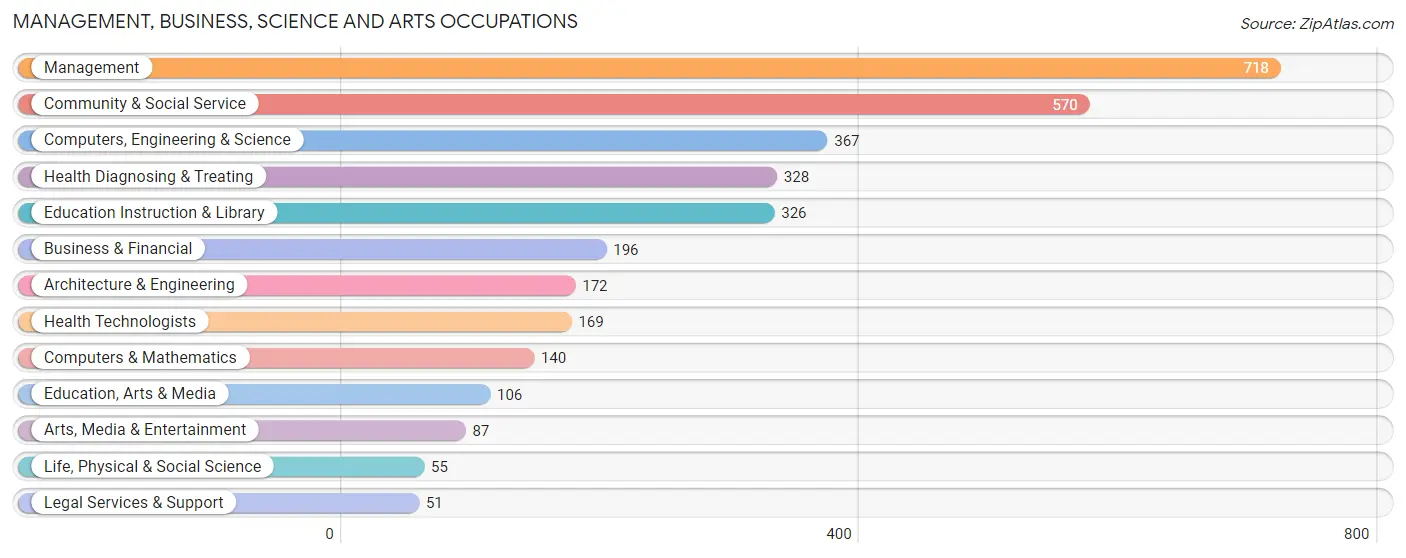
Management, Business, Science and Arts Occupations
The most common Management, Business, Science and Arts occupations in Pope County are Management (718 | 12.4%), Community & Social Service (570 | 9.8%), Computers, Engineering & Science (367 | 6.3%), Health Diagnosing & Treating (328 | 5.7%), and Education Instruction & Library (326 | 5.6%).
Management, Business, Science and Arts Occupations by Sex
Within the Management, Business, Science and Arts occupations in Pope County, the most male-oriented occupations are Management (78.0%), Architecture & Engineering (64.5%), and Business & Financial (46.9%), while the most female-oriented occupations are Health Diagnosing & Treating (89.3%), Health Technologists (88.8%), and Legal Services & Support (86.3%).

| Occupation | Male | Female |
| Management | 560 (78.0%) | 158 (22.0%) |
| Business & Financial | 92 (46.9%) | 104 (53.1%) |
| Computers, Engineering & Science | 162 (44.1%) | 205 (55.9%) |
| Computers & Mathematics | 35 (25.0%) | 105 (75.0%) |
| Architecture & Engineering | 111 (64.5%) | 61 (35.5%) |
| Life, Physical & Social Science | 16 (29.1%) | 39 (70.9%) |
| Community & Social Service | 101 (17.7%) | 469 (82.3%) |
| Education, Arts & Media | 22 (20.7%) | 84 (79.2%) |
| Legal Services & Support | 7 (13.7%) | 44 (86.3%) |
| Education Instruction & Library | 53 (16.3%) | 273 (83.7%) |
| Arts, Media & Entertainment | 19 (21.8%) | 68 (78.2%) |
| Health Diagnosing & Treating | 35 (10.7%) | 293 (89.3%) |
| Health Technologists | 19 (11.2%) | 150 (88.8%) |
| Total (Category) | 950 (43.6%) | 1,229 (56.4%) |
| Total (Overall) | 3,079 (53.1%) | 2,716 (46.9%) |
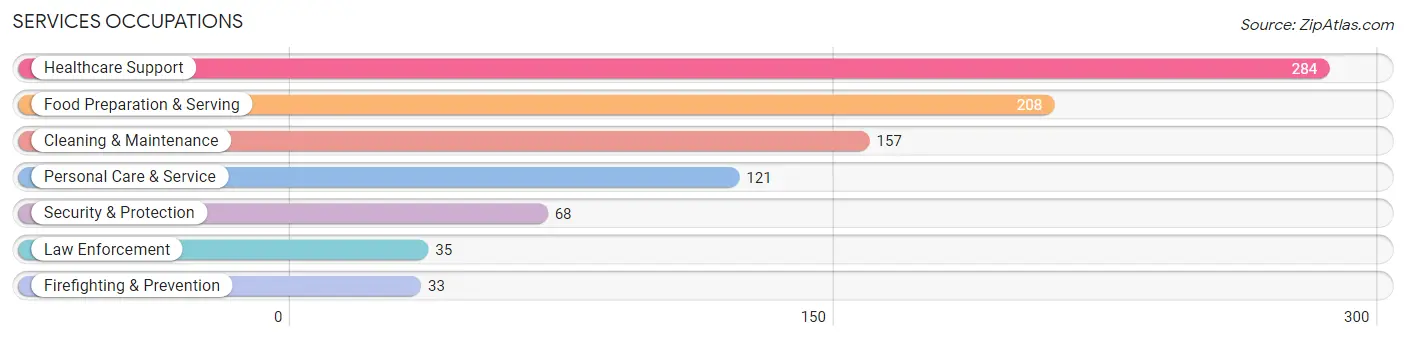
Services Occupations
The most common Services occupations in Pope County are Healthcare Support (284 | 4.9%), Food Preparation & Serving (208 | 3.6%), Cleaning & Maintenance (157 | 2.7%), Personal Care & Service (121 | 2.1%), and Security & Protection (68 | 1.2%).
Services Occupations by Sex
Within the Services occupations in Pope County, the most male-oriented occupations are Firefighting & Prevention (63.6%), Security & Protection (61.8%), and Law Enforcement (60.0%), while the most female-oriented occupations are Healthcare Support (94.0%), Personal Care & Service (76.9%), and Food Preparation & Serving (62.0%).
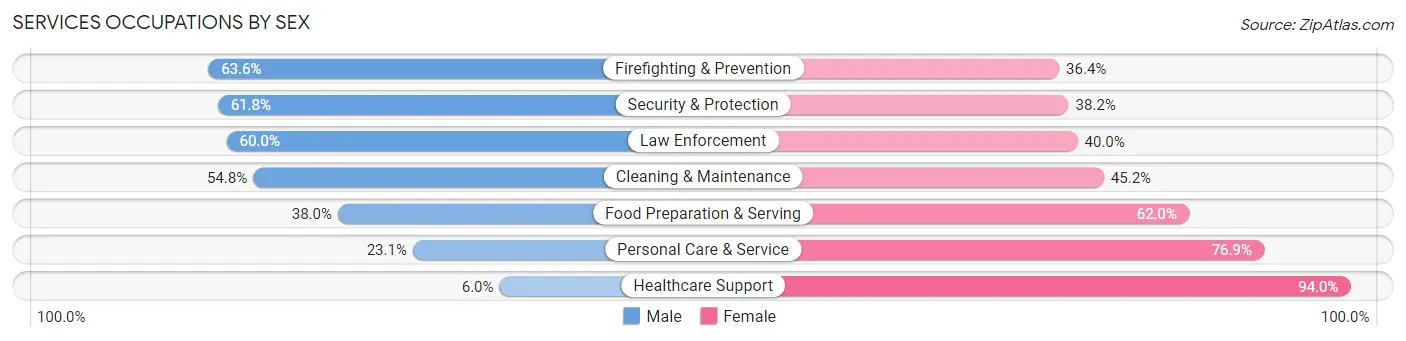
| Occupation | Male | Female |
| Healthcare Support | 17 (6.0%) | 267 (94.0%) |
| Security & Protection | 42 (61.8%) | 26 (38.2%) |
| Firefighting & Prevention | 21 (63.6%) | 12 (36.4%) |
| Law Enforcement | 21 (60.0%) | 14 (40.0%) |
| Food Preparation & Serving | 79 (38.0%) | 129 (62.0%) |
| Cleaning & Maintenance | 86 (54.8%) | 71 (45.2%) |
| Personal Care & Service | 28 (23.1%) | 93 (76.9%) |
| Total (Category) | 252 (30.1%) | 586 (69.9%) |
| Total (Overall) | 3,079 (53.1%) | 2,716 (46.9%) |
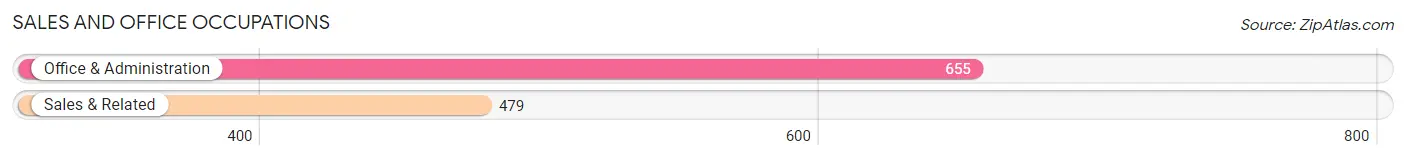
Sales and Office Occupations
The most common Sales and Office occupations in Pope County are Office & Administration (655 | 11.3%), and Sales & Related (479 | 8.3%).
Sales and Office Occupations by Sex

| Occupation | Male | Female |
| Sales & Related | 313 (65.3%) | 166 (34.7%) |
| Office & Administration | 110 (16.8%) | 545 (83.2%) |
| Total (Category) | 423 (37.3%) | 711 (62.7%) |
| Total (Overall) | 3,079 (53.1%) | 2,716 (46.9%) |
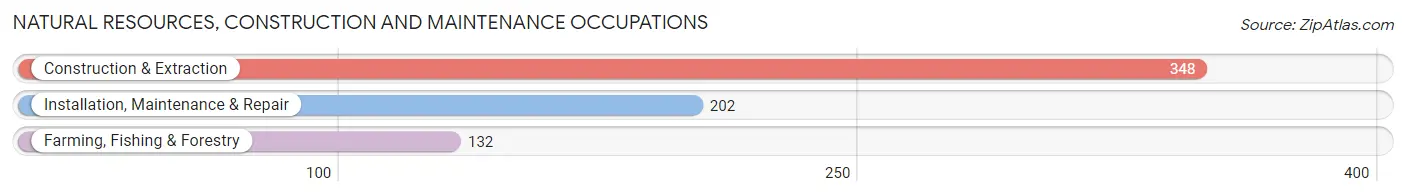
Natural Resources, Construction and Maintenance Occupations
The most common Natural Resources, Construction and Maintenance occupations in Pope County are Construction & Extraction (348 | 6.0%), Installation, Maintenance & Repair (202 | 3.5%), and Farming, Fishing & Forestry (132 | 2.3%).
Natural Resources, Construction and Maintenance Occupations by Sex
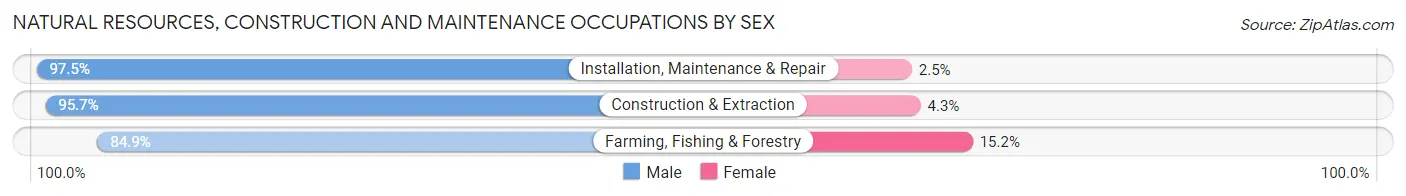
| Occupation | Male | Female |
| Farming, Fishing & Forestry | 112 (84.9%) | 20 (15.1%) |
| Construction & Extraction | 333 (95.7%) | 15 (4.3%) |
| Installation, Maintenance & Repair | 197 (97.5%) | 5 (2.5%) |
| Total (Category) | 642 (94.1%) | 40 (5.9%) |
| Total (Overall) | 3,079 (53.1%) | 2,716 (46.9%) |
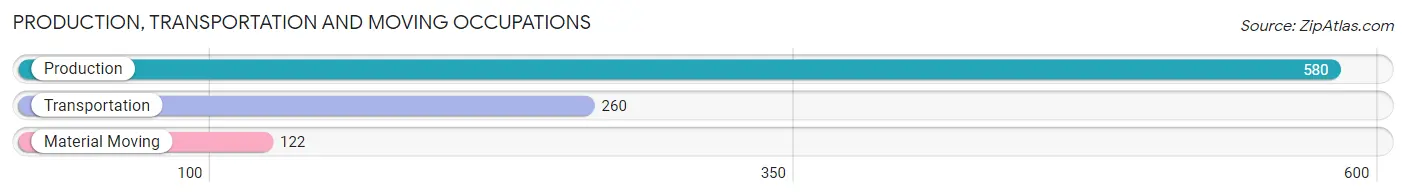
Production, Transportation and Moving Occupations
The most common Production, Transportation and Moving occupations in Pope County are Production (580 | 10.0%), Transportation (260 | 4.5%), and Material Moving (122 | 2.1%).
Production, Transportation and Moving Occupations by Sex
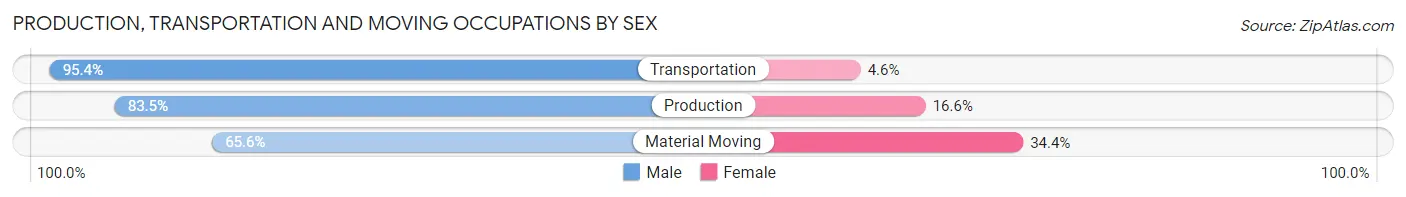
| Occupation | Male | Female |
| Production | 484 (83.5%) | 96 (16.6%) |
| Transportation | 248 (95.4%) | 12 (4.6%) |
| Material Moving | 80 (65.6%) | 42 (34.4%) |
| Total (Category) | 812 (84.4%) | 150 (15.6%) |
| Total (Overall) | 3,079 (53.1%) | 2,716 (46.9%) |
Employment Industries by Sex in Pope County
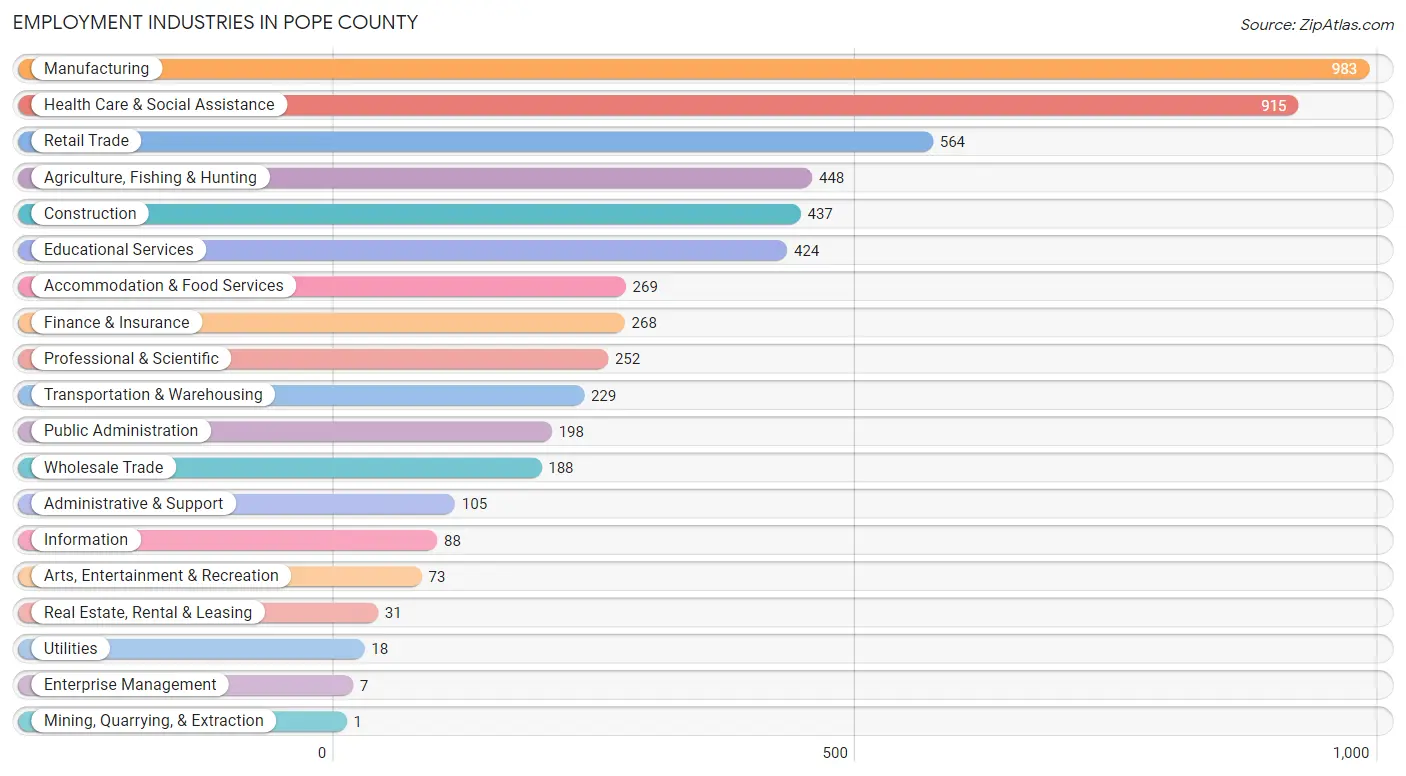
Employment Industries in Pope County
The major employment industries in Pope County include Manufacturing (983 | 17.0%), Health Care & Social Assistance (915 | 15.8%), Retail Trade (564 | 9.7%), Agriculture, Fishing & Hunting (448 | 7.7%), and Construction (437 | 7.5%).
Employment Industries by Sex in Pope County
The Pope County industries that see more men than women are Mining, Quarrying, & Extraction (100.0%), Utilities (100.0%), and Construction (94.7%), whereas the industries that tend to have a higher number of women are Health Care & Social Assistance (84.3%), Educational Services (81.4%), and Professional & Scientific (74.6%).

| Industry | Male | Female |
| Agriculture, Fishing & Hunting | 393 (87.7%) | 55 (12.3%) |
| Mining, Quarrying, & Extraction | 1 (100.0%) | 0 (0.0%) |
| Construction | 414 (94.7%) | 23 (5.3%) |
| Manufacturing | 749 (76.2%) | 234 (23.8%) |
| Wholesale Trade | 134 (71.3%) | 54 (28.7%) |
| Retail Trade | 274 (48.6%) | 290 (51.4%) |
| Transportation & Warehousing | 186 (81.2%) | 43 (18.8%) |
| Utilities | 18 (100.0%) | 0 (0.0%) |
| Information | 52 (59.1%) | 36 (40.9%) |
| Finance & Insurance | 85 (31.7%) | 183 (68.3%) |
| Real Estate, Rental & Leasing | 17 (54.8%) | 14 (45.2%) |
| Professional & Scientific | 64 (25.4%) | 188 (74.6%) |
| Enterprise Management | 4 (57.1%) | 3 (42.9%) |
| Administrative & Support | 71 (67.6%) | 34 (32.4%) |
| Educational Services | 79 (18.6%) | 345 (81.4%) |
| Health Care & Social Assistance | 144 (15.7%) | 771 (84.3%) |
| Arts, Entertainment & Recreation | 39 (53.4%) | 34 (46.6%) |
| Accommodation & Food Services | 101 (37.6%) | 168 (62.5%) |
| Public Administration | 75 (37.9%) | 123 (62.1%) |
| Total | 3,079 (53.1%) | 2,716 (46.9%) |
Education in Pope County
School Enrollment in Pope County
The most common levels of schooling among the 2,245 students in Pope County are elementary school (563 | 25.1%), middle school (550 | 24.5%), and high school (548 | 24.4%).
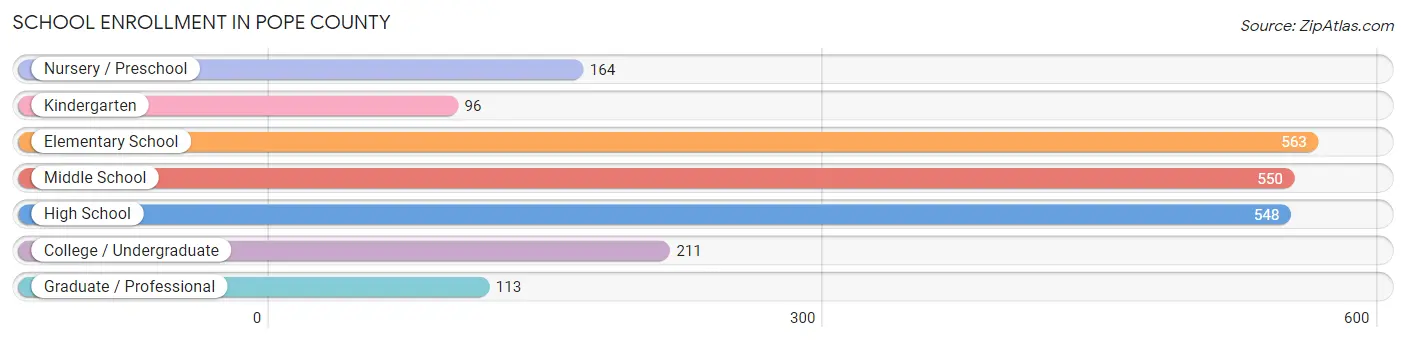
| School Level | # Students | % Students |
| Nursery / Preschool | 164 | 7.3% |
| Kindergarten | 96 | 4.3% |
| Elementary School | 563 | 25.1% |
| Middle School | 550 | 24.5% |
| High School | 548 | 24.4% |
| College / Undergraduate | 211 | 9.4% |
| Graduate / Professional | 113 | 5.0% |
| Total | 2,245 | 100.0% |
School Enrollment by Age by Funding Source in Pope County
Out of a total of 2,245 students who are enrolled in schools in Pope County, 265 (11.8%) attend a private institution, while the remaining 1,980 (88.2%) are enrolled in public schools. The age group of 25 to 34 year olds has the highest likelihood of being enrolled in private schools, with 23 (48.9% in the age bracket) enrolled. Conversely, the age group of 18 to 19 year olds has the lowest likelihood of being enrolled in a private school, with 135 (97.8% in the age bracket) attending a public institution.
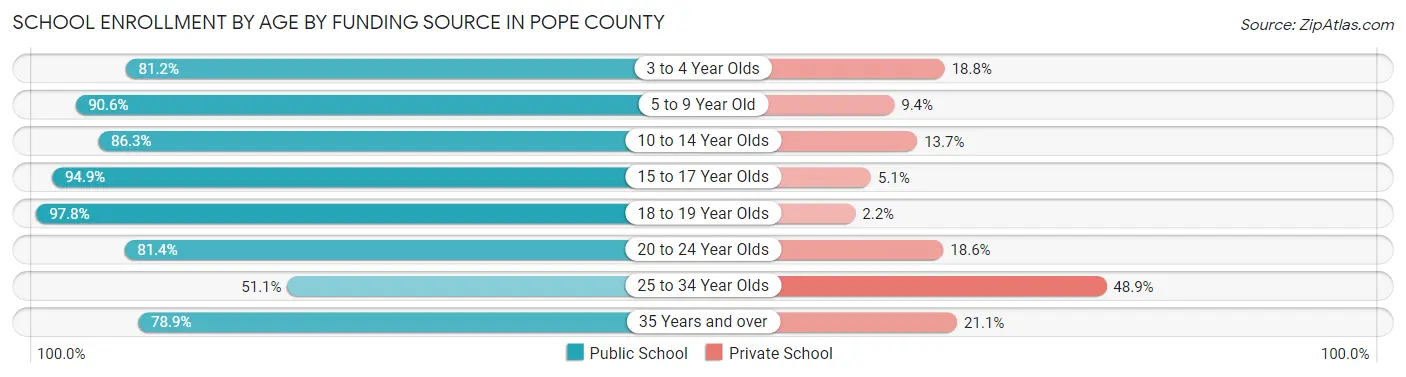
| Age Bracket | Public School | Private School |
| 3 to 4 Year Olds | 69 (81.2%) | 16 (18.8%) |
| 5 to 9 Year Old | 605 (90.6%) | 63 (9.4%) |
| 10 to 14 Year Olds | 586 (86.3%) | 93 (13.7%) |
| 15 to 17 Year Olds | 372 (94.9%) | 20 (5.1%) |
| 18 to 19 Year Olds | 135 (97.8%) | 3 (2.2%) |
| 20 to 24 Year Olds | 92 (81.4%) | 21 (18.6%) |
| 25 to 34 Year Olds | 24 (51.1%) | 23 (48.9%) |
| 35 Years and over | 97 (78.9%) | 26 (21.1%) |
| Total | 1,980 (88.2%) | 265 (11.8%) |
Educational Attainment by Field of Study in Pope County
Education (415 | 20.8%), business (387 | 19.4%), bio, nature & agricultural (187 | 9.4%), science & technology (168 | 8.4%), and arts & humanities (144 | 7.2%) are the most common fields of study among 1,995 individuals in Pope County who have obtained a bachelor's degree or higher.
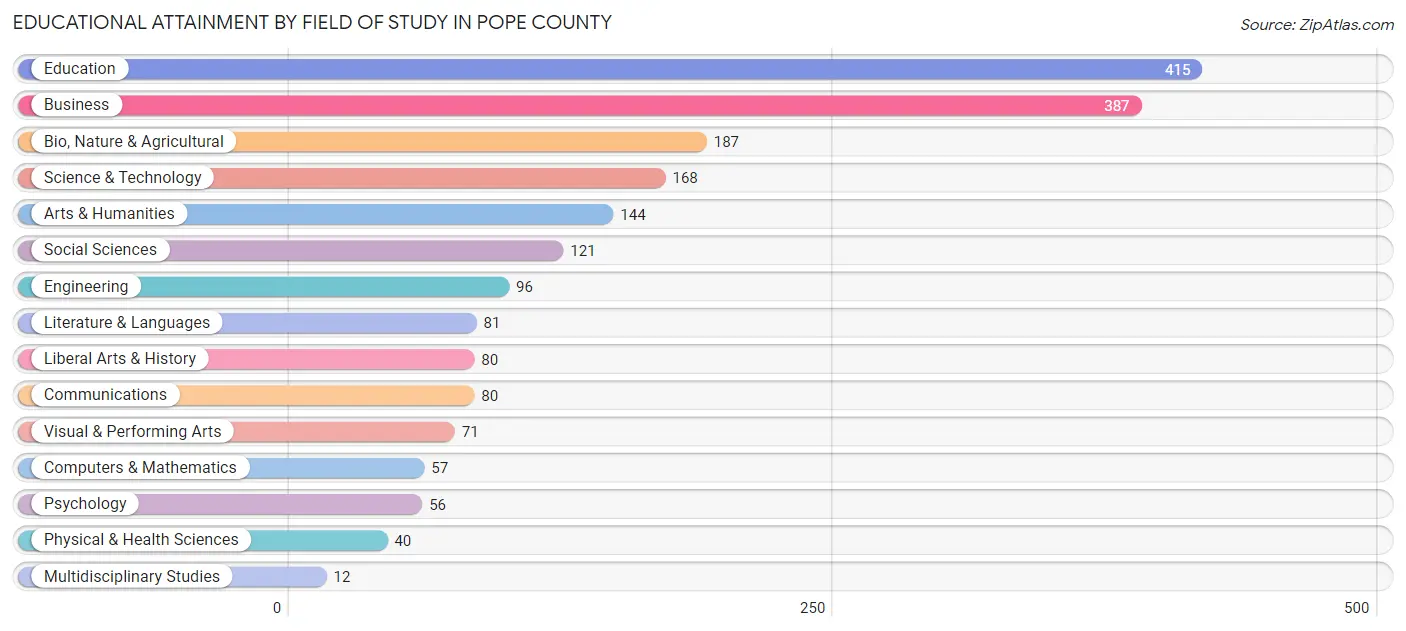
| Field of Study | # Graduates | % Graduates |
| Computers & Mathematics | 57 | 2.9% |
| Bio, Nature & Agricultural | 187 | 9.4% |
| Physical & Health Sciences | 40 | 2.0% |
| Psychology | 56 | 2.8% |
| Social Sciences | 121 | 6.1% |
| Engineering | 96 | 4.8% |
| Multidisciplinary Studies | 12 | 0.6% |
| Science & Technology | 168 | 8.4% |
| Business | 387 | 19.4% |
| Education | 415 | 20.8% |
| Literature & Languages | 81 | 4.1% |
| Liberal Arts & History | 80 | 4.0% |
| Visual & Performing Arts | 71 | 3.6% |
| Communications | 80 | 4.0% |
| Arts & Humanities | 144 | 7.2% |
| Total | 1,995 | 100.0% |
Transportation & Commute in Pope County
Vehicle Availability by Sex in Pope County
The most prevalent vehicle ownership categories in Pope County are males with 2 vehicles (1,191, accounting for 38.8%) and females with 2 vehicles (1,051, making up 45.0%).
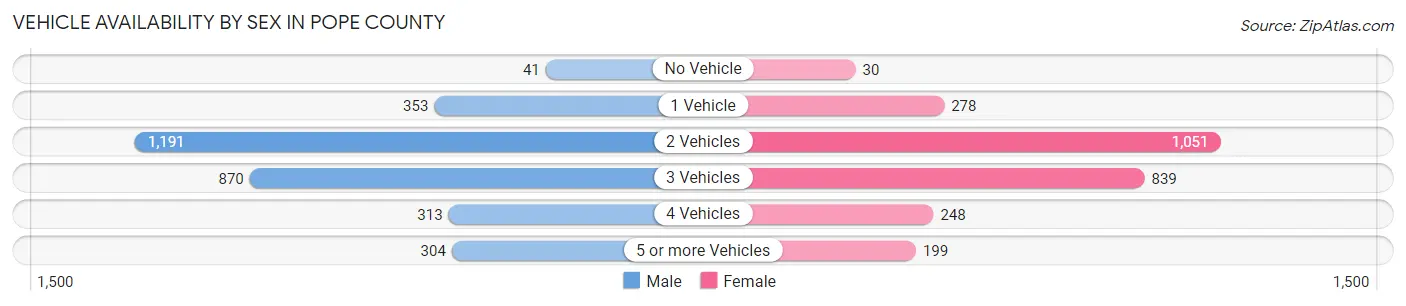
| Vehicles Available | Male | Female |
| No Vehicle | 41 (1.3%) | 30 (1.1%) |
| 1 Vehicle | 353 (11.5%) | 278 (10.5%) |
| 2 Vehicles | 1,191 (38.8%) | 1,051 (39.7%) |
| 3 Vehicles | 870 (28.3%) | 839 (31.7%) |
| 4 Vehicles | 313 (10.2%) | 248 (9.4%) |
| 5 or more Vehicles | 304 (9.9%) | 199 (7.5%) |
| Total | 3,072 (100.0%) | 2,645 (100.0%) |
Commute Time in Pope County
The most frequently occuring commute durations in Pope County are 5 to 9 minutes (871 commuters, 16.8%), 15 to 19 minutes (739 commuters, 14.2%), and 10 to 14 minutes (737 commuters, 14.2%).

| Commute Time | # Commuters | % Commuters |
| Less than 5 Minutes | 560 | 10.8% |
| 5 to 9 Minutes | 871 | 16.8% |
| 10 to 14 Minutes | 737 | 14.2% |
| 15 to 19 Minutes | 739 | 14.2% |
| 20 to 24 Minutes | 555 | 10.7% |
| 25 to 29 Minutes | 410 | 7.9% |
| 30 to 34 Minutes | 572 | 11.0% |
| 35 to 39 Minutes | 142 | 2.7% |
| 40 to 44 Minutes | 139 | 2.7% |
| 45 to 59 Minutes | 157 | 3.0% |
| 60 to 89 Minutes | 129 | 2.5% |
| 90 or more Minutes | 178 | 3.4% |
Commute Time by Sex in Pope County
The most common commute times in Pope County are 5 to 9 minutes (457 commuters, 16.1%) for males and 5 to 9 minutes (414 commuters, 17.6%) for females.
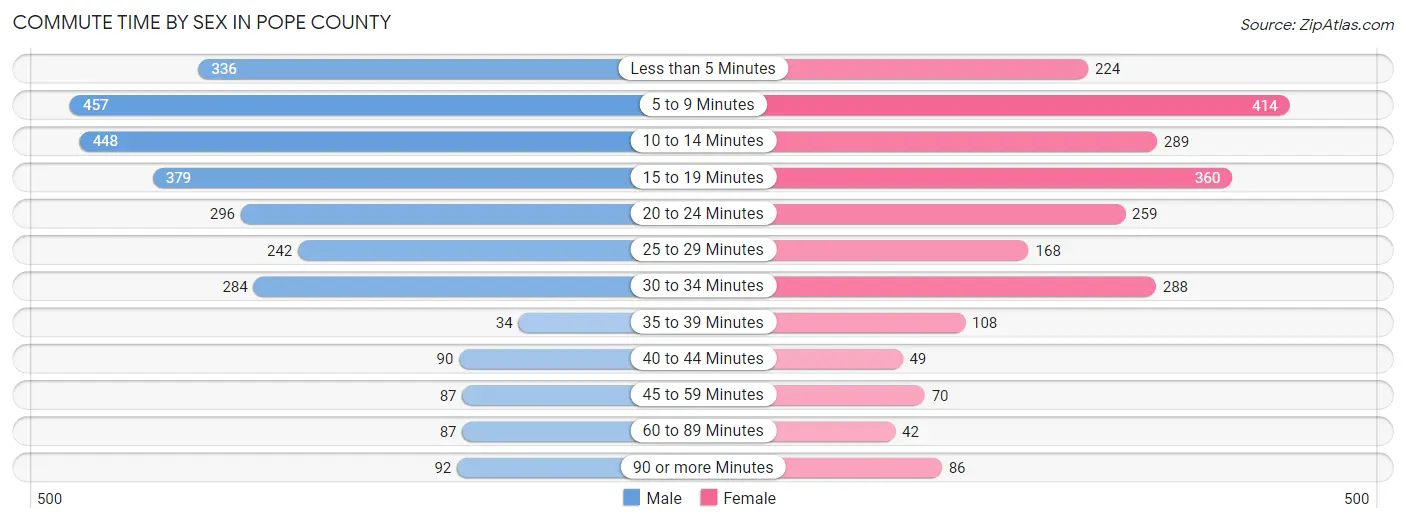
| Commute Time | Male | Female |
| Less than 5 Minutes | 336 (11.9%) | 224 (9.5%) |
| 5 to 9 Minutes | 457 (16.1%) | 414 (17.6%) |
| 10 to 14 Minutes | 448 (15.8%) | 289 (12.3%) |
| 15 to 19 Minutes | 379 (13.4%) | 360 (15.3%) |
| 20 to 24 Minutes | 296 (10.4%) | 259 (11.0%) |
| 25 to 29 Minutes | 242 (8.6%) | 168 (7.1%) |
| 30 to 34 Minutes | 284 (10.0%) | 288 (12.2%) |
| 35 to 39 Minutes | 34 (1.2%) | 108 (4.6%) |
| 40 to 44 Minutes | 90 (3.2%) | 49 (2.1%) |
| 45 to 59 Minutes | 87 (3.1%) | 70 (3.0%) |
| 60 to 89 Minutes | 87 (3.1%) | 42 (1.8%) |
| 90 or more Minutes | 92 (3.3%) | 86 (3.6%) |
Time of Departure to Work by Sex in Pope County
The most frequent times of departure to work in Pope County are 7:30 AM to 7:59 AM (445, 15.7%) for males and 7:00 AM to 7:29 AM (522, 22.2%) for females.

| Time of Departure | Male | Female |
| 12:00 AM to 4:59 AM | 234 (8.3%) | 47 (2.0%) |
| 5:00 AM to 5:29 AM | 241 (8.5%) | 52 (2.2%) |
| 5:30 AM to 5:59 AM | 229 (8.1%) | 86 (3.6%) |
| 6:00 AM to 6:29 AM | 258 (9.1%) | 190 (8.1%) |
| 6:30 AM to 6:59 AM | 330 (11.7%) | 318 (13.5%) |
| 7:00 AM to 7:29 AM | 422 (14.9%) | 522 (22.2%) |
| 7:30 AM to 7:59 AM | 445 (15.7%) | 434 (18.4%) |
| 8:00 AM to 8:29 AM | 175 (6.2%) | 180 (7.6%) |
| 8:30 AM to 8:59 AM | 31 (1.1%) | 70 (3.0%) |
| 9:00 AM to 9:59 AM | 76 (2.7%) | 88 (3.7%) |
| 10:00 AM to 10:59 AM | 24 (0.9%) | 40 (1.7%) |
| 11:00 AM to 11:59 AM | 10 (0.4%) | 29 (1.2%) |
| 12:00 PM to 3:59 PM | 222 (7.8%) | 160 (6.8%) |
| 4:00 PM to 11:59 PM | 135 (4.8%) | 141 (6.0%) |
| Total | 2,832 (100.0%) | 2,357 (100.0%) |
Housing Occupancy in Pope County
Occupancy by Ownership in Pope County
Of the total 4,897 dwellings in Pope County, owner-occupied units account for 3,944 (80.5%), while renter-occupied units make up 953 (19.5%).
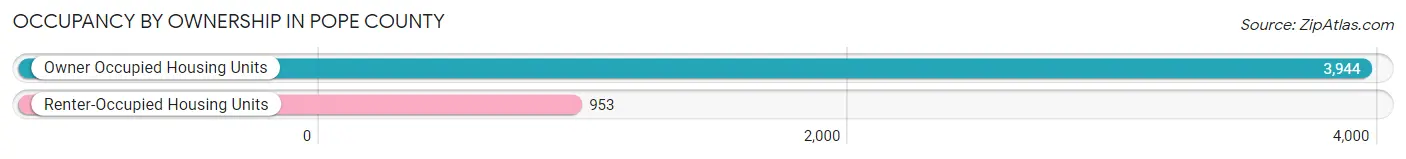
| Occupancy | # Housing Units | % Housing Units |
| Owner Occupied Housing Units | 3,944 | 80.5% |
| Renter-Occupied Housing Units | 953 | 19.5% |
| Total Occupied Housing Units | 4,897 | 100.0% |
Occupancy by Household Size in Pope County
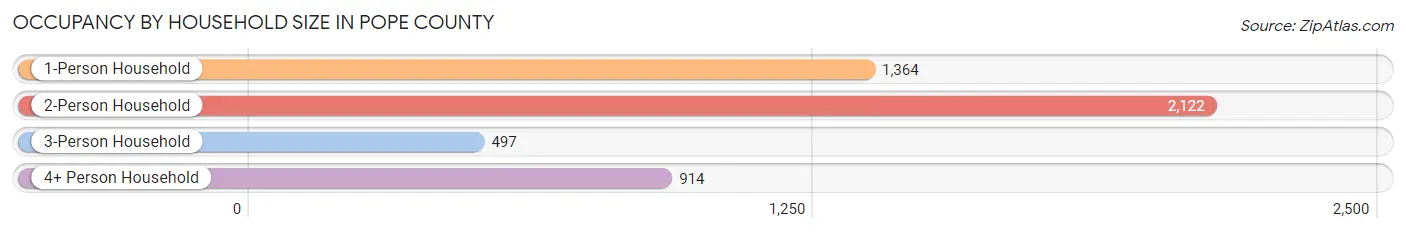
| Household Size | # Housing Units | % Housing Units |
| 1-Person Household | 1,364 | 27.9% |
| 2-Person Household | 2,122 | 43.3% |
| 3-Person Household | 497 | 10.2% |
| 4+ Person Household | 914 | 18.7% |
| Total Housing Units | 4,897 | 100.0% |
Occupancy by Ownership by Household Size in Pope County

| Household Size | Owner-occupied | Renter-occupied |
| 1-Person Household | 786 (57.6%) | 578 (42.4%) |
| 2-Person Household | 1,886 (88.9%) | 236 (11.1%) |
| 3-Person Household | 457 (91.9%) | 40 (8.1%) |
| 4+ Person Household | 815 (89.2%) | 99 (10.8%) |
| Total Housing Units | 3,944 (80.5%) | 953 (19.5%) |
Occupancy by Educational Attainment in Pope County
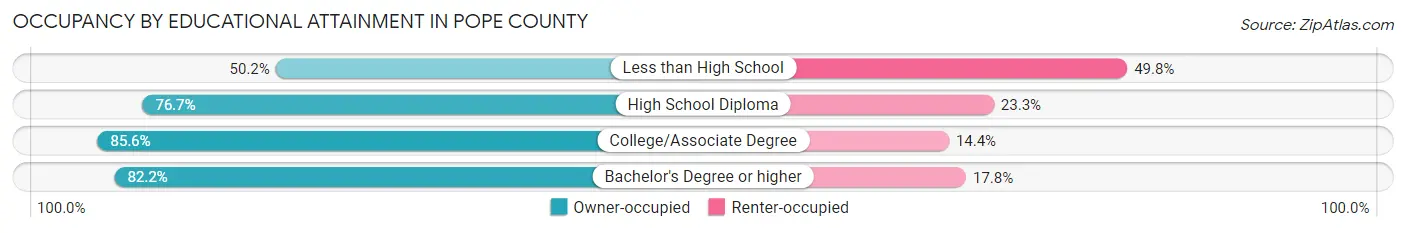
| Household Size | Owner-occupied | Renter-occupied |
| Less than High School | 108 (50.2%) | 107 (49.8%) |
| High School Diploma | 1,133 (76.7%) | 345 (23.3%) |
| College/Associate Degree | 1,767 (85.6%) | 298 (14.4%) |
| Bachelor's Degree or higher | 936 (82.2%) | 203 (17.8%) |
Occupancy by Age of Householder in Pope County
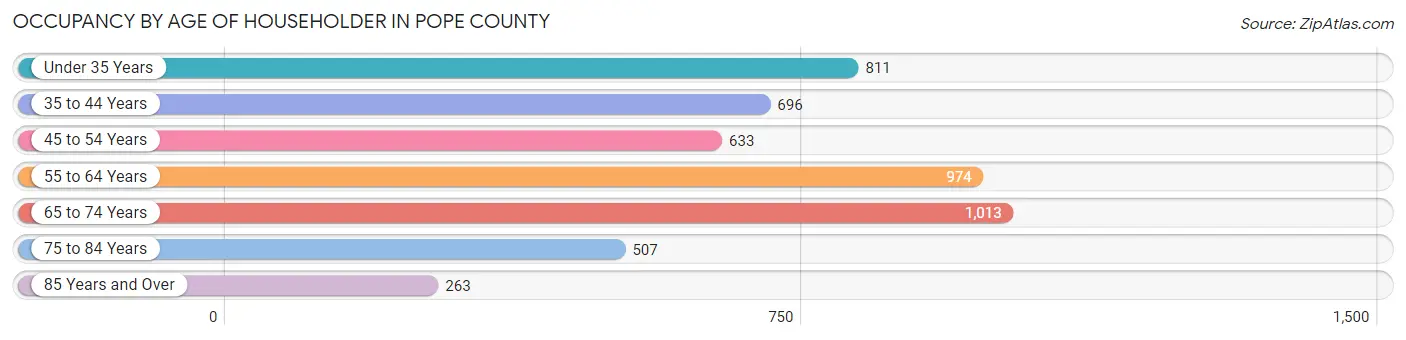
| Age Bracket | # Households | % Households |
| Under 35 Years | 811 | 16.6% |
| 35 to 44 Years | 696 | 14.2% |
| 45 to 54 Years | 633 | 12.9% |
| 55 to 64 Years | 974 | 19.9% |
| 65 to 74 Years | 1,013 | 20.7% |
| 75 to 84 Years | 507 | 10.3% |
| 85 Years and Over | 263 | 5.4% |
| Total | 4,897 | 100.0% |
Housing Finances in Pope County
Median Income by Occupancy in Pope County
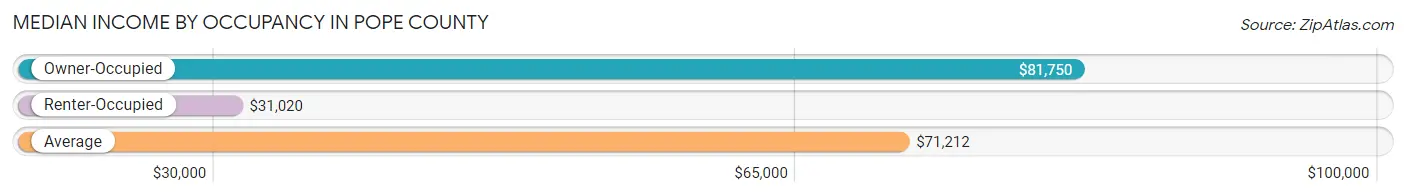
| Occupancy Type | # Households | Median Income |
| Owner-Occupied | 3,944 (80.5%) | $81,750 |
| Renter-Occupied | 953 (19.5%) | $31,020 |
| Average | 4,897 (100.0%) | $71,212 |
Occupancy by Householder Income Bracket in Pope County
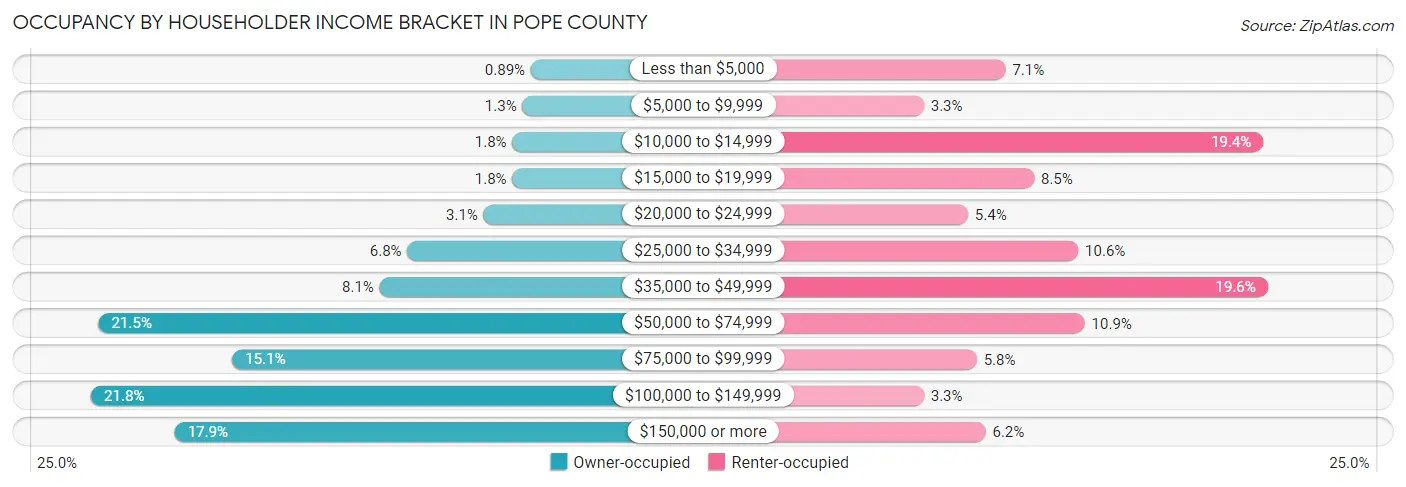
| Income Bracket | Owner-occupied | Renter-occupied |
| Less than $5,000 | 35 (0.9%) | 68 (7.1%) |
| $5,000 to $9,999 | 51 (1.3%) | 31 (3.3%) |
| $10,000 to $14,999 | 70 (1.8%) | 185 (19.4%) |
| $15,000 to $19,999 | 70 (1.8%) | 81 (8.5%) |
| $20,000 to $24,999 | 124 (3.1%) | 51 (5.3%) |
| $25,000 to $34,999 | 267 (6.8%) | 101 (10.6%) |
| $35,000 to $49,999 | 319 (8.1%) | 187 (19.6%) |
| $50,000 to $74,999 | 847 (21.5%) | 104 (10.9%) |
| $75,000 to $99,999 | 596 (15.1%) | 55 (5.8%) |
| $100,000 to $149,999 | 861 (21.8%) | 31 (3.3%) |
| $150,000 or more | 704 (17.8%) | 59 (6.2%) |
| Total | 3,944 (100.0%) | 953 (100.0%) |
Monthly Housing Cost Tiers in Pope County
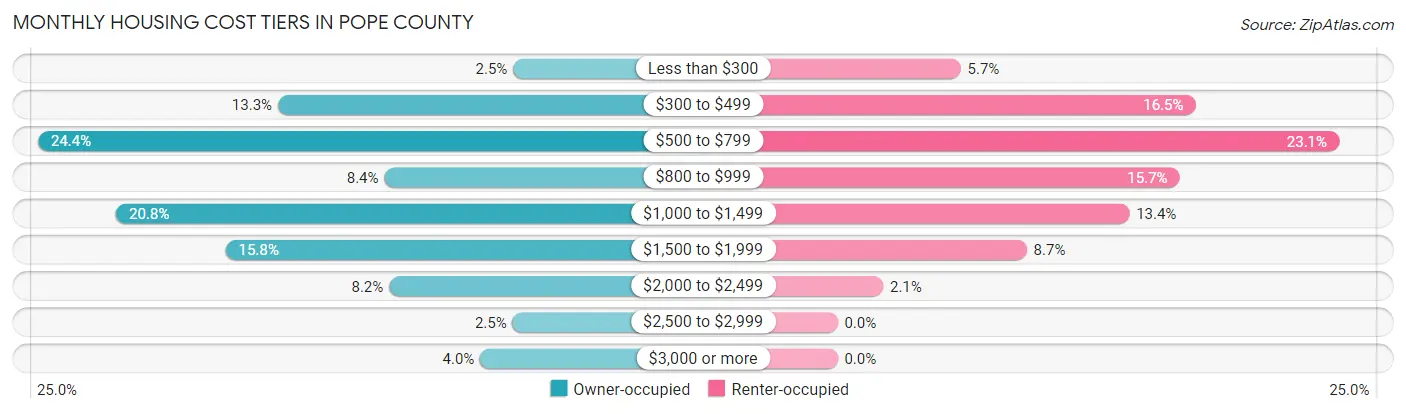
| Monthly Cost | Owner-occupied | Renter-occupied |
| Less than $300 | 99 (2.5%) | 54 (5.7%) |
| $300 to $499 | 526 (13.3%) | 157 (16.5%) |
| $500 to $799 | 962 (24.4%) | 220 (23.1%) |
| $800 to $999 | 333 (8.4%) | 150 (15.7%) |
| $1,000 to $1,499 | 820 (20.8%) | 128 (13.4%) |
| $1,500 to $1,999 | 621 (15.8%) | 83 (8.7%) |
| $2,000 to $2,499 | 324 (8.2%) | 20 (2.1%) |
| $2,500 to $2,999 | 100 (2.5%) | 0 (0.0%) |
| $3,000 or more | 159 (4.0%) | 0 (0.0%) |
| Total | 3,944 (100.0%) | 953 (100.0%) |
Physical Housing Characteristics in Pope County
Housing Structures in Pope County
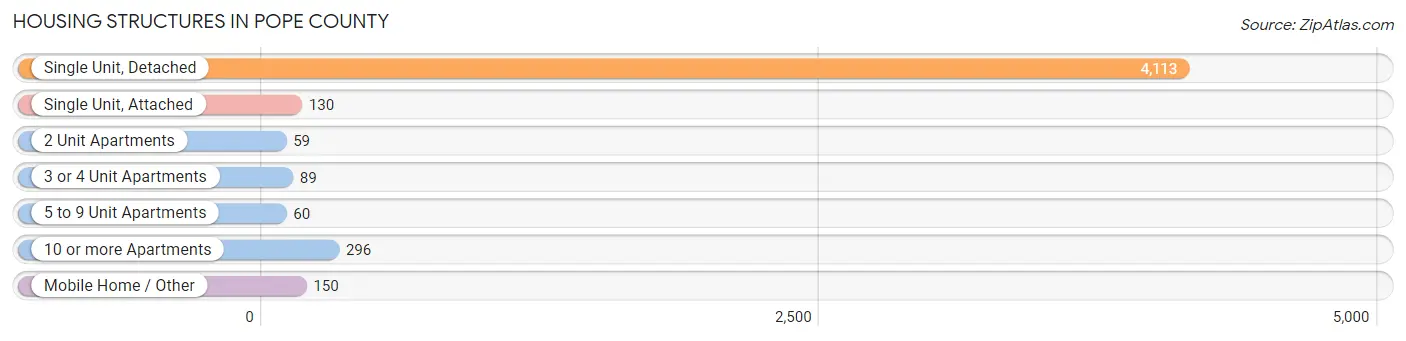
| Structure Type | # Housing Units | % Housing Units |
| Single Unit, Detached | 4,113 | 84.0% |
| Single Unit, Attached | 130 | 2.6% |
| 2 Unit Apartments | 59 | 1.2% |
| 3 or 4 Unit Apartments | 89 | 1.8% |
| 5 to 9 Unit Apartments | 60 | 1.2% |
| 10 or more Apartments | 296 | 6.0% |
| Mobile Home / Other | 150 | 3.1% |
| Total | 4,897 | 100.0% |
Housing Structures by Occupancy in Pope County

| Structure Type | Owner-occupied | Renter-occupied |
| Single Unit, Detached | 3,719 (90.4%) | 394 (9.6%) |
| Single Unit, Attached | 91 (70.0%) | 39 (30.0%) |
| 2 Unit Apartments | 17 (28.8%) | 42 (71.2%) |
| 3 or 4 Unit Apartments | 3 (3.4%) | 86 (96.6%) |
| 5 to 9 Unit Apartments | 0 (0.0%) | 60 (100.0%) |
| 10 or more Apartments | 0 (0.0%) | 296 (100.0%) |
| Mobile Home / Other | 114 (76.0%) | 36 (24.0%) |
| Total | 3,944 (80.5%) | 953 (19.5%) |
Housing Structures by Number of Rooms in Pope County

| Number of Rooms | Owner-occupied | Renter-occupied |
| 1 Room | 4 (0.1%) | 41 (4.3%) |
| 2 or 3 Rooms | 166 (4.2%) | 301 (31.6%) |
| 4 or 5 Rooms | 889 (22.5%) | 353 (37.0%) |
| 6 or 7 Rooms | 1,228 (31.1%) | 146 (15.3%) |
| 8 or more Rooms | 1,657 (42.0%) | 112 (11.7%) |
| Total | 3,944 (100.0%) | 953 (100.0%) |
Housing Structure by Heating Type in Pope County

| Heating Type | Owner-occupied | Renter-occupied |
| Utility Gas | 1,349 (34.2%) | 378 (39.7%) |
| Bottled, Tank, or LP Gas | 1,787 (45.3%) | 183 (19.2%) |
| Electricity | 459 (11.6%) | 306 (32.1%) |
| Fuel Oil or Kerosene | 132 (3.4%) | 53 (5.6%) |
| Coal or Coke | 1 (0.0%) | 0 (0.0%) |
| All other Fuels | 216 (5.5%) | 31 (3.3%) |
| No Fuel Used | 0 (0.0%) | 2 (0.2%) |
| Total | 3,944 (100.0%) | 953 (100.0%) |
Household Vehicle Usage in Pope County
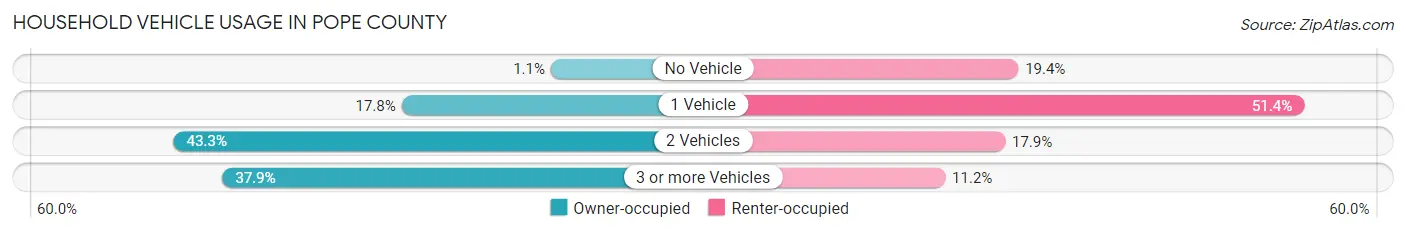
| Vehicles per Household | Owner-occupied | Renter-occupied |
| No Vehicle | 42 (1.1%) | 185 (19.4%) |
| 1 Vehicle | 701 (17.8%) | 490 (51.4%) |
| 2 Vehicles | 1,708 (43.3%) | 171 (17.9%) |
| 3 or more Vehicles | 1,493 (37.9%) | 107 (11.2%) |
| Total | 3,944 (100.0%) | 953 (100.0%) |
Real Estate & Mortgages in Pope County
Real Estate and Mortgage Overview in Pope County
| Characteristic | Without Mortgage | With Mortgage |
| Housing Units | 1,662 | 2,282 |
| Median Property Value | $222,800 | $227,100 |
| Median Household Income | $67,965 | $478 |
| Monthly Housing Costs | $557 | $154 |
| Real Estate Taxes | $1,892 | $29 |
Property Value by Mortgage Status in Pope County
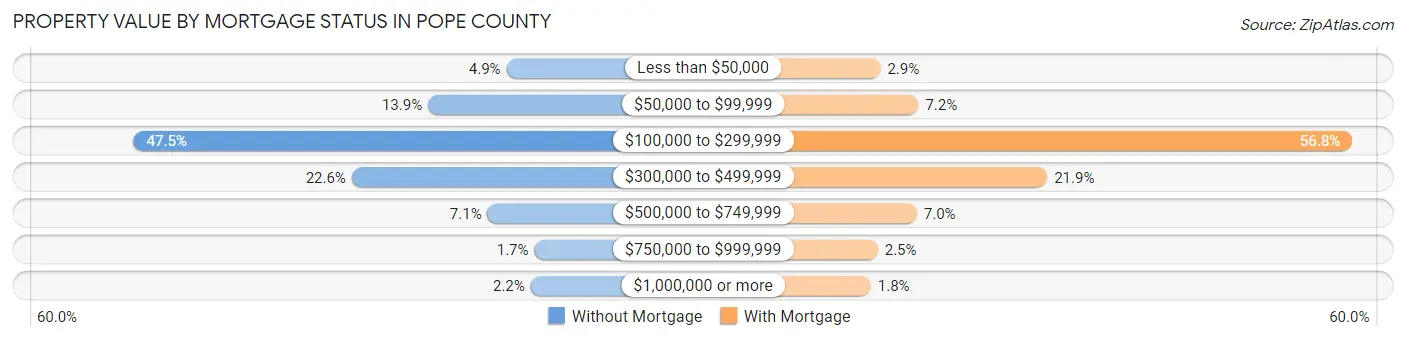
| Property Value | Without Mortgage | With Mortgage |
| Less than $50,000 | 82 (4.9%) | 65 (2.9%) |
| $50,000 to $99,999 | 231 (13.9%) | 164 (7.2%) |
| $100,000 to $299,999 | 790 (47.5%) | 1,295 (56.8%) |
| $300,000 to $499,999 | 376 (22.6%) | 500 (21.9%) |
| $500,000 to $749,999 | 118 (7.1%) | 160 (7.0%) |
| $750,000 to $999,999 | 29 (1.7%) | 58 (2.5%) |
| $1,000,000 or more | 36 (2.2%) | 40 (1.8%) |
| Total | 1,662 (100.0%) | 2,282 (100.0%) |
Household Income by Mortgage Status in Pope County

| Household Income | Without Mortgage | With Mortgage |
| Less than $10,000 | 67 (4.0%) | 33 (1.5%) |
| $10,000 to $24,999 | 177 (10.6%) | 19 (0.8%) |
| $25,000 to $34,999 | 192 (11.6%) | 87 (3.8%) |
| $35,000 to $49,999 | 155 (9.3%) | 75 (3.3%) |
| $50,000 to $74,999 | 376 (22.6%) | 164 (7.2%) |
| $75,000 to $99,999 | 249 (15.0%) | 471 (20.6%) |
| $100,000 to $149,999 | 220 (13.2%) | 347 (15.2%) |
| $150,000 or more | 226 (13.6%) | 641 (28.1%) |
| Total | 1,662 (100.0%) | 2,282 (100.0%) |
Property Value to Household Income Ratio in Pope County

| Value-to-Income Ratio | Without Mortgage | With Mortgage |
| Less than 2.0x | 460 (27.7%) | 98,750 (4,327.3%) |
| 2.0x to 2.9x | 313 (18.8%) | 876 (38.4%) |
| 3.0x to 3.9x | 229 (13.8%) | 606 (26.6%) |
| 4.0x or more | 642 (38.6%) | 322 (14.1%) |
| Total | 1,662 (100.0%) | 2,282 (100.0%) |
Real Estate Taxes by Mortgage Status in Pope County
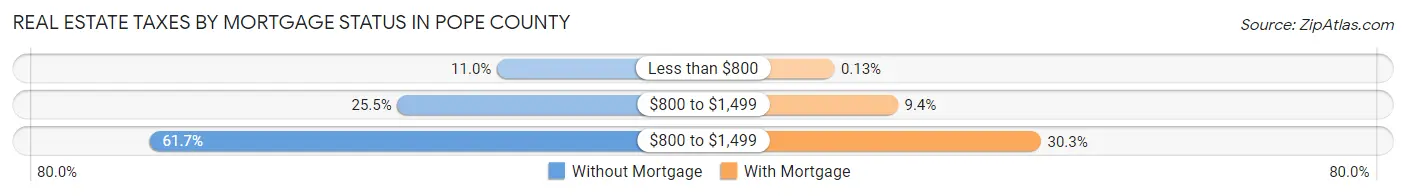
| Property Taxes | Without Mortgage | With Mortgage |
| Less than $800 | 182 (11.0%) | 3 (0.1%) |
| $800 to $1,499 | 424 (25.5%) | 215 (9.4%) |
| $800 to $1,499 | 1,026 (61.7%) | 692 (30.3%) |
| Total | 1,662 (100.0%) | 2,282 (100.0%) |
Health & Disability in Pope County
Health Insurance Coverage by Age in Pope County
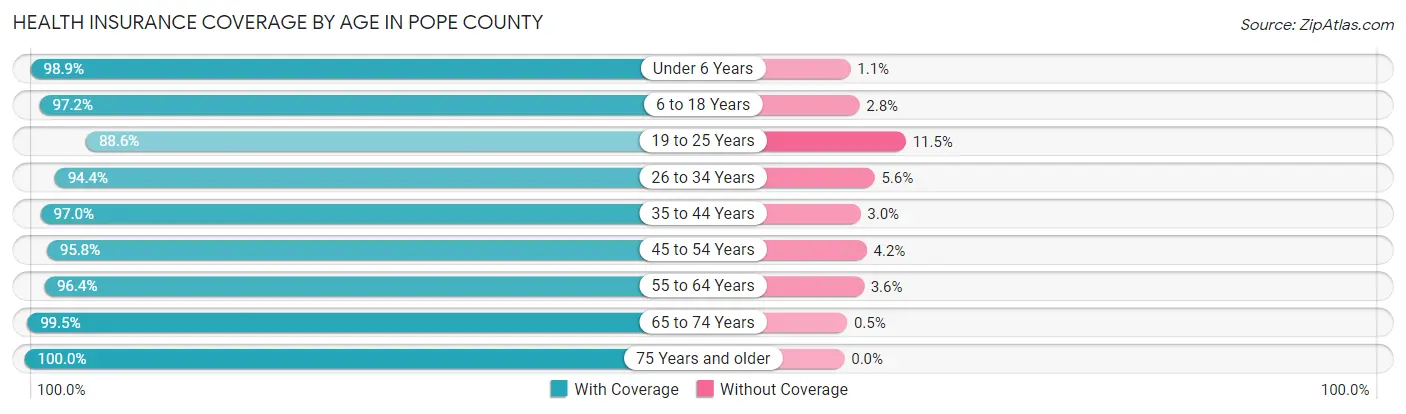
| Age Bracket | With Coverage | Without Coverage |
| Under 6 Years | 702 (98.9%) | 8 (1.1%) |
| 6 to 18 Years | 1,731 (97.2%) | 50 (2.8%) |
| 19 to 25 Years | 611 (88.5%) | 79 (11.5%) |
| 26 to 34 Years | 1,007 (94.4%) | 60 (5.6%) |
| 35 to 44 Years | 1,261 (97.0%) | 39 (3.0%) |
| 45 to 54 Years | 1,083 (95.8%) | 47 (4.2%) |
| 55 to 64 Years | 1,704 (96.4%) | 64 (3.6%) |
| 65 to 74 Years | 1,608 (99.5%) | 8 (0.5%) |
| 75 Years and older | 1,045 (100.0%) | 0 (0.0%) |
| Total | 10,752 (96.8%) | 355 (3.2%) |
Health Insurance Coverage by Citizenship Status in Pope County
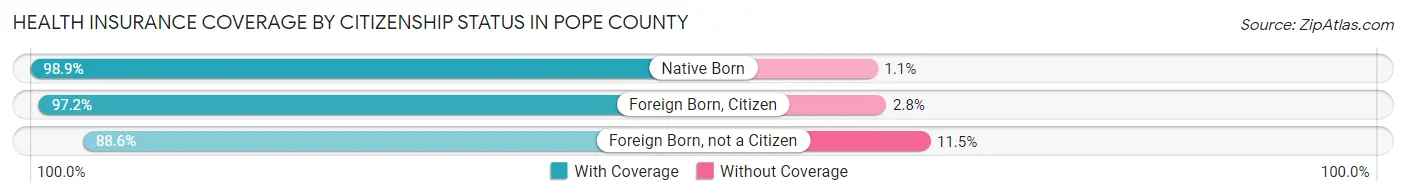
| Citizenship Status | With Coverage | Without Coverage |
| Native Born | 702 (98.9%) | 8 (1.1%) |
| Foreign Born, Citizen | 1,731 (97.2%) | 50 (2.8%) |
| Foreign Born, not a Citizen | 611 (88.5%) | 79 (11.5%) |
Health Insurance Coverage by Household Income in Pope County
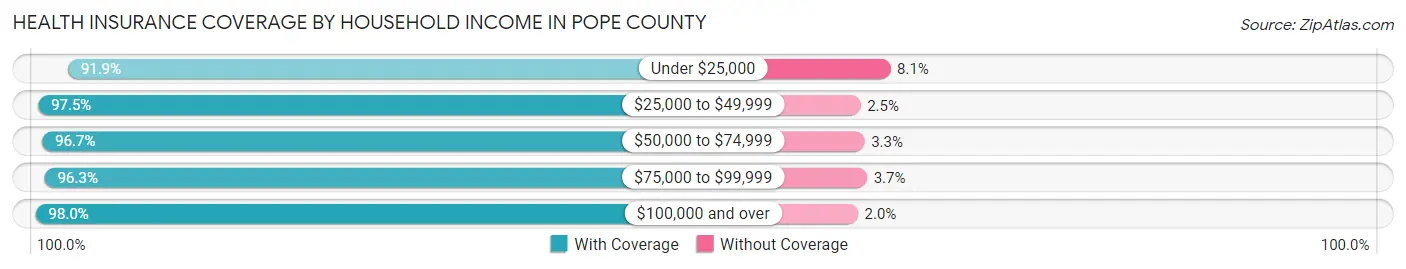
| Household Income | With Coverage | Without Coverage |
| Under $25,000 | 1,088 (91.9%) | 96 (8.1%) |
| $25,000 to $49,999 | 1,398 (97.5%) | 36 (2.5%) |
| $50,000 to $74,999 | 1,834 (96.7%) | 62 (3.3%) |
| $75,000 to $99,999 | 1,573 (96.3%) | 61 (3.7%) |
| $100,000 and over | 4,826 (98.0%) | 100 (2.0%) |
Public vs Private Health Insurance Coverage by Age in Pope County
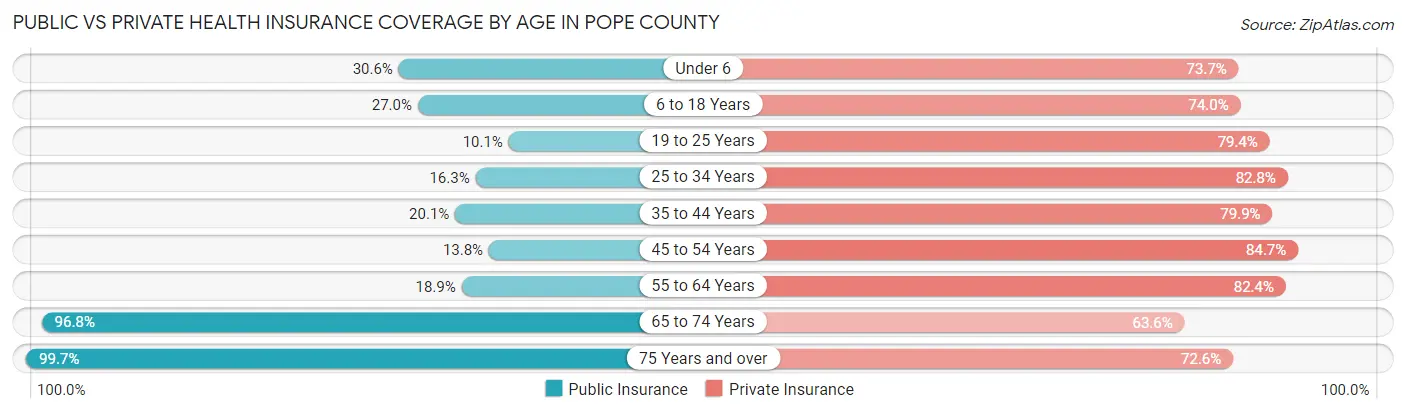
| Age Bracket | Public Insurance | Private Insurance |
| Under 6 | 217 (30.6%) | 523 (73.7%) |
| 6 to 18 Years | 481 (27.0%) | 1,318 (74.0%) |
| 19 to 25 Years | 70 (10.1%) | 548 (79.4%) |
| 25 to 34 Years | 174 (16.3%) | 883 (82.8%) |
| 35 to 44 Years | 261 (20.1%) | 1,039 (79.9%) |
| 45 to 54 Years | 156 (13.8%) | 957 (84.7%) |
| 55 to 64 Years | 334 (18.9%) | 1,457 (82.4%) |
| 65 to 74 Years | 1,565 (96.8%) | 1,028 (63.6%) |
| 75 Years and over | 1,042 (99.7%) | 759 (72.6%) |
| Total | 4,300 (38.7%) | 8,512 (76.6%) |
Disability Status by Sex by Age in Pope County

| Age Bracket | Male | Female |
| Under 5 Years | 0 (0.0%) | 0 (0.0%) |
| 5 to 17 Years | 47 (4.9%) | 15 (1.8%) |
| 18 to 34 Years | 55 (5.6%) | 37 (4.1%) |
| 35 to 64 Years | 260 (12.1%) | 225 (10.9%) |
| 65 to 74 Years | 255 (29.9%) | 130 (17.0%) |
| 75 Years and over | 183 (38.4%) | 265 (46.7%) |
Disability Class by Sex by Age in Pope County
Disability Class: Hearing Difficulty

| Age Bracket | Male | Female |
| Under 5 Years | 0 (0.0%) | 0 (0.0%) |
| 5 to 17 Years | 6 (0.6%) | 10 (1.2%) |
| 18 to 34 Years | 10 (1.0%) | 8 (0.9%) |
| 35 to 64 Years | 106 (5.0%) | 69 (3.4%) |
| 65 to 74 Years | 182 (21.4%) | 37 (4.8%) |
| 75 Years and over | 129 (27.0%) | 96 (16.9%) |
Disability Class: Vision Difficulty
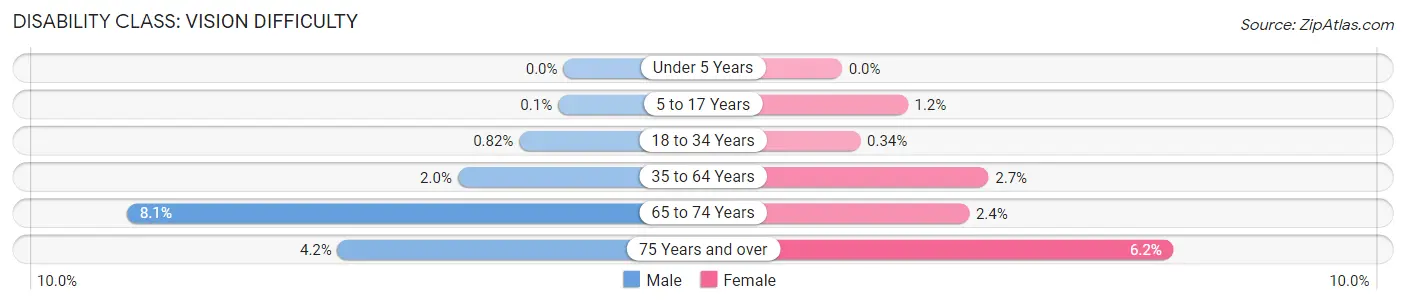
| Age Bracket | Male | Female |
| Under 5 Years | 0 (0.0%) | 0 (0.0%) |
| 5 to 17 Years | 1 (0.1%) | 10 (1.2%) |
| 18 to 34 Years | 8 (0.8%) | 3 (0.3%) |
| 35 to 64 Years | 42 (2.0%) | 56 (2.7%) |
| 65 to 74 Years | 69 (8.1%) | 18 (2.4%) |
| 75 Years and over | 20 (4.2%) | 35 (6.2%) |
Disability Class: Cognitive Difficulty
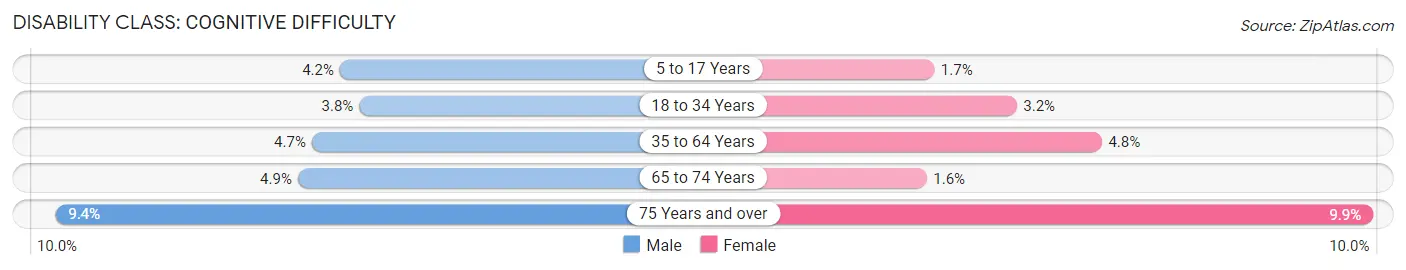
| Age Bracket | Male | Female |
| 5 to 17 Years | 40 (4.2%) | 14 (1.7%) |
| 18 to 34 Years | 37 (3.8%) | 29 (3.2%) |
| 35 to 64 Years | 100 (4.7%) | 99 (4.8%) |
| 65 to 74 Years | 42 (4.9%) | 12 (1.6%) |
| 75 Years and over | 45 (9.4%) | 56 (9.9%) |
Disability Class: Ambulatory Difficulty

| Age Bracket | Male | Female |
| 5 to 17 Years | 1 (0.1%) | 10 (1.2%) |
| 18 to 34 Years | 4 (0.4%) | 0 (0.0%) |
| 35 to 64 Years | 104 (4.9%) | 90 (4.4%) |
| 65 to 74 Years | 88 (10.3%) | 90 (11.8%) |
| 75 Years and over | 101 (21.2%) | 175 (30.8%) |
Disability Class: Self-Care Difficulty

| Age Bracket | Male | Female |
| 5 to 17 Years | 4 (0.4%) | 11 (1.3%) |
| 18 to 34 Years | 0 (0.0%) | 10 (1.1%) |
| 35 to 64 Years | 58 (2.7%) | 42 (2.0%) |
| 65 to 74 Years | 29 (3.4%) | 19 (2.5%) |
| 75 Years and over | 35 (7.3%) | 59 (10.4%) |
Technology Access in Pope County
Computing Device Access in Pope County
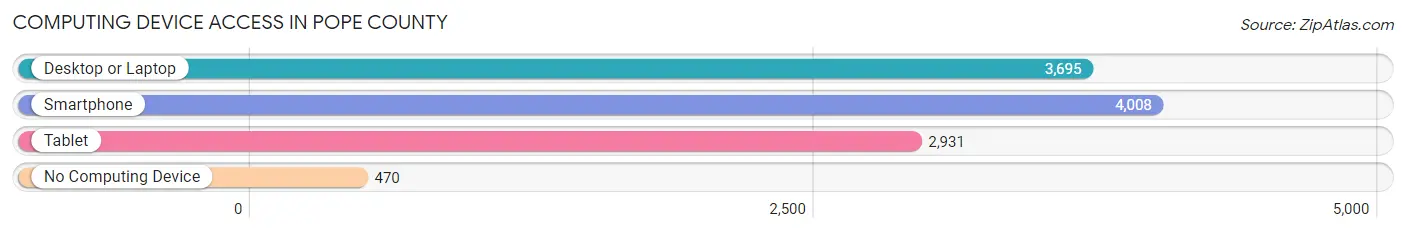
| Device Type | # Households | % Households |
| Desktop or Laptop | 3,695 | 75.4% |
| Smartphone | 4,008 | 81.9% |
| Tablet | 2,931 | 59.9% |
| No Computing Device | 470 | 9.6% |
| Total | 4,897 | 100.0% |
Internet Access in Pope County
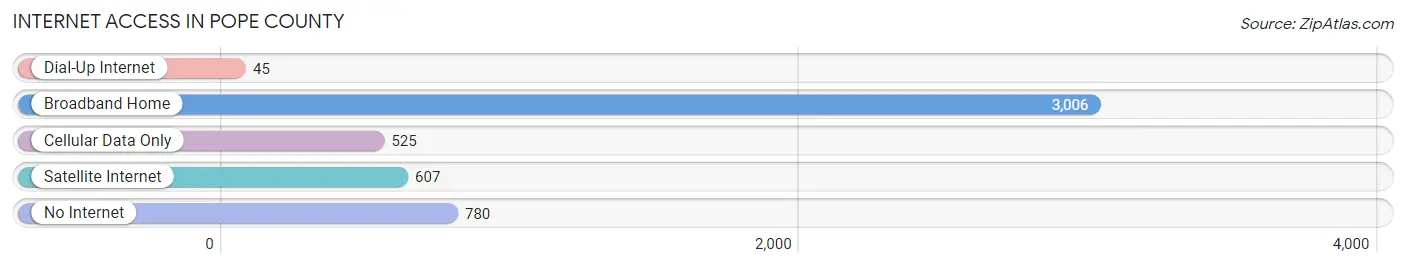
| Internet Type | # Households | % Households |
| Dial-Up Internet | 45 | 0.9% |
| Broadband Home | 3,006 | 61.4% |
| Cellular Data Only | 525 | 10.7% |
| Satellite Internet | 607 | 12.4% |
| No Internet | 780 | 15.9% |
| Total | 4,897 | 100.0% |
Pope County Summary
Introduction
Pope County is located in the west-central part of Minnesota, and is part of the state’s Central Lakes Region. It is bordered by Stearns County to the north, Douglas County to the east, Stevens County to the south, and Grant County to the west. The county seat is Glenwood, and the county’s population was 10,995 as of the 2010 census.
History
Pope County was established in 1858, and was named after John Pope, a Union general in the American Civil War. The county was originally part of Stearns County, and was organized in 1866. The first settlers in the area were mostly German immigrants, who were attracted to the area by its fertile soil and abundant natural resources.
The county’s economy was initially based on agriculture, and the first crops grown in the area were wheat and oats. By the late 19th century, the county had become a major producer of wheat, and the area was known as the “Wheat Belt” of Minnesota.
In the early 20th century, the county’s economy shifted to dairy farming, and the area became known as the “Dairy Belt” of Minnesota. The county’s population grew steadily throughout the 20th century, and by the 2000 census, it had reached 10,995.
Geography
Pope County is located in the west-central part of Minnesota, and is part of the state’s Central Lakes Region. It is bordered by Stearns County to the north, Douglas County to the east, Stevens County to the south, and Grant County to the west. The county has a total area of 576 square miles, of which 571 square miles is land and 5.2 square miles is water.
The county is mostly flat, with some rolling hills in the northern and western parts. The highest point in the county is located in the northwest corner, at an elevation of 1,541 feet. The county is drained by the Sauk River, which flows through the center of the county.
Economy
Pope County’s economy is largely based on agriculture, and the county is one of the top producers of wheat and dairy products in the state. Other major agricultural products include corn, soybeans, hay, and oats.
The county also has a strong manufacturing sector, with several major employers in the area. The largest employers in the county are the Glenwood State Bank, the Pope County Hospital, and the Pope County Sheriff’s Office.
Demographics
As of the 2010 census, the population of Pope County was 10,995, with a population density of 19.2 people per square mile. The racial makeup of the county was 97.3% White, 0.5% African American, 0.3% Native American, 0.3% Asian, 0.1% Pacific Islander, 0.7% from other races, and 0.8% from two or more races. Hispanic or Latino of any race were 1.7% of the population.
The median income for a household in the county was $45,945, and the median income for a family was $54,945. The per capita income for the county was $21,945. About 8.3% of families and 11.2% of the population were below the poverty line, including 14.2% of those under age 18 and 8.2% of those age 65 or over.
Conclusion
Pope County is a rural county located in the west-central part of Minnesota. It has a population of 10,995, and is largely agricultural, with a strong manufacturing sector. The county’s economy is based on wheat and dairy production, as well as other agricultural products. The county’s population is mostly white, with a small percentage of African Americans, Native Americans, Asians, and Pacific Islanders. The median income for a household in the county is $45,945, and the per capita income is $21,945.
Common Questions
What is Per Capita Income in Pope County?
Per Capita income in Pope County is $38,905.
What is the Median Family Income in Pope County?
Median Family Income in Pope County is $94,375.
What is the Median Household income in Pope County?
Median Household Income in Pope County is $71,212.
What is Income or Wage Gap in Pope County?
Income or Wage Gap in Pope County is 28.9%.
Women in Pope County earn 71.1 cents for every dollar earned by a man.
What is Family Income Deficit in Pope County?
Family Income Deficit in Pope County is $10,342.
Families that are below poverty line in Pope County earn $10,342 less on average than the poverty threshold level.
What is Inequality or Gini Index in Pope County?
Inequality or Gini Index in Pope County is 0.42.
What is the Total Population of Pope County?
Total Population of Pope County is 11,312.
What is the Total Male Population of Pope County?
Total Male Population of Pope County is 5,798.
What is the Total Female Population of Pope County?
Total Female Population of Pope County is 5,514.
What is the Ratio of Males per 100 Females in Pope County?
There are 105.15 Males per 100 Females in Pope County.
What is the Ratio of Females per 100 Males in Pope County?
There are 95.10 Females per 100 Males in Pope County.
What is the Median Population Age in Pope County?
Median Population Age in Pope County is 46.2 Years.
What is the Average Family Size in Pope County
Average Family Size in Pope County is 2.7 People.
What is the Average Household Size in Pope County
Average Household Size in Pope County is 2.3 People.
How Large is the Labor Force in Pope County?
There are 5,883 People in the Labor Forcein in Pope County.
What is the Percentage of People in the Labor Force in Pope County?
63.9% of People are in the Labor Force in Pope County.
What is the Unemployment Rate in Pope County?
Unemployment Rate in Pope County is 1.0%.