Nicollet County, MN Map & Demographics
Nicollet County Map

Nicollet County Overview
$41,658
PER CAPITA INCOME
$103,117
AVG FAMILY INCOME
$79,113
AVG HOUSEHOLD INCOME
23.0%
WAGE / INCOME GAP [ % ]
77.0¢/ $1
WAGE / INCOME GAP [ $ ]
$9,215
FAMILY INCOME DEFICIT
0.46
INEQUALITY / GINI INDEX
34,380
TOTAL POPULATION
17,372
MALE POPULATION
17,008
FEMALE POPULATION
102.14
MALES / 100 FEMALES
97.90
FEMALES / 100 MALES
37.1
MEDIAN AGE
3.0
AVG FAMILY SIZE
2.4
AVG HOUSEHOLD SIZE
19,565
LABOR FORCE [ PEOPLE ]
70.7%
PERCENT IN LABOR FORCE
1.9%
UNEMPLOYMENT RATE
Nicollet County Area Codes
Income in Nicollet County
Income Overview in Nicollet County
Per Capita Income in Nicollet County is $41,658, while median incomes of families and households are $103,117 and $79,113 respectively.
| Characteristic | Number | Measure |
| Per Capita Income | 34,380 | $41,658 |
| Median Family Income | 8,325 | $103,117 |
| Mean Family Income | 8,325 | $131,571 |
| Median Household Income | 12,913 | $79,113 |
| Mean Household Income | 12,913 | $106,710 |
| Income Deficit | 8,325 | $9,215 |
| Wage / Income Gap (%) | 34,380 | 22.96% |
| Wage / Income Gap ($) | 34,380 | 77.04¢ per $1 |
| Gini / Inequality Index | 34,380 | 0.46 |
Earnings by Sex in Nicollet County
Average Earnings in Nicollet County are $39,321, $44,550 for men and $34,321 for women, a difference of 23.0%.
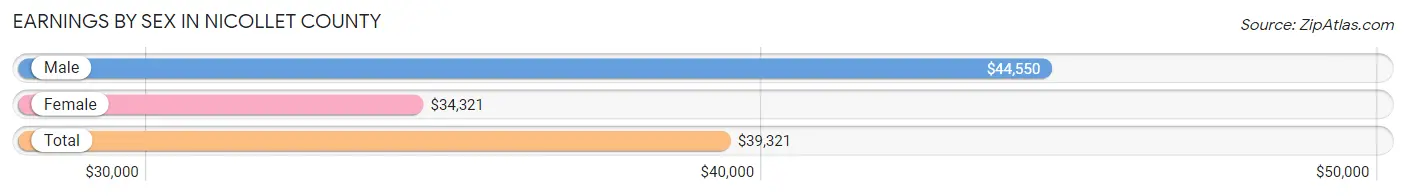
| Sex | Number | Average Earnings |
| Male | 10,520 (50.8%) | $44,550 |
| Female | 10,178 (49.2%) | $34,321 |
| Total | 20,698 (100.0%) | $39,321 |
Earnings by Sex by Income Bracket in Nicollet County
The most common earnings brackets in Nicollet County are $100,000+ for men (1,615 | 15.3%) and $55,000 to $64,999 for women (981 | 9.6%).
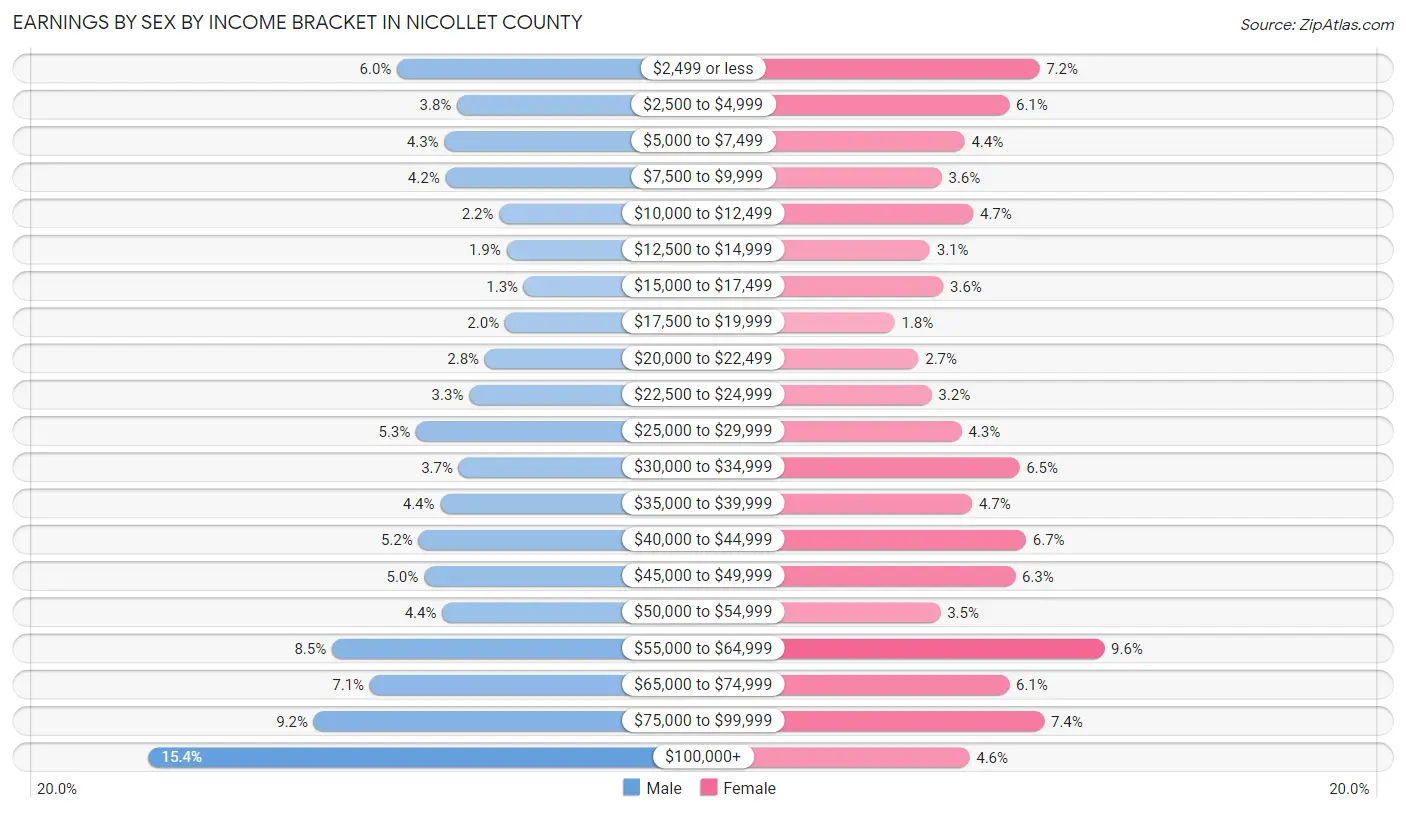
| Income | Male | Female |
| $2,499 or less | 635 (6.0%) | 734 (7.2%) |
| $2,500 to $4,999 | 399 (3.8%) | 619 (6.1%) |
| $5,000 to $7,499 | 449 (4.3%) | 449 (4.4%) |
| $7,500 to $9,999 | 445 (4.2%) | 361 (3.5%) |
| $10,000 to $12,499 | 232 (2.2%) | 481 (4.7%) |
| $12,500 to $14,999 | 204 (1.9%) | 317 (3.1%) |
| $15,000 to $17,499 | 136 (1.3%) | 367 (3.6%) |
| $17,500 to $19,999 | 210 (2.0%) | 182 (1.8%) |
| $20,000 to $22,499 | 289 (2.8%) | 273 (2.7%) |
| $22,500 to $24,999 | 351 (3.3%) | 323 (3.2%) |
| $25,000 to $29,999 | 561 (5.3%) | 438 (4.3%) |
| $30,000 to $34,999 | 392 (3.7%) | 658 (6.5%) |
| $35,000 to $39,999 | 465 (4.4%) | 477 (4.7%) |
| $40,000 to $44,999 | 551 (5.2%) | 683 (6.7%) |
| $45,000 to $49,999 | 529 (5.0%) | 641 (6.3%) |
| $50,000 to $54,999 | 458 (4.3%) | 356 (3.5%) |
| $55,000 to $64,999 | 892 (8.5%) | 981 (9.6%) |
| $65,000 to $74,999 | 743 (7.1%) | 619 (6.1%) |
| $75,000 to $99,999 | 964 (9.2%) | 752 (7.4%) |
| $100,000+ | 1,615 (15.3%) | 467 (4.6%) |
| Total | 10,520 (100.0%) | 10,178 (100.0%) |
Earnings by Sex by Educational Attainment in Nicollet County
Average earnings in Nicollet County are $54,662 for men and $43,923 for women, a difference of 19.7%. Men with an educational attainment of graduate degree enjoy the highest average annual earnings of $88,929, while those with high school diploma education earn the least with $39,265. Women with an educational attainment of graduate degree earn the most with the average annual earnings of $71,979, while those with high school diploma education have the smallest earnings of $27,250.
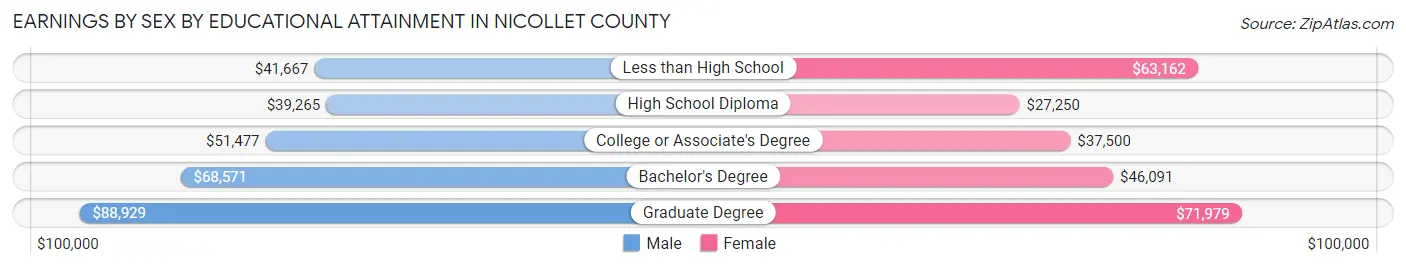
| Educational Attainment | Male Income | Female Income |
| Less than High School | $41,667 | $63,162 |
| High School Diploma | $39,265 | $27,250 |
| College or Associate's Degree | $51,477 | $37,500 |
| Bachelor's Degree | $68,571 | $46,091 |
| Graduate Degree | $88,929 | $71,979 |
| Total | $54,662 | $43,923 |
Family Income in Nicollet County
Family Income Brackets in Nicollet County
According to the Nicollet County family income data, there are 2,306 families falling into the $100,000 to $149,999 income range, which is the most common income bracket and makes up 27.7% of all families. Conversely, the less than $10,000 income bracket is the least frequent group with only 58 families (0.7%) belonging to this category.

| Income Bracket | # Families | % Families |
| Less than $10,000 | 58 | 0.7% |
| $10,000 to $14,999 | 133 | 1.6% |
| $15,000 to $24,999 | 333 | 4.0% |
| $25,000 to $34,999 | 383 | 4.6% |
| $35,000 to $49,999 | 624 | 7.5% |
| $50,000 to $74,999 | 1,132 | 13.6% |
| $75,000 to $99,999 | 1,374 | 16.5% |
| $100,000 to $149,999 | 2,306 | 27.7% |
| $150,000 to $199,999 | 924 | 11.1% |
| $200,000+ | 1,057 | 12.7% |
Family Income by Famaliy Size in Nicollet County
6-person families (192 | 2.3%) account for the highest median family income in Nicollet County with $174,286 per family, while 2-person families (4,422 | 53.1%) have the highest median income of $42,428 per family member.
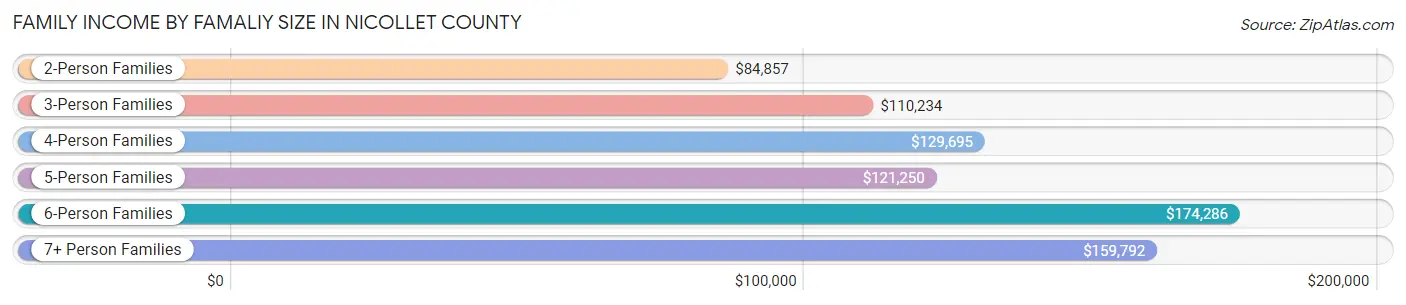
| Income Bracket | # Families | Median Income |
| 2-Person Families | 4,422 (53.1%) | $84,857 |
| 3-Person Families | 1,611 (19.4%) | $110,234 |
| 4-Person Families | 1,510 (18.1%) | $129,695 |
| 5-Person Families | 490 (5.9%) | $121,250 |
| 6-Person Families | 192 (2.3%) | $174,286 |
| 7+ Person Families | 100 (1.2%) | $159,792 |
| Total | 8,325 (100.0%) | $103,117 |
Family Income by Number of Earners in Nicollet County
The median family income in Nicollet County is $103,117, with families comprising 3+ earners (917) having the highest median family income of $152,216, while families with 1 earner (1,994) have the lowest median family income of $63,705, accounting for 11.0% and 23.9% of families, respectively.
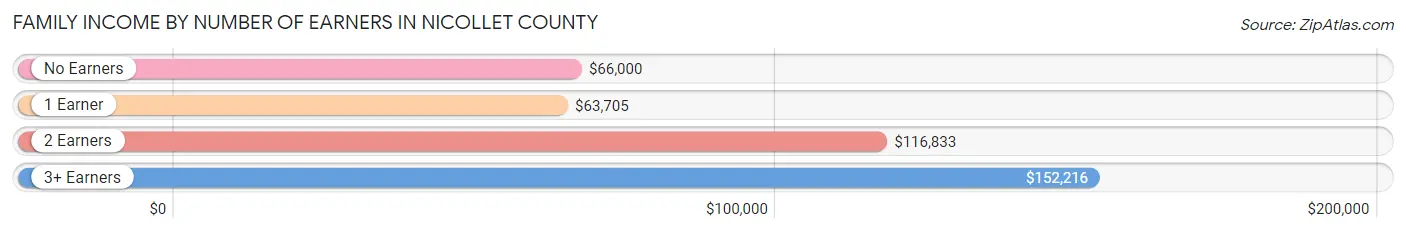
| Number of Earners | # Families | Median Income |
| No Earners | 1,176 (14.1%) | $66,000 |
| 1 Earner | 1,994 (23.9%) | $63,705 |
| 2 Earners | 4,238 (50.9%) | $116,833 |
| 3+ Earners | 917 (11.0%) | $152,216 |
| Total | 8,325 (100.0%) | $103,117 |
Household Income in Nicollet County
Household Income Brackets in Nicollet County
With 2,828 households falling in the category, the $100,000 to $149,999 income range is the most frequent in Nicollet County, accounting for 21.9% of all households. In contrast, only 362 households (2.8%) fall into the less than $10,000 income bracket, making it the least populous group.
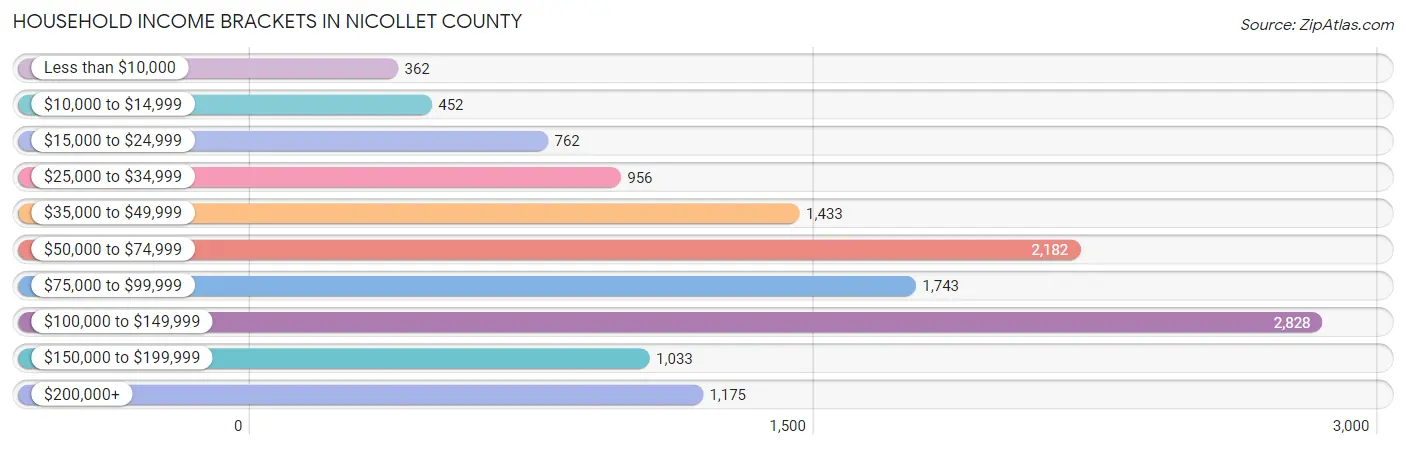
| Income Bracket | # Households | % Households |
| Less than $10,000 | 362 | 2.8% |
| $10,000 to $14,999 | 452 | 3.5% |
| $15,000 to $24,999 | 762 | 5.9% |
| $25,000 to $34,999 | 956 | 7.4% |
| $35,000 to $49,999 | 1,433 | 11.1% |
| $50,000 to $74,999 | 2,182 | 16.9% |
| $75,000 to $99,999 | 1,743 | 13.5% |
| $100,000 to $149,999 | 2,828 | 21.9% |
| $150,000 to $199,999 | 1,033 | 8.0% |
| $200,000+ | 1,175 | 9.1% |
Household Income by Householder Age in Nicollet County
The median household income in Nicollet County is $79,113, with the highest median household income of $102,560 found in the 45 to 64 years age bracket for the primary householder. A total of 4,575 households (35.4%) fall into this category. Meanwhile, the 65+ years age bracket for the primary householder has the lowest median household income of $53,738, with 3,571 households (27.7%) in this group.
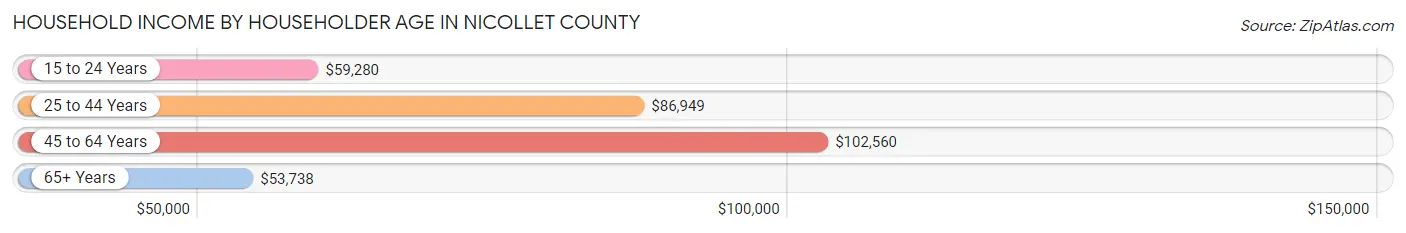
| Income Bracket | # Households | Median Income |
| 15 to 24 Years | 554 (4.3%) | $59,280 |
| 25 to 44 Years | 4,213 (32.6%) | $86,949 |
| 45 to 64 Years | 4,575 (35.4%) | $102,560 |
| 65+ Years | 3,571 (27.7%) | $53,738 |
| Total | 12,913 (100.0%) | $79,113 |
Poverty in Nicollet County
Income Below Poverty by Sex and Age in Nicollet County
With 12.2% poverty level for males and 8.4% for females among the residents of Nicollet County, 16 and 17 year old males and 12 to 14 year old females are the most vulnerable to poverty, with 72 males (22.5%) and 92 females (15.0%) in their respective age groups living below the poverty level.

| Age Bracket | Male | Female |
| Under 5 Years | 81 (9.8%) | 60 (5.9%) |
| 5 Years | 13 (7.0%) | 0 (0.0%) |
| 6 to 11 Years | 206 (18.3%) | 137 (10.3%) |
| 12 to 14 Years | 89 (11.9%) | 92 (15.0%) |
| 15 Years | 48 (12.6%) | 0 (0.0%) |
| 16 and 17 Years | 72 (22.5%) | 53 (13.0%) |
| 18 to 24 Years | 130 (9.7%) | 148 (10.7%) |
| 25 to 34 Years | 132 (6.6%) | 156 (8.5%) |
| 35 to 44 Years | 400 (16.8%) | 199 (9.0%) |
| 45 to 54 Years | 285 (13.6%) | 92 (5.3%) |
| 55 to 64 Years | 314 (15.0%) | 101 (5.0%) |
| 65 to 74 Years | 90 (5.5%) | 110 (6.8%) |
| 75 Years and over | 107 (11.0%) | 193 (13.7%) |
| Total | 1,967 (12.2%) | 1,341 (8.4%) |
Income Above Poverty by Sex and Age in Nicollet County
According to the poverty statistics in Nicollet County, males aged 65 to 74 years and females aged 5 years are the age groups that are most secure financially, with 94.5% of males and 100.0% of females in these age groups living above the poverty line.
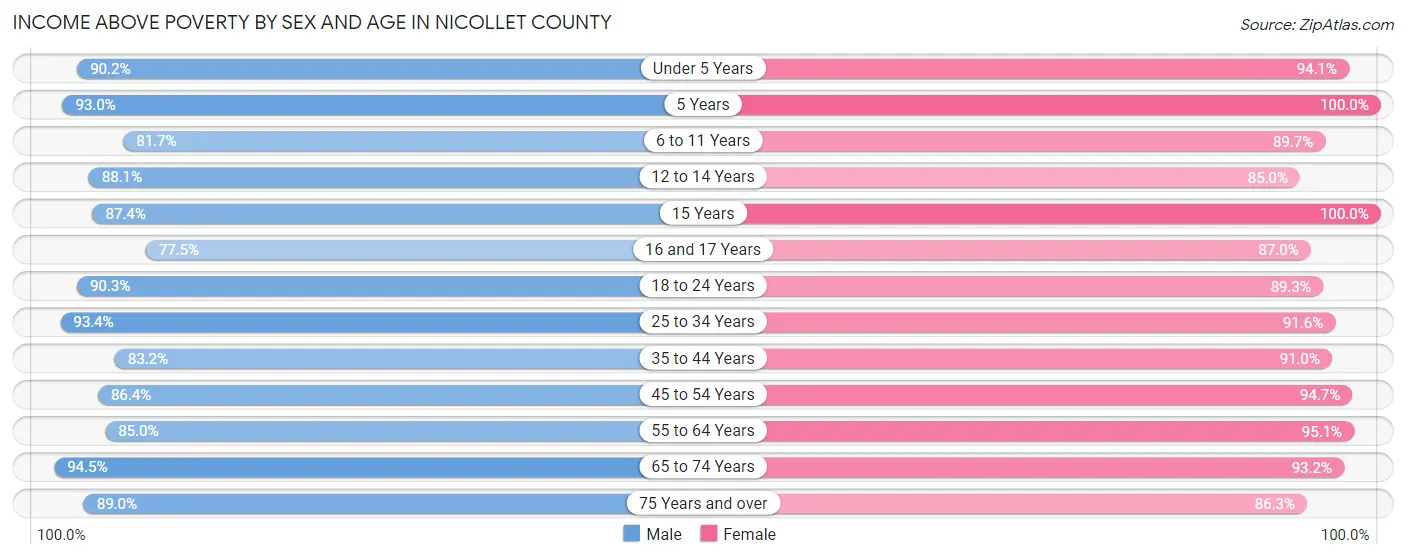
| Age Bracket | Male | Female |
| Under 5 Years | 747 (90.2%) | 959 (94.1%) |
| 5 Years | 172 (93.0%) | 142 (100.0%) |
| 6 to 11 Years | 918 (81.7%) | 1,192 (89.7%) |
| 12 to 14 Years | 657 (88.1%) | 522 (85.0%) |
| 15 Years | 332 (87.4%) | 160 (100.0%) |
| 16 and 17 Years | 248 (77.5%) | 355 (87.0%) |
| 18 to 24 Years | 1,206 (90.3%) | 1,230 (89.3%) |
| 25 to 34 Years | 1,856 (93.4%) | 1,691 (91.5%) |
| 35 to 44 Years | 1,986 (83.2%) | 2,000 (90.9%) |
| 45 to 54 Years | 1,808 (86.4%) | 1,644 (94.7%) |
| 55 to 64 Years | 1,783 (85.0%) | 1,940 (95.1%) |
| 65 to 74 Years | 1,544 (94.5%) | 1,499 (93.2%) |
| 75 Years and over | 866 (89.0%) | 1,218 (86.3%) |
| Total | 14,123 (87.8%) | 14,552 (91.6%) |
Income Below Poverty Among Married-Couple Families in Nicollet County
The poverty statistics for married-couple families in Nicollet County show that 1.6% or 102 of the total 6,422 families live below the poverty line. Families with 5 or more children have the highest poverty rate of 23.5%, comprising of 16 families. On the other hand, families with 3 or 4 children have the lowest poverty rate of 0.0%, which includes 0 families.

| Children | Above Poverty | Below Poverty |
| No Children | 3,852 (98.2%) | 72 (1.8%) |
| 1 or 2 Children | 1,897 (99.3%) | 14 (0.7%) |
| 3 or 4 Children | 519 (100.0%) | 0 (0.0%) |
| 5 or more Children | 52 (76.5%) | 16 (23.5%) |
| Total | 6,320 (98.4%) | 102 (1.6%) |
Income Below Poverty Among Single-Parent Households in Nicollet County
According to the poverty data in Nicollet County, 9.2% or 55 single-father households and 18.4% or 240 single-mother households are living below the poverty line. Among single-father households, those with 3 or 4 children have the highest poverty rate, with 14 households (14.3%) experiencing poverty. Likewise, among single-mother households, those with 3 or 4 children have the highest poverty rate, with 102 households (50.5%) falling below the poverty line.
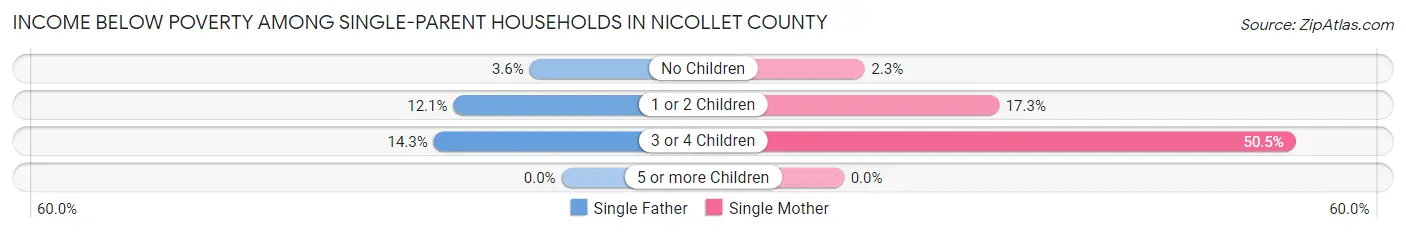
| Children | Single Father | Single Mother |
| No Children | 8 (3.6%) | 8 (2.3%) |
| 1 or 2 Children | 33 (12.1%) | 130 (17.3%) |
| 3 or 4 Children | 14 (14.3%) | 102 (50.5%) |
| 5 or more Children | 0 (0.0%) | 0 (0.0%) |
| Total | 55 (9.2%) | 240 (18.4%) |
Income Below Poverty Among Married-Couple vs Single-Parent Households in Nicollet County
The poverty data for Nicollet County shows that 102 of the married-couple family households (1.6%) and 295 of the single-parent households (15.5%) are living below the poverty level. Within the married-couple family households, those with 5 or more children have the highest poverty rate, with 16 households (23.5%) falling below the poverty line. Among the single-parent households, those with 3 or 4 children have the highest poverty rate, with 116 household (38.7%) living below poverty.
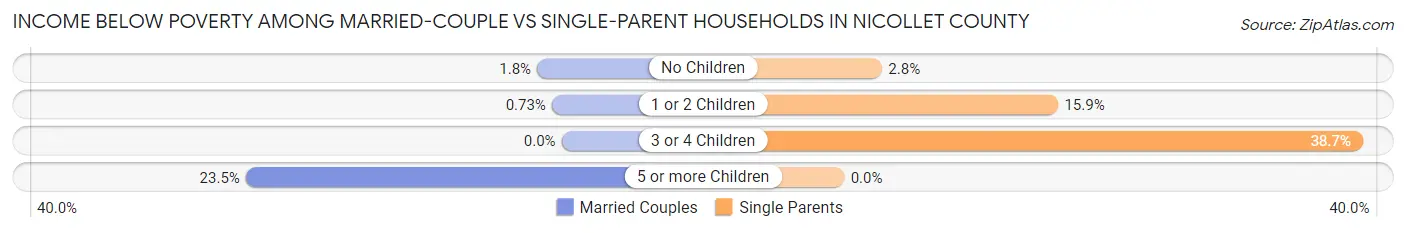
| Children | Married-Couple Families | Single-Parent Households |
| No Children | 72 (1.8%) | 16 (2.8%) |
| 1 or 2 Children | 14 (0.7%) | 163 (15.9%) |
| 3 or 4 Children | 0 (0.0%) | 116 (38.7%) |
| 5 or more Children | 16 (23.5%) | 0 (0.0%) |
| Total | 102 (1.6%) | 295 (15.5%) |
Race in Nicollet County
The most populous races in Nicollet County are White / Caucasian (30,377 | 88.4%), Two or more Races (1,974 | 5.7%), and Hispanic or Latino (1,702 | 5.0%).
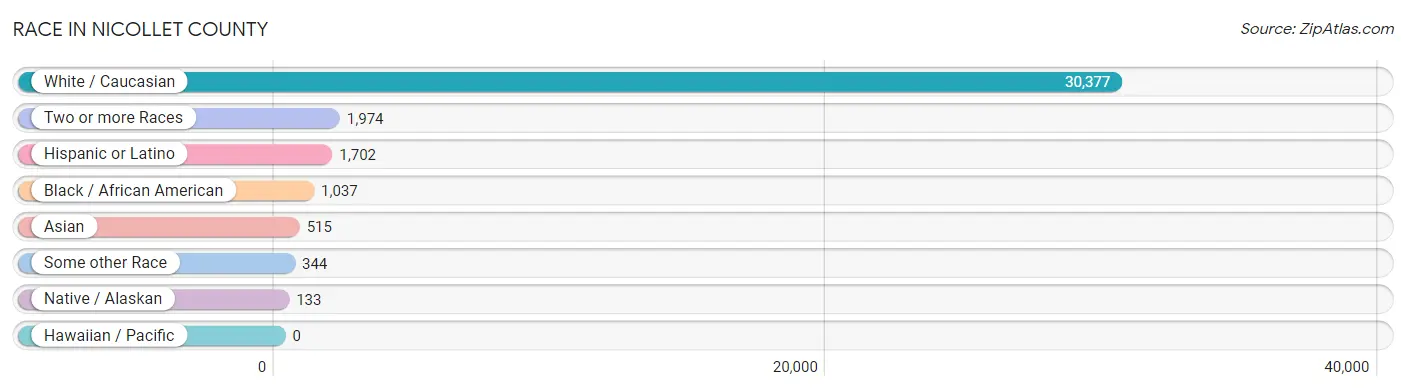
| Race | # Population | % Population |
| Asian | 515 | 1.5% |
| Black / African American | 1,037 | 3.0% |
| Hawaiian / Pacific | 0 | 0.0% |
| Hispanic or Latino | 1,702 | 5.0% |
| Native / Alaskan | 133 | 0.4% |
| White / Caucasian | 30,377 | 88.4% |
| Two or more Races | 1,974 | 5.7% |
| Some other Race | 344 | 1.0% |
| Total | 34,380 | 100.0% |
Ancestry in Nicollet County
The most populous ancestries reported in Nicollet County are German (15,317 | 44.6%), Norwegian (4,244 | 12.3%), Irish (3,081 | 9.0%), Swedish (2,058 | 6.0%), and English (1,633 | 4.8%), together accounting for 76.6% of all Nicollet County residents.

| Ancestry | # Population | % Population |
| African | 228 | 0.7% |
| Alaskan Athabascan | 4 | 0.0% |
| American | 1,155 | 3.4% |
| Arab | 84 | 0.2% |
| Argentinean | 29 | 0.1% |
| Armenian | 7 | 0.0% |
| Australian | 11 | 0.0% |
| Austrian | 66 | 0.2% |
| Bangladeshi | 1 | 0.0% |
| Belgian | 368 | 1.1% |
| Bhutanese | 116 | 0.3% |
| Blackfeet | 1 | 0.0% |
| British | 71 | 0.2% |
| Bulgarian | 65 | 0.2% |
| Burmese | 245 | 0.7% |
| Canadian | 11 | 0.0% |
| Celtic | 3 | 0.0% |
| Central American | 385 | 1.1% |
| Central American Indian | 55 | 0.2% |
| Cherokee | 42 | 0.1% |
| Chippewa | 97 | 0.3% |
| Cree | 1 | 0.0% |
| Croatian | 2 | 0.0% |
| Cuban | 14 | 0.0% |
| Czech | 393 | 1.1% |
| Czechoslovakian | 75 | 0.2% |
| Danish | 366 | 1.1% |
| Dutch | 426 | 1.2% |
| Eastern European | 21 | 0.1% |
| Ecuadorian | 12 | 0.0% |
| English | 1,633 | 4.8% |
| Ethiopian | 29 | 0.1% |
| European | 566 | 1.7% |
| Finnish | 167 | 0.5% |
| French | 766 | 2.2% |
| French American Indian | 15 | 0.0% |
| French Canadian | 167 | 0.5% |
| German | 15,317 | 44.6% |
| Ghanaian | 11 | 0.0% |
| Greek | 56 | 0.2% |
| Guamanian / Chamorro | 7 | 0.0% |
| Guatemalan | 185 | 0.5% |
| Haitian | 15 | 0.0% |
| Honduran | 55 | 0.2% |
| Hungarian | 26 | 0.1% |
| Indian (Asian) | 98 | 0.3% |
| Iranian | 7 | 0.0% |
| Irish | 3,081 | 9.0% |
| Italian | 404 | 1.2% |
| Japanese | 26 | 0.1% |
| Kenyan | 38 | 0.1% |
| Korean | 98 | 0.3% |
| Lebanese | 18 | 0.1% |
| Luxembourger | 12 | 0.0% |
| Malaysian | 21 | 0.1% |
| Mexican | 1,152 | 3.4% |
| Mongolian | 15 | 0.0% |
| Native Hawaiian | 63 | 0.2% |
| Navajo | 4 | 0.0% |
| Nicaraguan | 6 | 0.0% |
| Nigerian | 78 | 0.2% |
| Northern European | 126 | 0.4% |
| Norwegian | 4,244 | 12.3% |
| Palestinian | 4 | 0.0% |
| Pennsylvania German | 2 | 0.0% |
| Polish | 705 | 2.1% |
| Portuguese | 19 | 0.1% |
| Puerto Rican | 34 | 0.1% |
| Russian | 106 | 0.3% |
| Salvadoran | 139 | 0.4% |
| Scandinavian | 587 | 1.7% |
| Scotch-Irish | 138 | 0.4% |
| Scottish | 210 | 0.6% |
| Sioux | 2 | 0.0% |
| Slavic | 93 | 0.3% |
| Slovak | 117 | 0.3% |
| Slovene | 11 | 0.0% |
| Somali | 145 | 0.4% |
| South African | 3 | 0.0% |
| South American | 69 | 0.2% |
| Spanish | 7 | 0.0% |
| Sri Lankan | 55 | 0.2% |
| Subsaharan African | 542 | 1.6% |
| Sudanese | 10 | 0.0% |
| Swedish | 2,058 | 6.0% |
| Swiss | 127 | 0.4% |
| Syrian | 6 | 0.0% |
| Thai | 141 | 0.4% |
| Ukrainian | 26 | 0.1% |
| Venezuelan | 28 | 0.1% |
| Welsh | 342 | 1.0% |
| Yugoslavian | 29 | 0.1% | View All 92 Rows |
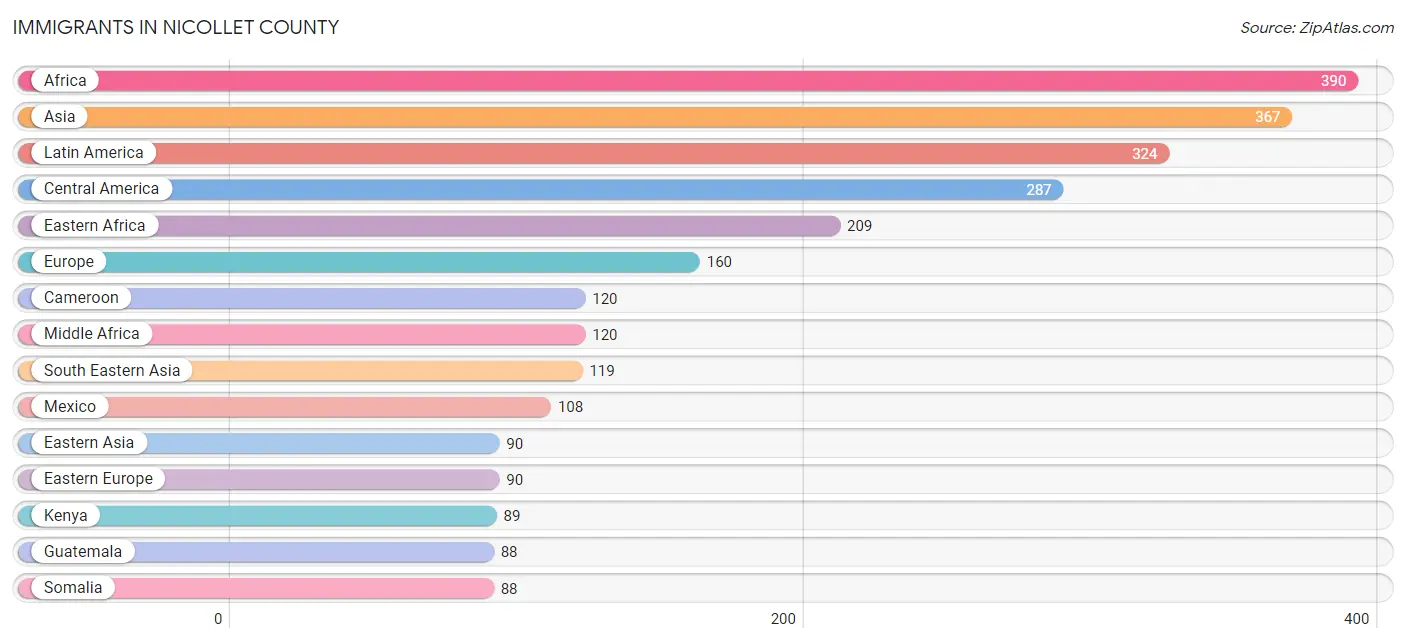
Immigrants in Nicollet County
The most numerous immigrant groups reported in Nicollet County came from Africa (390 | 1.1%), Asia (367 | 1.1%), Latin America (324 | 0.9%), Central America (287 | 0.8%), and Eastern Africa (209 | 0.6%), together accounting for 4.6% of all Nicollet County residents.
| Immigration Origin | # Population | % Population |
| Africa | 390 | 1.1% |
| Argentina | 12 | 0.0% |
| Asia | 367 | 1.1% |
| Australia | 11 | 0.0% |
| Belgium | 1 | 0.0% |
| Bosnia and Herzegovina | 16 | 0.1% |
| Bulgaria | 65 | 0.2% |
| Cameroon | 120 | 0.4% |
| Canada | 5 | 0.0% |
| Central America | 287 | 0.8% |
| China | 42 | 0.1% |
| Eastern Africa | 209 | 0.6% |
| Eastern Asia | 90 | 0.3% |
| Eastern Europe | 90 | 0.3% |
| El Salvador | 86 | 0.3% |
| England | 9 | 0.0% |
| Ethiopia | 32 | 0.1% |
| Europe | 160 | 0.5% |
| Germany | 21 | 0.1% |
| Ghana | 18 | 0.1% |
| Guatemala | 88 | 0.3% |
| Guyana | 25 | 0.1% |
| Honduras | 5 | 0.0% |
| India | 29 | 0.1% |
| Iran | 7 | 0.0% |
| Italy | 9 | 0.0% |
| Kenya | 89 | 0.3% |
| Korea | 48 | 0.1% |
| Laos | 4 | 0.0% |
| Latin America | 324 | 0.9% |
| Lebanon | 9 | 0.0% |
| Malaysia | 15 | 0.0% |
| Mexico | 108 | 0.3% |
| Middle Africa | 120 | 0.4% |
| Netherlands | 10 | 0.0% |
| Nigeria | 40 | 0.1% |
| Northern Europe | 29 | 0.1% |
| Oceania | 11 | 0.0% |
| Pakistan | 1 | 0.0% |
| Philippines | 80 | 0.2% |
| Romania | 3 | 0.0% |
| Russia | 6 | 0.0% |
| Saudi Arabia | 69 | 0.2% |
| Somalia | 88 | 0.3% |
| South Africa | 3 | 0.0% |
| South America | 37 | 0.1% |
| South Central Asia | 78 | 0.2% |
| South Eastern Asia | 119 | 0.4% |
| Southern Europe | 9 | 0.0% |
| Sri Lanka | 41 | 0.1% |
| Vietnam | 19 | 0.1% |
| Western Africa | 58 | 0.2% |
| Western Asia | 80 | 0.2% |
| Western Europe | 32 | 0.1% | View All 54 Rows |
Sex and Age in Nicollet County
Sex and Age in Nicollet County
The most populous age groups in Nicollet County are 15 to 19 Years (1,587 | 9.1%) for men and 15 to 19 Years (1,490 | 8.8%) for women.
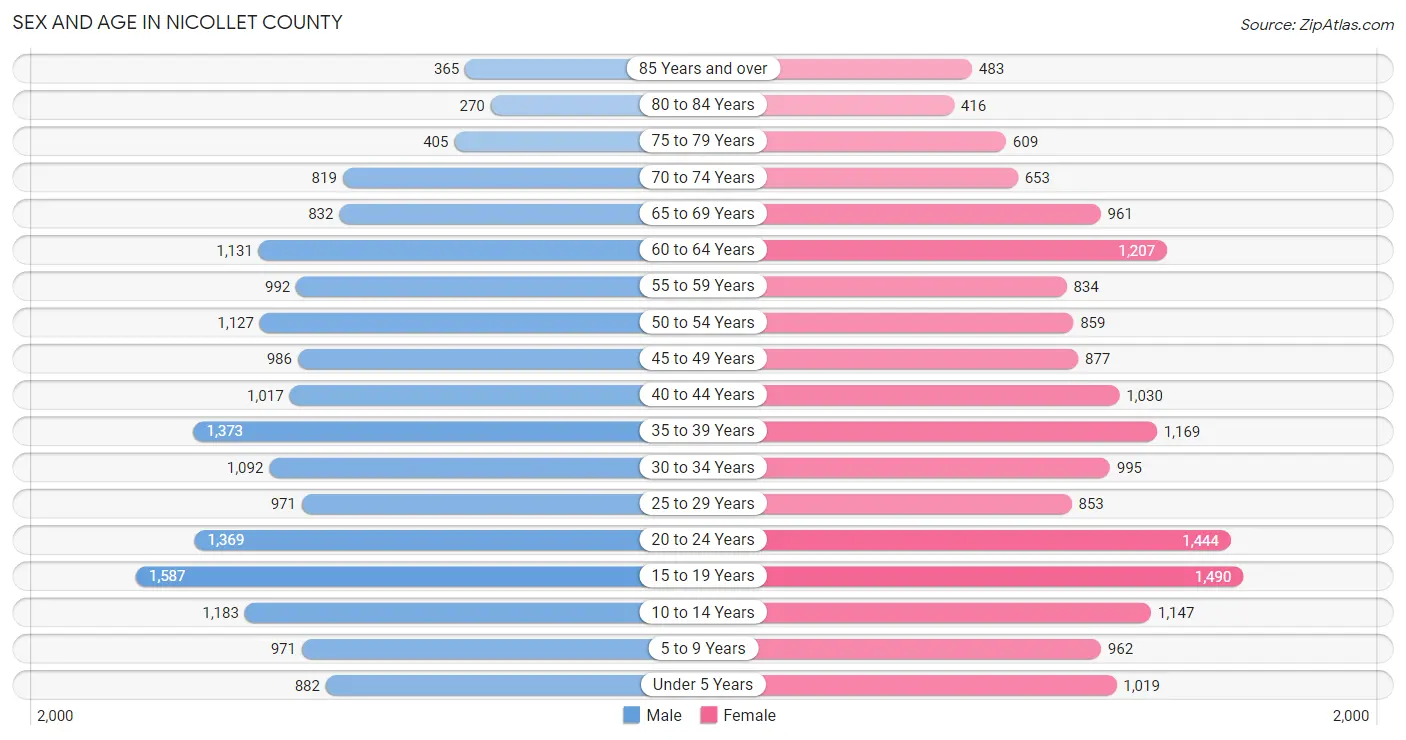
| Age Bracket | Male | Female |
| Under 5 Years | 882 (5.1%) | 1,019 (6.0%) |
| 5 to 9 Years | 971 (5.6%) | 962 (5.7%) |
| 10 to 14 Years | 1,183 (6.8%) | 1,147 (6.7%) |
| 15 to 19 Years | 1,587 (9.1%) | 1,490 (8.8%) |
| 20 to 24 Years | 1,369 (7.9%) | 1,444 (8.5%) |
| 25 to 29 Years | 971 (5.6%) | 853 (5.0%) |
| 30 to 34 Years | 1,092 (6.3%) | 995 (5.9%) |
| 35 to 39 Years | 1,373 (7.9%) | 1,169 (6.9%) |
| 40 to 44 Years | 1,017 (5.9%) | 1,030 (6.1%) |
| 45 to 49 Years | 986 (5.7%) | 877 (5.2%) |
| 50 to 54 Years | 1,127 (6.5%) | 859 (5.1%) |
| 55 to 59 Years | 992 (5.7%) | 834 (4.9%) |
| 60 to 64 Years | 1,131 (6.5%) | 1,207 (7.1%) |
| 65 to 69 Years | 832 (4.8%) | 961 (5.7%) |
| 70 to 74 Years | 819 (4.7%) | 653 (3.8%) |
| 75 to 79 Years | 405 (2.3%) | 609 (3.6%) |
| 80 to 84 Years | 270 (1.5%) | 416 (2.5%) |
| 85 Years and over | 365 (2.1%) | 483 (2.8%) |
| Total | 17,372 (100.0%) | 17,008 (100.0%) |
Families and Households in Nicollet County
Median Family Size in Nicollet County
The median family size in Nicollet County is 2.95 persons per family, with married-couple families (6,422 | 77.1%) accounting for the largest median family size of 2.98 persons per family. On the other hand, single male/father families (596 | 7.2%) represent the smallest median family size with 2.66 persons per family.

| Family Type | # Families | Family Size |
| Married-Couple | 6,422 (77.1%) | 2.98 |
| Single Male/Father | 596 (7.2%) | 2.66 |
| Single Female/Mother | 1,307 (15.7%) | 2.91 |
| Total Families | 8,325 (100.0%) | 2.95 |
Median Household Size in Nicollet County
The median household size in Nicollet County is 2.41 persons per household, with single female/mother households (1,307 | 10.1%) accounting for the largest median household size of 3.12 persons per household. non-family households (4,588 | 35.5%) represent the smallest median household size with 1.29 persons per household.
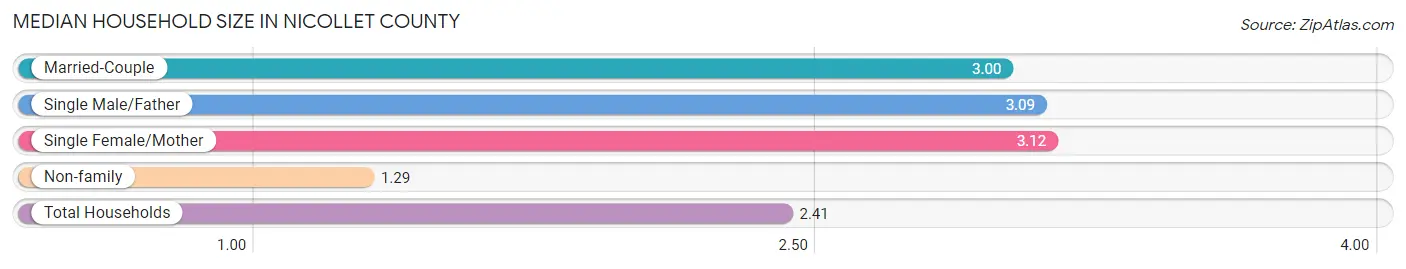
| Household Type | # Households | Household Size |
| Married-Couple | 6,422 (49.7%) | 3.00 |
| Single Male/Father | 596 (4.6%) | 3.09 |
| Single Female/Mother | 1,307 (10.1%) | 3.12 |
| Non-family | 4,588 (35.5%) | 1.29 |
| Total Households | 12,913 (100.0%) | 2.41 |
Household Size by Marriage Status in Nicollet County
Out of a total of 12,913 households in Nicollet County, 8,325 (64.5%) are family households, while 4,588 (35.5%) are nonfamily households. The most numerous type of family households are 2-person households, comprising 4,245, and the most common type of nonfamily households are 1-person households, comprising 3,834.
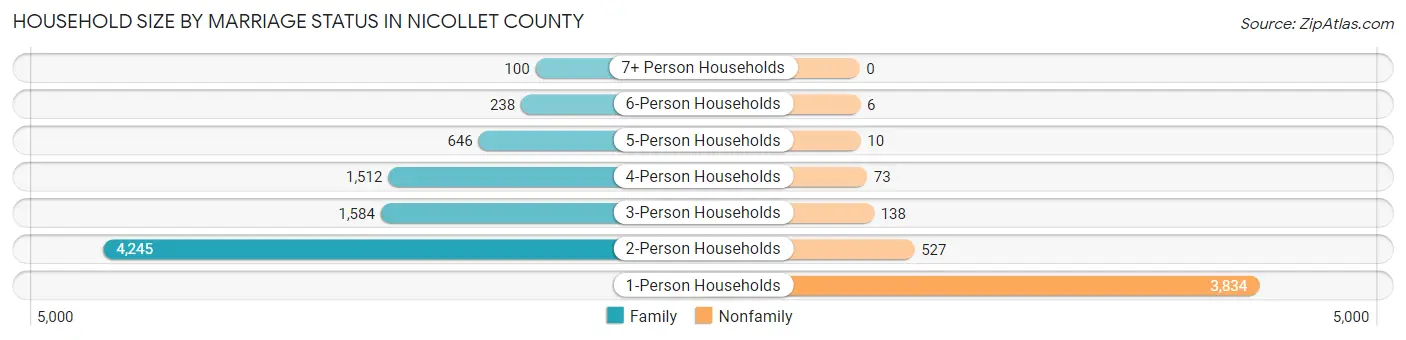
| Household Size | Family Households | Nonfamily Households |
| 1-Person Households | - | 3,834 (29.7%) |
| 2-Person Households | 4,245 (32.9%) | 527 (4.1%) |
| 3-Person Households | 1,584 (12.3%) | 138 (1.1%) |
| 4-Person Households | 1,512 (11.7%) | 73 (0.6%) |
| 5-Person Households | 646 (5.0%) | 10 (0.1%) |
| 6-Person Households | 238 (1.8%) | 6 (0.1%) |
| 7+ Person Households | 100 (0.8%) | 0 (0.0%) |
| Total | 8,325 (64.5%) | 4,588 (35.5%) |
Female Fertility in Nicollet County
Fertility by Age in Nicollet County
Average fertility rate in Nicollet County is 54.0 births per 1,000 women. Women in the age bracket of 20 to 34 years have the highest fertility rate with 83.0 births per 1,000 women. Women in the age bracket of 20 to 34 years acount for 63.6% of all women with births.

| Age Bracket | Women with Births | Births / 1,000 Women |
| 15 to 19 years | 36 (8.4%) | 24.0 |
| 20 to 34 years | 274 (63.6%) | 83.0 |
| 35 to 50 years | 121 (28.1%) | 37.0 |
| Total | 431 (100.0%) | 54.0 |
Fertility by Age by Marriage Status in Nicollet County
71.5% of women with births (431) in Nicollet County are married. The highest percentage of unmarried women with births falls into 15 to 19 years age bracket with 100.0% of them unmarried at the time of birth, while the lowest percentage of unmarried women with births belong to 20 to 34 years age bracket with 16.1% of them unmarried.
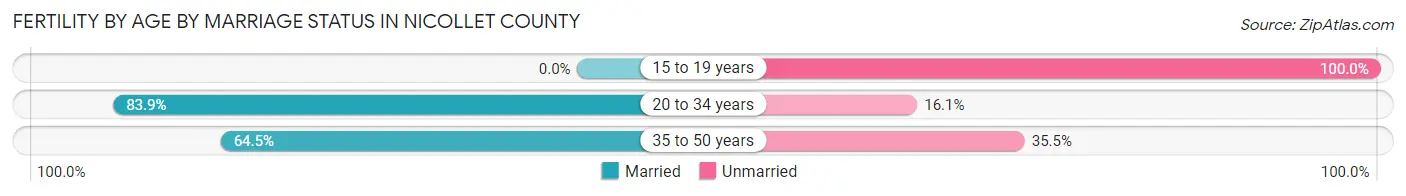
| Age Bracket | Married | Unmarried |
| 15 to 19 years | 0 (0.0%) | 36 (100.0%) |
| 20 to 34 years | 230 (83.9%) | 44 (16.1%) |
| 35 to 50 years | 78 (64.5%) | 43 (35.5%) |
| Total | 308 (71.5%) | 123 (28.5%) |
Fertility by Education in Nicollet County
Average fertility rate in Nicollet County is 54.0 births per 1,000 women. Women with the education attainment of graduate degree have the highest fertility rate of 91.0 births per 1,000 women, while women with the education attainment of high school diploma have the lowest fertility at 23.0 births per 1,000 women. Women with the education attainment of bachelor's degree represent 32.7% of all women with births.
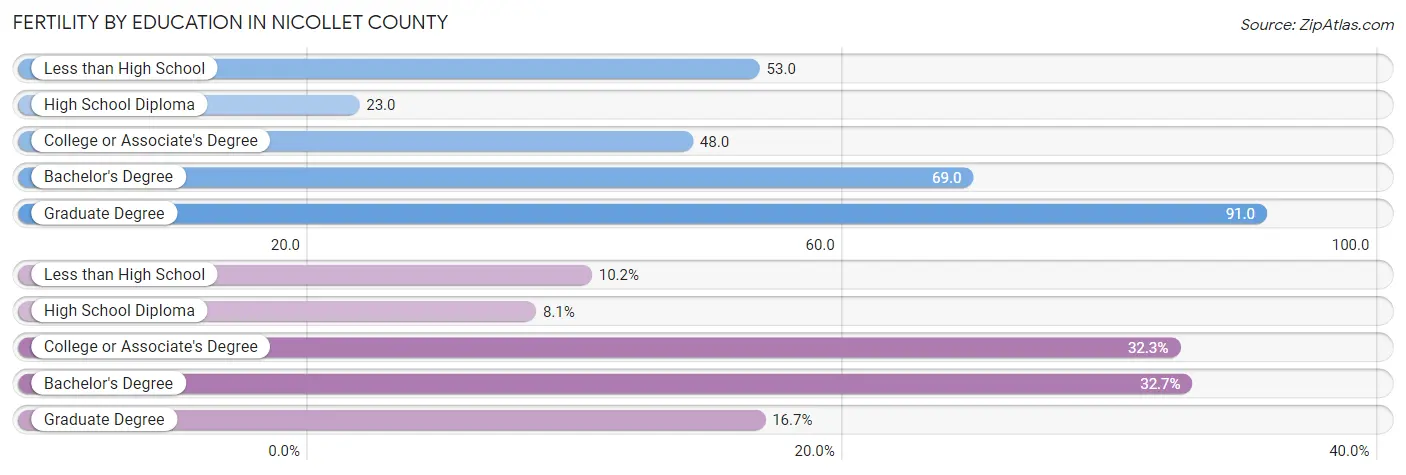
| Educational Attainment | Women with Births | Births / 1,000 Women |
| Less than High School | 44 (10.2%) | 53.0 |
| High School Diploma | 35 (8.1%) | 23.0 |
| College or Associate's Degree | 139 (32.3%) | 48.0 |
| Bachelor's Degree | 141 (32.7%) | 69.0 |
| Graduate Degree | 72 (16.7%) | 91.0 |
| Total | 431 (100.0%) | 54.0 |
Fertility by Education by Marriage Status in Nicollet County
28.5% of women with births in Nicollet County are unmarried. Women with the educational attainment of graduate degree are most likely to be married with 100.0% of them married at childbirth, while women with the educational attainment of less than high school are least likely to be married with 100.0% of them unmarried at childbirth.
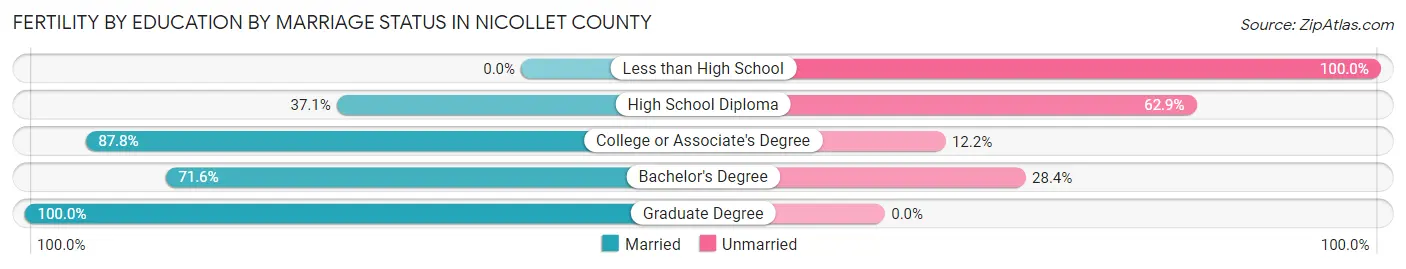
| Educational Attainment | Married | Unmarried |
| Less than High School | 0 (0.0%) | 44 (100.0%) |
| High School Diploma | 13 (37.1%) | 22 (62.9%) |
| College or Associate's Degree | 122 (87.8%) | 17 (12.2%) |
| Bachelor's Degree | 101 (71.6%) | 40 (28.4%) |
| Graduate Degree | 72 (100.0%) | 0 (0.0%) |
| Total | 308 (71.5%) | 123 (28.5%) |
Employment Characteristics in Nicollet County
Employment by Class of Employer in Nicollet County
Among the 18,663 employed individuals in Nicollet County, private company employees (11,932 | 63.9%), not-for-profit organizations (2,456 | 13.2%), and state government employees (1,258 | 6.7%) make up the most common classes of employment.

| Employer Class | # Employees | % Employees |
| Private Company Employees | 11,932 | 63.9% |
| Self-Employed (Incorporated) | 606 | 3.3% |
| Self-Employed (Not Incorporated) | 984 | 5.3% |
| Not-for-profit Organizations | 2,456 | 13.2% |
| Local Government Employees | 1,156 | 6.2% |
| State Government Employees | 1,258 | 6.7% |
| Federal Government Employees | 263 | 1.4% |
| Unpaid Family Workers | 8 | 0.0% |
| Total | 18,663 | 100.0% |
Employment Status by Age in Nicollet County
According to the labor force statistics for Nicollet County, out of the total population over 16 years of age (27,673), 70.7% or 19,565 individuals are in the labor force, with 1.9% or 372 of them unemployed. The age group with the highest labor force participation rate is 30 to 34 years, with 93.3% or 1,947 individuals in the labor force. Within the labor force, the 20 to 24 years age range has the highest percentage of unemployed individuals, with 4.6% or 117 of them being unemployed.

| Age Bracket | In Labor Force | Unemployed |
| 16 to 19 Years | 1,604 (63.3%) | 53 (3.3%) |
| 20 to 24 Years | 2,554 (90.8%) | 117 (4.6%) |
| 25 to 29 Years | 1,694 (92.9%) | 14 (0.8%) |
| 30 to 34 Years | 1,947 (93.3%) | 58 (3.0%) |
| 35 to 44 Years | 4,121 (89.8%) | 21 (0.5%) |
| 45 to 54 Years | 3,360 (87.3%) | 7 (0.2%) |
| 55 to 59 Years | 1,461 (80.0%) | 38 (2.6%) |
| 60 to 64 Years | 1,578 (67.5%) | 54 (3.4%) |
| 65 to 74 Years | 1,071 (32.8%) | 3 (0.3%) |
| 75 Years and over | 181 (7.1%) | 0 (0.0%) |
| Total | 19,565 (70.7%) | 372 (1.9%) |
Employment Status by Educational Attainment in Nicollet County
According to labor force statistics for Nicollet County, 85.8% of individuals (14,168) out of the total population between 25 and 64 years of age (16,513) are in the labor force, with 1.4% or 198 of them being unemployed. The group with the highest labor force participation rate are those with the educational attainment of bachelor's degree or higher, with 91.0% or 5,465 individuals in the labor force. Within the labor force, individuals with high school diploma education have the highest percentage of unemployment, with 2.1% or 57 of them being unemployed.
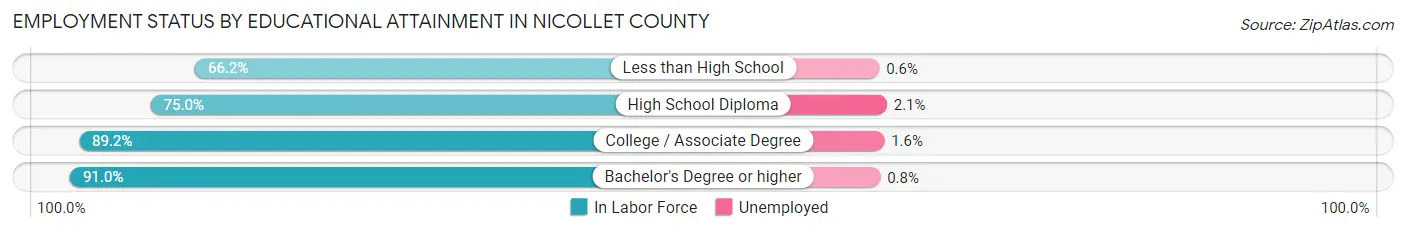
| Educational Attainment | In Labor Force | Unemployed |
| Less than High School | 480 (66.2%) | 4 (0.6%) |
| High School Diploma | 2,702 (75.0%) | 76 (2.1%) |
| College / Associate Degree | 5,512 (89.2%) | 99 (1.6%) |
| Bachelor's Degree or higher | 5,465 (91.0%) | 48 (0.8%) |
| Total | 14,168 (85.8%) | 231 (1.4%) |
Employment Occupations by Sex in Nicollet County
Management, Business, Science and Arts Occupations
The most common Management, Business, Science and Arts occupations in Nicollet County are Community & Social Service (2,505 | 13.1%), Management (1,724 | 9.0%), Education Instruction & Library (1,273 | 6.6%), Health Diagnosing & Treating (1,173 | 6.1%), and Business & Financial (1,001 | 5.2%).

Management, Business, Science and Arts Occupations by Sex
Within the Management, Business, Science and Arts occupations in Nicollet County, the most male-oriented occupations are Architecture & Engineering (92.3%), Computers & Mathematics (81.3%), and Computers, Engineering & Science (75.0%), while the most female-oriented occupations are Education Instruction & Library (74.6%), Education, Arts & Media (71.4%), and Health Technologists (71.0%).
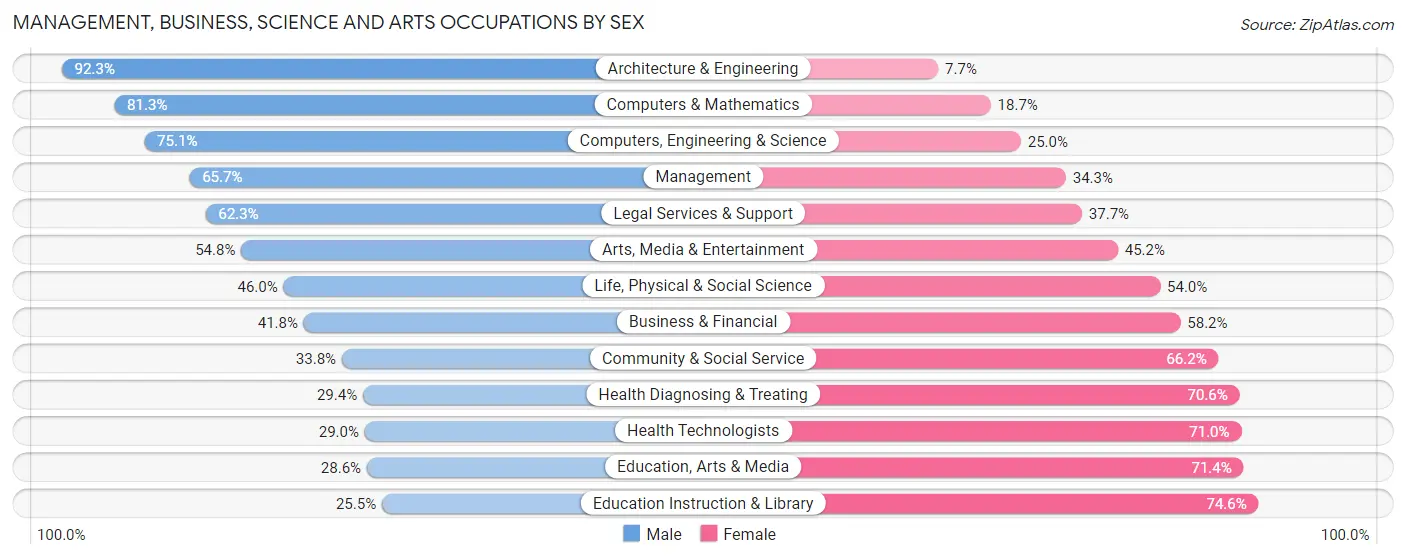
| Occupation | Male | Female |
| Management | 1,132 (65.7%) | 592 (34.3%) |
| Business & Financial | 418 (41.8%) | 583 (58.2%) |
| Computers, Engineering & Science | 713 (75.0%) | 237 (24.9%) |
| Computers & Mathematics | 318 (81.3%) | 73 (18.7%) |
| Architecture & Engineering | 275 (92.3%) | 23 (7.7%) |
| Life, Physical & Social Science | 120 (46.0%) | 141 (54.0%) |
| Community & Social Service | 847 (33.8%) | 1,658 (66.2%) |
| Education, Arts & Media | 181 (28.6%) | 452 (71.4%) |
| Legal Services & Support | 114 (62.3%) | 69 (37.7%) |
| Education Instruction & Library | 324 (25.5%) | 949 (74.6%) |
| Arts, Media & Entertainment | 228 (54.8%) | 188 (45.2%) |
| Health Diagnosing & Treating | 345 (29.4%) | 828 (70.6%) |
| Health Technologists | 237 (29.0%) | 579 (71.0%) |
| Total (Category) | 3,455 (47.0%) | 3,898 (53.0%) |
| Total (Overall) | 9,862 (51.4%) | 9,333 (48.6%) |
Services Occupations
The most common Services occupations in Nicollet County are Food Preparation & Serving (945 | 4.9%), Cleaning & Maintenance (817 | 4.3%), Healthcare Support (814 | 4.2%), Personal Care & Service (454 | 2.4%), and Security & Protection (225 | 1.2%).

Services Occupations by Sex
Within the Services occupations in Nicollet County, the most male-oriented occupations are Law Enforcement (96.4%), Security & Protection (87.1%), and Firefighting & Prevention (84.0%), while the most female-oriented occupations are Personal Care & Service (87.7%), Healthcare Support (61.9%), and Food Preparation & Serving (50.2%).
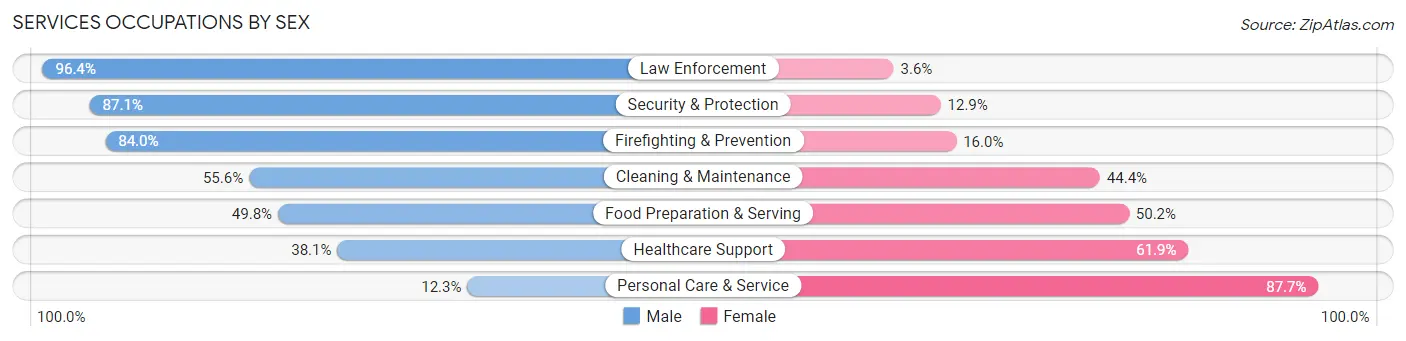
| Occupation | Male | Female |
| Healthcare Support | 310 (38.1%) | 504 (61.9%) |
| Security & Protection | 196 (87.1%) | 29 (12.9%) |
| Firefighting & Prevention | 142 (84.0%) | 27 (16.0%) |
| Law Enforcement | 54 (96.4%) | 2 (3.6%) |
| Food Preparation & Serving | 471 (49.8%) | 474 (50.2%) |
| Cleaning & Maintenance | 454 (55.6%) | 363 (44.4%) |
| Personal Care & Service | 56 (12.3%) | 398 (87.7%) |
| Total (Category) | 1,487 (45.7%) | 1,768 (54.3%) |
| Total (Overall) | 9,862 (51.4%) | 9,333 (48.6%) |
Sales and Office Occupations
The most common Sales and Office occupations in Nicollet County are Office & Administration (2,315 | 12.1%), and Sales & Related (1,869 | 9.7%).

Sales and Office Occupations by Sex

| Occupation | Male | Female |
| Sales & Related | 845 (45.2%) | 1,024 (54.8%) |
| Office & Administration | 619 (26.7%) | 1,696 (73.3%) |
| Total (Category) | 1,464 (35.0%) | 2,720 (65.0%) |
| Total (Overall) | 9,862 (51.4%) | 9,333 (48.6%) |
Natural Resources, Construction and Maintenance Occupations
The most common Natural Resources, Construction and Maintenance occupations in Nicollet County are Construction & Extraction (931 | 4.9%), Installation, Maintenance & Repair (508 | 2.6%), and Farming, Fishing & Forestry (122 | 0.6%).

Natural Resources, Construction and Maintenance Occupations by Sex
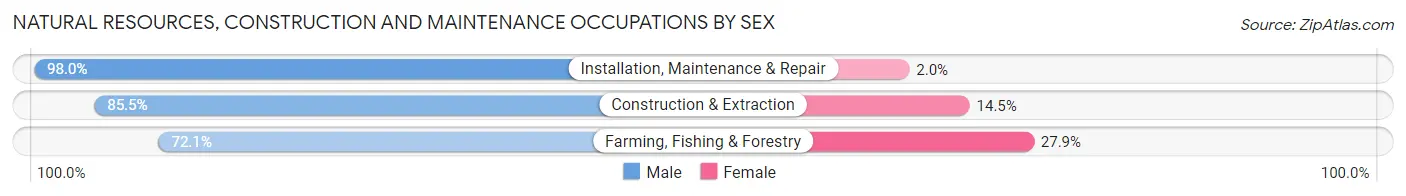
| Occupation | Male | Female |
| Farming, Fishing & Forestry | 88 (72.1%) | 34 (27.9%) |
| Construction & Extraction | 796 (85.5%) | 135 (14.5%) |
| Installation, Maintenance & Repair | 498 (98.0%) | 10 (2.0%) |
| Total (Category) | 1,382 (88.5%) | 179 (11.5%) |
| Total (Overall) | 9,862 (51.4%) | 9,333 (48.6%) |
Production, Transportation and Moving Occupations
The most common Production, Transportation and Moving occupations in Nicollet County are Production (1,441 | 7.5%), Material Moving (787 | 4.1%), and Transportation (614 | 3.2%).

Production, Transportation and Moving Occupations by Sex

| Occupation | Male | Female |
| Production | 991 (68.8%) | 450 (31.2%) |
| Transportation | 511 (83.2%) | 103 (16.8%) |
| Material Moving | 572 (72.7%) | 215 (27.3%) |
| Total (Category) | 2,074 (73.0%) | 768 (27.0%) |
| Total (Overall) | 9,862 (51.4%) | 9,333 (48.6%) |
Employment Industries by Sex in Nicollet County
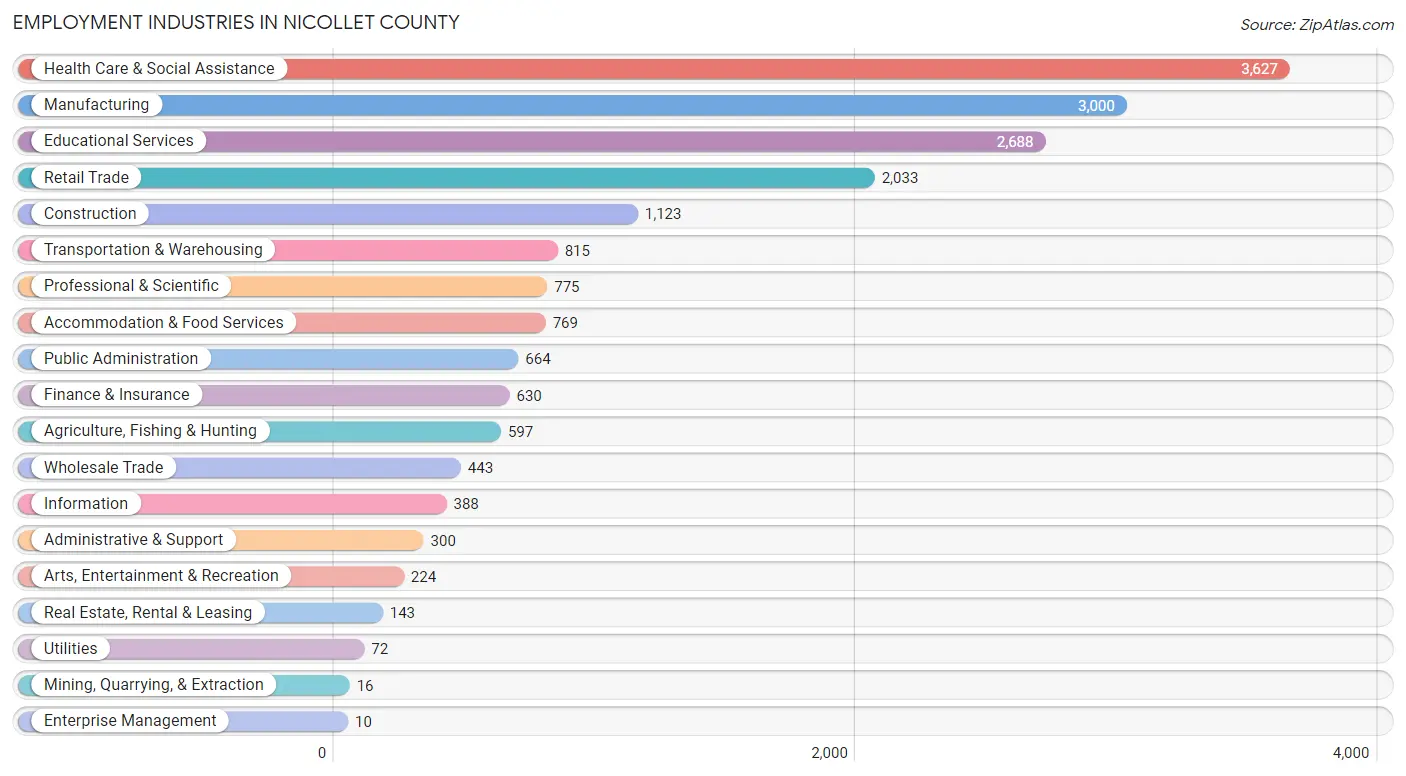
Employment Industries in Nicollet County
The major employment industries in Nicollet County include Health Care & Social Assistance (3,627 | 18.9%), Manufacturing (3,000 | 15.6%), Educational Services (2,688 | 14.0%), Retail Trade (2,033 | 10.6%), and Construction (1,123 | 5.9%).
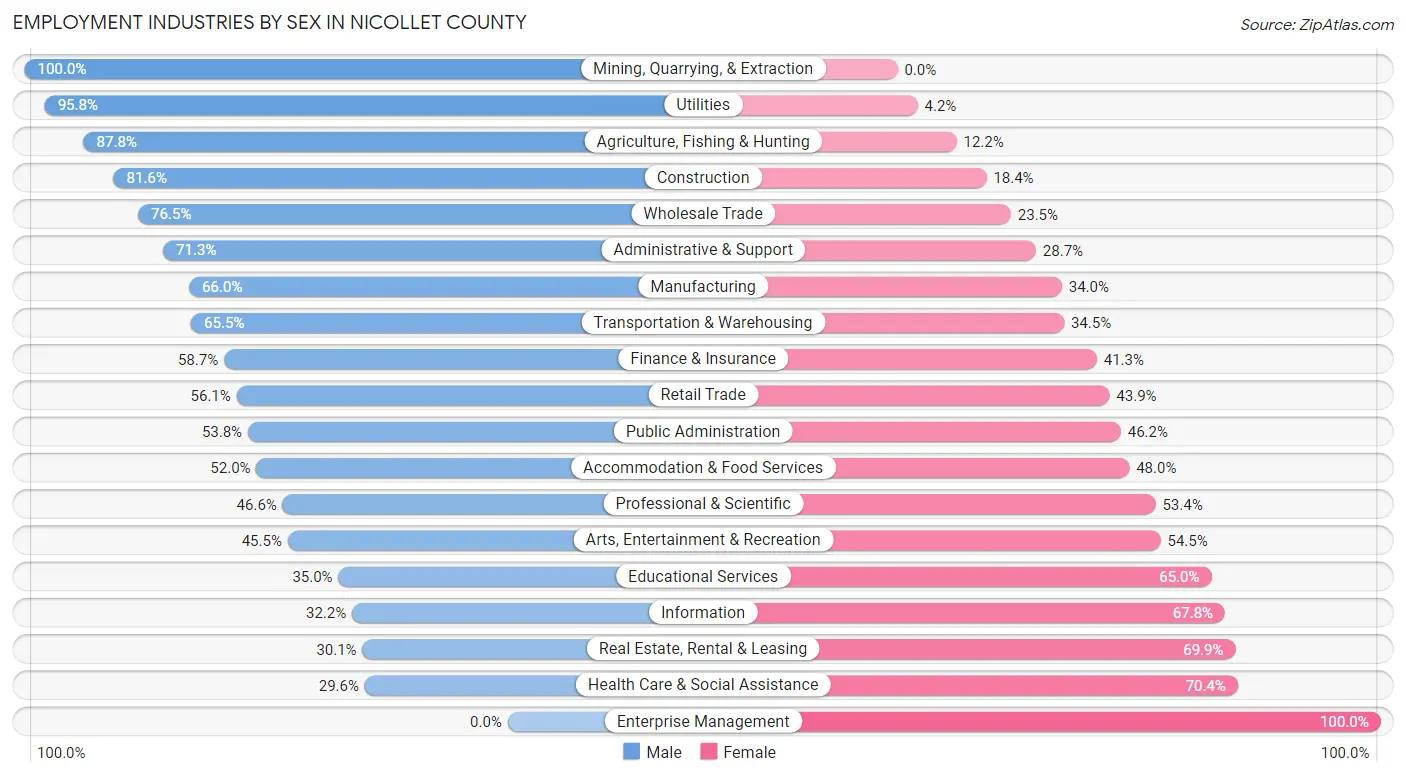
Employment Industries by Sex in Nicollet County
The Nicollet County industries that see more men than women are Mining, Quarrying, & Extraction (100.0%), Utilities (95.8%), and Agriculture, Fishing & Hunting (87.8%), whereas the industries that tend to have a higher number of women are Enterprise Management (100.0%), Health Care & Social Assistance (70.4%), and Real Estate, Rental & Leasing (69.9%).
| Industry | Male | Female |
| Agriculture, Fishing & Hunting | 524 (87.8%) | 73 (12.2%) |
| Mining, Quarrying, & Extraction | 16 (100.0%) | 0 (0.0%) |
| Construction | 916 (81.6%) | 207 (18.4%) |
| Manufacturing | 1,979 (66.0%) | 1,021 (34.0%) |
| Wholesale Trade | 339 (76.5%) | 104 (23.5%) |
| Retail Trade | 1,141 (56.1%) | 892 (43.9%) |
| Transportation & Warehousing | 534 (65.5%) | 281 (34.5%) |
| Utilities | 69 (95.8%) | 3 (4.2%) |
| Information | 125 (32.2%) | 263 (67.8%) |
| Finance & Insurance | 370 (58.7%) | 260 (41.3%) |
| Real Estate, Rental & Leasing | 43 (30.1%) | 100 (69.9%) |
| Professional & Scientific | 361 (46.6%) | 414 (53.4%) |
| Enterprise Management | 0 (0.0%) | 10 (100.0%) |
| Administrative & Support | 214 (71.3%) | 86 (28.7%) |
| Educational Services | 942 (35.0%) | 1,746 (65.0%) |
| Health Care & Social Assistance | 1,073 (29.6%) | 2,554 (70.4%) |
| Arts, Entertainment & Recreation | 102 (45.5%) | 122 (54.5%) |
| Accommodation & Food Services | 400 (52.0%) | 369 (48.0%) |
| Public Administration | 357 (53.8%) | 307 (46.2%) |
| Total | 9,862 (51.4%) | 9,333 (48.6%) |
Education in Nicollet County
School Enrollment in Nicollet County
The most common levels of schooling among the 9,349 students in Nicollet County are college / undergraduate (3,074 | 32.9%), middle school (1,884 | 20.2%), and high school (1,570 | 16.8%).
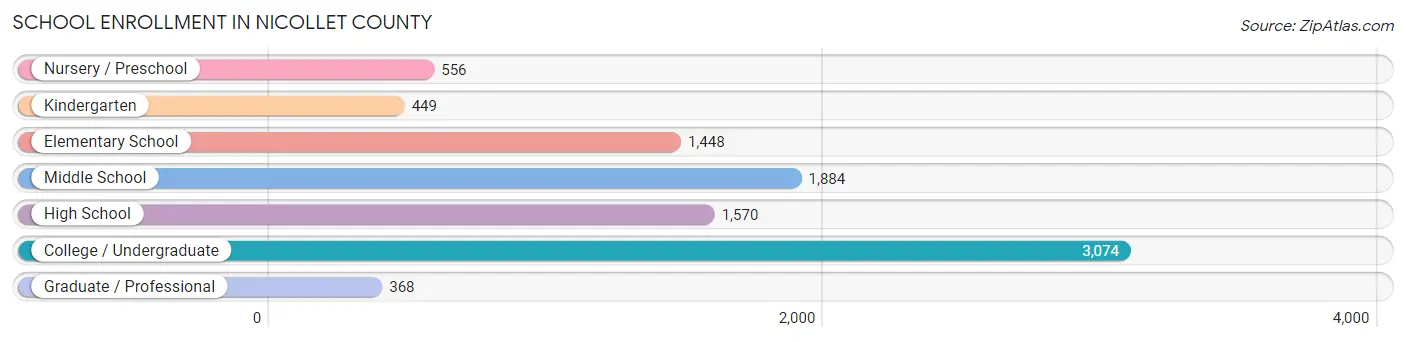
| School Level | # Students | % Students |
| Nursery / Preschool | 556 | 5.9% |
| Kindergarten | 449 | 4.8% |
| Elementary School | 1,448 | 15.5% |
| Middle School | 1,884 | 20.2% |
| High School | 1,570 | 16.8% |
| College / Undergraduate | 3,074 | 32.9% |
| Graduate / Professional | 368 | 3.9% |
| Total | 9,349 | 100.0% |
School Enrollment by Age by Funding Source in Nicollet County
Out of a total of 9,349 students who are enrolled in schools in Nicollet County, 3,487 (37.3%) attend a private institution, while the remaining 5,862 (62.7%) are enrolled in public schools. The age group of 18 to 19 year olds has the highest likelihood of being enrolled in private schools, with 1,188 (77.2% in the age bracket) enrolled. Conversely, the age group of 10 to 14 year olds has the lowest likelihood of being enrolled in a private school, with 2,003 (86.5% in the age bracket) attending a public institution.
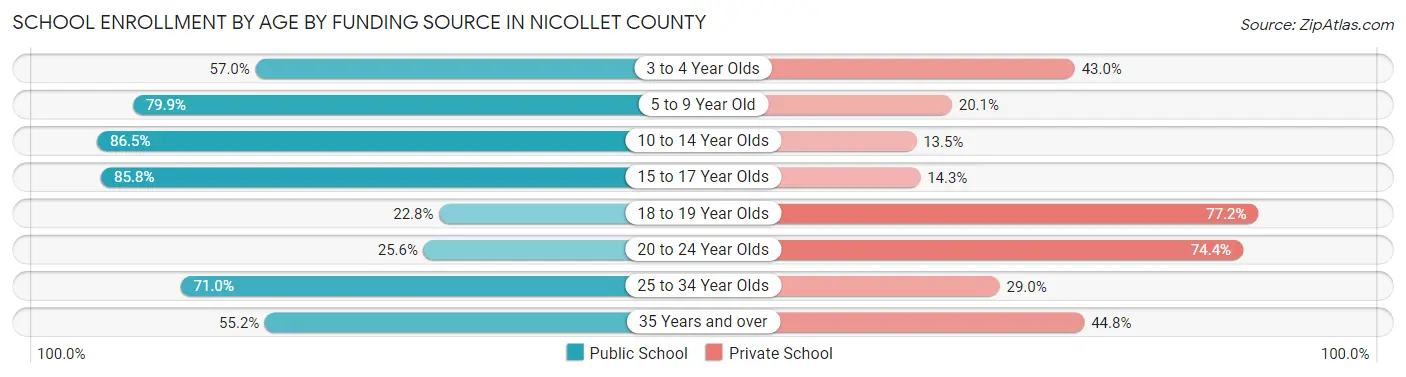
| Age Bracket | Public School | Private School |
| 3 to 4 Year Olds | 192 (57.0%) | 145 (43.0%) |
| 5 to 9 Year Old | 1,463 (79.9%) | 369 (20.1%) |
| 10 to 14 Year Olds | 2,003 (86.5%) | 313 (13.5%) |
| 15 to 17 Year Olds | 1,035 (85.8%) | 172 (14.2%) |
| 18 to 19 Year Olds | 350 (22.8%) | 1,188 (77.2%) |
| 20 to 24 Year Olds | 349 (25.6%) | 1,012 (74.4%) |
| 25 to 34 Year Olds | 237 (71.0%) | 97 (29.0%) |
| 35 Years and over | 234 (55.2%) | 190 (44.8%) |
| Total | 5,862 (62.7%) | 3,487 (37.3%) |
Educational Attainment by Field of Study in Nicollet County
Education (1,566 | 18.6%), business (1,339 | 15.9%), science & technology (1,018 | 12.1%), arts & humanities (800 | 9.5%), and social sciences (654 | 7.8%) are the most common fields of study among 8,430 individuals in Nicollet County who have obtained a bachelor's degree or higher.

| Field of Study | # Graduates | % Graduates |
| Computers & Mathematics | 234 | 2.8% |
| Bio, Nature & Agricultural | 570 | 6.8% |
| Physical & Health Sciences | 250 | 3.0% |
| Psychology | 406 | 4.8% |
| Social Sciences | 654 | 7.8% |
| Engineering | 202 | 2.4% |
| Multidisciplinary Studies | 23 | 0.3% |
| Science & Technology | 1,018 | 12.1% |
| Business | 1,339 | 15.9% |
| Education | 1,566 | 18.6% |
| Literature & Languages | 296 | 3.5% |
| Liberal Arts & History | 430 | 5.1% |
| Visual & Performing Arts | 362 | 4.3% |
| Communications | 280 | 3.3% |
| Arts & Humanities | 800 | 9.5% |
| Total | 8,430 | 100.0% |
Transportation & Commute in Nicollet County
Vehicle Availability by Sex in Nicollet County
The most prevalent vehicle ownership categories in Nicollet County are males with 2 vehicles (3,746, accounting for 42.8%) and females with 2 vehicles (3,613, making up 45.1%).
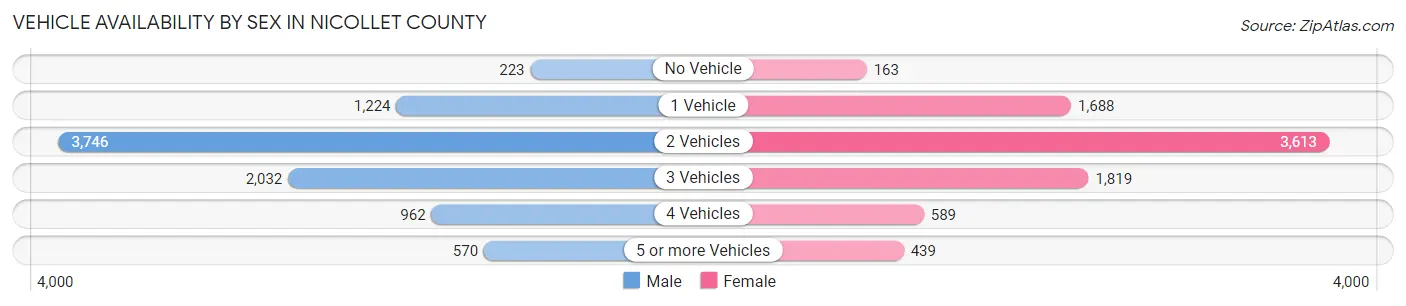
| Vehicles Available | Male | Female |
| No Vehicle | 223 (2.5%) | 163 (2.0%) |
| 1 Vehicle | 1,224 (14.0%) | 1,688 (20.3%) |
| 2 Vehicles | 3,746 (42.8%) | 3,613 (43.5%) |
| 3 Vehicles | 2,032 (23.2%) | 1,819 (21.9%) |
| 4 Vehicles | 962 (11.0%) | 589 (7.1%) |
| 5 or more Vehicles | 570 (6.5%) | 439 (5.3%) |
| Total | 8,757 (100.0%) | 8,311 (100.0%) |
Commute Time in Nicollet County
The most frequently occuring commute durations in Nicollet County are 5 to 9 minutes (3,701 commuters, 22.8%), 10 to 14 minutes (3,605 commuters, 22.2%), and 15 to 19 minutes (2,941 commuters, 18.1%).

| Commute Time | # Commuters | % Commuters |
| Less than 5 Minutes | 899 | 5.5% |
| 5 to 9 Minutes | 3,701 | 22.8% |
| 10 to 14 Minutes | 3,605 | 22.2% |
| 15 to 19 Minutes | 2,941 | 18.1% |
| 20 to 24 Minutes | 2,014 | 12.4% |
| 25 to 29 Minutes | 670 | 4.1% |
| 30 to 34 Minutes | 1,046 | 6.4% |
| 35 to 39 Minutes | 189 | 1.2% |
| 40 to 44 Minutes | 167 | 1.0% |
| 45 to 59 Minutes | 445 | 2.7% |
| 60 to 89 Minutes | 363 | 2.2% |
| 90 or more Minutes | 210 | 1.3% |
Commute Time by Sex in Nicollet County
The most common commute times in Nicollet County are 5 to 9 minutes (1,843 commuters, 21.5%) for males and 10 to 14 minutes (1,878 commuters, 24.5%) for females.

| Commute Time | Male | Female |
| Less than 5 Minutes | 451 (5.2%) | 448 (5.9%) |
| 5 to 9 Minutes | 1,843 (21.5%) | 1,858 (24.2%) |
| 10 to 14 Minutes | 1,727 (20.1%) | 1,878 (24.5%) |
| 15 to 19 Minutes | 1,599 (18.6%) | 1,342 (17.5%) |
| 20 to 24 Minutes | 1,042 (12.1%) | 972 (12.7%) |
| 25 to 29 Minutes | 455 (5.3%) | 215 (2.8%) |
| 30 to 34 Minutes | 670 (7.8%) | 376 (4.9%) |
| 35 to 39 Minutes | 51 (0.6%) | 138 (1.8%) |
| 40 to 44 Minutes | 102 (1.2%) | 65 (0.9%) |
| 45 to 59 Minutes | 252 (2.9%) | 193 (2.5%) |
| 60 to 89 Minutes | 222 (2.6%) | 141 (1.8%) |
| 90 or more Minutes | 174 (2.0%) | 36 (0.5%) |
Time of Departure to Work by Sex in Nicollet County
The most frequent times of departure to work in Nicollet County are 7:30 AM to 7:59 AM (1,380, 16.1%) for males and 7:30 AM to 7:59 AM (1,785, 23.3%) for females.
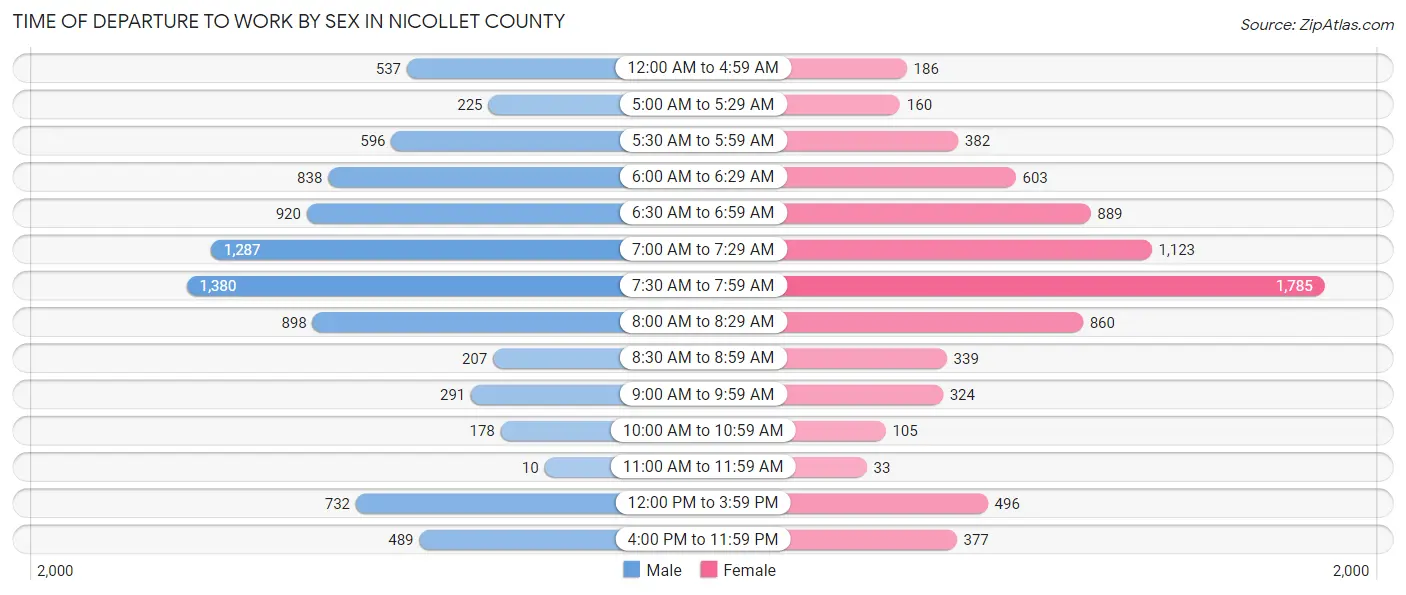
| Time of Departure | Male | Female |
| 12:00 AM to 4:59 AM | 537 (6.2%) | 186 (2.4%) |
| 5:00 AM to 5:29 AM | 225 (2.6%) | 160 (2.1%) |
| 5:30 AM to 5:59 AM | 596 (6.9%) | 382 (5.0%) |
| 6:00 AM to 6:29 AM | 838 (9.8%) | 603 (7.9%) |
| 6:30 AM to 6:59 AM | 920 (10.7%) | 889 (11.6%) |
| 7:00 AM to 7:29 AM | 1,287 (15.0%) | 1,123 (14.7%) |
| 7:30 AM to 7:59 AM | 1,380 (16.1%) | 1,785 (23.3%) |
| 8:00 AM to 8:29 AM | 898 (10.5%) | 860 (11.2%) |
| 8:30 AM to 8:59 AM | 207 (2.4%) | 339 (4.4%) |
| 9:00 AM to 9:59 AM | 291 (3.4%) | 324 (4.2%) |
| 10:00 AM to 10:59 AM | 178 (2.1%) | 105 (1.4%) |
| 11:00 AM to 11:59 AM | 10 (0.1%) | 33 (0.4%) |
| 12:00 PM to 3:59 PM | 732 (8.5%) | 496 (6.5%) |
| 4:00 PM to 11:59 PM | 489 (5.7%) | 377 (4.9%) |
| Total | 8,588 (100.0%) | 7,662 (100.0%) |
Housing Occupancy in Nicollet County
Occupancy by Ownership in Nicollet County
Of the total 12,913 dwellings in Nicollet County, owner-occupied units account for 9,585 (74.2%), while renter-occupied units make up 3,328 (25.8%).
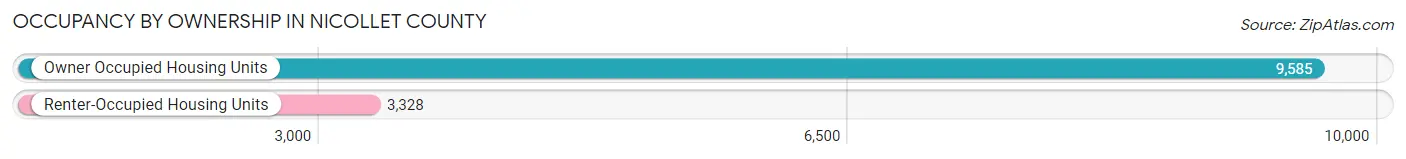
| Occupancy | # Housing Units | % Housing Units |
| Owner Occupied Housing Units | 9,585 | 74.2% |
| Renter-Occupied Housing Units | 3,328 | 25.8% |
| Total Occupied Housing Units | 12,913 | 100.0% |
Occupancy by Household Size in Nicollet County
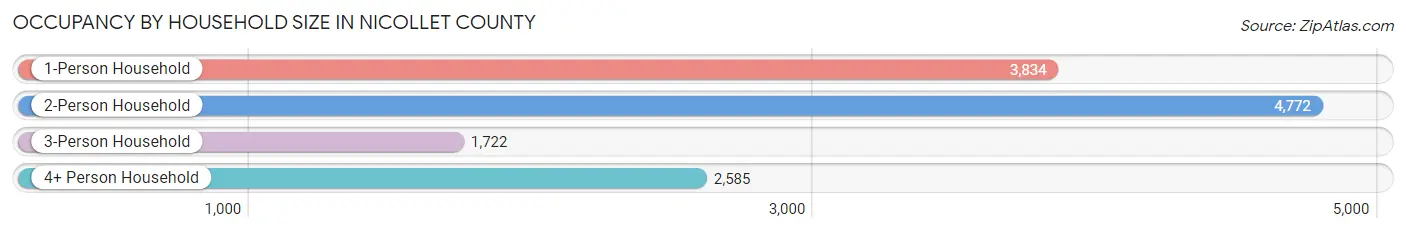
| Household Size | # Housing Units | % Housing Units |
| 1-Person Household | 3,834 | 29.7% |
| 2-Person Household | 4,772 | 37.0% |
| 3-Person Household | 1,722 | 13.3% |
| 4+ Person Household | 2,585 | 20.0% |
| Total Housing Units | 12,913 | 100.0% |
Occupancy by Ownership by Household Size in Nicollet County

| Household Size | Owner-occupied | Renter-occupied |
| 1-Person Household | 2,038 (53.2%) | 1,796 (46.8%) |
| 2-Person Household | 3,848 (80.6%) | 924 (19.4%) |
| 3-Person Household | 1,426 (82.8%) | 296 (17.2%) |
| 4+ Person Household | 2,273 (87.9%) | 312 (12.1%) |
| Total Housing Units | 9,585 (74.2%) | 3,328 (25.8%) |
Occupancy by Educational Attainment in Nicollet County
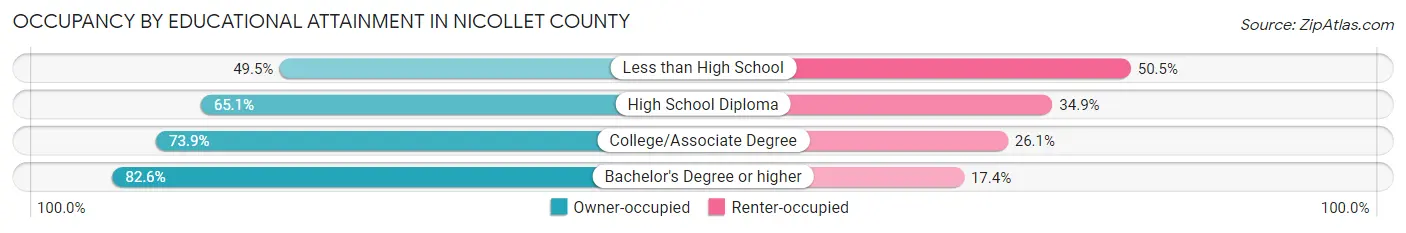
| Household Size | Owner-occupied | Renter-occupied |
| Less than High School | 260 (49.5%) | 265 (50.5%) |
| High School Diploma | 1,985 (65.1%) | 1,066 (34.9%) |
| College/Associate Degree | 3,162 (73.9%) | 1,116 (26.1%) |
| Bachelor's Degree or higher | 4,178 (82.6%) | 881 (17.4%) |
Occupancy by Age of Householder in Nicollet County

| Age Bracket | # Households | % Households |
| Under 35 Years | 2,449 | 19.0% |
| 35 to 44 Years | 2,318 | 17.9% |
| 45 to 54 Years | 2,111 | 16.4% |
| 55 to 64 Years | 2,464 | 19.1% |
| 65 to 74 Years | 1,983 | 15.4% |
| 75 to 84 Years | 1,026 | 8.0% |
| 85 Years and Over | 562 | 4.3% |
| Total | 12,913 | 100.0% |
Housing Finances in Nicollet County
Median Income by Occupancy in Nicollet County
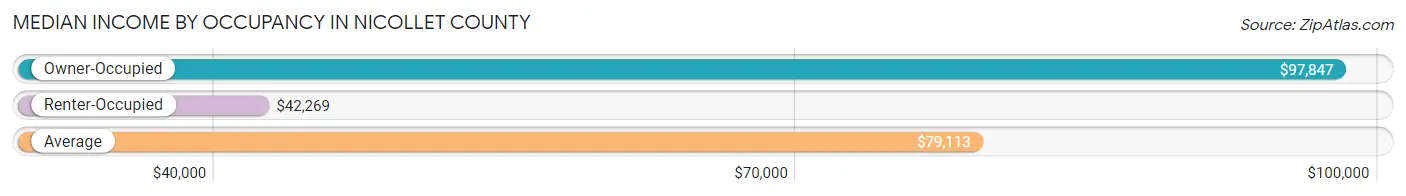
| Occupancy Type | # Households | Median Income |
| Owner-Occupied | 9,585 (74.2%) | $97,847 |
| Renter-Occupied | 3,328 (25.8%) | $42,269 |
| Average | 12,913 (100.0%) | $79,113 |
Occupancy by Householder Income Bracket in Nicollet County

| Income Bracket | Owner-occupied | Renter-occupied |
| Less than $5,000 | 81 (0.9%) | 130 (3.9%) |
| $5,000 to $9,999 | 120 (1.3%) | 28 (0.8%) |
| $10,000 to $14,999 | 130 (1.4%) | 318 (9.6%) |
| $15,000 to $19,999 | 173 (1.8%) | 271 (8.1%) |
| $20,000 to $24,999 | 166 (1.7%) | 158 (4.8%) |
| $25,000 to $34,999 | 554 (5.8%) | 397 (11.9%) |
| $35,000 to $49,999 | 813 (8.5%) | 614 (18.4%) |
| $50,000 to $74,999 | 1,476 (15.4%) | 706 (21.2%) |
| $75,000 to $99,999 | 1,481 (15.4%) | 257 (7.7%) |
| $100,000 to $149,999 | 2,463 (25.7%) | 367 (11.0%) |
| $150,000 or more | 2,128 (22.2%) | 82 (2.5%) |
| Total | 9,585 (100.0%) | 3,328 (100.0%) |
Monthly Housing Cost Tiers in Nicollet County

| Monthly Cost | Owner-occupied | Renter-occupied |
| Less than $300 | 216 (2.2%) | 64 (1.9%) |
| $300 to $499 | 813 (8.5%) | 213 (6.4%) |
| $500 to $799 | 1,958 (20.4%) | 789 (23.7%) |
| $800 to $999 | 878 (9.2%) | 923 (27.7%) |
| $1,000 to $1,499 | 2,157 (22.5%) | 905 (27.2%) |
| $1,500 to $1,999 | 1,760 (18.4%) | 211 (6.3%) |
| $2,000 to $2,499 | 923 (9.6%) | 41 (1.2%) |
| $2,500 to $2,999 | 453 (4.7%) | 62 (1.9%) |
| $3,000 or more | 427 (4.4%) | 13 (0.4%) |
| Total | 9,585 (100.0%) | 3,328 (100.0%) |
Physical Housing Characteristics in Nicollet County
Housing Structures in Nicollet County

| Structure Type | # Housing Units | % Housing Units |
| Single Unit, Detached | 8,898 | 68.9% |
| Single Unit, Attached | 680 | 5.3% |
| 2 Unit Apartments | 289 | 2.2% |
| 3 or 4 Unit Apartments | 452 | 3.5% |
| 5 to 9 Unit Apartments | 411 | 3.2% |
| 10 or more Apartments | 1,497 | 11.6% |
| Mobile Home / Other | 686 | 5.3% |
| Total | 12,913 | 100.0% |
Housing Structures by Occupancy in Nicollet County

| Structure Type | Owner-occupied | Renter-occupied |
| Single Unit, Detached | 8,344 (93.8%) | 554 (6.2%) |
| Single Unit, Attached | 456 (67.1%) | 224 (32.9%) |
| 2 Unit Apartments | 49 (17.0%) | 240 (83.0%) |
| 3 or 4 Unit Apartments | 86 (19.0%) | 366 (81.0%) |
| 5 to 9 Unit Apartments | 23 (5.6%) | 388 (94.4%) |
| 10 or more Apartments | 10 (0.7%) | 1,487 (99.3%) |
| Mobile Home / Other | 617 (89.9%) | 69 (10.1%) |
| Total | 9,585 (74.2%) | 3,328 (25.8%) |
Housing Structures by Number of Rooms in Nicollet County
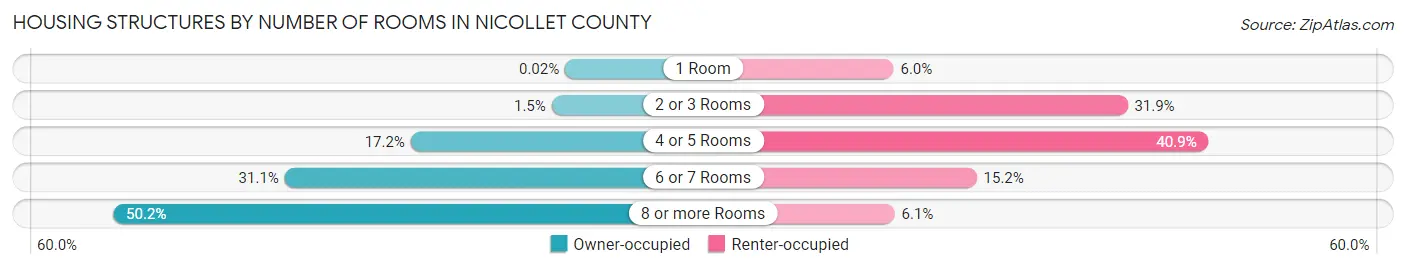
| Number of Rooms | Owner-occupied | Renter-occupied |
| 1 Room | 2 (0.0%) | 198 (5.9%) |
| 2 or 3 Rooms | 145 (1.5%) | 1,062 (31.9%) |
| 4 or 5 Rooms | 1,644 (17.2%) | 1,361 (40.9%) |
| 6 or 7 Rooms | 2,985 (31.1%) | 505 (15.2%) |
| 8 or more Rooms | 4,809 (50.2%) | 202 (6.1%) |
| Total | 9,585 (100.0%) | 3,328 (100.0%) |
Housing Structure by Heating Type in Nicollet County
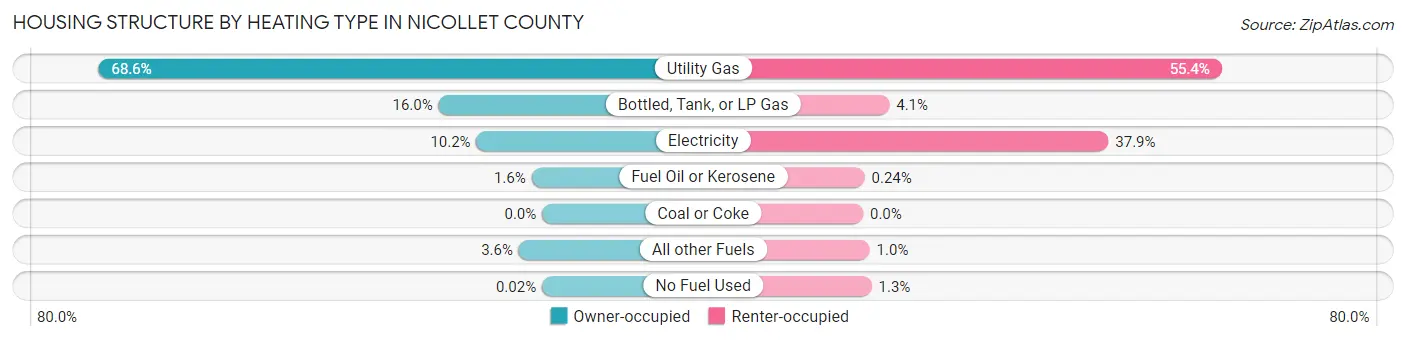
| Heating Type | Owner-occupied | Renter-occupied |
| Utility Gas | 6,574 (68.6%) | 1,845 (55.4%) |
| Bottled, Tank, or LP Gas | 1,535 (16.0%) | 135 (4.1%) |
| Electricity | 973 (10.2%) | 1,262 (37.9%) |
| Fuel Oil or Kerosene | 156 (1.6%) | 8 (0.2%) |
| Coal or Coke | 0 (0.0%) | 0 (0.0%) |
| All other Fuels | 345 (3.6%) | 34 (1.0%) |
| No Fuel Used | 2 (0.0%) | 44 (1.3%) |
| Total | 9,585 (100.0%) | 3,328 (100.0%) |
Household Vehicle Usage in Nicollet County
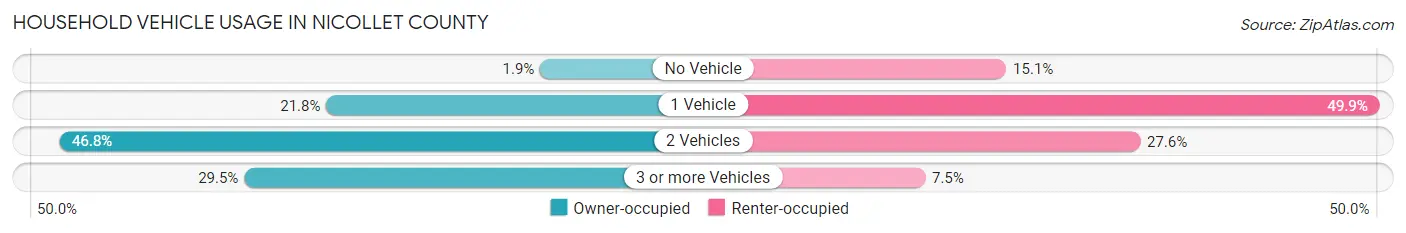
| Vehicles per Household | Owner-occupied | Renter-occupied |
| No Vehicle | 179 (1.9%) | 501 (15.0%) |
| 1 Vehicle | 2,093 (21.8%) | 1,661 (49.9%) |
| 2 Vehicles | 4,485 (46.8%) | 917 (27.6%) |
| 3 or more Vehicles | 2,828 (29.5%) | 249 (7.5%) |
| Total | 9,585 (100.0%) | 3,328 (100.0%) |
Real Estate & Mortgages in Nicollet County
Real Estate and Mortgage Overview in Nicollet County
| Characteristic | Without Mortgage | With Mortgage |
| Housing Units | 3,536 | 6,049 |
| Median Property Value | $228,600 | $246,900 |
| Median Household Income | $77,560 | $1,518 |
| Monthly Housing Costs | $627 | $415 |
| Real Estate Taxes | $2,563 | $106 |
Property Value by Mortgage Status in Nicollet County

| Property Value | Without Mortgage | With Mortgage |
| Less than $50,000 | 461 (13.0%) | 188 (3.1%) |
| $50,000 to $99,999 | 165 (4.7%) | 147 (2.4%) |
| $100,000 to $299,999 | 1,926 (54.5%) | 3,707 (61.3%) |
| $300,000 to $499,999 | 810 (22.9%) | 1,563 (25.8%) |
| $500,000 to $749,999 | 126 (3.6%) | 356 (5.9%) |
| $750,000 to $999,999 | 13 (0.4%) | 40 (0.7%) |
| $1,000,000 or more | 35 (1.0%) | 48 (0.8%) |
| Total | 3,536 (100.0%) | 6,049 (100.0%) |
Household Income by Mortgage Status in Nicollet County
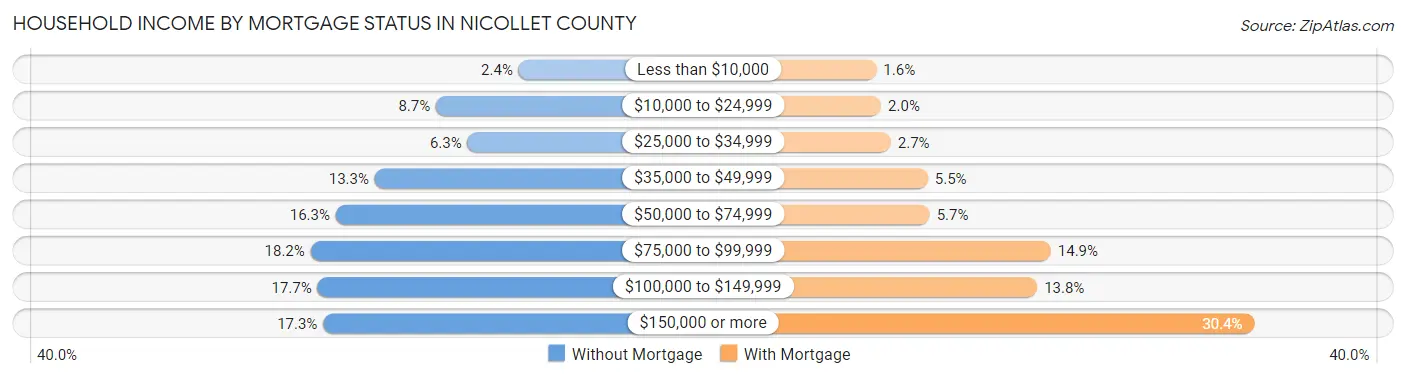
| Household Income | Without Mortgage | With Mortgage |
| Less than $10,000 | 83 (2.4%) | 96 (1.6%) |
| $10,000 to $24,999 | 306 (8.6%) | 118 (1.9%) |
| $25,000 to $34,999 | 221 (6.2%) | 163 (2.7%) |
| $35,000 to $49,999 | 471 (13.3%) | 333 (5.5%) |
| $50,000 to $74,999 | 576 (16.3%) | 342 (5.7%) |
| $75,000 to $99,999 | 644 (18.2%) | 900 (14.9%) |
| $100,000 to $149,999 | 625 (17.7%) | 837 (13.8%) |
| $150,000 or more | 610 (17.2%) | 1,838 (30.4%) |
| Total | 3,536 (100.0%) | 6,049 (100.0%) |
Property Value to Household Income Ratio in Nicollet County

| Value-to-Income Ratio | Without Mortgage | With Mortgage |
| Less than 2.0x | 1,318 (37.3%) | 109,358 (1,807.9%) |
| 2.0x to 2.9x | 472 (13.4%) | 2,507 (41.4%) |
| 3.0x to 3.9x | 725 (20.5%) | 1,674 (27.7%) |
| 4.0x or more | 983 (27.8%) | 743 (12.3%) |
| Total | 3,536 (100.0%) | 6,049 (100.0%) |
Real Estate Taxes by Mortgage Status in Nicollet County

| Property Taxes | Without Mortgage | With Mortgage |
| Less than $800 | 460 (13.0%) | 6 (0.1%) |
| $800 to $1,499 | 284 (8.0%) | 412 (6.8%) |
| $800 to $1,499 | 2,612 (73.9%) | 721 (11.9%) |
| Total | 3,536 (100.0%) | 6,049 (100.0%) |
Health & Disability in Nicollet County
Health Insurance Coverage by Age in Nicollet County
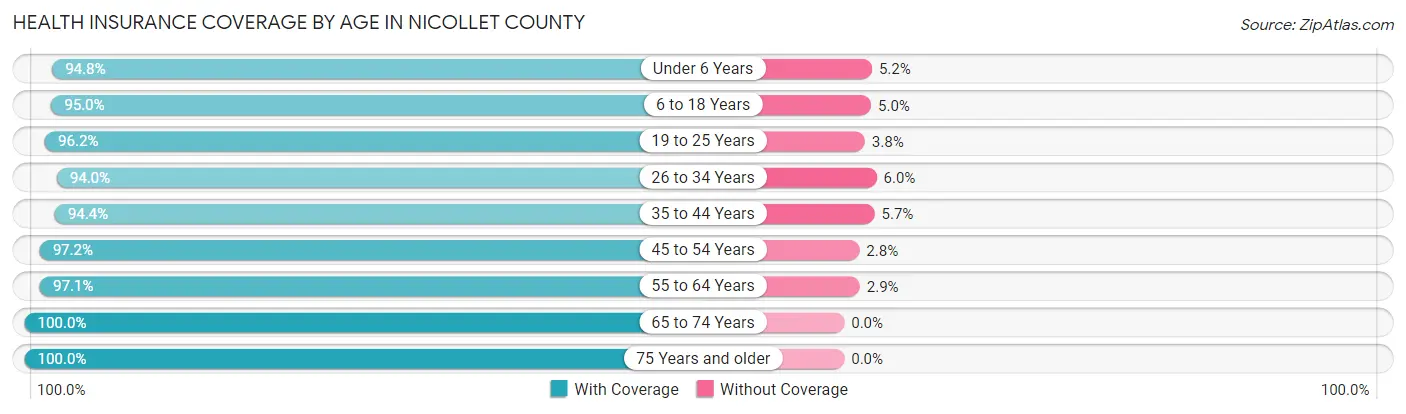
| Age Bracket | With Coverage | Without Coverage |
| Under 6 Years | 2,132 (94.8%) | 116 (5.2%) |
| 6 to 18 Years | 5,739 (95.0%) | 302 (5.0%) |
| 19 to 25 Years | 3,904 (96.2%) | 156 (3.8%) |
| 26 to 34 Years | 3,342 (94.0%) | 214 (6.0%) |
| 35 to 44 Years | 4,326 (94.4%) | 259 (5.7%) |
| 45 to 54 Years | 3,716 (97.2%) | 108 (2.8%) |
| 55 to 64 Years | 4,018 (97.1%) | 120 (2.9%) |
| 65 to 74 Years | 3,243 (100.0%) | 0 (0.0%) |
| 75 Years and older | 2,384 (100.0%) | 0 (0.0%) |
| Total | 32,804 (96.3%) | 1,275 (3.7%) |
Health Insurance Coverage by Citizenship Status in Nicollet County
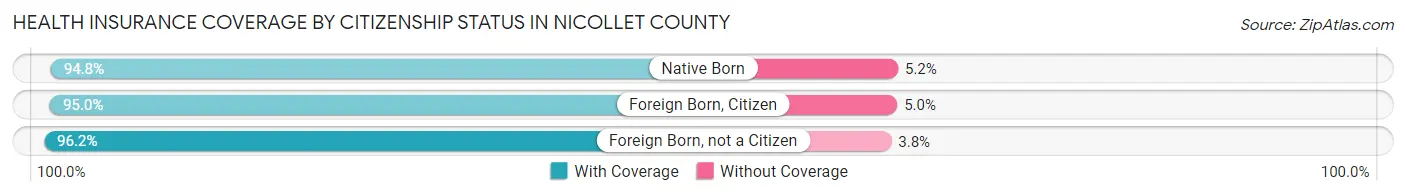
| Citizenship Status | With Coverage | Without Coverage |
| Native Born | 2,132 (94.8%) | 116 (5.2%) |
| Foreign Born, Citizen | 5,739 (95.0%) | 302 (5.0%) |
| Foreign Born, not a Citizen | 3,904 (96.2%) | 156 (3.8%) |
Health Insurance Coverage by Household Income in Nicollet County
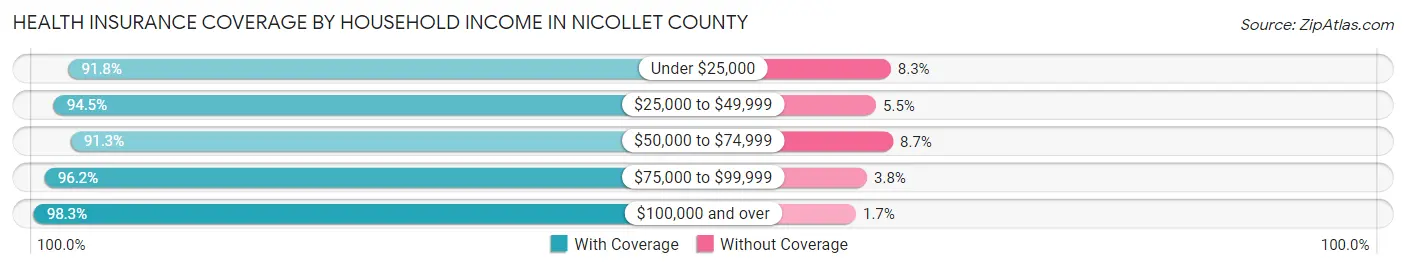
| Household Income | With Coverage | Without Coverage |
| Under $25,000 | 2,234 (91.7%) | 201 (8.3%) |
| $25,000 to $49,999 | 3,786 (94.5%) | 220 (5.5%) |
| $50,000 to $74,999 | 4,055 (91.3%) | 385 (8.7%) |
| $75,000 to $99,999 | 4,172 (96.2%) | 165 (3.8%) |
| $100,000 and over | 15,591 (98.3%) | 274 (1.7%) |
Public vs Private Health Insurance Coverage by Age in Nicollet County

| Age Bracket | Public Insurance | Private Insurance |
| Under 6 | 681 (30.3%) | 1,689 (75.1%) |
| 6 to 18 Years | 1,315 (21.8%) | 4,791 (79.3%) |
| 19 to 25 Years | 522 (12.9%) | 3,528 (86.9%) |
| 25 to 34 Years | 874 (24.6%) | 2,626 (73.9%) |
| 35 to 44 Years | 1,010 (22.0%) | 3,679 (80.2%) |
| 45 to 54 Years | 579 (15.1%) | 3,258 (85.2%) |
| 55 to 64 Years | 771 (18.6%) | 3,408 (82.4%) |
| 65 to 74 Years | 3,114 (96.0%) | 2,312 (71.3%) |
| 75 Years and over | 2,348 (98.5%) | 1,857 (77.9%) |
| Total | 11,214 (32.9%) | 27,148 (79.7%) |
Disability Status by Sex by Age in Nicollet County
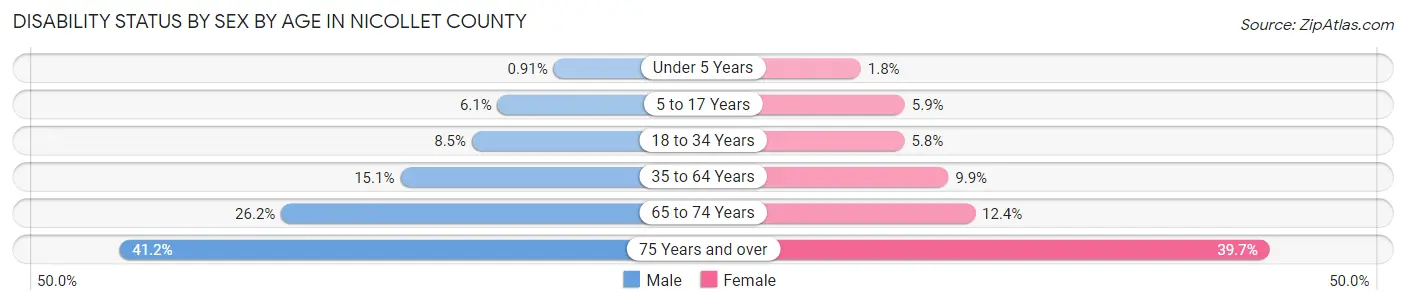
| Age Bracket | Male | Female |
| Under 5 Years | 8 (0.9%) | 18 (1.8%) |
| 5 to 17 Years | 174 (6.1%) | 157 (5.9%) |
| 18 to 34 Years | 363 (8.5%) | 244 (5.8%) |
| 35 to 64 Years | 995 (15.1%) | 591 (9.9%) |
| 65 to 74 Years | 428 (26.2%) | 199 (12.4%) |
| 75 Years and over | 401 (41.2%) | 560 (39.7%) |
Disability Class by Sex by Age in Nicollet County
Disability Class: Hearing Difficulty

| Age Bracket | Male | Female |
| Under 5 Years | 0 (0.0%) | 18 (1.8%) |
| 5 to 17 Years | 4 (0.1%) | 8 (0.3%) |
| 18 to 34 Years | 75 (1.8%) | 13 (0.3%) |
| 35 to 64 Years | 217 (3.3%) | 146 (2.4%) |
| 65 to 74 Years | 211 (12.9%) | 24 (1.5%) |
| 75 Years and over | 267 (27.4%) | 274 (19.4%) |
Disability Class: Vision Difficulty

| Age Bracket | Male | Female |
| Under 5 Years | 8 (0.9%) | 0 (0.0%) |
| 5 to 17 Years | 11 (0.4%) | 17 (0.6%) |
| 18 to 34 Years | 42 (1.0%) | 18 (0.4%) |
| 35 to 64 Years | 172 (2.6%) | 54 (0.9%) |
| 65 to 74 Years | 40 (2.5%) | 80 (5.0%) |
| 75 Years and over | 30 (3.1%) | 67 (4.8%) |
Disability Class: Cognitive Difficulty

| Age Bracket | Male | Female |
| 5 to 17 Years | 140 (4.9%) | 144 (5.4%) |
| 18 to 34 Years | 210 (4.9%) | 204 (4.9%) |
| 35 to 64 Years | 427 (6.5%) | 312 (5.2%) |
| 65 to 74 Years | 53 (3.2%) | 31 (1.9%) |
| 75 Years and over | 74 (7.6%) | 26 (1.8%) |
Disability Class: Ambulatory Difficulty
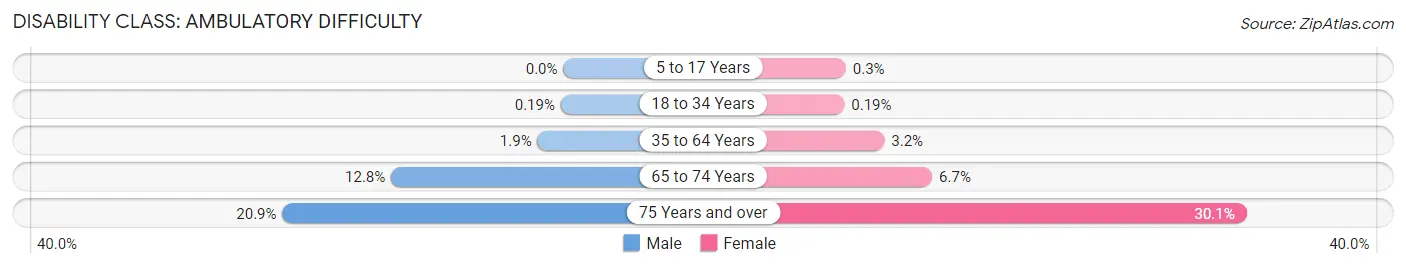
| Age Bracket | Male | Female |
| 5 to 17 Years | 0 (0.0%) | 8 (0.3%) |
| 18 to 34 Years | 8 (0.2%) | 8 (0.2%) |
| 35 to 64 Years | 126 (1.9%) | 189 (3.2%) |
| 65 to 74 Years | 209 (12.8%) | 108 (6.7%) |
| 75 Years and over | 203 (20.9%) | 424 (30.0%) |
Disability Class: Self-Care Difficulty
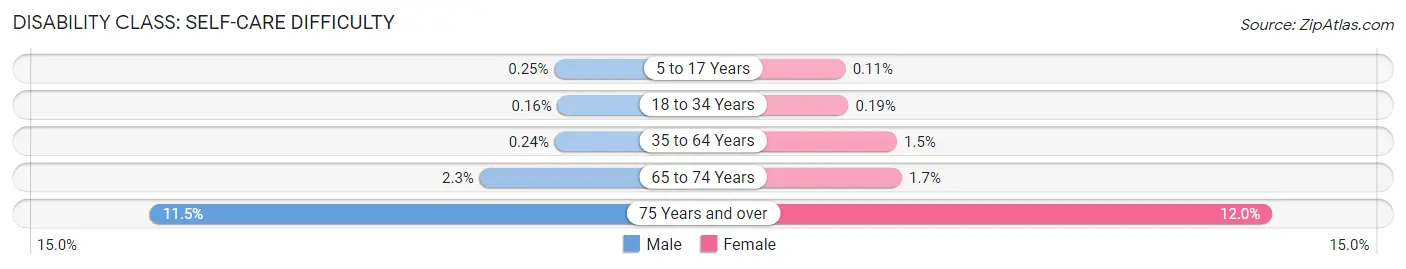
| Age Bracket | Male | Female |
| 5 to 17 Years | 7 (0.3%) | 3 (0.1%) |
| 18 to 34 Years | 7 (0.2%) | 8 (0.2%) |
| 35 to 64 Years | 16 (0.2%) | 92 (1.5%) |
| 65 to 74 Years | 38 (2.3%) | 27 (1.7%) |
| 75 Years and over | 112 (11.5%) | 169 (12.0%) |
Technology Access in Nicollet County
Computing Device Access in Nicollet County
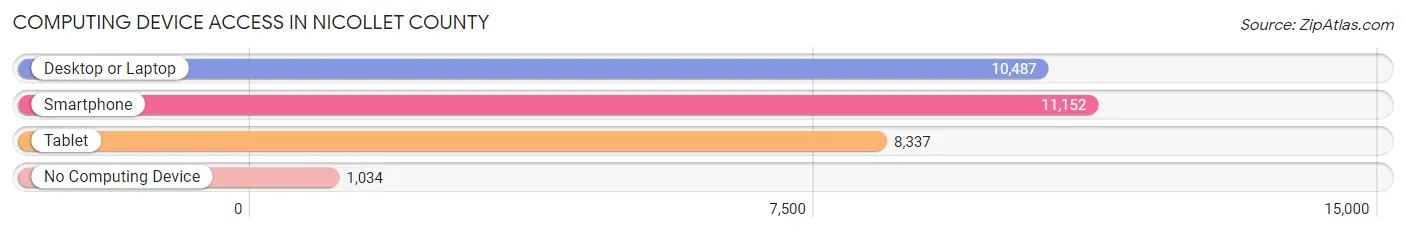
| Device Type | # Households | % Households |
| Desktop or Laptop | 10,487 | 81.2% |
| Smartphone | 11,152 | 86.4% |
| Tablet | 8,337 | 64.6% |
| No Computing Device | 1,034 | 8.0% |
| Total | 12,913 | 100.0% |
Internet Access in Nicollet County

| Internet Type | # Households | % Households |
| Dial-Up Internet | 31 | 0.2% |
| Broadband Home | 9,209 | 71.3% |
| Cellular Data Only | 1,444 | 11.2% |
| Satellite Internet | 1,017 | 7.9% |
| No Internet | 1,550 | 12.0% |
| Total | 12,913 | 100.0% |
Nicollet County Summary
Nicollet County is located in the south central region of Minnesota, and is part of the Mankato-North Mankato Metropolitan Statistical Area. The county was established in 1853 and is named after French explorer Joseph Nicollet. As of the 2010 census, the population was 32,727.
Geography
Nicollet County is located in the south central region of Minnesota, and is bordered by Blue Earth County to the north, Le Sueur County to the east, Sibley County to the south, and Brown County to the west. The county has a total area of 576 square miles, of which 573 square miles is land and 3.2 square miles is water. The county is located in the Minnesota River Valley, and is home to several rivers and streams, including the Minnesota River, the Blue Earth River, and the Watonwan River. The county is also home to several lakes, including Lake Washington, Lake Elysian, and Lake Tetonka.
The county is home to several state parks, including Fort Ridgely State Park, Sibley State Park, and Minneopa State Park. The county is also home to several wildlife management areas, including the Minnesota Valley National Wildlife Refuge, the Minnesota Valley State Recreation Area, and the Minnesota Valley State Wildlife Management Area.
Demographics
As of the 2010 census, there were 32,727 people, 12,845 households, and 8,845 families residing in the county. The population density was 57.2 people per square mile. The racial makeup of the county was 94.2% White, 0.7% African American, 0.4% Native American, 0.5% Asian, 0.1% Pacific Islander, 2.7% from other races, and 1.5% from two or more races. Hispanic or Latino of any race were 5.2% of the population.
The median income for a household in the county was $50,945, and the median income for a family was $60,945. The per capita income for the county was $24,845. About 6.2% of families and 8.7% of the population were below the poverty line, including 10.2% of those under age 18 and 8.2% of those age 65 or over.
Economy
Nicollet County is home to several industries, including agriculture, manufacturing, and tourism. The county is home to several large agricultural operations, including dairy farms, hog farms, and grain farms. The county is also home to several manufacturing companies, including 3M, Cargill, and Hormel.
The county is also home to several tourist attractions, including the Minnesota Valley National Wildlife Refuge, the Minnesota Valley State Recreation Area, and the Minnesota Valley State Wildlife Management Area. The county is also home to several museums, including the Nicollet County Historical Society Museum and the Minnesota Valley History Center.
Conclusion
Nicollet County is a vibrant and diverse county located in the south central region of Minnesota. The county is home to several industries, including agriculture, manufacturing, and tourism. The county is also home to several state parks, wildlife management areas, and museums. The population of the county is 32,727, and the median income for a household is $50,945. Nicollet County is a great place to live, work, and visit.
Common Questions
What is Per Capita Income in Nicollet County?
Per Capita income in Nicollet County is $41,658.
What is the Median Family Income in Nicollet County?
Median Family Income in Nicollet County is $103,117.
What is the Median Household income in Nicollet County?
Median Household Income in Nicollet County is $79,113.
What is Income or Wage Gap in Nicollet County?
Income or Wage Gap in Nicollet County is 23.0%.
Women in Nicollet County earn 77.0 cents for every dollar earned by a man.
What is Family Income Deficit in Nicollet County?
Family Income Deficit in Nicollet County is $9,215.
Families that are below poverty line in Nicollet County earn $9,215 less on average than the poverty threshold level.
What is Inequality or Gini Index in Nicollet County?
Inequality or Gini Index in Nicollet County is 0.46.
What is the Total Population of Nicollet County?
Total Population of Nicollet County is 34,380.
What is the Total Male Population of Nicollet County?
Total Male Population of Nicollet County is 17,372.
What is the Total Female Population of Nicollet County?
Total Female Population of Nicollet County is 17,008.
What is the Ratio of Males per 100 Females in Nicollet County?
There are 102.14 Males per 100 Females in Nicollet County.
What is the Ratio of Females per 100 Males in Nicollet County?
There are 97.90 Females per 100 Males in Nicollet County.
What is the Median Population Age in Nicollet County?
Median Population Age in Nicollet County is 37.1 Years.
What is the Average Family Size in Nicollet County
Average Family Size in Nicollet County is 3.0 People.
What is the Average Household Size in Nicollet County
Average Household Size in Nicollet County is 2.4 People.
How Large is the Labor Force in Nicollet County?
There are 19,565 People in the Labor Forcein in Nicollet County.
What is the Percentage of People in the Labor Force in Nicollet County?
70.7% of People are in the Labor Force in Nicollet County.
What is the Unemployment Rate in Nicollet County?
Unemployment Rate in Nicollet County is 1.9%.