Faribault County, MN Map & Demographics
Faribault County Map
Faribault County Overview
$35,307
PER CAPITA INCOME
$85,360
AVG FAMILY INCOME
$64,000
AVG HOUSEHOLD INCOME
31.4%
WAGE / INCOME GAP [ % ]
68.6¢/ $1
WAGE / INCOME GAP [ $ ]
$9,957
FAMILY INCOME DEFICIT
0.42
INEQUALITY / GINI INDEX
13,931
TOTAL POPULATION
7,120
MALE POPULATION
6,811
FEMALE POPULATION
104.54
MALES / 100 FEMALES
95.66
FEMALES / 100 MALES
44.6
MEDIAN AGE
2.8
AVG FAMILY SIZE
2.3
AVG HOUSEHOLD SIZE
7,203
LABOR FORCE [ PEOPLE ]
63.9%
PERCENT IN LABOR FORCE
4.3%
UNEMPLOYMENT RATE
Faribault County Area Codes
Income in Faribault County
Income Overview in Faribault County
Per Capita Income in Faribault County is $35,307, while median incomes of families and households are $85,360 and $64,000 respectively.
| Characteristic | Number | Measure |
| Per Capita Income | 13,931 | $35,307 |
| Median Family Income | 3,821 | $85,360 |
| Mean Family Income | 3,821 | $99,032 |
| Median Household Income | 6,006 | $64,000 |
| Mean Household Income | 6,006 | $81,221 |
| Income Deficit | 3,821 | $9,957 |
| Wage / Income Gap (%) | 13,931 | 31.41% |
| Wage / Income Gap ($) | 13,931 | 68.59¢ per $1 |
| Gini / Inequality Index | 13,931 | 0.42 |
Earnings by Sex in Faribault County
Average Earnings in Faribault County are $38,806, $45,760 for men and $31,386 for women, a difference of 31.4%.
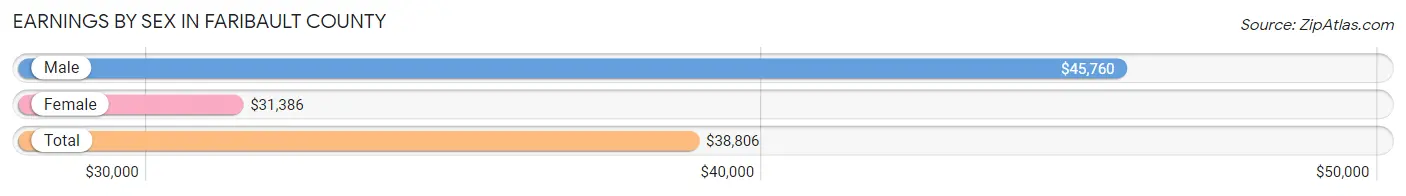
| Sex | Number | Average Earnings |
| Male | 4,121 (53.6%) | $45,760 |
| Female | 3,566 (46.4%) | $31,386 |
| Total | 7,687 (100.0%) | $38,806 |
Earnings by Sex by Income Bracket in Faribault County
The most common earnings brackets in Faribault County are $55,000 to $64,999 for men (493 | 12.0%) and $40,000 to $44,999 for women (292 | 8.2%).
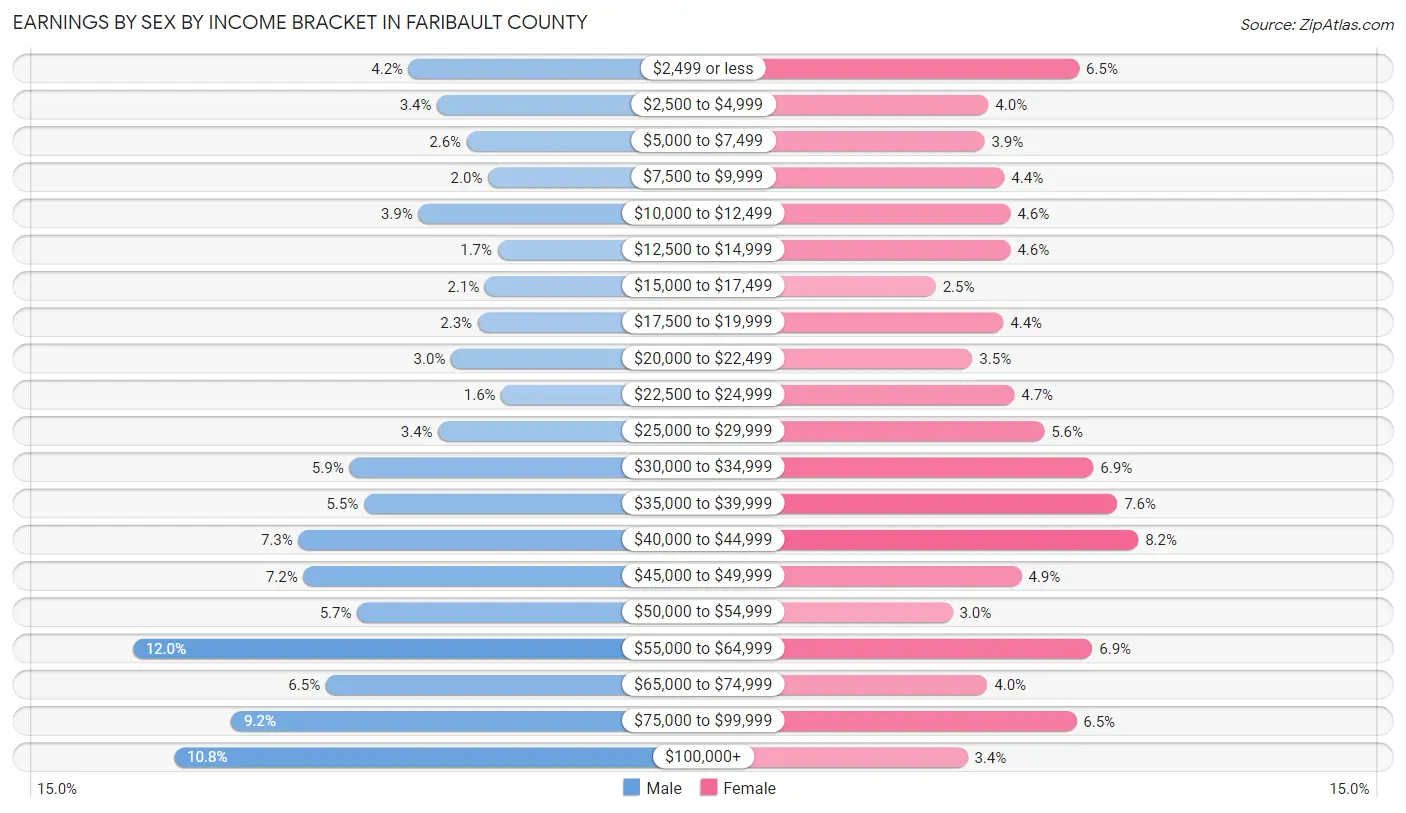
| Income | Male | Female |
| $2,499 or less | 173 (4.2%) | 233 (6.5%) |
| $2,500 to $4,999 | 140 (3.4%) | 142 (4.0%) |
| $5,000 to $7,499 | 106 (2.6%) | 138 (3.9%) |
| $7,500 to $9,999 | 81 (2.0%) | 158 (4.4%) |
| $10,000 to $12,499 | 162 (3.9%) | 164 (4.6%) |
| $12,500 to $14,999 | 70 (1.7%) | 164 (4.6%) |
| $15,000 to $17,499 | 85 (2.1%) | 89 (2.5%) |
| $17,500 to $19,999 | 93 (2.3%) | 157 (4.4%) |
| $20,000 to $22,499 | 124 (3.0%) | 126 (3.5%) |
| $22,500 to $24,999 | 66 (1.6%) | 168 (4.7%) |
| $25,000 to $29,999 | 139 (3.4%) | 198 (5.6%) |
| $30,000 to $34,999 | 242 (5.9%) | 247 (6.9%) |
| $35,000 to $39,999 | 225 (5.5%) | 271 (7.6%) |
| $40,000 to $44,999 | 301 (7.3%) | 292 (8.2%) |
| $45,000 to $49,999 | 295 (7.2%) | 175 (4.9%) |
| $50,000 to $54,999 | 233 (5.7%) | 106 (3.0%) |
| $55,000 to $64,999 | 493 (12.0%) | 246 (6.9%) |
| $65,000 to $74,999 | 269 (6.5%) | 141 (4.0%) |
| $75,000 to $99,999 | 379 (9.2%) | 230 (6.5%) |
| $100,000+ | 445 (10.8%) | 121 (3.4%) |
| Total | 4,121 (100.0%) | 3,566 (100.0%) |
Earnings by Sex by Educational Attainment in Faribault County
Average earnings in Faribault County are $49,929 for men and $35,071 for women, a difference of 29.8%. Men with an educational attainment of graduate degree enjoy the highest average annual earnings of $66,875, while those with less than high school education earn the least with $43,750. Women with an educational attainment of graduate degree earn the most with the average annual earnings of $59,297, while those with high school diploma education have the smallest earnings of $22,668.
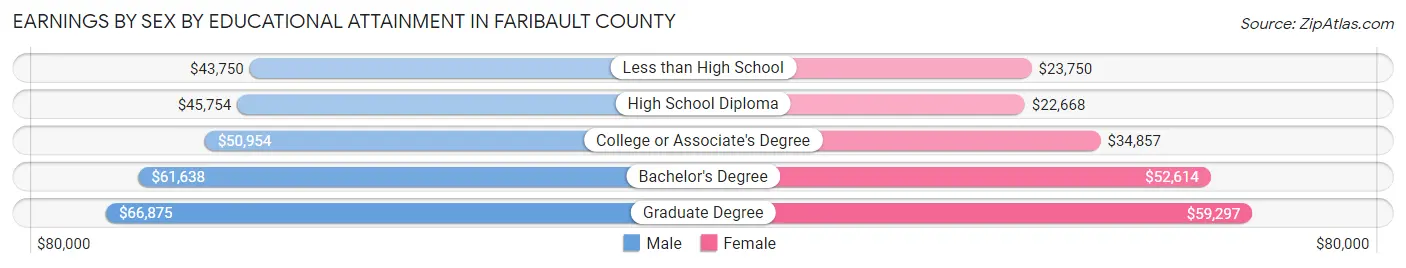
| Educational Attainment | Male Income | Female Income |
| Less than High School | $43,750 | $23,750 |
| High School Diploma | $45,754 | $22,668 |
| College or Associate's Degree | $50,954 | $34,857 |
| Bachelor's Degree | $61,638 | $52,614 |
| Graduate Degree | $66,875 | $59,297 |
| Total | $49,929 | $35,071 |
Family Income in Faribault County
Family Income Brackets in Faribault County
According to the Faribault County family income data, there are 971 families falling into the $100,000 to $149,999 income range, which is the most common income bracket and makes up 25.4% of all families. Conversely, the less than $10,000 income bracket is the least frequent group with only 73 families (1.9%) belonging to this category.
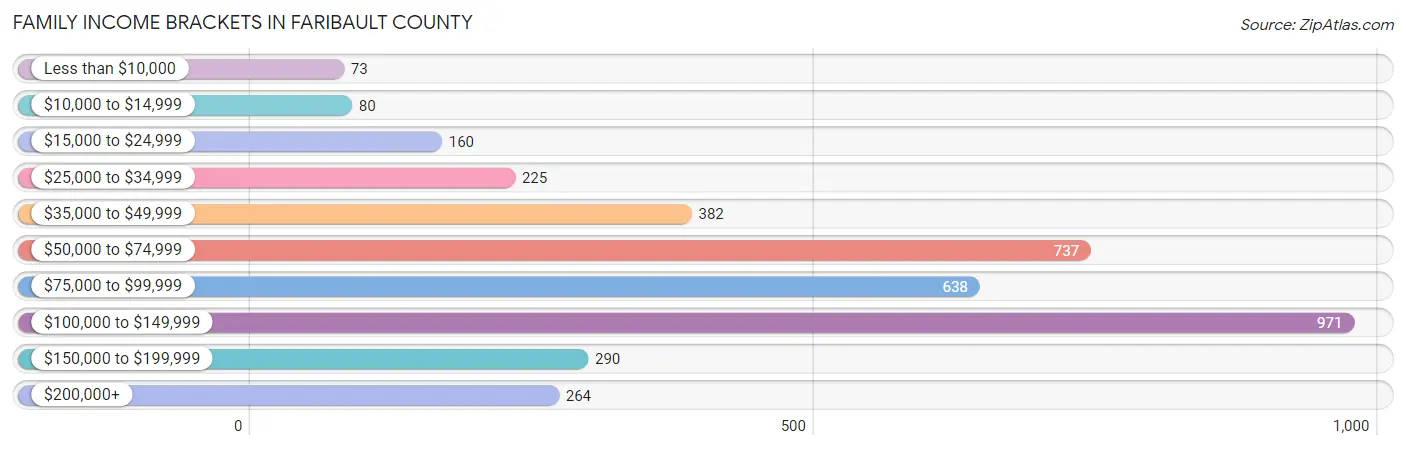
| Income Bracket | # Families | % Families |
| Less than $10,000 | 73 | 1.9% |
| $10,000 to $14,999 | 80 | 2.1% |
| $15,000 to $24,999 | 160 | 4.2% |
| $25,000 to $34,999 | 225 | 5.9% |
| $35,000 to $49,999 | 382 | 10.0% |
| $50,000 to $74,999 | 737 | 19.3% |
| $75,000 to $99,999 | 638 | 16.7% |
| $100,000 to $149,999 | 971 | 25.4% |
| $150,000 to $199,999 | 290 | 7.6% |
| $200,000+ | 264 | 6.9% |
Family Income by Famaliy Size in Faribault County
4-person families (488 | 12.8%) account for the highest median family income in Faribault County with $105,625 per family, while 2-person families (2,239 | 58.6%) have the highest median income of $40,153 per family member.
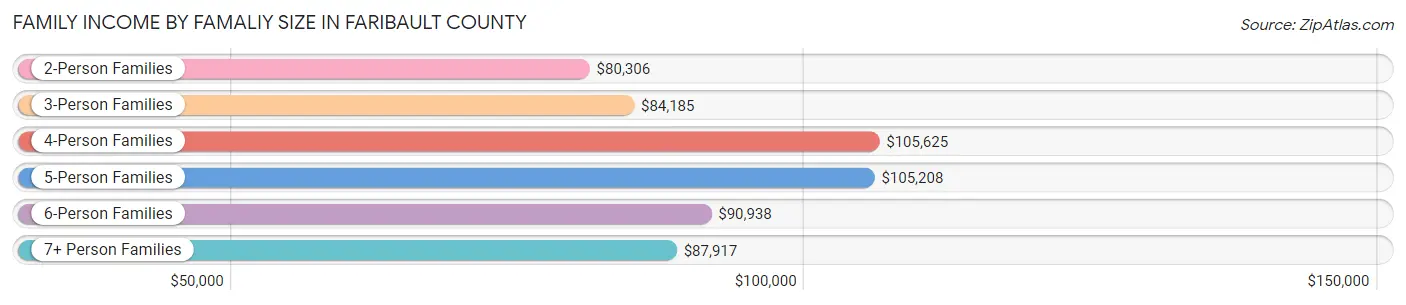
| Income Bracket | # Families | Median Income |
| 2-Person Families | 2,239 (58.6%) | $80,306 |
| 3-Person Families | 723 (18.9%) | $84,185 |
| 4-Person Families | 488 (12.8%) | $105,625 |
| 5-Person Families | 289 (7.6%) | $105,208 |
| 6-Person Families | 59 (1.5%) | $90,938 |
| 7+ Person Families | 23 (0.6%) | $87,917 |
| Total | 3,821 (100.0%) | $85,360 |
Family Income by Number of Earners in Faribault County
The median family income in Faribault County is $85,360, with families comprising 3+ earners (440) having the highest median family income of $130,833, while families with no earners (578) have the lowest median family income of $51,667, accounting for 11.5% and 15.1% of families, respectively.
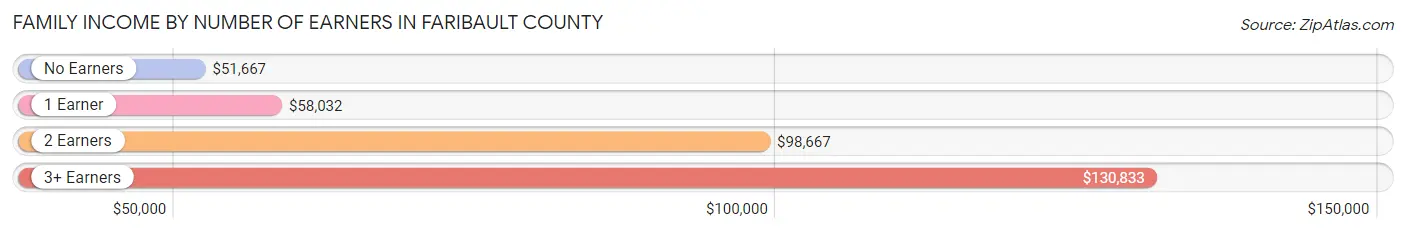
| Number of Earners | # Families | Median Income |
| No Earners | 578 (15.1%) | $51,667 |
| 1 Earner | 1,043 (27.3%) | $58,032 |
| 2 Earners | 1,760 (46.1%) | $98,667 |
| 3+ Earners | 440 (11.5%) | $130,833 |
| Total | 3,821 (100.0%) | $85,360 |
Household Income in Faribault County
Household Income Brackets in Faribault County
With 1,147 households falling in the category, the $50,000 to $74,999 income range is the most frequent in Faribault County, accounting for 19.1% of all households. In contrast, only 222 households (3.7%) fall into the less than $10,000 income bracket, making it the least populous group.
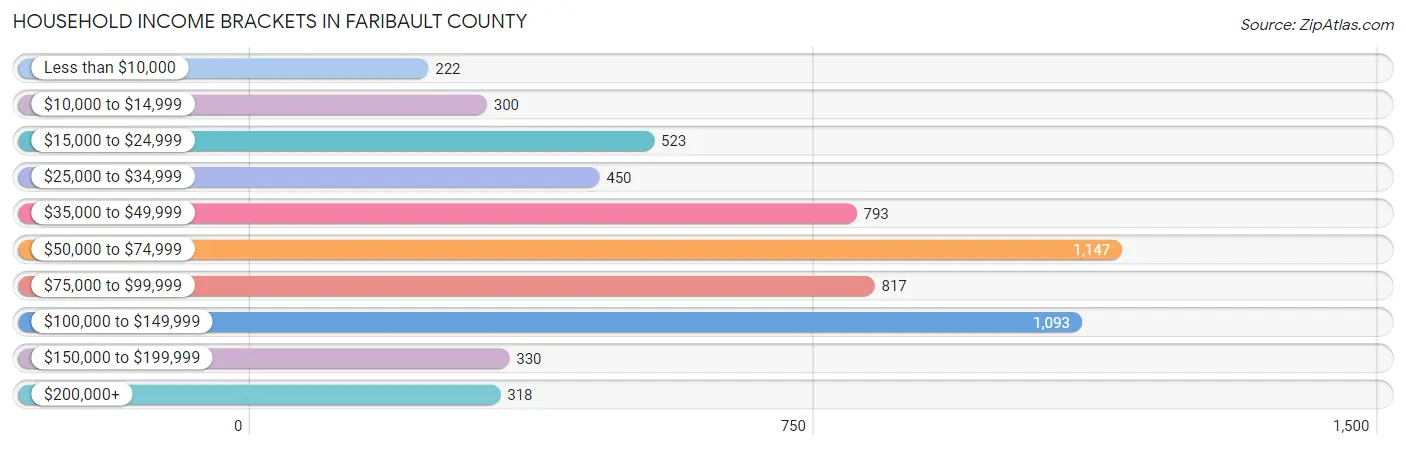
| Income Bracket | # Households | % Households |
| Less than $10,000 | 222 | 3.7% |
| $10,000 to $14,999 | 300 | 5.0% |
| $15,000 to $24,999 | 523 | 8.7% |
| $25,000 to $34,999 | 450 | 7.5% |
| $35,000 to $49,999 | 793 | 13.2% |
| $50,000 to $74,999 | 1,147 | 19.1% |
| $75,000 to $99,999 | 817 | 13.6% |
| $100,000 to $149,999 | 1,093 | 18.2% |
| $150,000 to $199,999 | 330 | 5.5% |
| $200,000+ | 318 | 5.3% |
Household Income by Householder Age in Faribault County
The median household income in Faribault County is $64,000, with the highest median household income of $71,133 found in the 25 to 44 years age bracket for the primary householder. A total of 1,589 households (26.5%) fall into this category. Meanwhile, the 65+ years age bracket for the primary householder has the lowest median household income of $51,019, with 1,996 households (33.2%) in this group.
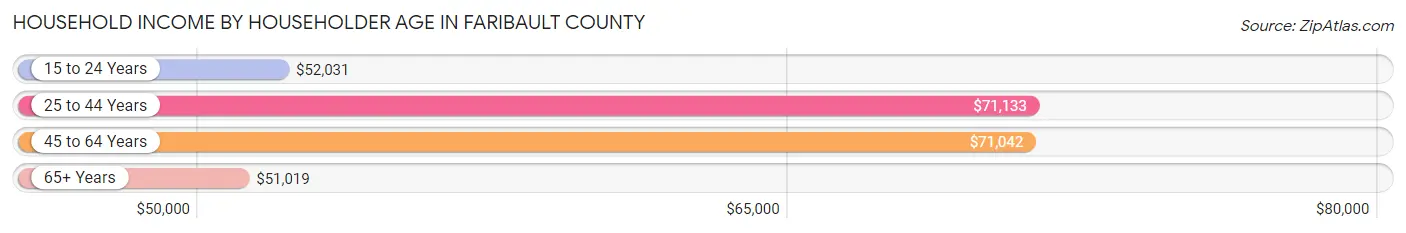
| Income Bracket | # Households | Median Income |
| 15 to 24 Years | 249 (4.2%) | $52,031 |
| 25 to 44 Years | 1,589 (26.5%) | $71,133 |
| 45 to 64 Years | 2,172 (36.2%) | $71,042 |
| 65+ Years | 1,996 (33.2%) | $51,019 |
| Total | 6,006 (100.0%) | $64,000 |
Poverty in Faribault County
Income Below Poverty by Sex and Age in Faribault County
With 9.4% poverty level for males and 13.5% for females among the residents of Faribault County, 5 year old males and 16 and 17 year old females are the most vulnerable to poverty, with 23 males (23.2%) and 66 females (36.1%) in their respective age groups living below the poverty level.
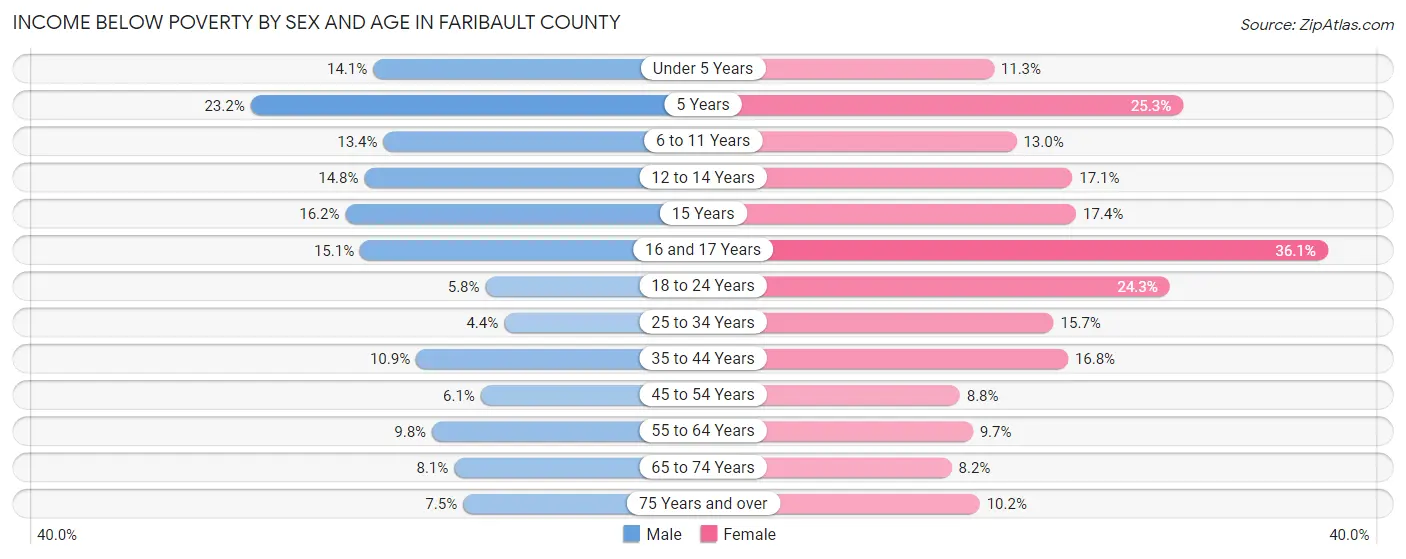
| Age Bracket | Male | Female |
| Under 5 Years | 53 (14.1%) | 36 (11.3%) |
| 5 Years | 23 (23.2%) | 19 (25.3%) |
| 6 to 11 Years | 83 (13.4%) | 59 (13.0%) |
| 12 to 14 Years | 30 (14.8%) | 44 (17.1%) |
| 15 Years | 17 (16.2%) | 16 (17.4%) |
| 16 and 17 Years | 29 (15.1%) | 66 (36.1%) |
| 18 to 24 Years | 29 (5.8%) | 118 (24.3%) |
| 25 to 34 Years | 31 (4.4%) | 98 (15.7%) |
| 35 to 44 Years | 94 (10.9%) | 131 (16.8%) |
| 45 to 54 Years | 47 (6.1%) | 69 (8.8%) |
| 55 to 64 Years | 108 (9.8%) | 99 (9.7%) |
| 65 to 74 Years | 73 (8.1%) | 66 (8.2%) |
| 75 Years and over | 41 (7.4%) | 76 (10.2%) |
| Total | 658 (9.4%) | 897 (13.5%) |
Income Above Poverty by Sex and Age in Faribault County
According to the poverty statistics in Faribault County, males aged 25 to 34 years and females aged 65 to 74 years are the age groups that are most secure financially, with 95.6% of males and 91.8% of females in these age groups living above the poverty line.
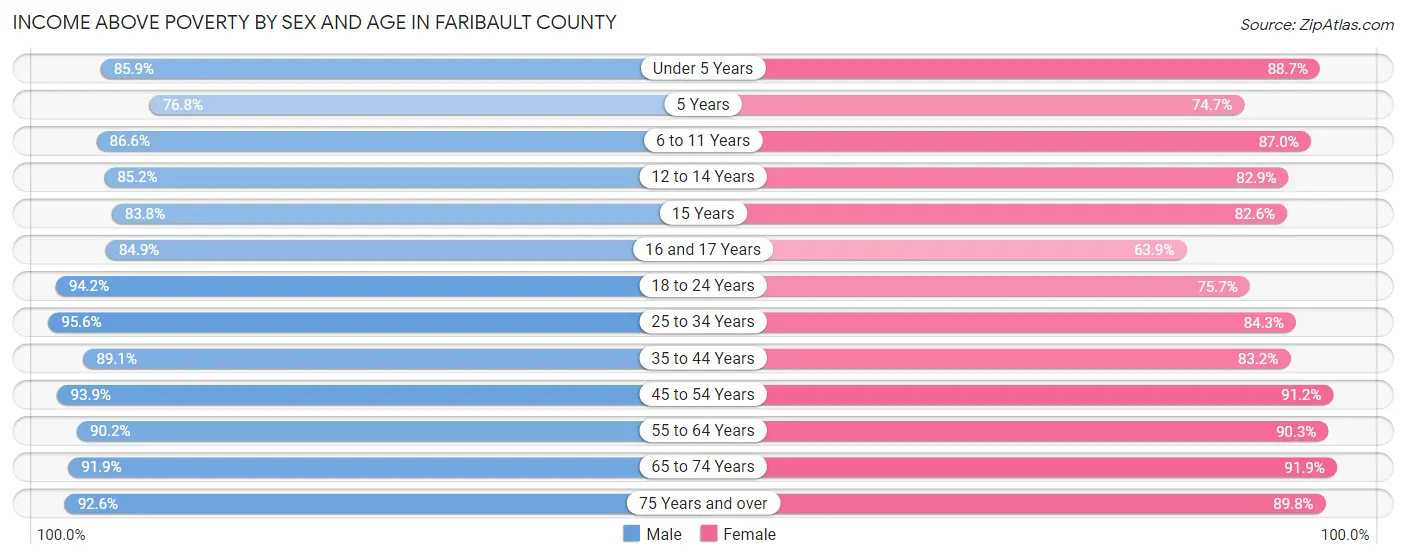
| Age Bracket | Male | Female |
| Under 5 Years | 322 (85.9%) | 283 (88.7%) |
| 5 Years | 76 (76.8%) | 56 (74.7%) |
| 6 to 11 Years | 538 (86.6%) | 396 (87.0%) |
| 12 to 14 Years | 173 (85.2%) | 213 (82.9%) |
| 15 Years | 88 (83.8%) | 76 (82.6%) |
| 16 and 17 Years | 163 (84.9%) | 117 (63.9%) |
| 18 to 24 Years | 472 (94.2%) | 367 (75.7%) |
| 25 to 34 Years | 674 (95.6%) | 525 (84.3%) |
| 35 to 44 Years | 765 (89.1%) | 649 (83.2%) |
| 45 to 54 Years | 718 (93.9%) | 719 (91.2%) |
| 55 to 64 Years | 998 (90.2%) | 920 (90.3%) |
| 65 to 74 Years | 827 (91.9%) | 744 (91.8%) |
| 75 Years and over | 509 (92.5%) | 666 (89.8%) |
| Total | 6,323 (90.6%) | 5,731 (86.5%) |
Income Below Poverty Among Married-Couple Families in Faribault County
The poverty statistics for married-couple families in Faribault County show that 3.4% or 103 of the total 3,007 families live below the poverty line. Families with 3 or 4 children have the highest poverty rate of 12.1%, comprising of 30 families. On the other hand, families with 5 or more children have the lowest poverty rate of 0.0%, which includes 0 families.
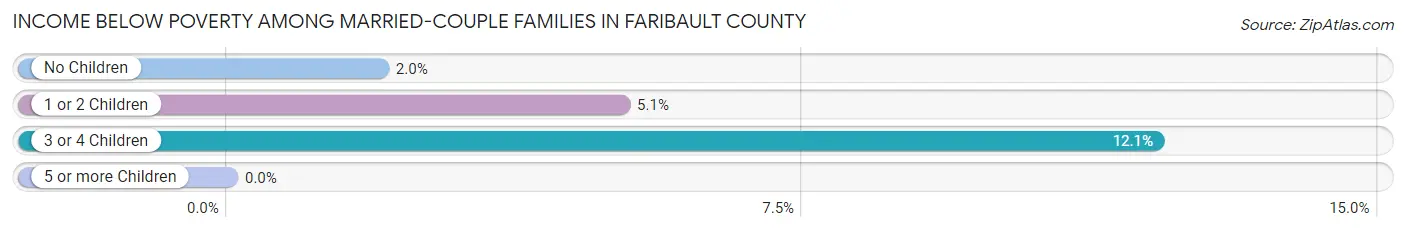
| Children | Above Poverty | Below Poverty |
| No Children | 2,095 (98.0%) | 42 (2.0%) |
| 1 or 2 Children | 575 (94.9%) | 31 (5.1%) |
| 3 or 4 Children | 218 (87.9%) | 30 (12.1%) |
| 5 or more Children | 16 (100.0%) | 0 (0.0%) |
| Total | 2,904 (96.6%) | 103 (3.4%) |
Income Below Poverty Among Single-Parent Households in Faribault County
According to the poverty data in Faribault County, 14.1% or 59 single-father households and 27.0% or 107 single-mother households are living below the poverty line. Among single-father households, those with 3 or 4 children have the highest poverty rate, with 10 households (50.0%) experiencing poverty. Likewise, among single-mother households, those with 5 or more children have the highest poverty rate, with 2 households (100.0%) falling below the poverty line.
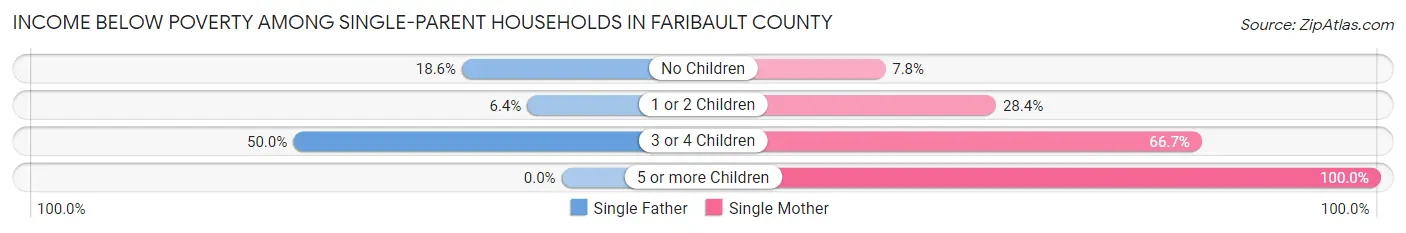
| Children | Single Father | Single Mother |
| No Children | 36 (18.6%) | 10 (7.7%) |
| 1 or 2 Children | 13 (6.4%) | 61 (28.4%) |
| 3 or 4 Children | 10 (50.0%) | 34 (66.7%) |
| 5 or more Children | 0 (0.0%) | 2 (100.0%) |
| Total | 59 (14.1%) | 107 (27.0%) |
Income Below Poverty Among Married-Couple vs Single-Parent Households in Faribault County
The poverty data for Faribault County shows that 103 of the married-couple family households (3.4%) and 166 of the single-parent households (20.4%) are living below the poverty level. Within the married-couple family households, those with 3 or 4 children have the highest poverty rate, with 30 households (12.1%) falling below the poverty line. Among the single-parent households, those with 5 or more children have the highest poverty rate, with 2 household (100.0%) living below poverty.
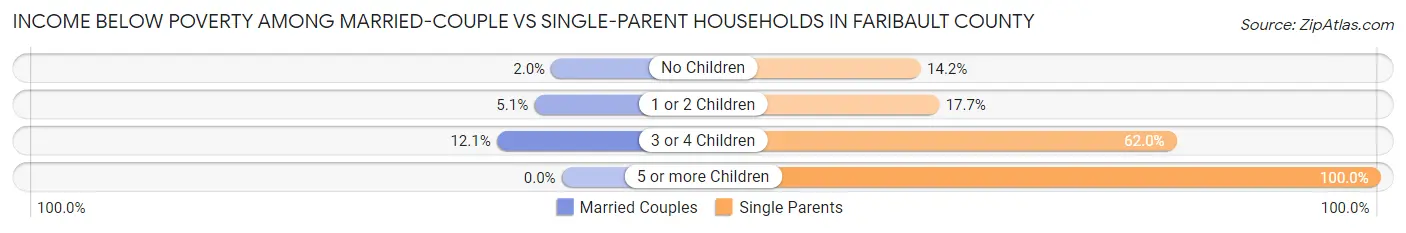
| Children | Married-Couple Families | Single-Parent Households |
| No Children | 42 (2.0%) | 46 (14.2%) |
| 1 or 2 Children | 31 (5.1%) | 74 (17.7%) |
| 3 or 4 Children | 30 (12.1%) | 44 (62.0%) |
| 5 or more Children | 0 (0.0%) | 2 (100.0%) |
| Total | 103 (3.4%) | 166 (20.4%) |
Race in Faribault County
The most populous races in Faribault County are White / Caucasian (12,667 | 90.9%), Hispanic or Latino (1,072 | 7.7%), and Two or more Races (742 | 5.3%).
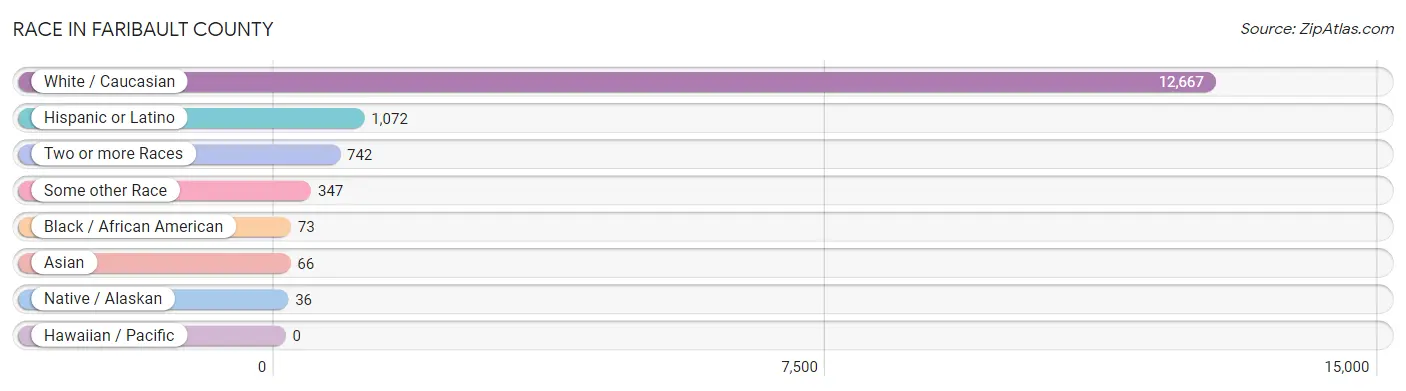
| Race | # Population | % Population |
| Asian | 66 | 0.5% |
| Black / African American | 73 | 0.5% |
| Hawaiian / Pacific | 0 | 0.0% |
| Hispanic or Latino | 1,072 | 7.7% |
| Native / Alaskan | 36 | 0.3% |
| White / Caucasian | 12,667 | 90.9% |
| Two or more Races | 742 | 5.3% |
| Some other Race | 347 | 2.5% |
| Total | 13,931 | 100.0% |
Ancestry in Faribault County
The most populous ancestries reported in Faribault County are German (5,857 | 42.0%), Norwegian (2,544 | 18.3%), Irish (1,142 | 8.2%), Mexican (938 | 6.7%), and English (822 | 5.9%), together accounting for 81.1% of all Faribault County residents.

| Ancestry | # Population | % Population |
| African | 5 | 0.0% |
| American | 503 | 3.6% |
| Apache | 1 | 0.0% |
| Arab | 2 | 0.0% |
| Austrian | 10 | 0.1% |
| Belgian | 34 | 0.2% |
| Blackfeet | 4 | 0.0% |
| Bolivian | 4 | 0.0% |
| Brazilian | 2 | 0.0% |
| British | 14 | 0.1% |
| Bulgarian | 5 | 0.0% |
| Burmese | 6 | 0.0% |
| Central American | 4 | 0.0% |
| Cherokee | 25 | 0.2% |
| Chippewa | 17 | 0.1% |
| Choctaw | 1 | 0.0% |
| Colombian | 7 | 0.1% |
| Creek | 17 | 0.1% |
| Croatian | 4 | 0.0% |
| Cuban | 4 | 0.0% |
| Czech | 127 | 0.9% |
| Czechoslovakian | 16 | 0.1% |
| Danish | 257 | 1.8% |
| Dutch | 151 | 1.1% |
| Eastern European | 18 | 0.1% |
| English | 822 | 5.9% |
| European | 177 | 1.3% |
| Finnish | 71 | 0.5% |
| French | 253 | 1.8% |
| French Canadian | 70 | 0.5% |
| German | 5,857 | 42.0% |
| Hungarian | 14 | 0.1% |
| Icelander | 6 | 0.0% |
| Irish | 1,142 | 8.2% |
| Italian | 213 | 1.5% |
| Japanese | 22 | 0.2% |
| Kiowa | 4 | 0.0% |
| Korean | 37 | 0.3% |
| Lebanese | 2 | 0.0% |
| Lithuanian | 9 | 0.1% |
| Luxembourger | 9 | 0.1% |
| Malaysian | 25 | 0.2% |
| Mexican | 938 | 6.7% |
| Nicaraguan | 4 | 0.0% |
| Northern European | 30 | 0.2% |
| Norwegian | 2,544 | 18.3% |
| Pakistani | 25 | 0.2% |
| Pennsylvania German | 12 | 0.1% |
| Polish | 622 | 4.5% |
| Portuguese | 2 | 0.0% |
| Puerto Rican | 45 | 0.3% |
| Russian | 31 | 0.2% |
| Scandinavian | 200 | 1.4% |
| Scotch-Irish | 108 | 0.8% |
| Scottish | 173 | 1.2% |
| Sioux | 15 | 0.1% |
| Slovene | 4 | 0.0% |
| South American | 11 | 0.1% |
| Spaniard | 48 | 0.3% |
| Spanish | 2 | 0.0% |
| Sri Lankan | 1 | 0.0% |
| Subsaharan African | 5 | 0.0% |
| Swedish | 602 | 4.3% |
| Swiss | 20 | 0.1% |
| Turkish | 19 | 0.1% |
| Ukrainian | 6 | 0.0% |
| Welsh | 74 | 0.5% | View All 67 Rows |
Immigrants in Faribault County
The most numerous immigrant groups reported in Faribault County came from Latin America (162 | 1.2%), Central America (142 | 1.0%), Mexico (142 | 1.0%), Asia (91 | 0.6%), and South Eastern Asia (85 | 0.6%), together accounting for 4.5% of all Faribault County residents.

| Immigration Origin | # Population | % Population |
| Africa | 9 | 0.1% |
| Asia | 91 | 0.6% |
| Brazil | 2 | 0.0% |
| Cambodia | 22 | 0.2% |
| Canada | 6 | 0.0% |
| Caribbean | 7 | 0.1% |
| Central America | 142 | 1.0% |
| Chile | 2 | 0.0% |
| Colombia | 7 | 0.1% |
| Cuba | 7 | 0.1% |
| Eastern Asia | 6 | 0.0% |
| Eastern Europe | 1 | 0.0% |
| England | 16 | 0.1% |
| Europe | 19 | 0.1% |
| Germany | 2 | 0.0% |
| Hungary | 1 | 0.0% |
| Korea | 6 | 0.0% |
| Latin America | 162 | 1.2% |
| Malaysia | 32 | 0.2% |
| Mexico | 142 | 1.0% |
| Northern Europe | 16 | 0.1% |
| Philippines | 24 | 0.2% |
| South Africa | 9 | 0.1% |
| South America | 13 | 0.1% |
| South Eastern Asia | 85 | 0.6% |
| Thailand | 7 | 0.1% |
| Western Europe | 2 | 0.0% | View All 27 Rows |
Sex and Age in Faribault County
Sex and Age in Faribault County
The most populous age groups in Faribault County are 60 to 64 Years (597 | 8.4%) for men and 60 to 64 Years (582 | 8.6%) for women.
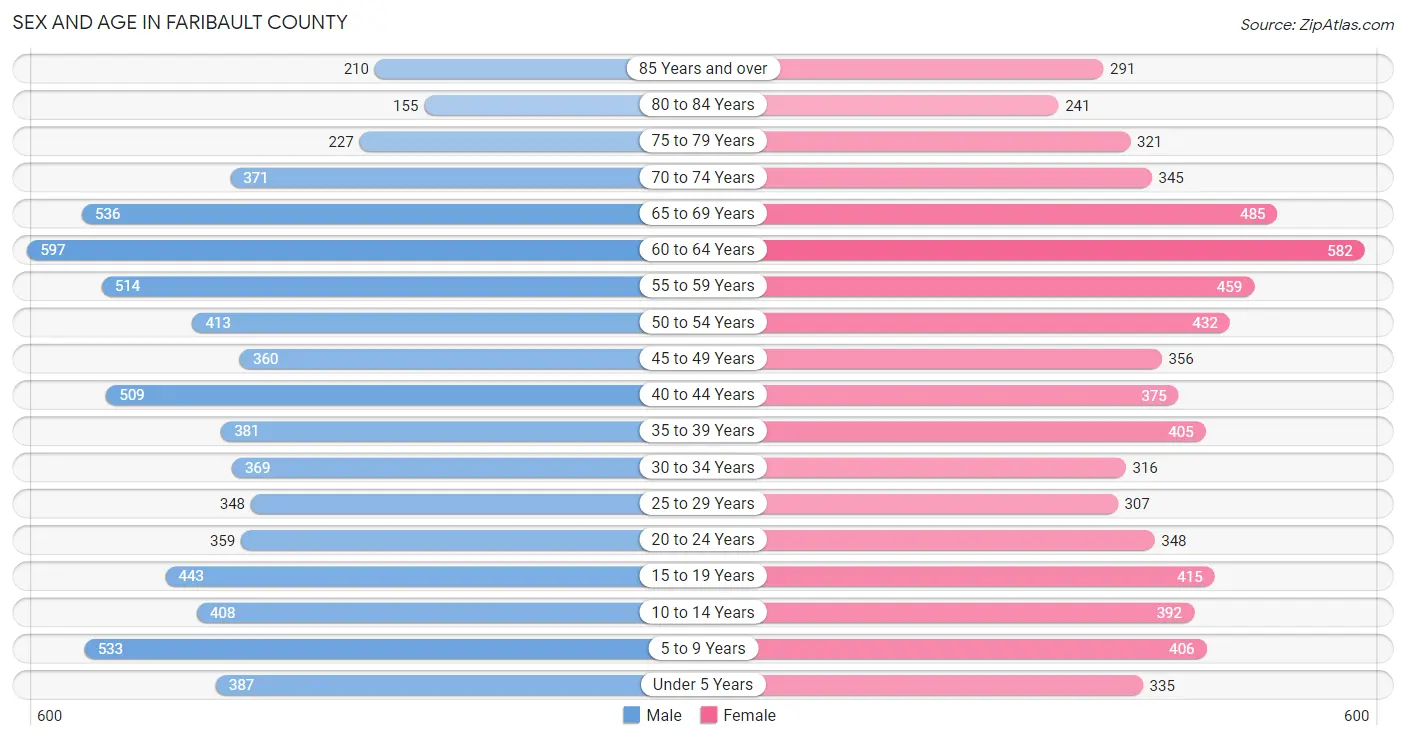
| Age Bracket | Male | Female |
| Under 5 Years | 387 (5.4%) | 335 (4.9%) |
| 5 to 9 Years | 533 (7.5%) | 406 (6.0%) |
| 10 to 14 Years | 408 (5.7%) | 392 (5.8%) |
| 15 to 19 Years | 443 (6.2%) | 415 (6.1%) |
| 20 to 24 Years | 359 (5.0%) | 348 (5.1%) |
| 25 to 29 Years | 348 (4.9%) | 307 (4.5%) |
| 30 to 34 Years | 369 (5.2%) | 316 (4.6%) |
| 35 to 39 Years | 381 (5.3%) | 405 (5.9%) |
| 40 to 44 Years | 509 (7.1%) | 375 (5.5%) |
| 45 to 49 Years | 360 (5.1%) | 356 (5.2%) |
| 50 to 54 Years | 413 (5.8%) | 432 (6.3%) |
| 55 to 59 Years | 514 (7.2%) | 459 (6.7%) |
| 60 to 64 Years | 597 (8.4%) | 582 (8.6%) |
| 65 to 69 Years | 536 (7.5%) | 485 (7.1%) |
| 70 to 74 Years | 371 (5.2%) | 345 (5.1%) |
| 75 to 79 Years | 227 (3.2%) | 321 (4.7%) |
| 80 to 84 Years | 155 (2.2%) | 241 (3.5%) |
| 85 Years and over | 210 (2.9%) | 291 (4.3%) |
| Total | 7,120 (100.0%) | 6,811 (100.0%) |
Families and Households in Faribault County
Median Family Size in Faribault County
The median family size in Faribault County is 2.80 persons per family, with single female/mother families (397 | 10.4%) accounting for the largest median family size of 2.83 persons per family. On the other hand, single male/father families (417 | 10.9%) represent the smallest median family size with 2.67 persons per family.

| Family Type | # Families | Family Size |
| Married-Couple | 3,007 (78.7%) | 2.81 |
| Single Male/Father | 417 (10.9%) | 2.67 |
| Single Female/Mother | 397 (10.4%) | 2.83 |
| Total Families | 3,821 (100.0%) | 2.80 |
Median Household Size in Faribault County
The median household size in Faribault County is 2.27 persons per household, with single female/mother households (397 | 6.6%) accounting for the largest median household size of 3.1 persons per household. non-family households (2,185 | 36.4%) represent the smallest median household size with 1.17 persons per household.

| Household Type | # Households | Household Size |
| Married-Couple | 3,007 (50.1%) | 2.85 |
| Single Male/Father | 417 (6.9%) | 3.08 |
| Single Female/Mother | 397 (6.6%) | 3.10 |
| Non-family | 2,185 (36.4%) | 1.17 |
| Total Households | 6,006 (100.0%) | 2.27 |
Household Size by Marriage Status in Faribault County
Out of a total of 6,006 households in Faribault County, 3,821 (63.6%) are family households, while 2,185 (36.4%) are nonfamily households. The most numerous type of family households are 2-person households, comprising 2,124, and the most common type of nonfamily households are 1-person households, comprising 1,861.
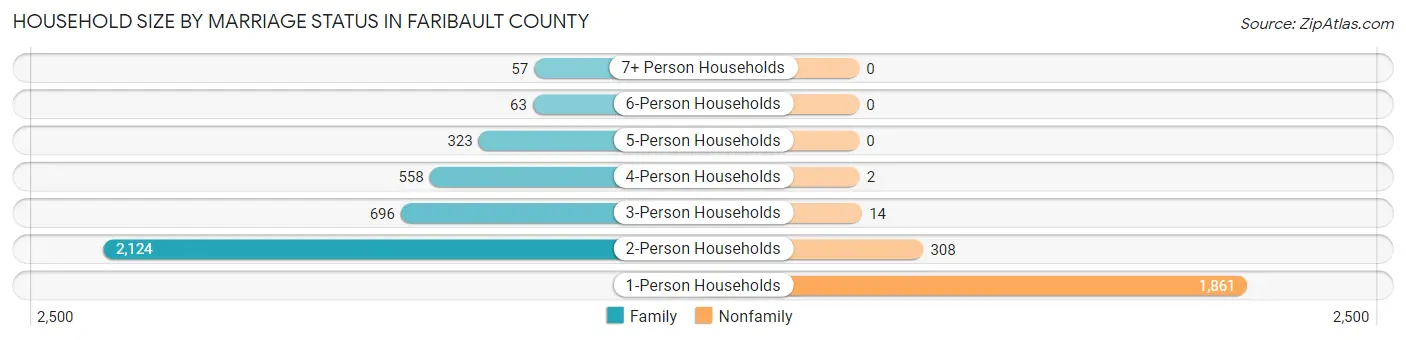
| Household Size | Family Households | Nonfamily Households |
| 1-Person Households | - | 1,861 (31.0%) |
| 2-Person Households | 2,124 (35.4%) | 308 (5.1%) |
| 3-Person Households | 696 (11.6%) | 14 (0.2%) |
| 4-Person Households | 558 (9.3%) | 2 (0.0%) |
| 5-Person Households | 323 (5.4%) | 0 (0.0%) |
| 6-Person Households | 63 (1.1%) | 0 (0.0%) |
| 7+ Person Households | 57 (0.9%) | 0 (0.0%) |
| Total | 3,821 (63.6%) | 2,185 (36.4%) |
Female Fertility in Faribault County
Fertility by Age in Faribault County
Average fertility rate in Faribault County is 53.0 births per 1,000 women. Women in the age bracket of 20 to 34 years have the highest fertility rate with 99.0 births per 1,000 women. Women in the age bracket of 20 to 34 years acount for 69.6% of all women with births.
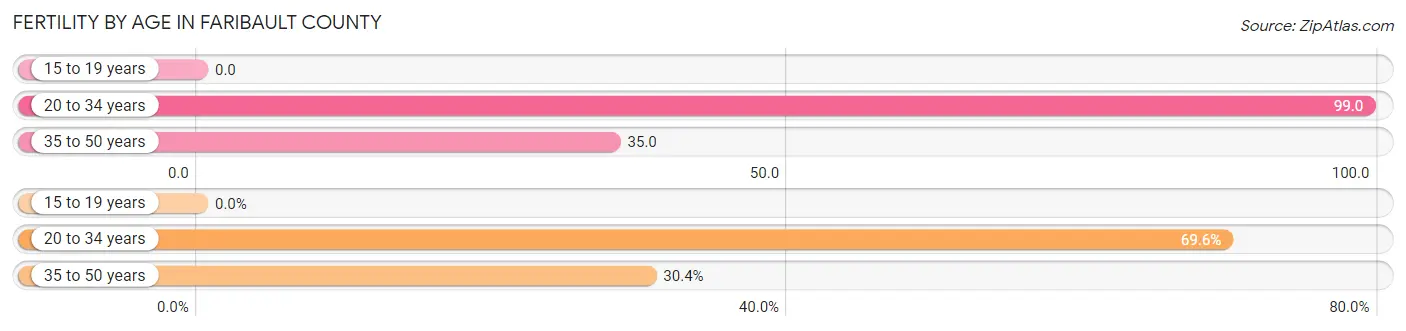
| Age Bracket | Women with Births | Births / 1,000 Women |
| 15 to 19 years | 0 (0.0%) | 0.0 |
| 20 to 34 years | 96 (69.6%) | 99.0 |
| 35 to 50 years | 42 (30.4%) | 35.0 |
| Total | 138 (100.0%) | 53.0 |
Fertility by Age by Marriage Status in Faribault County
64.5% of women with births (138) in Faribault County are married. The highest percentage of unmarried women with births falls into 20 to 34 years age bracket with 51.0% of them unmarried at the time of birth, while the lowest percentage of unmarried women with births belong to 35 to 50 years age bracket with 0.0% of them unmarried.
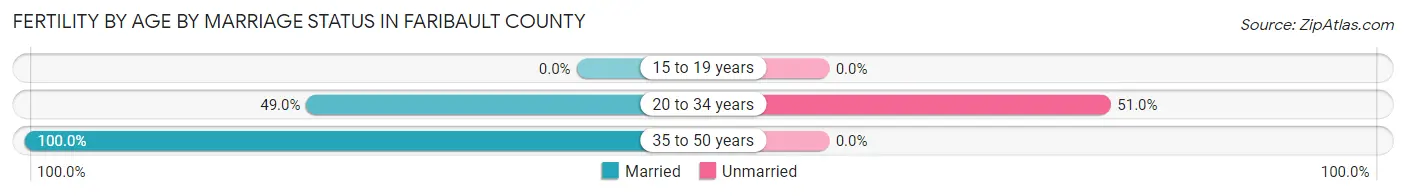
| Age Bracket | Married | Unmarried |
| 15 to 19 years | 0 (0.0%) | 0 (0.0%) |
| 20 to 34 years | 47 (49.0%) | 49 (51.0%) |
| 35 to 50 years | 42 (100.0%) | 0 (0.0%) |
| Total | 89 (64.5%) | 49 (35.5%) |
Fertility by Education in Faribault County
Average fertility rate in Faribault County is 53.0 births per 1,000 women. Women with the education attainment of bachelor's degree have the highest fertility rate of 131.0 births per 1,000 women, while women with the education attainment of less than high school have the lowest fertility at 11.0 births per 1,000 women. Women with the education attainment of bachelor's degree represent 53.6% of all women with births.
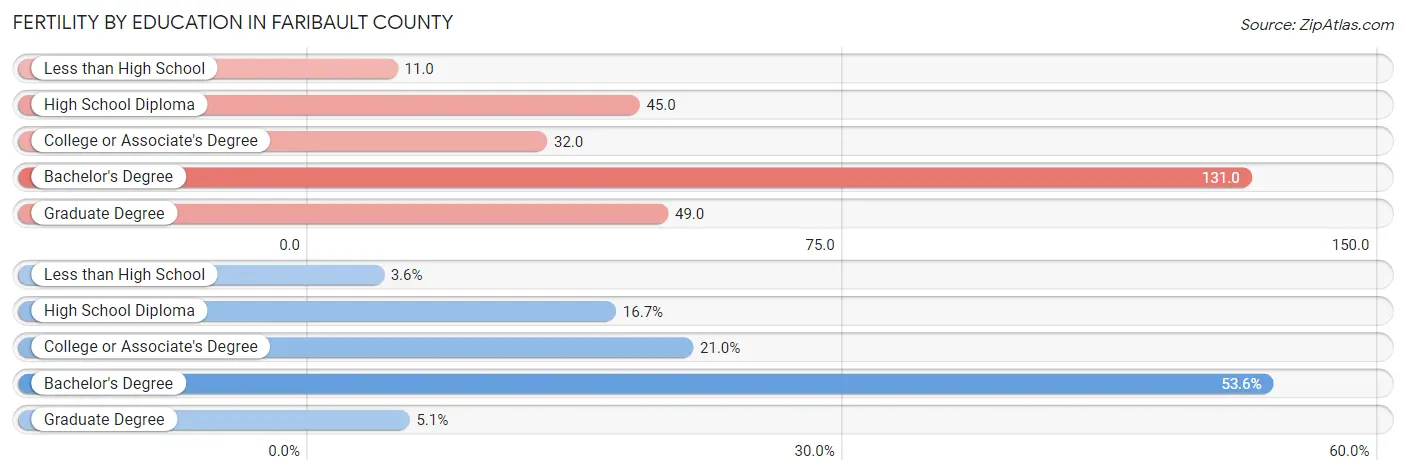
| Educational Attainment | Women with Births | Births / 1,000 Women |
| Less than High School | 5 (3.6%) | 11.0 |
| High School Diploma | 23 (16.7%) | 45.0 |
| College or Associate's Degree | 29 (21.0%) | 32.0 |
| Bachelor's Degree | 74 (53.6%) | 131.0 |
| Graduate Degree | 7 (5.1%) | 49.0 |
| Total | 138 (100.0%) | 53.0 |
Fertility by Education by Marriage Status in Faribault County
35.5% of women with births in Faribault County are unmarried. Women with the educational attainment of graduate degree are most likely to be married with 100.0% of them married at childbirth, while women with the educational attainment of less than high school are least likely to be married with 80.0% of them unmarried at childbirth.
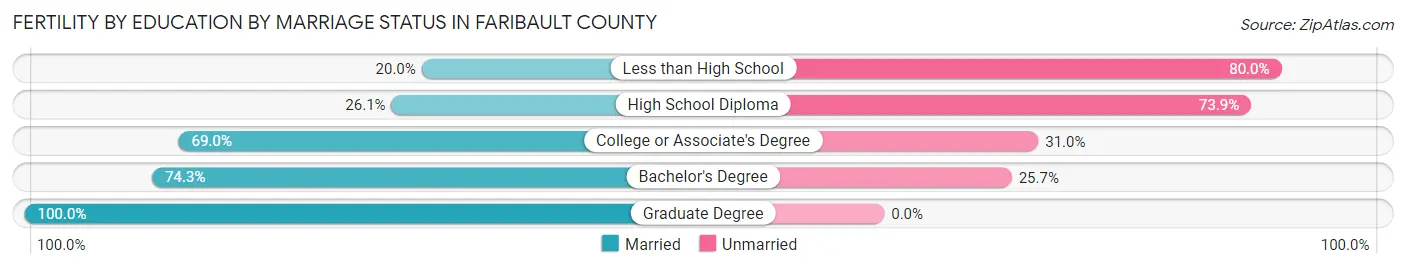
| Educational Attainment | Married | Unmarried |
| Less than High School | 1 (20.0%) | 4 (80.0%) |
| High School Diploma | 6 (26.1%) | 17 (73.9%) |
| College or Associate's Degree | 20 (69.0%) | 9 (31.0%) |
| Bachelor's Degree | 55 (74.3%) | 19 (25.7%) |
| Graduate Degree | 7 (100.0%) | 0 (0.0%) |
| Total | 89 (64.5%) | 49 (35.5%) |
Employment Characteristics in Faribault County
Employment by Class of Employer in Faribault County
Among the 6,728 employed individuals in Faribault County, private company employees (4,045 | 60.1%), self-employed (not incorporated) (751 | 11.2%), and not-for-profit organizations (656 | 9.8%) make up the most common classes of employment.
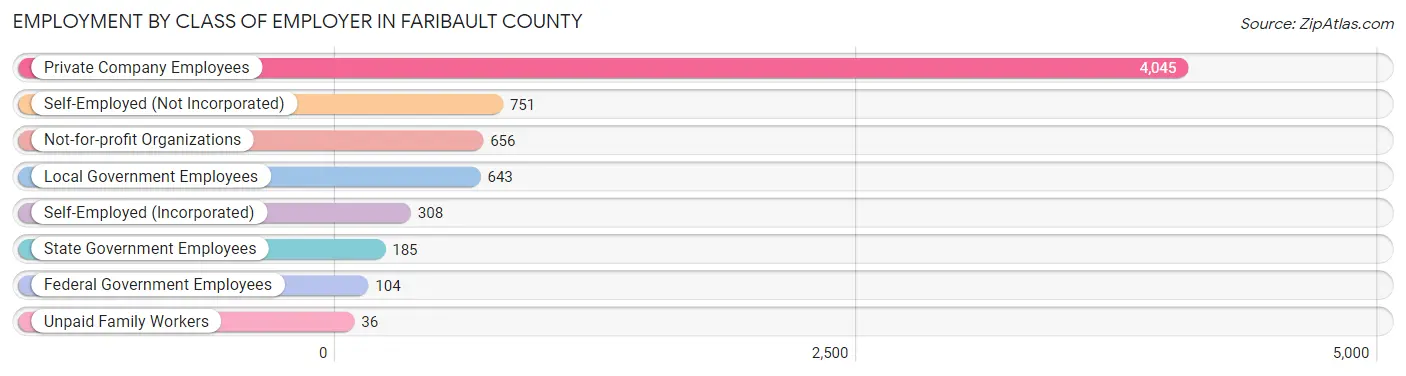
| Employer Class | # Employees | % Employees |
| Private Company Employees | 4,045 | 60.1% |
| Self-Employed (Incorporated) | 308 | 4.6% |
| Self-Employed (Not Incorporated) | 751 | 11.2% |
| Not-for-profit Organizations | 656 | 9.8% |
| Local Government Employees | 643 | 9.6% |
| State Government Employees | 185 | 2.8% |
| Federal Government Employees | 104 | 1.5% |
| Unpaid Family Workers | 36 | 0.5% |
| Total | 6,728 | 100.0% |
Employment Status by Age in Faribault County
According to the labor force statistics for Faribault County, out of the total population over 16 years of age (11,272), 63.9% or 7,203 individuals are in the labor force, with 4.3% or 310 of them unemployed. The age group with the highest labor force participation rate is 30 to 34 years, with 92.0% or 630 individuals in the labor force. Within the labor force, the 16 to 19 years age range has the highest percentage of unemployed individuals, with 9.5% or 30 of them being unemployed.
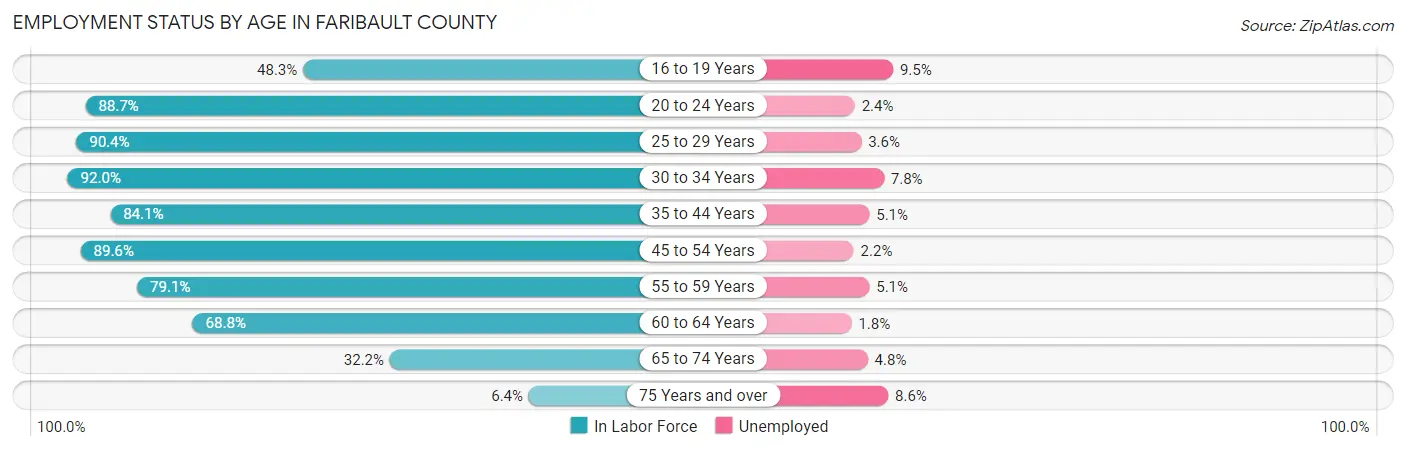
| Age Bracket | In Labor Force | Unemployed |
| 16 to 19 Years | 319 (48.3%) | 30 (9.5%) |
| 20 to 24 Years | 627 (88.7%) | 15 (2.4%) |
| 25 to 29 Years | 592 (90.4%) | 21 (3.6%) |
| 30 to 34 Years | 630 (92.0%) | 49 (7.8%) |
| 35 to 44 Years | 1,404 (84.1%) | 72 (5.1%) |
| 45 to 54 Years | 1,399 (89.6%) | 31 (2.2%) |
| 55 to 59 Years | 770 (79.1%) | 39 (5.1%) |
| 60 to 64 Years | 811 (68.8%) | 15 (1.8%) |
| 65 to 74 Years | 559 (32.2%) | 27 (4.8%) |
| 75 Years and over | 92 (6.4%) | 8 (8.6%) |
| Total | 7,203 (63.9%) | 310 (4.3%) |
Employment Status by Educational Attainment in Faribault County
According to labor force statistics for Faribault County, 83.4% of individuals (5,607) out of the total population between 25 and 64 years of age (6,723) are in the labor force, with 4.0% or 224 of them being unemployed. The group with the highest labor force participation rate are those with the educational attainment of bachelor's degree or higher, with 92.4% or 1,414 individuals in the labor force. Within the labor force, individuals with high school diploma education have the highest percentage of unemployment, with 8.0% or 122 of them being unemployed.
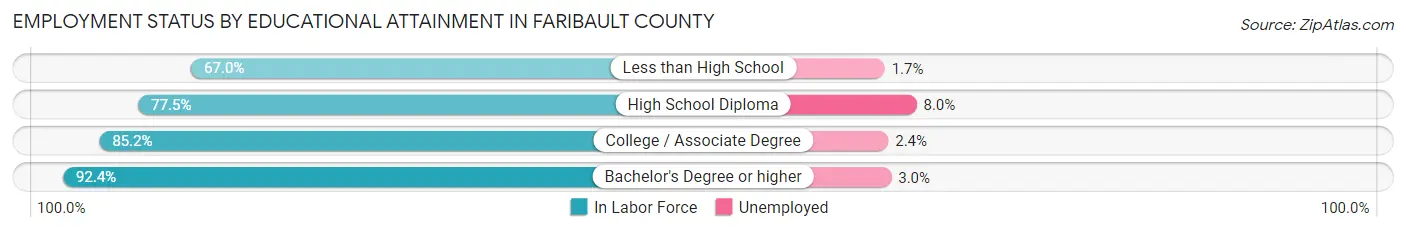
| Educational Attainment | In Labor Force | Unemployed |
| Less than High School | 300 (67.0%) | 8 (1.7%) |
| High School Diploma | 1,530 (77.5%) | 158 (8.0%) |
| College / Associate Degree | 2,361 (85.2%) | 67 (2.4%) |
| Bachelor's Degree or higher | 1,414 (92.4%) | 46 (3.0%) |
| Total | 5,607 (83.4%) | 269 (4.0%) |
Employment Occupations by Sex in Faribault County
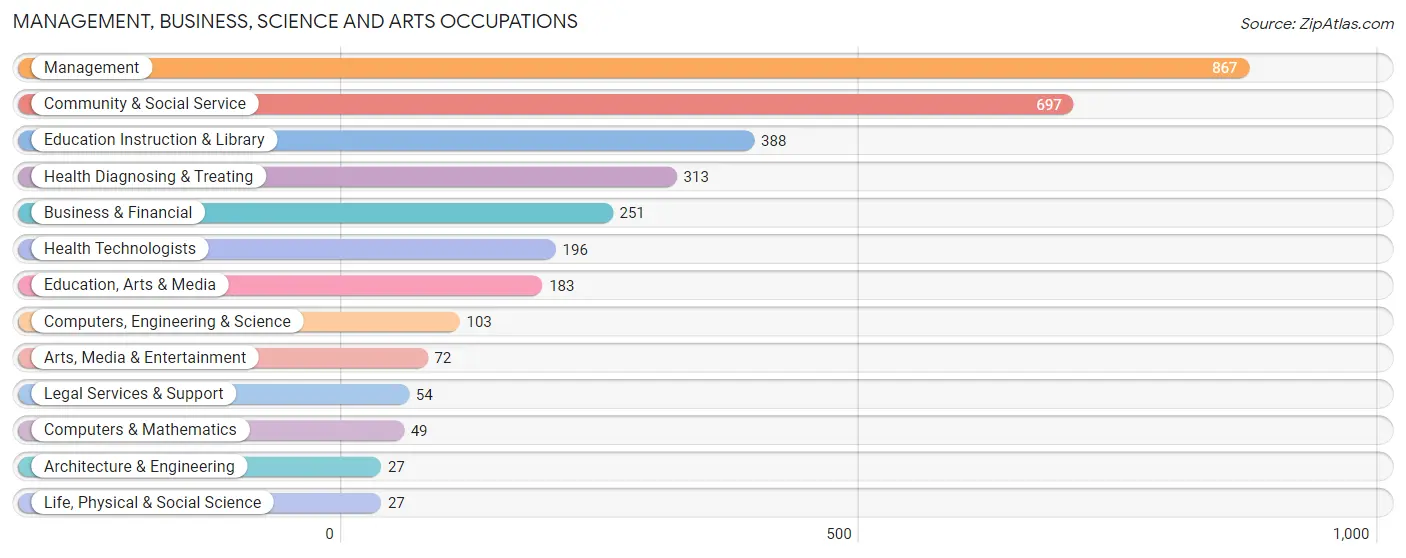
Management, Business, Science and Arts Occupations
The most common Management, Business, Science and Arts occupations in Faribault County are Management (867 | 12.6%), Community & Social Service (697 | 10.1%), Education Instruction & Library (388 | 5.6%), Health Diagnosing & Treating (313 | 4.5%), and Business & Financial (251 | 3.6%).
Management, Business, Science and Arts Occupations by Sex
Within the Management, Business, Science and Arts occupations in Faribault County, the most male-oriented occupations are Architecture & Engineering (85.2%), Computers & Mathematics (77.5%), and Management (75.9%), while the most female-oriented occupations are Legal Services & Support (94.4%), Health Diagnosing & Treating (91.7%), and Health Technologists (88.3%).
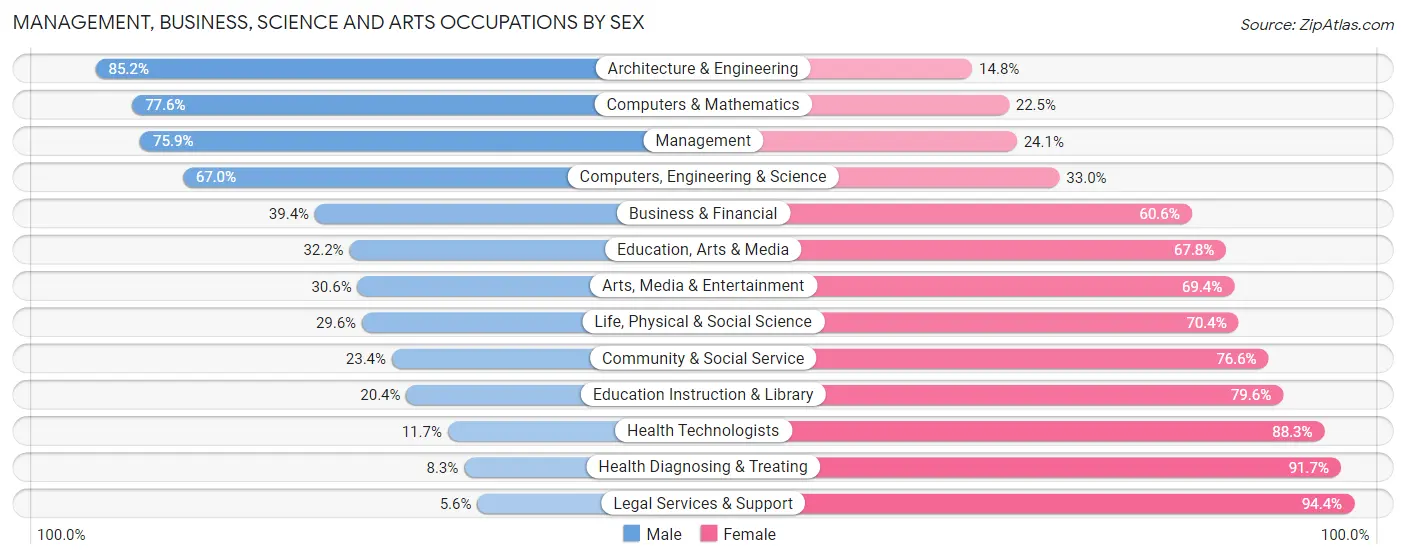
| Occupation | Male | Female |
| Management | 658 (75.9%) | 209 (24.1%) |
| Business & Financial | 99 (39.4%) | 152 (60.6%) |
| Computers, Engineering & Science | 69 (67.0%) | 34 (33.0%) |
| Computers & Mathematics | 38 (77.5%) | 11 (22.5%) |
| Architecture & Engineering | 23 (85.2%) | 4 (14.8%) |
| Life, Physical & Social Science | 8 (29.6%) | 19 (70.4%) |
| Community & Social Service | 163 (23.4%) | 534 (76.6%) |
| Education, Arts & Media | 59 (32.2%) | 124 (67.8%) |
| Legal Services & Support | 3 (5.6%) | 51 (94.4%) |
| Education Instruction & Library | 79 (20.4%) | 309 (79.6%) |
| Arts, Media & Entertainment | 22 (30.6%) | 50 (69.4%) |
| Health Diagnosing & Treating | 26 (8.3%) | 287 (91.7%) |
| Health Technologists | 23 (11.7%) | 173 (88.3%) |
| Total (Category) | 1,015 (45.5%) | 1,216 (54.5%) |
| Total (Overall) | 3,680 (53.4%) | 3,209 (46.6%) |
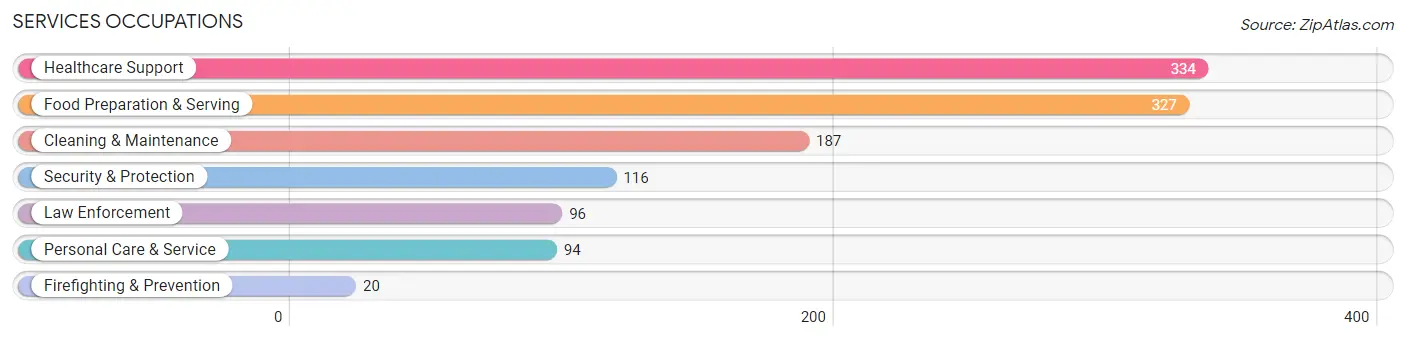
Services Occupations
The most common Services occupations in Faribault County are Healthcare Support (334 | 4.9%), Food Preparation & Serving (327 | 4.8%), Cleaning & Maintenance (187 | 2.7%), Security & Protection (116 | 1.7%), and Law Enforcement (96 | 1.4%).
Services Occupations by Sex
Within the Services occupations in Faribault County, the most male-oriented occupations are Law Enforcement (87.5%), Security & Protection (85.3%), and Firefighting & Prevention (75.0%), while the most female-oriented occupations are Healthcare Support (96.7%), Personal Care & Service (89.4%), and Food Preparation & Serving (69.4%).

| Occupation | Male | Female |
| Healthcare Support | 11 (3.3%) | 323 (96.7%) |
| Security & Protection | 99 (85.3%) | 17 (14.7%) |
| Firefighting & Prevention | 15 (75.0%) | 5 (25.0%) |
| Law Enforcement | 84 (87.5%) | 12 (12.5%) |
| Food Preparation & Serving | 100 (30.6%) | 227 (69.4%) |
| Cleaning & Maintenance | 88 (47.1%) | 99 (52.9%) |
| Personal Care & Service | 10 (10.6%) | 84 (89.4%) |
| Total (Category) | 308 (29.1%) | 750 (70.9%) |
| Total (Overall) | 3,680 (53.4%) | 3,209 (46.6%) |
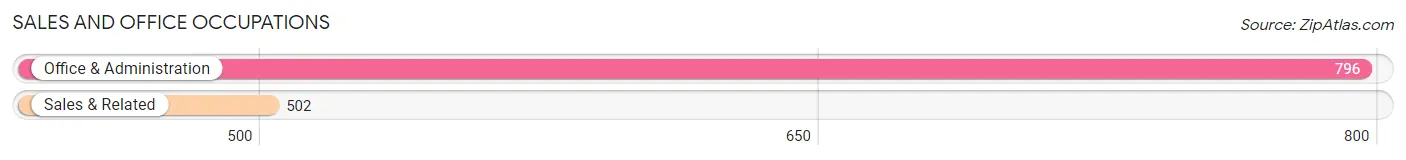
Sales and Office Occupations
The most common Sales and Office occupations in Faribault County are Office & Administration (796 | 11.6%), and Sales & Related (502 | 7.3%).
Sales and Office Occupations by Sex
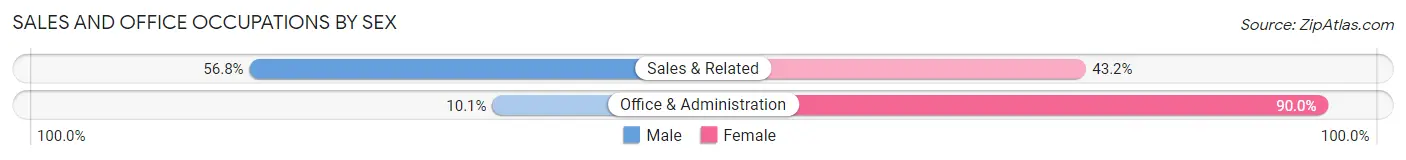
| Occupation | Male | Female |
| Sales & Related | 285 (56.8%) | 217 (43.2%) |
| Office & Administration | 80 (10.1%) | 716 (89.9%) |
| Total (Category) | 365 (28.1%) | 933 (71.9%) |
| Total (Overall) | 3,680 (53.4%) | 3,209 (46.6%) |
Natural Resources, Construction and Maintenance Occupations
The most common Natural Resources, Construction and Maintenance occupations in Faribault County are Installation, Maintenance & Repair (413 | 6.0%), Construction & Extraction (365 | 5.3%), and Farming, Fishing & Forestry (236 | 3.4%).
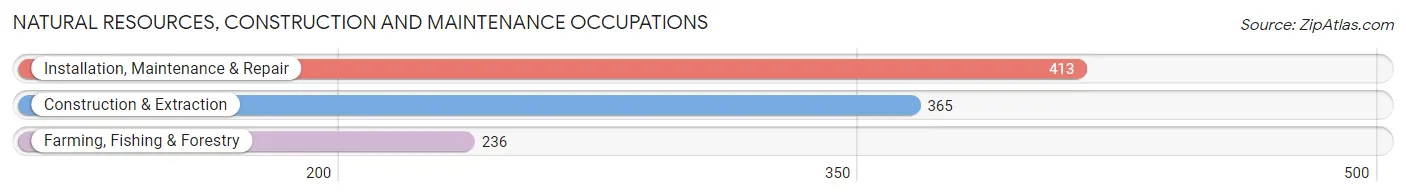
Natural Resources, Construction and Maintenance Occupations by Sex
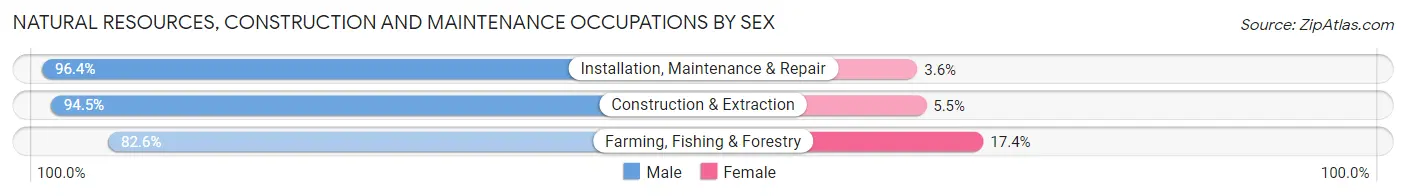
| Occupation | Male | Female |
| Farming, Fishing & Forestry | 195 (82.6%) | 41 (17.4%) |
| Construction & Extraction | 345 (94.5%) | 20 (5.5%) |
| Installation, Maintenance & Repair | 398 (96.4%) | 15 (3.6%) |
| Total (Category) | 938 (92.5%) | 76 (7.5%) |
| Total (Overall) | 3,680 (53.4%) | 3,209 (46.6%) |
Production, Transportation and Moving Occupations
The most common Production, Transportation and Moving occupations in Faribault County are Production (645 | 9.4%), Transportation (323 | 4.7%), and Material Moving (320 | 4.6%).
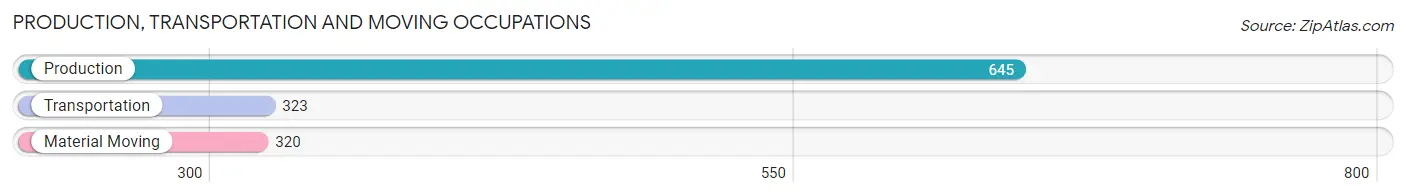
Production, Transportation and Moving Occupations by Sex
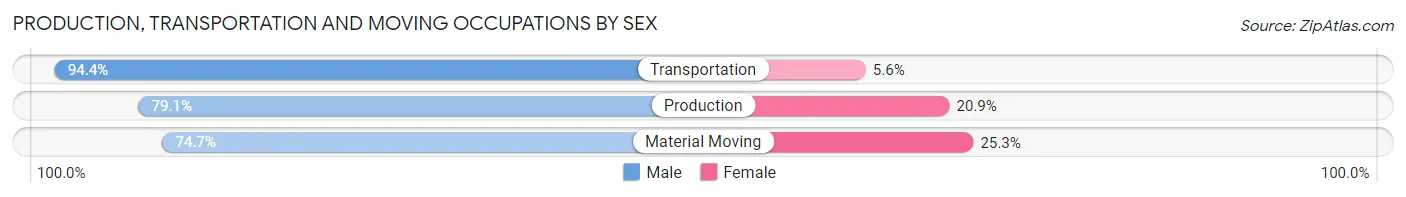
| Occupation | Male | Female |
| Production | 510 (79.1%) | 135 (20.9%) |
| Transportation | 305 (94.4%) | 18 (5.6%) |
| Material Moving | 239 (74.7%) | 81 (25.3%) |
| Total (Category) | 1,054 (81.8%) | 234 (18.2%) |
| Total (Overall) | 3,680 (53.4%) | 3,209 (46.6%) |
Employment Industries by Sex in Faribault County
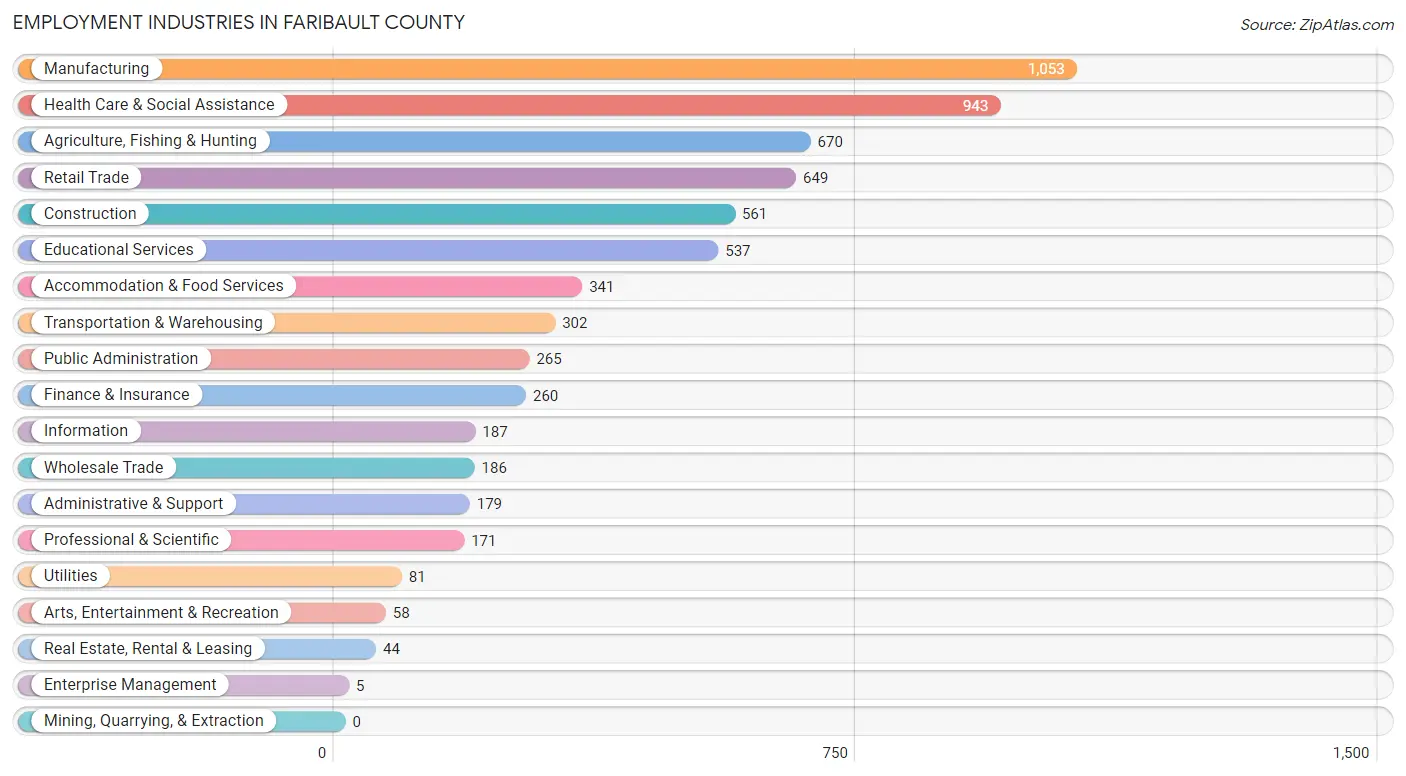
Employment Industries in Faribault County
The major employment industries in Faribault County include Manufacturing (1,053 | 15.3%), Health Care & Social Assistance (943 | 13.7%), Agriculture, Fishing & Hunting (670 | 9.7%), Retail Trade (649 | 9.4%), and Construction (561 | 8.1%).
Employment Industries by Sex in Faribault County
The Faribault County industries that see more men than women are Wholesale Trade (93.0%), Agriculture, Fishing & Hunting (86.1%), and Construction (84.3%), whereas the industries that tend to have a higher number of women are Enterprise Management (100.0%), Health Care & Social Assistance (90.5%), and Educational Services (76.5%).
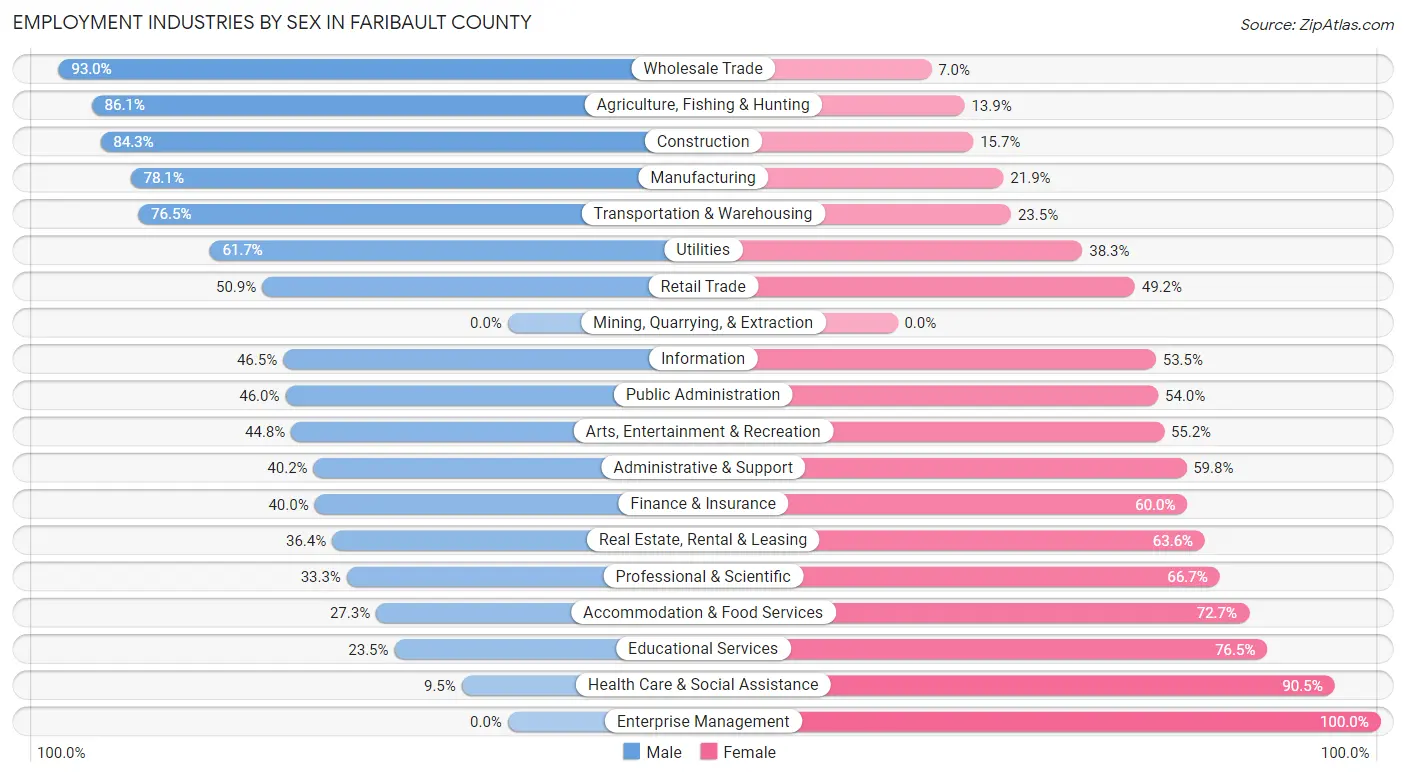
| Industry | Male | Female |
| Agriculture, Fishing & Hunting | 577 (86.1%) | 93 (13.9%) |
| Mining, Quarrying, & Extraction | 0 (0.0%) | 0 (0.0%) |
| Construction | 473 (84.3%) | 88 (15.7%) |
| Manufacturing | 822 (78.1%) | 231 (21.9%) |
| Wholesale Trade | 173 (93.0%) | 13 (7.0%) |
| Retail Trade | 330 (50.8%) | 319 (49.1%) |
| Transportation & Warehousing | 231 (76.5%) | 71 (23.5%) |
| Utilities | 50 (61.7%) | 31 (38.3%) |
| Information | 87 (46.5%) | 100 (53.5%) |
| Finance & Insurance | 104 (40.0%) | 156 (60.0%) |
| Real Estate, Rental & Leasing | 16 (36.4%) | 28 (63.6%) |
| Professional & Scientific | 57 (33.3%) | 114 (66.7%) |
| Enterprise Management | 0 (0.0%) | 5 (100.0%) |
| Administrative & Support | 72 (40.2%) | 107 (59.8%) |
| Educational Services | 126 (23.5%) | 411 (76.5%) |
| Health Care & Social Assistance | 90 (9.5%) | 853 (90.5%) |
| Arts, Entertainment & Recreation | 26 (44.8%) | 32 (55.2%) |
| Accommodation & Food Services | 93 (27.3%) | 248 (72.7%) |
| Public Administration | 122 (46.0%) | 143 (54.0%) |
| Total | 3,680 (53.4%) | 3,209 (46.6%) |
Education in Faribault County
School Enrollment in Faribault County
The most common levels of schooling among the 2,910 students in Faribault County are high school (759 | 26.1%), elementary school (718 | 24.7%), and middle school (616 | 21.2%).
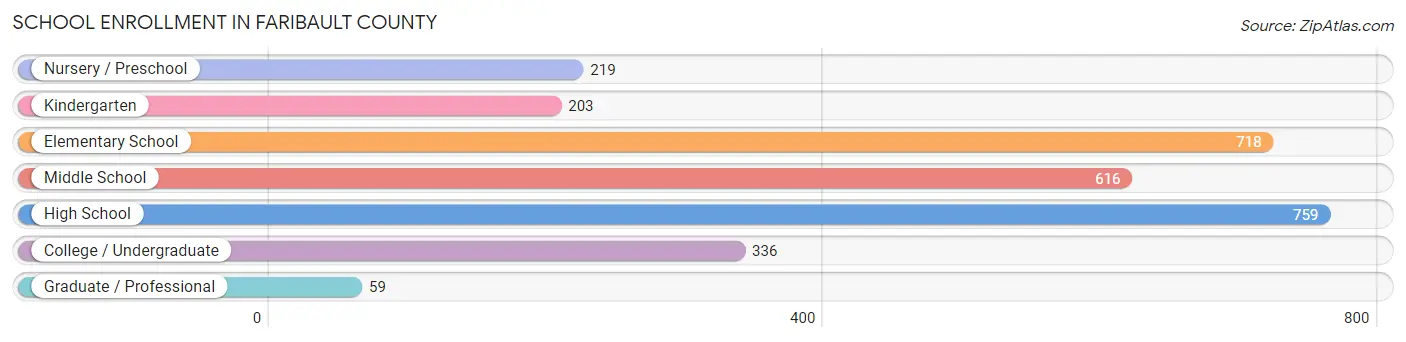
| School Level | # Students | % Students |
| Nursery / Preschool | 219 | 7.5% |
| Kindergarten | 203 | 7.0% |
| Elementary School | 718 | 24.7% |
| Middle School | 616 | 21.2% |
| High School | 759 | 26.1% |
| College / Undergraduate | 336 | 11.6% |
| Graduate / Professional | 59 | 2.0% |
| Total | 2,910 | 100.0% |
School Enrollment by Age by Funding Source in Faribault County
Out of a total of 2,910 students who are enrolled in schools in Faribault County, 300 (10.3%) attend a private institution, while the remaining 2,610 (89.7%) are enrolled in public schools. The age group of 35 years and over has the highest likelihood of being enrolled in private schools, with 46 (35.9% in the age bracket) enrolled. Conversely, the age group of 15 to 17 year olds has the lowest likelihood of being enrolled in a private school, with 554 (98.2% in the age bracket) attending a public institution.
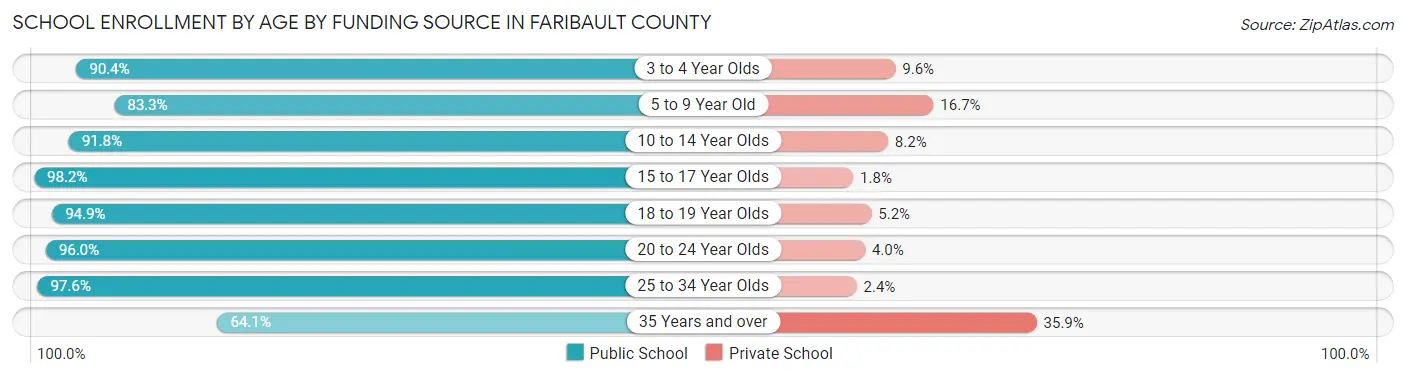
| Age Bracket | Public School | Private School |
| 3 to 4 Year Olds | 122 (90.4%) | 13 (9.6%) |
| 5 to 9 Year Old | 752 (83.3%) | 151 (16.7%) |
| 10 to 14 Year Olds | 713 (91.8%) | 64 (8.2%) |
| 15 to 17 Year Olds | 554 (98.2%) | 10 (1.8%) |
| 18 to 19 Year Olds | 184 (94.9%) | 10 (5.1%) |
| 20 to 24 Year Olds | 121 (96.0%) | 5 (4.0%) |
| 25 to 34 Year Olds | 81 (97.6%) | 2 (2.4%) |
| 35 Years and over | 82 (64.1%) | 46 (35.9%) |
| Total | 2,610 (89.7%) | 300 (10.3%) |
Educational Attainment by Field of Study in Faribault County
Education (461 | 19.9%), business (449 | 19.3%), science & technology (257 | 11.1%), bio, nature & agricultural (237 | 10.2%), and arts & humanities (209 | 9.0%) are the most common fields of study among 2,323 individuals in Faribault County who have obtained a bachelor's degree or higher.
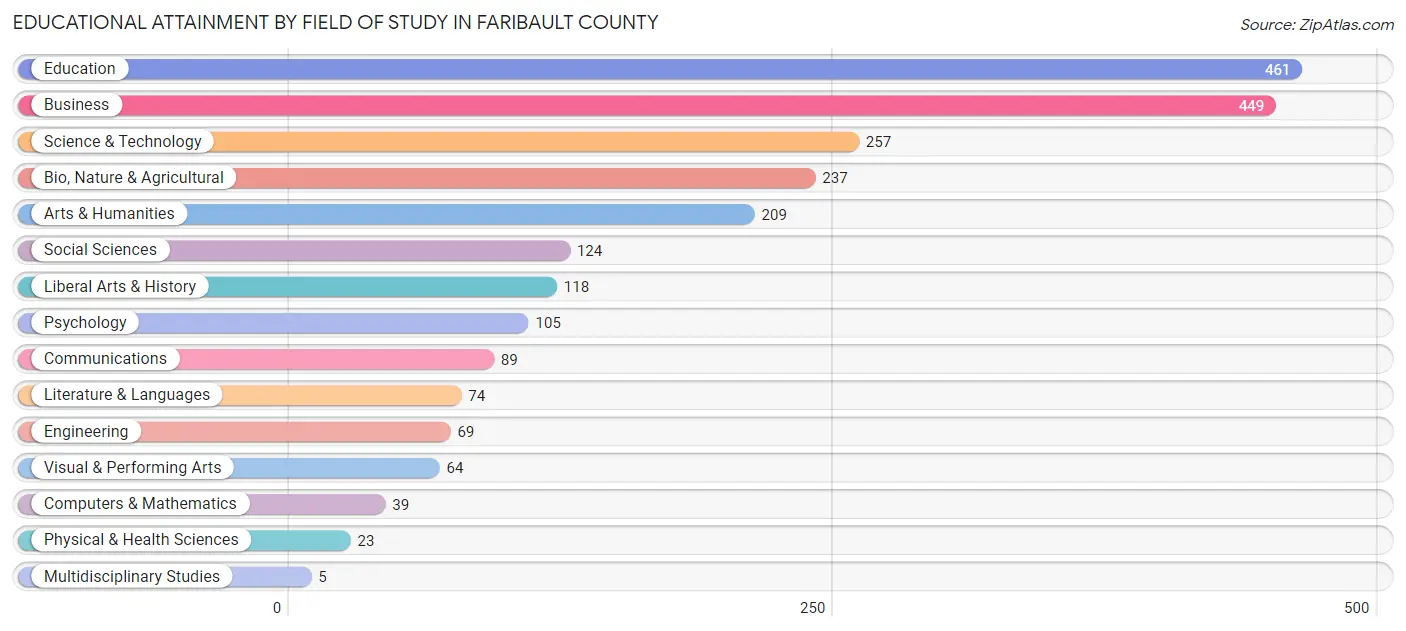
| Field of Study | # Graduates | % Graduates |
| Computers & Mathematics | 39 | 1.7% |
| Bio, Nature & Agricultural | 237 | 10.2% |
| Physical & Health Sciences | 23 | 1.0% |
| Psychology | 105 | 4.5% |
| Social Sciences | 124 | 5.3% |
| Engineering | 69 | 3.0% |
| Multidisciplinary Studies | 5 | 0.2% |
| Science & Technology | 257 | 11.1% |
| Business | 449 | 19.3% |
| Education | 461 | 19.9% |
| Literature & Languages | 74 | 3.2% |
| Liberal Arts & History | 118 | 5.1% |
| Visual & Performing Arts | 64 | 2.8% |
| Communications | 89 | 3.8% |
| Arts & Humanities | 209 | 9.0% |
| Total | 2,323 | 100.0% |
Transportation & Commute in Faribault County
Vehicle Availability by Sex in Faribault County
The most prevalent vehicle ownership categories in Faribault County are males with 2 vehicles (1,431, accounting for 39.9%) and females with 2 vehicles (1,149, making up 45.6%).
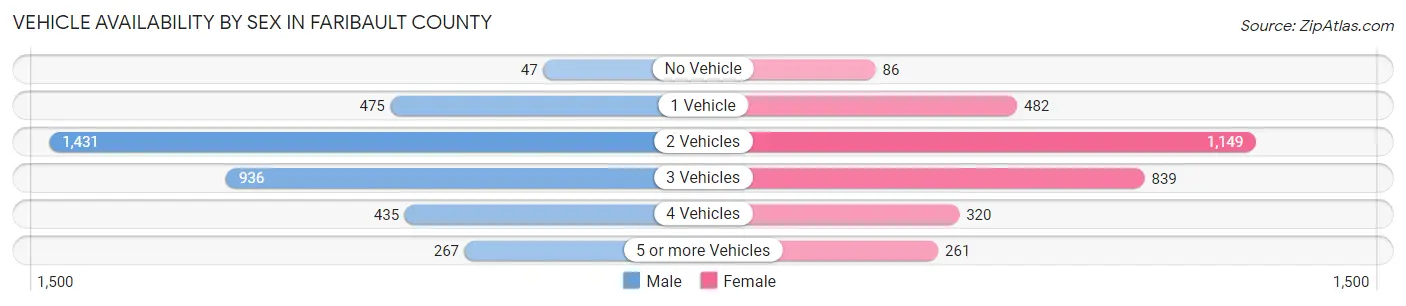
| Vehicles Available | Male | Female |
| No Vehicle | 47 (1.3%) | 86 (2.7%) |
| 1 Vehicle | 475 (13.2%) | 482 (15.4%) |
| 2 Vehicles | 1,431 (39.9%) | 1,149 (36.6%) |
| 3 Vehicles | 936 (26.1%) | 839 (26.8%) |
| 4 Vehicles | 435 (12.1%) | 320 (10.2%) |
| 5 or more Vehicles | 267 (7.4%) | 261 (8.3%) |
| Total | 3,591 (100.0%) | 3,137 (100.0%) |
Commute Time in Faribault County
The most frequently occuring commute durations in Faribault County are 5 to 9 minutes (1,239 commuters, 20.0%), less than 5 minutes (976 commuters, 15.8%), and 10 to 14 minutes (840 commuters, 13.6%).
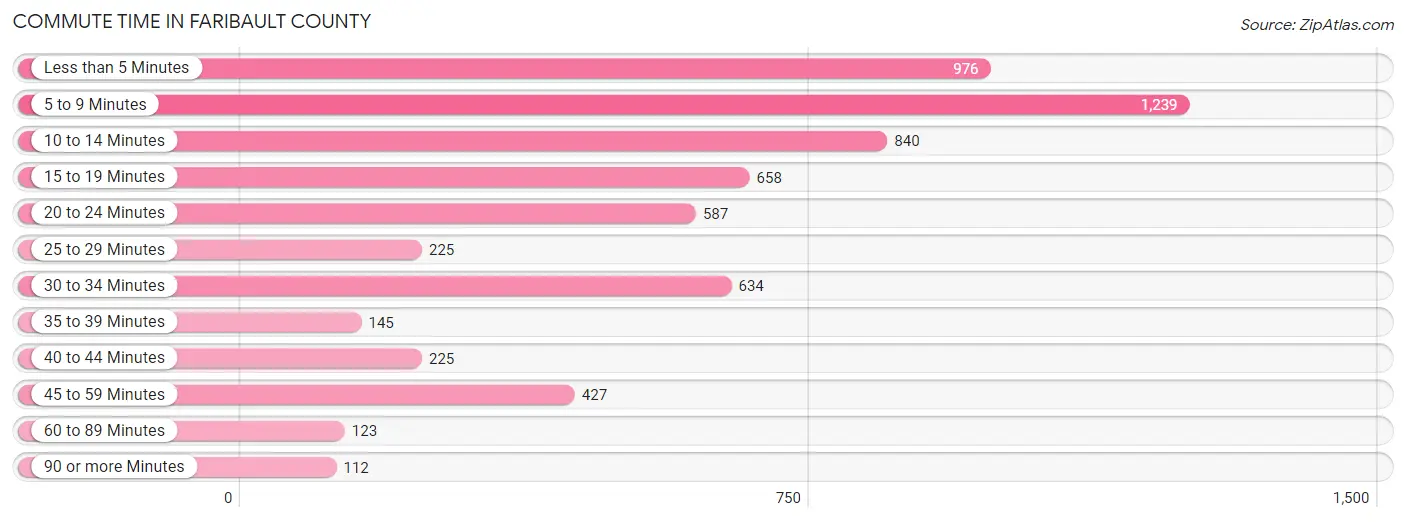
| Commute Time | # Commuters | % Commuters |
| Less than 5 Minutes | 976 | 15.8% |
| 5 to 9 Minutes | 1,239 | 20.0% |
| 10 to 14 Minutes | 840 | 13.6% |
| 15 to 19 Minutes | 658 | 10.6% |
| 20 to 24 Minutes | 587 | 9.5% |
| 25 to 29 Minutes | 225 | 3.6% |
| 30 to 34 Minutes | 634 | 10.2% |
| 35 to 39 Minutes | 145 | 2.3% |
| 40 to 44 Minutes | 225 | 3.6% |
| 45 to 59 Minutes | 427 | 6.9% |
| 60 to 89 Minutes | 123 | 2.0% |
| 90 or more Minutes | 112 | 1.8% |
Commute Time by Sex in Faribault County
The most common commute times in Faribault County are 5 to 9 minutes (690 commuters, 21.0%) for males and 5 to 9 minutes (549 commuters, 18.9%) for females.
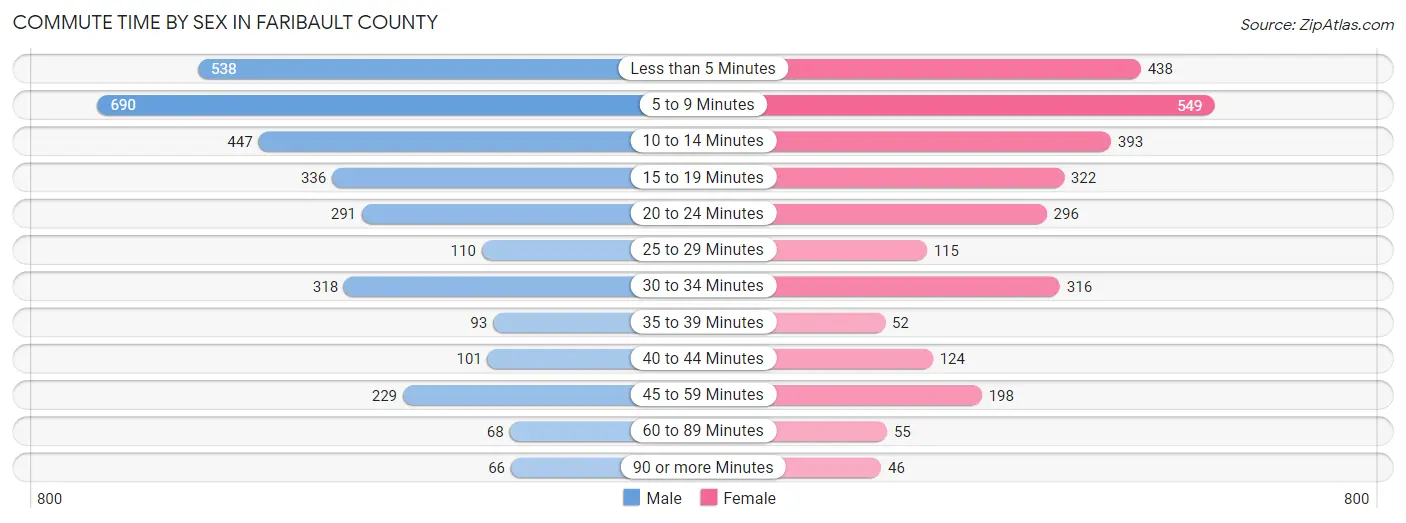
| Commute Time | Male | Female |
| Less than 5 Minutes | 538 (16.4%) | 438 (15.1%) |
| 5 to 9 Minutes | 690 (21.0%) | 549 (18.9%) |
| 10 to 14 Minutes | 447 (13.6%) | 393 (13.5%) |
| 15 to 19 Minutes | 336 (10.2%) | 322 (11.1%) |
| 20 to 24 Minutes | 291 (8.8%) | 296 (10.2%) |
| 25 to 29 Minutes | 110 (3.4%) | 115 (4.0%) |
| 30 to 34 Minutes | 318 (9.7%) | 316 (10.9%) |
| 35 to 39 Minutes | 93 (2.8%) | 52 (1.8%) |
| 40 to 44 Minutes | 101 (3.1%) | 124 (4.3%) |
| 45 to 59 Minutes | 229 (7.0%) | 198 (6.8%) |
| 60 to 89 Minutes | 68 (2.1%) | 55 (1.9%) |
| 90 or more Minutes | 66 (2.0%) | 46 (1.6%) |
Time of Departure to Work by Sex in Faribault County
The most frequent times of departure to work in Faribault County are 7:30 AM to 7:59 AM (475, 14.4%) for males and 7:30 AM to 7:59 AM (616, 21.2%) for females.

| Time of Departure | Male | Female |
| 12:00 AM to 4:59 AM | 277 (8.4%) | 126 (4.3%) |
| 5:00 AM to 5:29 AM | 221 (6.7%) | 77 (2.6%) |
| 5:30 AM to 5:59 AM | 244 (7.4%) | 61 (2.1%) |
| 6:00 AM to 6:29 AM | 325 (9.9%) | 155 (5.3%) |
| 6:30 AM to 6:59 AM | 463 (14.1%) | 296 (10.2%) |
| 7:00 AM to 7:29 AM | 441 (13.4%) | 488 (16.8%) |
| 7:30 AM to 7:59 AM | 475 (14.4%) | 616 (21.2%) |
| 8:00 AM to 8:29 AM | 308 (9.4%) | 282 (9.7%) |
| 8:30 AM to 8:59 AM | 54 (1.6%) | 121 (4.2%) |
| 9:00 AM to 9:59 AM | 92 (2.8%) | 158 (5.4%) |
| 10:00 AM to 10:59 AM | 51 (1.5%) | 49 (1.7%) |
| 11:00 AM to 11:59 AM | 37 (1.1%) | 63 (2.2%) |
| 12:00 PM to 3:59 PM | 133 (4.1%) | 215 (7.4%) |
| 4:00 PM to 11:59 PM | 166 (5.1%) | 197 (6.8%) |
| Total | 3,287 (100.0%) | 2,904 (100.0%) |
Housing Occupancy in Faribault County
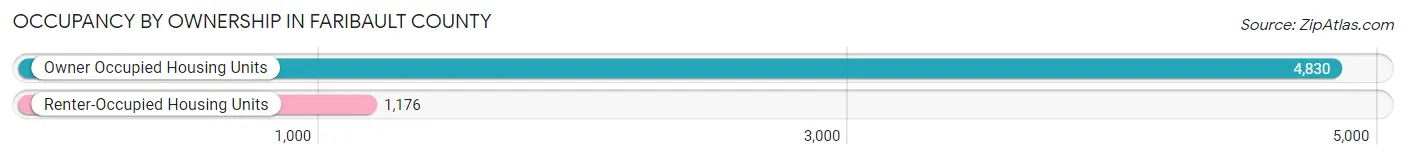
Occupancy by Ownership in Faribault County
Of the total 6,006 dwellings in Faribault County, owner-occupied units account for 4,830 (80.4%), while renter-occupied units make up 1,176 (19.6%).
| Occupancy | # Housing Units | % Housing Units |
| Owner Occupied Housing Units | 4,830 | 80.4% |
| Renter-Occupied Housing Units | 1,176 | 19.6% |
| Total Occupied Housing Units | 6,006 | 100.0% |
Occupancy by Household Size in Faribault County
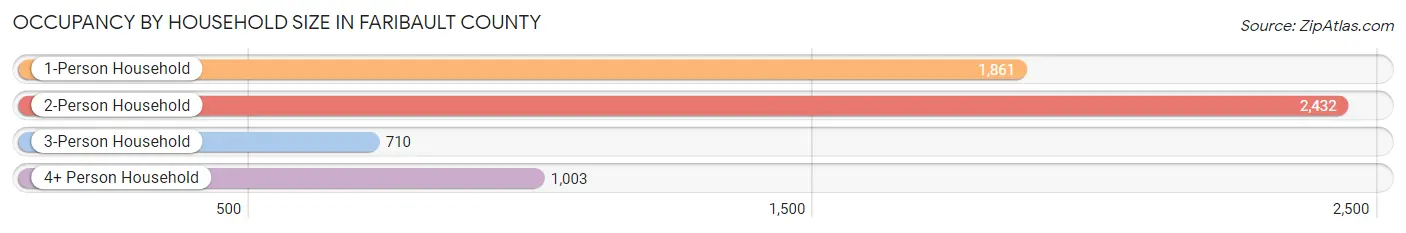
| Household Size | # Housing Units | % Housing Units |
| 1-Person Household | 1,861 | 31.0% |
| 2-Person Household | 2,432 | 40.5% |
| 3-Person Household | 710 | 11.8% |
| 4+ Person Household | 1,003 | 16.7% |
| Total Housing Units | 6,006 | 100.0% |
Occupancy by Ownership by Household Size in Faribault County
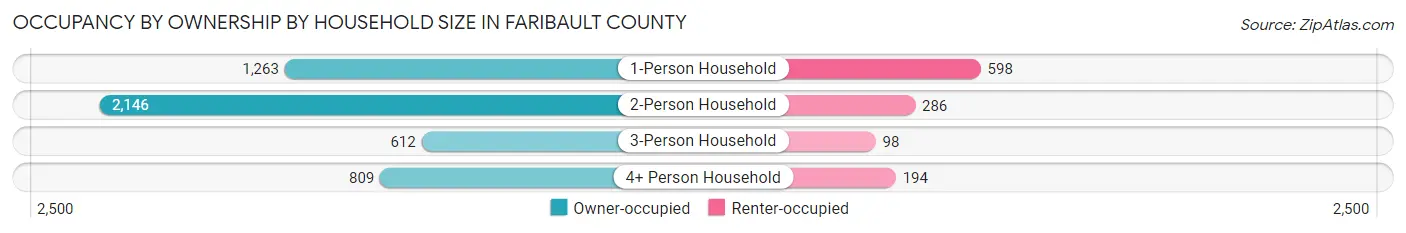
| Household Size | Owner-occupied | Renter-occupied |
| 1-Person Household | 1,263 (67.9%) | 598 (32.1%) |
| 2-Person Household | 2,146 (88.2%) | 286 (11.8%) |
| 3-Person Household | 612 (86.2%) | 98 (13.8%) |
| 4+ Person Household | 809 (80.7%) | 194 (19.3%) |
| Total Housing Units | 4,830 (80.4%) | 1,176 (19.6%) |
Occupancy by Educational Attainment in Faribault County

| Household Size | Owner-occupied | Renter-occupied |
| Less than High School | 210 (55.4%) | 169 (44.6%) |
| High School Diploma | 1,552 (78.7%) | 421 (21.3%) |
| College/Associate Degree | 1,949 (82.9%) | 403 (17.1%) |
| Bachelor's Degree or higher | 1,119 (85.9%) | 183 (14.1%) |
Occupancy by Age of Householder in Faribault County

| Age Bracket | # Households | % Households |
| Under 35 Years | 933 | 15.5% |
| 35 to 44 Years | 905 | 15.1% |
| 45 to 54 Years | 892 | 14.8% |
| 55 to 64 Years | 1,280 | 21.3% |
| 65 to 74 Years | 1,064 | 17.7% |
| 75 to 84 Years | 628 | 10.5% |
| 85 Years and Over | 304 | 5.1% |
| Total | 6,006 | 100.0% |
Housing Finances in Faribault County
Median Income by Occupancy in Faribault County
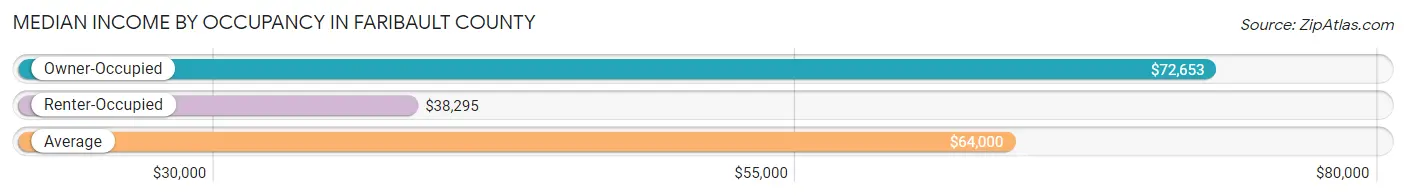
| Occupancy Type | # Households | Median Income |
| Owner-Occupied | 4,830 (80.4%) | $72,653 |
| Renter-Occupied | 1,176 (19.6%) | $38,295 |
| Average | 6,006 (100.0%) | $64,000 |
Occupancy by Householder Income Bracket in Faribault County
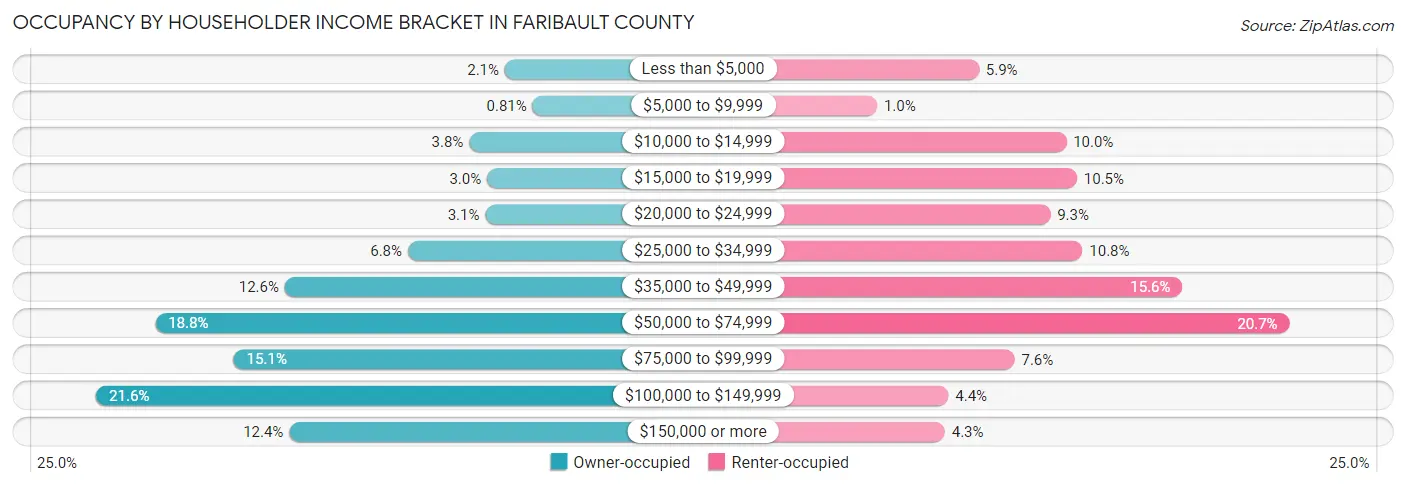
| Income Bracket | Owner-occupied | Renter-occupied |
| Less than $5,000 | 103 (2.1%) | 69 (5.9%) |
| $5,000 to $9,999 | 39 (0.8%) | 12 (1.0%) |
| $10,000 to $14,999 | 185 (3.8%) | 118 (10.0%) |
| $15,000 to $19,999 | 144 (3.0%) | 124 (10.5%) |
| $20,000 to $24,999 | 148 (3.1%) | 109 (9.3%) |
| $25,000 to $34,999 | 326 (6.8%) | 127 (10.8%) |
| $35,000 to $49,999 | 609 (12.6%) | 183 (15.6%) |
| $50,000 to $74,999 | 907 (18.8%) | 243 (20.7%) |
| $75,000 to $99,999 | 727 (15.0%) | 89 (7.6%) |
| $100,000 to $149,999 | 1,043 (21.6%) | 52 (4.4%) |
| $150,000 or more | 599 (12.4%) | 50 (4.3%) |
| Total | 4,830 (100.0%) | 1,176 (100.0%) |
Monthly Housing Cost Tiers in Faribault County
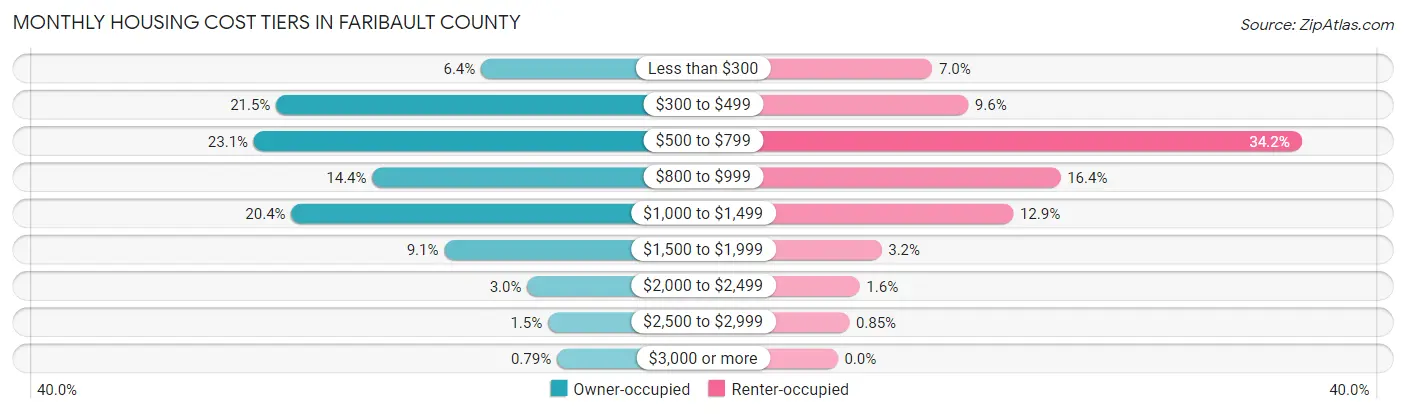
| Monthly Cost | Owner-occupied | Renter-occupied |
| Less than $300 | 308 (6.4%) | 82 (7.0%) |
| $300 to $499 | 1,037 (21.5%) | 113 (9.6%) |
| $500 to $799 | 1,116 (23.1%) | 402 (34.2%) |
| $800 to $999 | 695 (14.4%) | 193 (16.4%) |
| $1,000 to $1,499 | 983 (20.3%) | 152 (12.9%) |
| $1,500 to $1,999 | 439 (9.1%) | 38 (3.2%) |
| $2,000 to $2,499 | 144 (3.0%) | 19 (1.6%) |
| $2,500 to $2,999 | 70 (1.5%) | 10 (0.9%) |
| $3,000 or more | 38 (0.8%) | 0 (0.0%) |
| Total | 4,830 (100.0%) | 1,176 (100.0%) |
Physical Housing Characteristics in Faribault County
Housing Structures in Faribault County
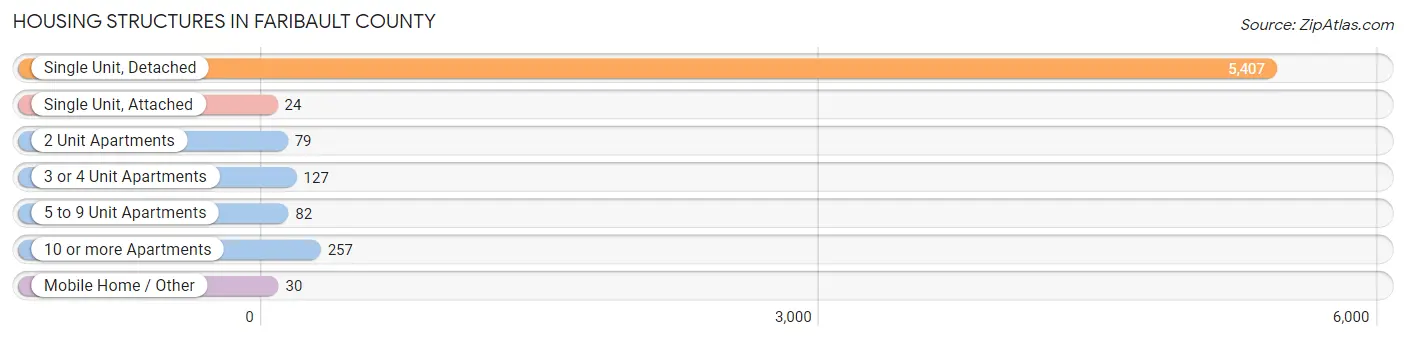
| Structure Type | # Housing Units | % Housing Units |
| Single Unit, Detached | 5,407 | 90.0% |
| Single Unit, Attached | 24 | 0.4% |
| 2 Unit Apartments | 79 | 1.3% |
| 3 or 4 Unit Apartments | 127 | 2.1% |
| 5 to 9 Unit Apartments | 82 | 1.4% |
| 10 or more Apartments | 257 | 4.3% |
| Mobile Home / Other | 30 | 0.5% |
| Total | 6,006 | 100.0% |
Housing Structures by Occupancy in Faribault County
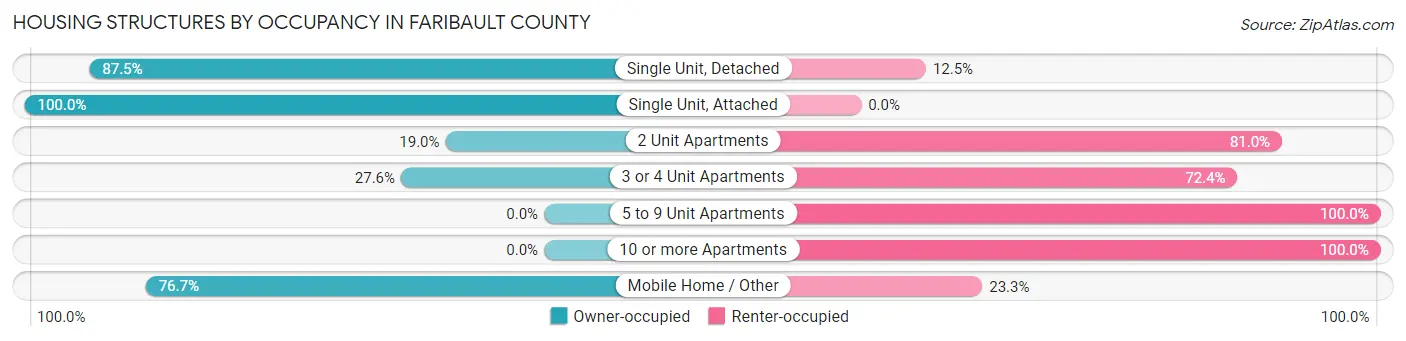
| Structure Type | Owner-occupied | Renter-occupied |
| Single Unit, Detached | 4,733 (87.5%) | 674 (12.5%) |
| Single Unit, Attached | 24 (100.0%) | 0 (0.0%) |
| 2 Unit Apartments | 15 (19.0%) | 64 (81.0%) |
| 3 or 4 Unit Apartments | 35 (27.6%) | 92 (72.4%) |
| 5 to 9 Unit Apartments | 0 (0.0%) | 82 (100.0%) |
| 10 or more Apartments | 0 (0.0%) | 257 (100.0%) |
| Mobile Home / Other | 23 (76.7%) | 7 (23.3%) |
| Total | 4,830 (80.4%) | 1,176 (19.6%) |
Housing Structures by Number of Rooms in Faribault County
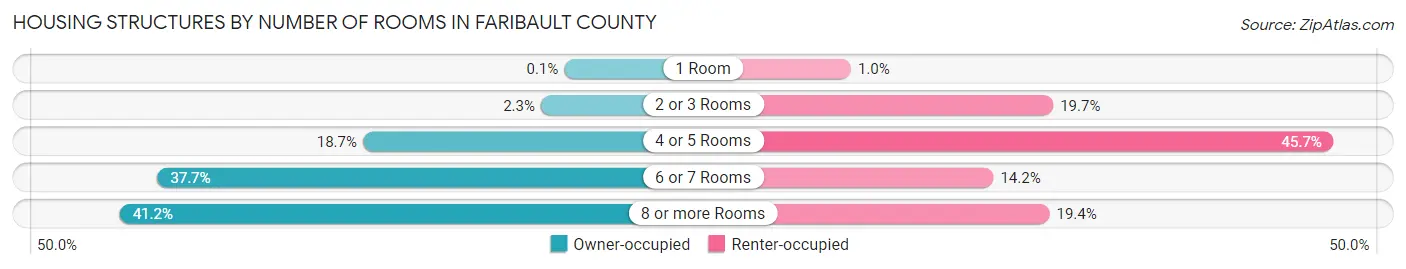
| Number of Rooms | Owner-occupied | Renter-occupied |
| 1 Room | 5 (0.1%) | 12 (1.0%) |
| 2 or 3 Rooms | 109 (2.3%) | 232 (19.7%) |
| 4 or 5 Rooms | 904 (18.7%) | 537 (45.7%) |
| 6 or 7 Rooms | 1,822 (37.7%) | 167 (14.2%) |
| 8 or more Rooms | 1,990 (41.2%) | 228 (19.4%) |
| Total | 4,830 (100.0%) | 1,176 (100.0%) |
Housing Structure by Heating Type in Faribault County
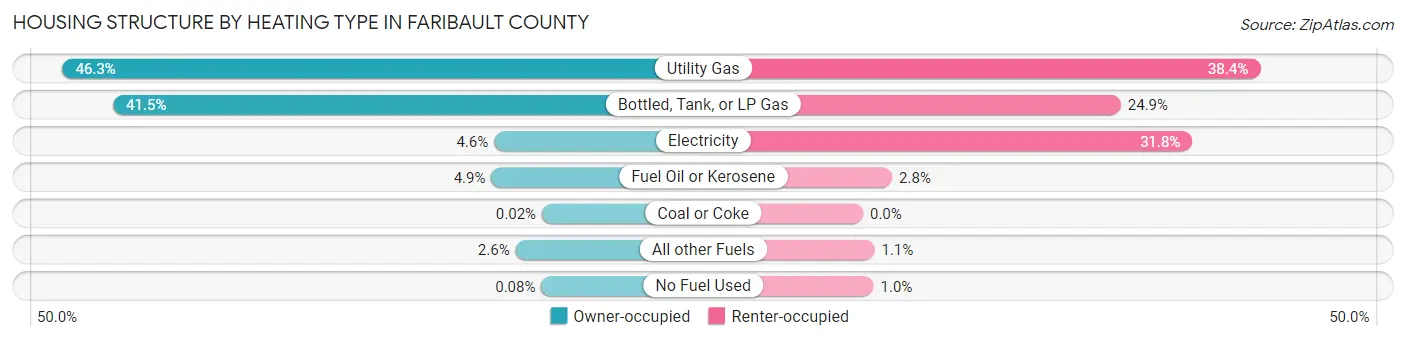
| Heating Type | Owner-occupied | Renter-occupied |
| Utility Gas | 2,238 (46.3%) | 451 (38.4%) |
| Bottled, Tank, or LP Gas | 2,002 (41.4%) | 293 (24.9%) |
| Electricity | 224 (4.6%) | 374 (31.8%) |
| Fuel Oil or Kerosene | 237 (4.9%) | 33 (2.8%) |
| Coal or Coke | 1 (0.0%) | 0 (0.0%) |
| All other Fuels | 124 (2.6%) | 13 (1.1%) |
| No Fuel Used | 4 (0.1%) | 12 (1.0%) |
| Total | 4,830 (100.0%) | 1,176 (100.0%) |
Household Vehicle Usage in Faribault County
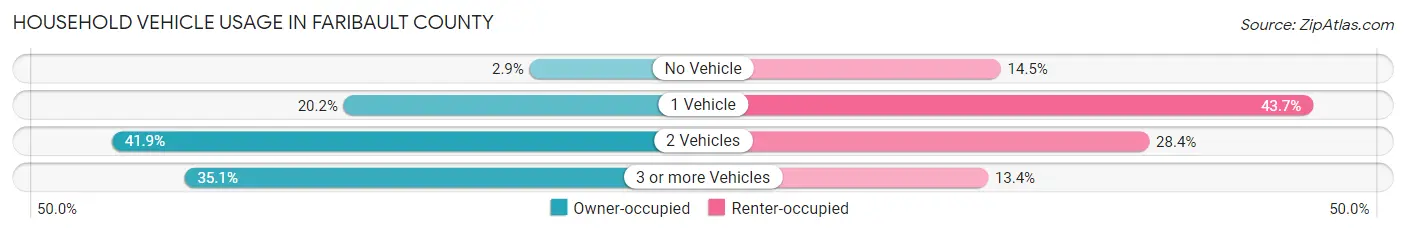
| Vehicles per Household | Owner-occupied | Renter-occupied |
| No Vehicle | 138 (2.9%) | 171 (14.5%) |
| 1 Vehicle | 976 (20.2%) | 514 (43.7%) |
| 2 Vehicles | 2,022 (41.9%) | 334 (28.4%) |
| 3 or more Vehicles | 1,694 (35.1%) | 157 (13.4%) |
| Total | 4,830 (100.0%) | 1,176 (100.0%) |
Real Estate & Mortgages in Faribault County
Real Estate and Mortgage Overview in Faribault County
| Characteristic | Without Mortgage | With Mortgage |
| Housing Units | 2,444 | 2,386 |
| Median Property Value | $101,300 | $131,800 |
| Median Household Income | $57,625 | $346 |
| Monthly Housing Costs | $481 | $36 |
| Real Estate Taxes | $1,110 | $37 |
Property Value by Mortgage Status in Faribault County
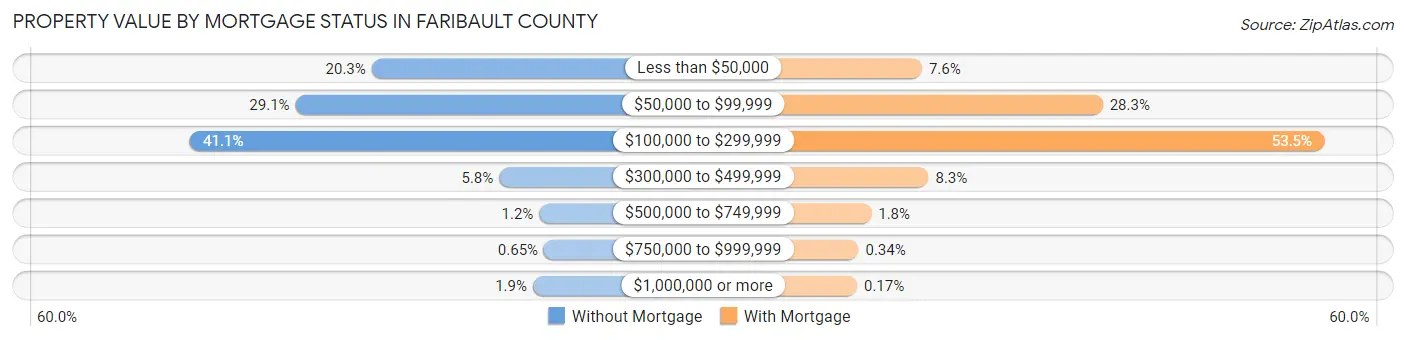
| Property Value | Without Mortgage | With Mortgage |
| Less than $50,000 | 497 (20.3%) | 181 (7.6%) |
| $50,000 to $99,999 | 710 (29.0%) | 674 (28.2%) |
| $100,000 to $299,999 | 1,004 (41.1%) | 1,277 (53.5%) |
| $300,000 to $499,999 | 141 (5.8%) | 199 (8.3%) |
| $500,000 to $749,999 | 29 (1.2%) | 43 (1.8%) |
| $750,000 to $999,999 | 16 (0.6%) | 8 (0.3%) |
| $1,000,000 or more | 47 (1.9%) | 4 (0.2%) |
| Total | 2,444 (100.0%) | 2,386 (100.0%) |
Household Income by Mortgage Status in Faribault County
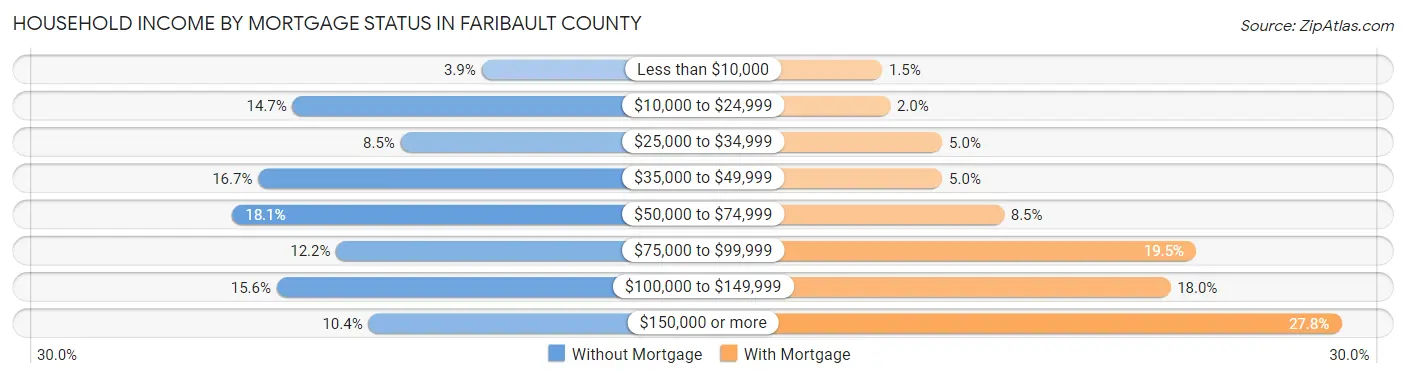
| Household Income | Without Mortgage | With Mortgage |
| Less than $10,000 | 95 (3.9%) | 36 (1.5%) |
| $10,000 to $24,999 | 359 (14.7%) | 47 (2.0%) |
| $25,000 to $34,999 | 208 (8.5%) | 118 (5.0%) |
| $35,000 to $49,999 | 407 (16.7%) | 118 (5.0%) |
| $50,000 to $74,999 | 443 (18.1%) | 202 (8.5%) |
| $75,000 to $99,999 | 298 (12.2%) | 464 (19.5%) |
| $100,000 to $149,999 | 381 (15.6%) | 429 (18.0%) |
| $150,000 or more | 253 (10.3%) | 662 (27.8%) |
| Total | 2,444 (100.0%) | 2,386 (100.0%) |
Property Value to Household Income Ratio in Faribault County
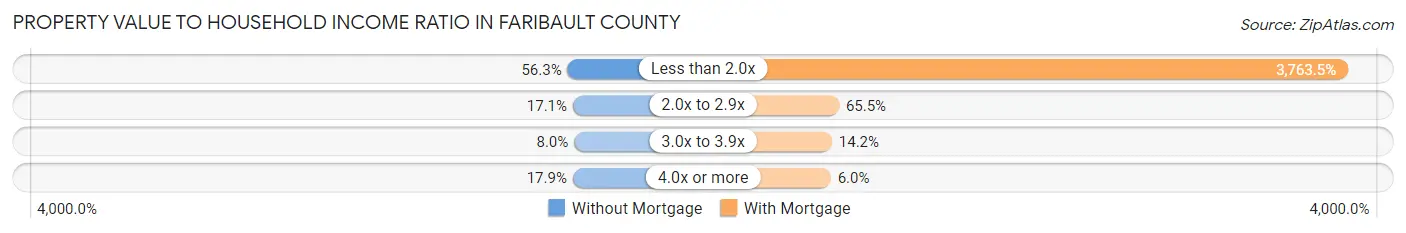
| Value-to-Income Ratio | Without Mortgage | With Mortgage |
| Less than 2.0x | 1,376 (56.3%) | 89,798 (3,763.5%) |
| 2.0x to 2.9x | 418 (17.1%) | 1,562 (65.5%) |
| 3.0x to 3.9x | 195 (8.0%) | 338 (14.2%) |
| 4.0x or more | 438 (17.9%) | 144 (6.0%) |
| Total | 2,444 (100.0%) | 2,386 (100.0%) |
Real Estate Taxes by Mortgage Status in Faribault County
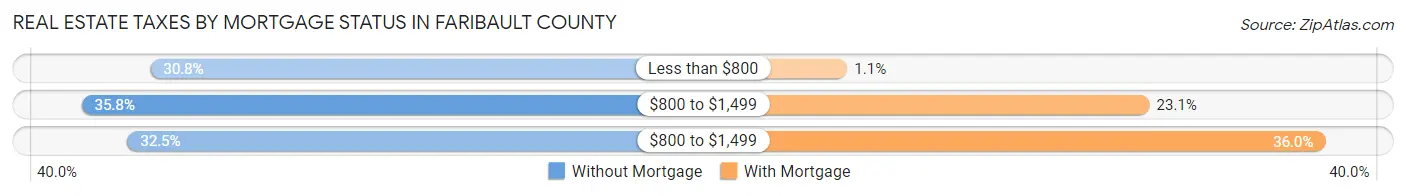
| Property Taxes | Without Mortgage | With Mortgage |
| Less than $800 | 753 (30.8%) | 25 (1.1%) |
| $800 to $1,499 | 876 (35.8%) | 552 (23.1%) |
| $800 to $1,499 | 794 (32.5%) | 858 (36.0%) |
| Total | 2,444 (100.0%) | 2,386 (100.0%) |
Health & Disability in Faribault County
Health Insurance Coverage by Age in Faribault County

| Age Bracket | With Coverage | Without Coverage |
| Under 6 Years | 884 (97.9%) | 19 (2.1%) |
| 6 to 18 Years | 2,102 (92.5%) | 171 (7.5%) |
| 19 to 25 Years | 896 (91.8%) | 80 (8.2%) |
| 26 to 34 Years | 1,100 (92.4%) | 90 (7.6%) |
| 35 to 44 Years | 1,462 (89.2%) | 177 (10.8%) |
| 45 to 54 Years | 1,453 (93.8%) | 96 (6.2%) |
| 55 to 64 Years | 2,046 (96.3%) | 79 (3.7%) |
| 65 to 74 Years | 1,708 (99.9%) | 2 (0.1%) |
| 75 Years and older | 1,280 (99.1%) | 12 (0.9%) |
| Total | 12,931 (94.7%) | 726 (5.3%) |
Health Insurance Coverage by Citizenship Status in Faribault County
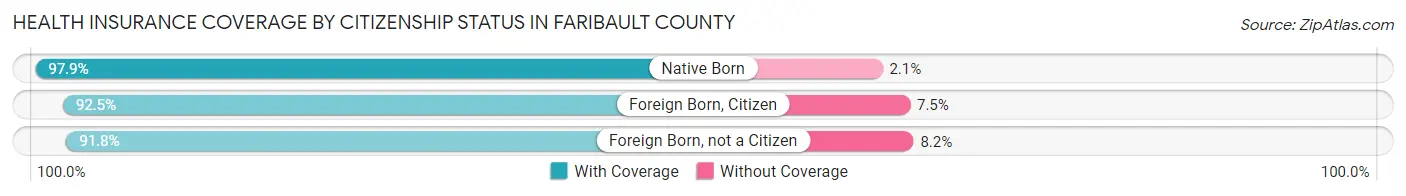
| Citizenship Status | With Coverage | Without Coverage |
| Native Born | 884 (97.9%) | 19 (2.1%) |
| Foreign Born, Citizen | 2,102 (92.5%) | 171 (7.5%) |
| Foreign Born, not a Citizen | 896 (91.8%) | 80 (8.2%) |
Health Insurance Coverage by Household Income in Faribault County
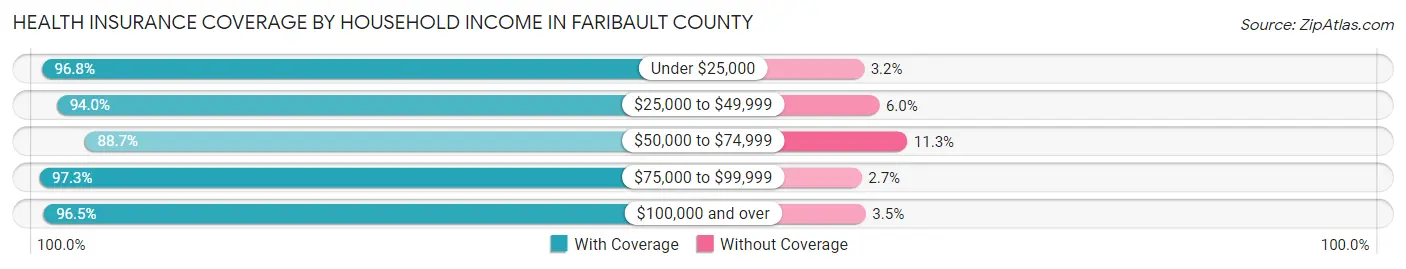
| Household Income | With Coverage | Without Coverage |
| Under $25,000 | 1,435 (96.8%) | 47 (3.2%) |
| $25,000 to $49,999 | 2,247 (94.0%) | 144 (6.0%) |
| $50,000 to $74,999 | 2,403 (88.7%) | 305 (11.3%) |
| $75,000 to $99,999 | 2,004 (97.3%) | 56 (2.7%) |
| $100,000 and over | 4,815 (96.5%) | 174 (3.5%) |
Public vs Private Health Insurance Coverage by Age in Faribault County
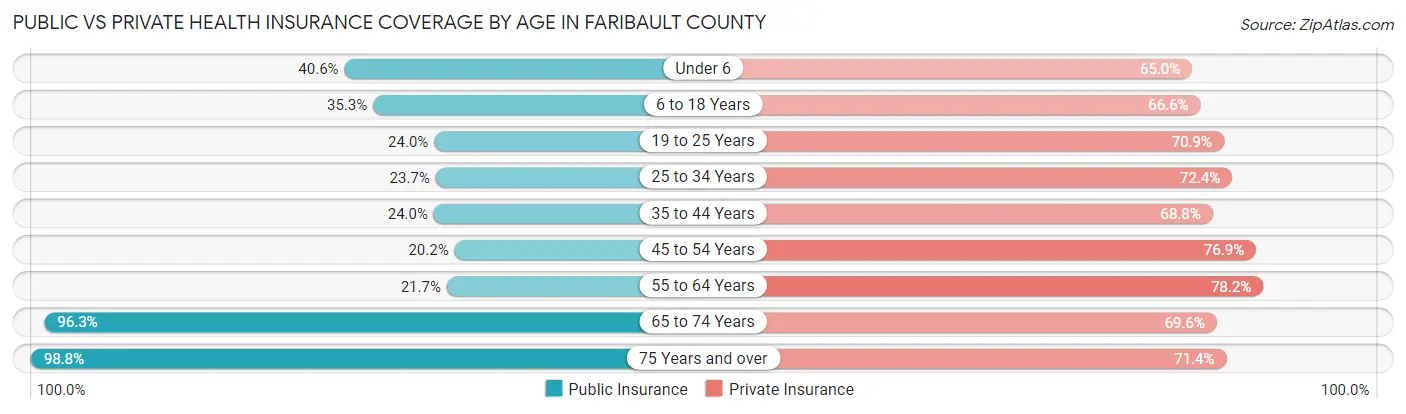
| Age Bracket | Public Insurance | Private Insurance |
| Under 6 | 367 (40.6%) | 587 (65.0%) |
| 6 to 18 Years | 803 (35.3%) | 1,513 (66.6%) |
| 19 to 25 Years | 234 (24.0%) | 692 (70.9%) |
| 25 to 34 Years | 282 (23.7%) | 862 (72.4%) |
| 35 to 44 Years | 394 (24.0%) | 1,128 (68.8%) |
| 45 to 54 Years | 313 (20.2%) | 1,191 (76.9%) |
| 55 to 64 Years | 460 (21.6%) | 1,662 (78.2%) |
| 65 to 74 Years | 1,647 (96.3%) | 1,190 (69.6%) |
| 75 Years and over | 1,277 (98.8%) | 922 (71.4%) |
| Total | 5,777 (42.3%) | 9,747 (71.4%) |
Disability Status by Sex by Age in Faribault County
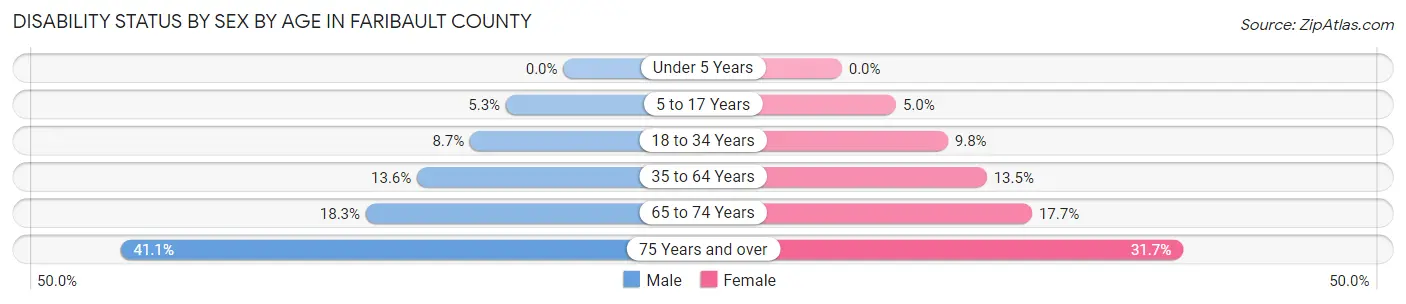
| Age Bracket | Male | Female |
| Under 5 Years | 0 (0.0%) | 0 (0.0%) |
| 5 to 17 Years | 66 (5.3%) | 54 (5.0%) |
| 18 to 34 Years | 104 (8.7%) | 109 (9.8%) |
| 35 to 64 Years | 370 (13.6%) | 348 (13.5%) |
| 65 to 74 Years | 165 (18.3%) | 143 (17.6%) |
| 75 Years and over | 226 (41.1%) | 235 (31.7%) |
Disability Class by Sex by Age in Faribault County
Disability Class: Hearing Difficulty
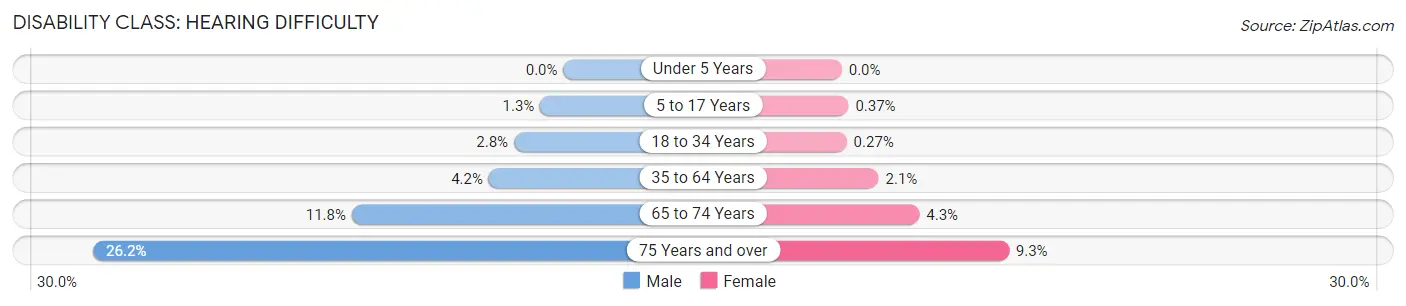
| Age Bracket | Male | Female |
| Under 5 Years | 0 (0.0%) | 0 (0.0%) |
| 5 to 17 Years | 16 (1.3%) | 4 (0.4%) |
| 18 to 34 Years | 33 (2.8%) | 3 (0.3%) |
| 35 to 64 Years | 113 (4.2%) | 53 (2.1%) |
| 65 to 74 Years | 106 (11.8%) | 35 (4.3%) |
| 75 Years and over | 144 (26.2%) | 69 (9.3%) |
Disability Class: Vision Difficulty
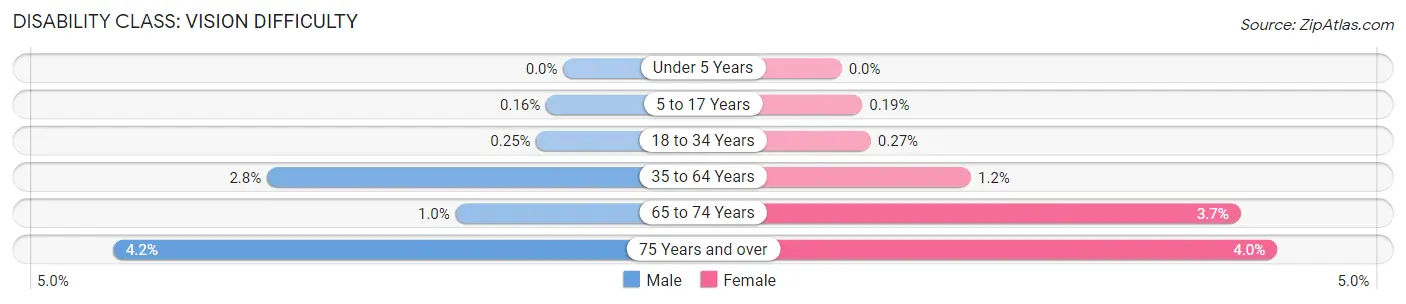
| Age Bracket | Male | Female |
| Under 5 Years | 0 (0.0%) | 0 (0.0%) |
| 5 to 17 Years | 2 (0.2%) | 2 (0.2%) |
| 18 to 34 Years | 3 (0.3%) | 3 (0.3%) |
| 35 to 64 Years | 75 (2.8%) | 31 (1.2%) |
| 65 to 74 Years | 9 (1.0%) | 30 (3.7%) |
| 75 Years and over | 23 (4.2%) | 30 (4.0%) |
Disability Class: Cognitive Difficulty
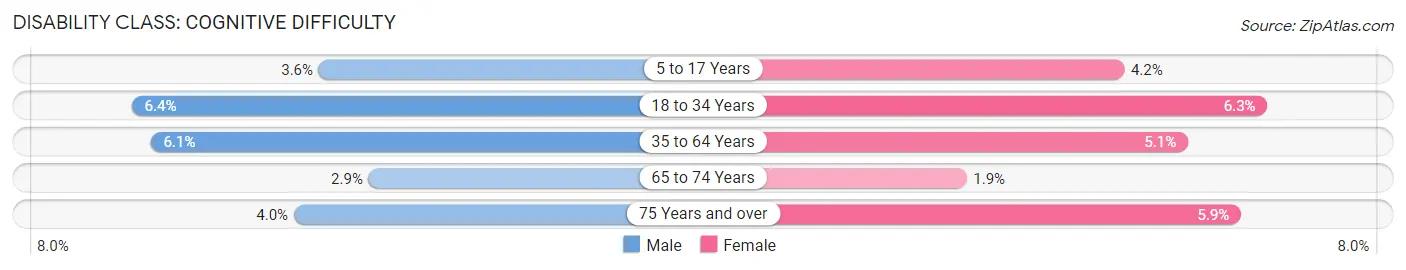
| Age Bracket | Male | Female |
| 5 to 17 Years | 45 (3.6%) | 45 (4.2%) |
| 18 to 34 Years | 77 (6.4%) | 70 (6.3%) |
| 35 to 64 Years | 167 (6.1%) | 133 (5.1%) |
| 65 to 74 Years | 26 (2.9%) | 15 (1.8%) |
| 75 Years and over | 22 (4.0%) | 44 (5.9%) |
Disability Class: Ambulatory Difficulty
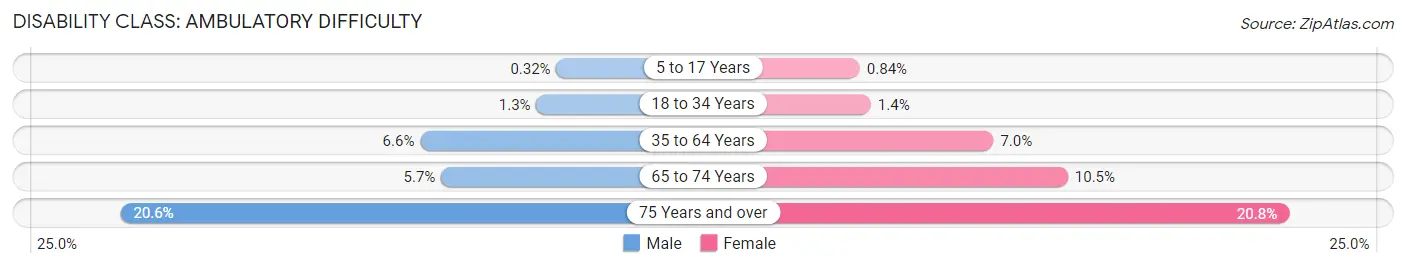
| Age Bracket | Male | Female |
| 5 to 17 Years | 4 (0.3%) | 9 (0.8%) |
| 18 to 34 Years | 15 (1.3%) | 15 (1.3%) |
| 35 to 64 Years | 181 (6.6%) | 182 (7.0%) |
| 65 to 74 Years | 51 (5.7%) | 85 (10.5%) |
| 75 Years and over | 113 (20.5%) | 154 (20.7%) |
Disability Class: Self-Care Difficulty
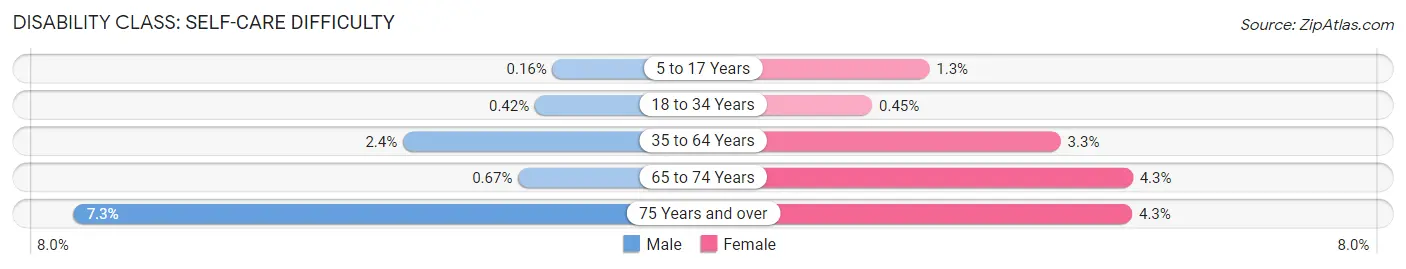
| Age Bracket | Male | Female |
| 5 to 17 Years | 2 (0.2%) | 14 (1.3%) |
| 18 to 34 Years | 5 (0.4%) | 5 (0.4%) |
| 35 to 64 Years | 65 (2.4%) | 84 (3.3%) |
| 65 to 74 Years | 6 (0.7%) | 35 (4.3%) |
| 75 Years and over | 40 (7.3%) | 32 (4.3%) |
Technology Access in Faribault County
Computing Device Access in Faribault County
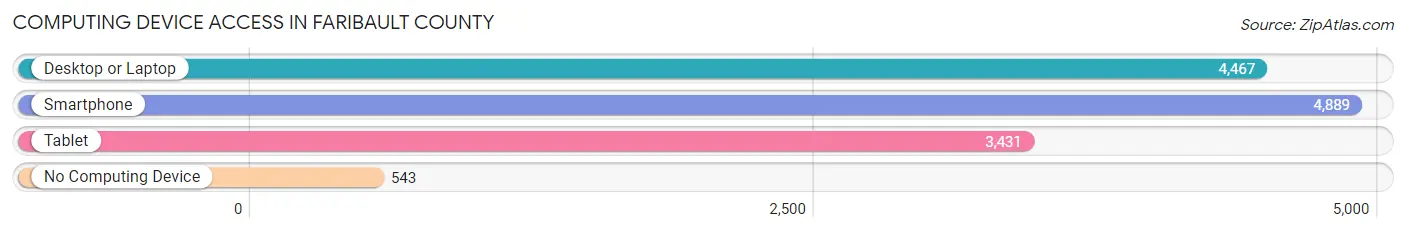
| Device Type | # Households | % Households |
| Desktop or Laptop | 4,467 | 74.4% |
| Smartphone | 4,889 | 81.4% |
| Tablet | 3,431 | 57.1% |
| No Computing Device | 543 | 9.0% |
| Total | 6,006 | 100.0% |
Internet Access in Faribault County
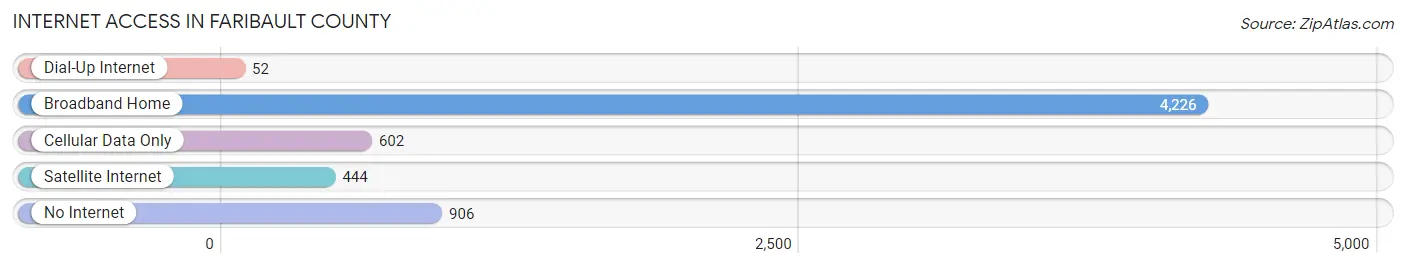
| Internet Type | # Households | % Households |
| Dial-Up Internet | 52 | 0.9% |
| Broadband Home | 4,226 | 70.4% |
| Cellular Data Only | 602 | 10.0% |
| Satellite Internet | 444 | 7.4% |
| No Internet | 906 | 15.1% |
| Total | 6,006 | 100.0% |
Faribault County Summary
Faribault County is located in the southeastern corner of Minnesota, and is part of the Mankato-North Mankato Metropolitan Statistical Area. The county was established in 1855 and is named after Alexander Faribault, a French-Canadian fur trader who was the first white settler in the area. The county seat is Blue Earth, and the county has a total area of 576 square miles. As of the 2010 census, the population was 14,553.
Geography
Faribault County is located in the southeastern corner of Minnesota, and is bordered by Martin County to the north, Watonwan County to the east, Waseca County to the south, and Freeborn County to the west. The county is part of the Mankato-North Mankato Metropolitan Statistical Area. The county has a total area of 576 square miles, of which 574 square miles is land and 2 square miles is water. The county is mostly flat, with some rolling hills in the northern part. The highest point in the county is located in the northwest corner, at an elevation of 1,092 feet. The county is drained by the Blue Earth River, which flows through the county from north to south.
Climate
Faribault County has a humid continental climate, with cold winters and warm summers. The average annual temperature is 45°F, and the average annual precipitation is 28 inches. The average snowfall is around 40 inches per year.
Demographics
As of the 2010 census, there were 14,553 people, 5,845 households, and 3,845 families living in the county. The population density was 25.3 people per square mile. The racial makeup of the county was 97.2% White, 0.5% African American, 0.3% Native American, 0.4% Asian, 0.1% Pacific Islander, 0.5% from other races, and 0.9% from two or more races. Hispanic or Latino of any race were 1.3% of the population.
The median income for a household in the county was $45,845, and the median income for a family was $54,845. The per capita income for the county was $21,845. About 6.2% of families and 8.7% of the population were below the poverty line, including 10.2% of those under age 18 and 8.2% of those age 65 or over.
Economy
The economy of Faribault County is largely based on agriculture, with corn, soybeans, and wheat being the main crops. The county is also home to several manufacturing companies, including a large food processing plant and a paper mill. The county is also home to several small businesses, including restaurants, retail stores, and service providers.
The unemployment rate in Faribault County was 3.7% in 2019, lower than the national average of 3.9%. The median household income was $54,845 in 2019, higher than the national median of $61,937.
Conclusion
Faribault County is located in the southeastern corner of Minnesota and is part of the Mankato-North Mankato Metropolitan Statistical Area. The county was established in 1855 and is named after Alexander Faribault, a French-Canadian fur trader who was the first white settler in the area. The county has a total area of 576 square miles, and the population was 14,553 as of the 2010 census. The economy of Faribault County is largely based on agriculture, with corn, soybeans, and wheat being the main crops. The county is also home to several manufacturing companies, and the unemployment rate was 3.7% in 2019.
Common Questions
What is Per Capita Income in Faribault County?
Per Capita income in Faribault County is $35,307.
What is the Median Family Income in Faribault County?
Median Family Income in Faribault County is $85,360.
What is the Median Household income in Faribault County?
Median Household Income in Faribault County is $64,000.
What is Income or Wage Gap in Faribault County?
Income or Wage Gap in Faribault County is 31.4%.
Women in Faribault County earn 68.6 cents for every dollar earned by a man.
What is Family Income Deficit in Faribault County?
Family Income Deficit in Faribault County is $9,957.
Families that are below poverty line in Faribault County earn $9,957 less on average than the poverty threshold level.
What is Inequality or Gini Index in Faribault County?
Inequality or Gini Index in Faribault County is 0.42.
What is the Total Population of Faribault County?
Total Population of Faribault County is 13,931.
What is the Total Male Population of Faribault County?
Total Male Population of Faribault County is 7,120.
What is the Total Female Population of Faribault County?
Total Female Population of Faribault County is 6,811.
What is the Ratio of Males per 100 Females in Faribault County?
There are 104.54 Males per 100 Females in Faribault County.
What is the Ratio of Females per 100 Males in Faribault County?
There are 95.66 Females per 100 Males in Faribault County.
What is the Median Population Age in Faribault County?
Median Population Age in Faribault County is 44.6 Years.
What is the Average Family Size in Faribault County
Average Family Size in Faribault County is 2.8 People.
What is the Average Household Size in Faribault County
Average Household Size in Faribault County is 2.3 People.
How Large is the Labor Force in Faribault County?
There are 7,203 People in the Labor Forcein in Faribault County.
What is the Percentage of People in the Labor Force in Faribault County?
63.9% of People are in the Labor Force in Faribault County.
What is the Unemployment Rate in Faribault County?
Unemployment Rate in Faribault County is 4.3%.