Dakota County, MN Map & Demographics
Dakota County Map
Dakota County Overview
$48,894
PER CAPITA INCOME
$124,610
AVG FAMILY INCOME
$101,360
AVG HOUSEHOLD INCOME
28.9%
WAGE / INCOME GAP [ % ]
71.1¢/ $1
WAGE / INCOME GAP [ $ ]
$10,021
FAMILY INCOME DEFICIT
0.41
INEQUALITY / GINI INDEX
439,179
TOTAL POPULATION
218,368
MALE POPULATION
220,811
FEMALE POPULATION
98.89
MALES / 100 FEMALES
101.12
FEMALES / 100 MALES
38.4
MEDIAN AGE
3.1
AVG FAMILY SIZE
2.6
AVG HOUSEHOLD SIZE
249,078
LABOR FORCE [ PEOPLE ]
72.1%
PERCENT IN LABOR FORCE
3.7%
UNEMPLOYMENT RATE
Income in Dakota County
Income Overview in Dakota County
Per Capita Income in Dakota County is $48,894, while median incomes of families and households are $124,610 and $101,360 respectively.
| Characteristic | Number | Measure |
| Per Capita Income | 439,179 | $48,894 |
| Median Family Income | 116,096 | $124,610 |
| Mean Family Income | 116,096 | $147,846 |
| Median Household Income | 169,404 | $101,360 |
| Mean Household Income | 169,404 | $124,697 |
| Income Deficit | 116,096 | $10,021 |
| Wage / Income Gap (%) | 439,179 | 28.92% |
| Wage / Income Gap ($) | 439,179 | 71.08¢ per $1 |
| Gini / Inequality Index | 439,179 | 0.41 |
Earnings by Sex in Dakota County
Average Earnings in Dakota County are $54,080, $64,145 for men and $45,597 for women, a difference of 28.9%.
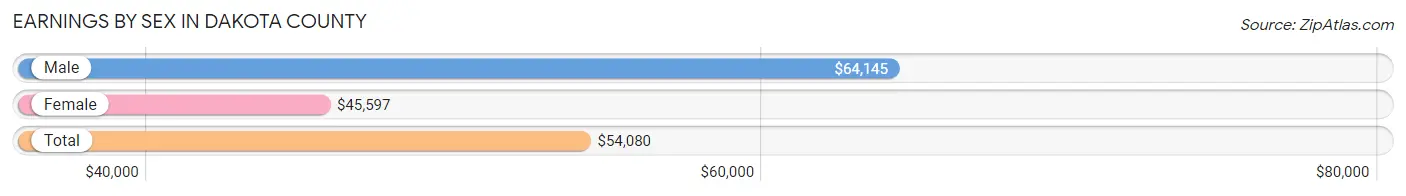
| Sex | Number | Average Earnings |
| Male | 134,851 (52.0%) | $64,145 |
| Female | 124,484 (48.0%) | $45,597 |
| Total | 259,335 (100.0%) | $54,080 |
Earnings by Sex by Income Bracket in Dakota County
The most common earnings brackets in Dakota County are $100,000+ for men (36,214 | 26.9%) and $100,000+ for women (16,555 | 13.3%).
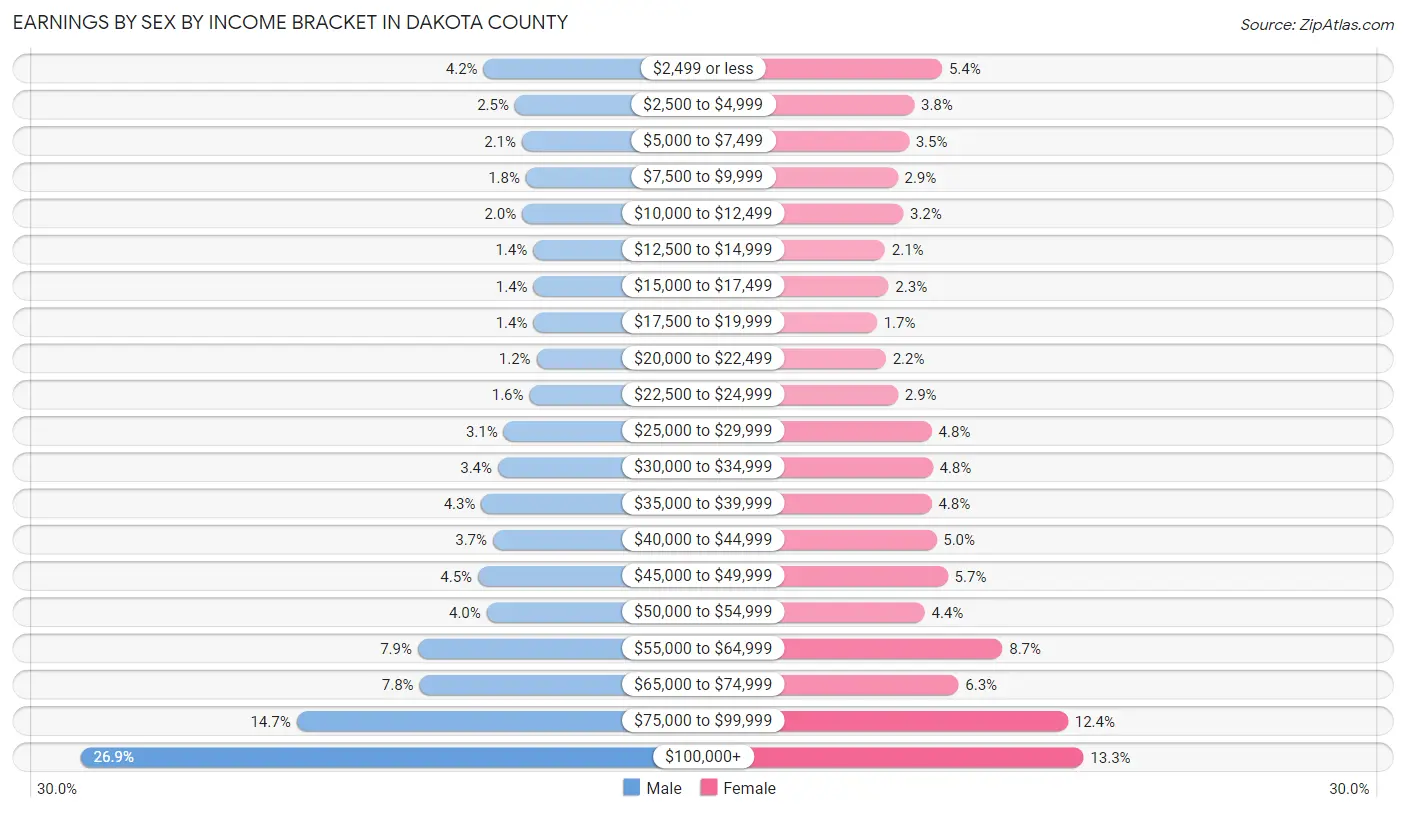
| Income | Male | Female |
| $2,499 or less | 5,674 (4.2%) | 6,657 (5.3%) |
| $2,500 to $4,999 | 3,302 (2.5%) | 4,703 (3.8%) |
| $5,000 to $7,499 | 2,760 (2.1%) | 4,335 (3.5%) |
| $7,500 to $9,999 | 2,463 (1.8%) | 3,554 (2.9%) |
| $10,000 to $12,499 | 2,756 (2.0%) | 3,938 (3.2%) |
| $12,500 to $14,999 | 1,915 (1.4%) | 2,661 (2.1%) |
| $15,000 to $17,499 | 1,893 (1.4%) | 2,913 (2.3%) |
| $17,500 to $19,999 | 1,902 (1.4%) | 2,097 (1.7%) |
| $20,000 to $22,499 | 1,665 (1.2%) | 2,722 (2.2%) |
| $22,500 to $24,999 | 2,197 (1.6%) | 3,567 (2.9%) |
| $25,000 to $29,999 | 4,158 (3.1%) | 5,942 (4.8%) |
| $30,000 to $34,999 | 4,583 (3.4%) | 5,999 (4.8%) |
| $35,000 to $39,999 | 5,841 (4.3%) | 5,923 (4.8%) |
| $40,000 to $44,999 | 4,968 (3.7%) | 6,260 (5.0%) |
| $45,000 to $49,999 | 6,091 (4.5%) | 7,061 (5.7%) |
| $50,000 to $54,999 | 5,441 (4.0%) | 5,441 (4.4%) |
| $55,000 to $64,999 | 10,655 (7.9%) | 10,881 (8.7%) |
| $65,000 to $74,999 | 10,529 (7.8%) | 7,810 (6.3%) |
| $75,000 to $99,999 | 19,844 (14.7%) | 15,465 (12.4%) |
| $100,000+ | 36,214 (26.9%) | 16,555 (13.3%) |
| Total | 134,851 (100.0%) | 124,484 (100.0%) |
Earnings by Sex by Educational Attainment in Dakota County
Average earnings in Dakota County are $71,995 for men and $51,546 for women, a difference of 28.4%. Men with an educational attainment of graduate degree enjoy the highest average annual earnings of $106,199, while those with less than high school education earn the least with $39,746. Women with an educational attainment of graduate degree earn the most with the average annual earnings of $84,626, while those with less than high school education have the smallest earnings of $22,571.
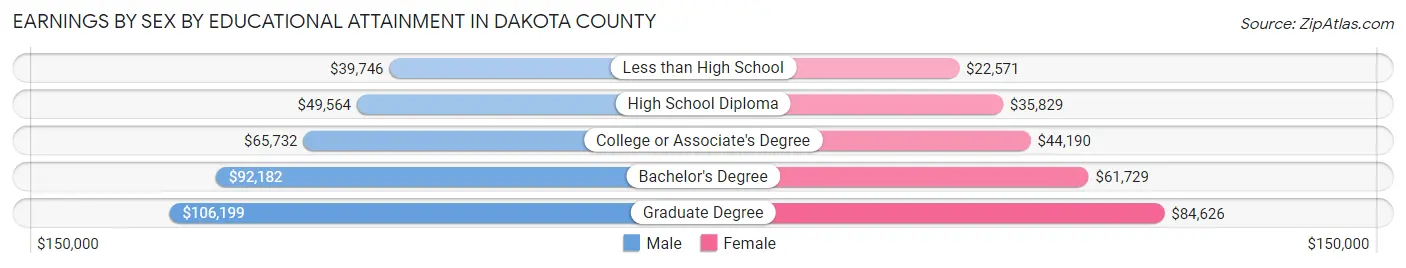
| Educational Attainment | Male Income | Female Income |
| Less than High School | $39,746 | $22,571 |
| High School Diploma | $49,564 | $35,829 |
| College or Associate's Degree | $65,732 | $44,190 |
| Bachelor's Degree | $92,182 | $61,729 |
| Graduate Degree | $106,199 | $84,626 |
| Total | $71,995 | $51,546 |
Family Income in Dakota County
Family Income Brackets in Dakota County
According to the Dakota County family income data, there are 29,953 families falling into the $100,000 to $149,999 income range, which is the most common income bracket and makes up 25.8% of all families. Conversely, the $10,000 to $14,999 income bracket is the least frequent group with only 697 families (0.6%) belonging to this category.
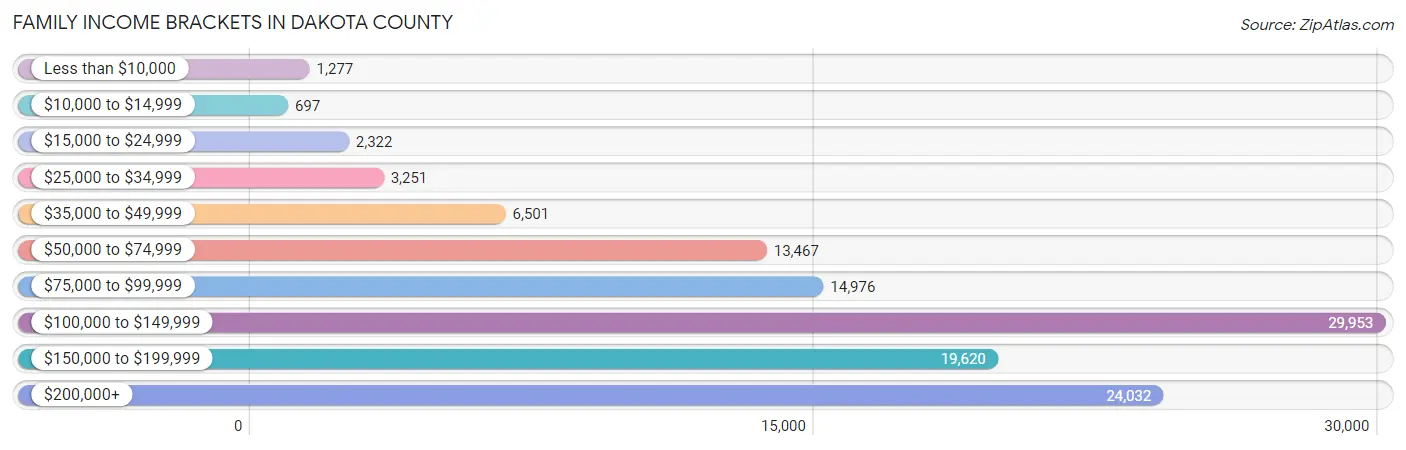
| Income Bracket | # Families | % Families |
| Less than $10,000 | 1,277 | 1.1% |
| $10,000 to $14,999 | 697 | 0.6% |
| $15,000 to $24,999 | 2,322 | 2.0% |
| $25,000 to $34,999 | 3,251 | 2.8% |
| $35,000 to $49,999 | 6,501 | 5.6% |
| $50,000 to $74,999 | 13,467 | 11.6% |
| $75,000 to $99,999 | 14,976 | 12.9% |
| $100,000 to $149,999 | 29,953 | 25.8% |
| $150,000 to $199,999 | 19,620 | 16.9% |
| $200,000+ | 24,032 | 20.7% |
Family Income by Famaliy Size in Dakota County
4-person families (24,181 | 20.8%) account for the highest median family income in Dakota County with $150,661 per family, while 2-person families (53,069 | 45.7%) have the highest median income of $53,994 per family member.
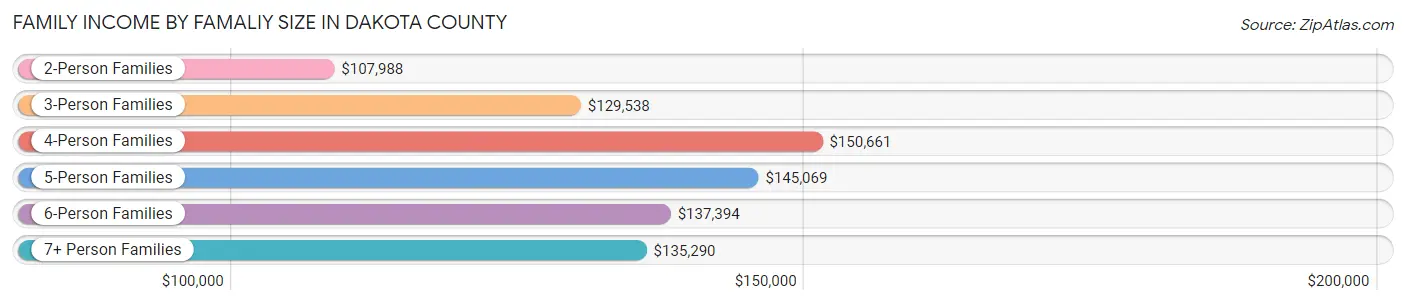
| Income Bracket | # Families | Median Income |
| 2-Person Families | 53,069 (45.7%) | $107,988 |
| 3-Person Families | 24,346 (21.0%) | $129,538 |
| 4-Person Families | 24,181 (20.8%) | $150,661 |
| 5-Person Families | 9,915 (8.5%) | $145,069 |
| 6-Person Families | 3,134 (2.7%) | $137,394 |
| 7+ Person Families | 1,451 (1.3%) | $135,290 |
| Total | 116,096 (100.0%) | $124,610 |
Family Income by Number of Earners in Dakota County
The median family income in Dakota County is $124,610, with families comprising 3+ earners (17,788) having the highest median family income of $176,296, while families with no earners (13,390) have the lowest median family income of $74,328, accounting for 15.3% and 11.5% of families, respectively.
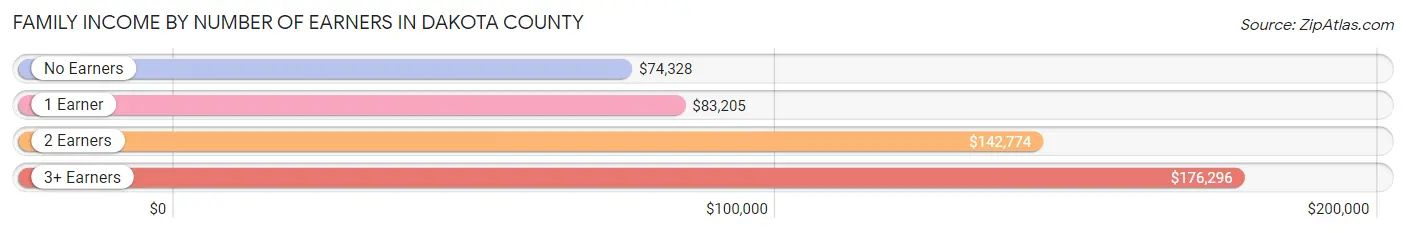
| Number of Earners | # Families | Median Income |
| No Earners | 13,390 (11.5%) | $74,328 |
| 1 Earner | 28,260 (24.3%) | $83,205 |
| 2 Earners | 56,658 (48.8%) | $142,774 |
| 3+ Earners | 17,788 (15.3%) | $176,296 |
| Total | 116,096 (100.0%) | $124,610 |
Household Income in Dakota County
Household Income Brackets in Dakota County
With 37,438 households falling in the category, the $100,000 to $149,999 income range is the most frequent in Dakota County, accounting for 22.1% of all households. In contrast, only 2,372 households (1.4%) fall into the $10,000 to $14,999 income bracket, making it the least populous group.
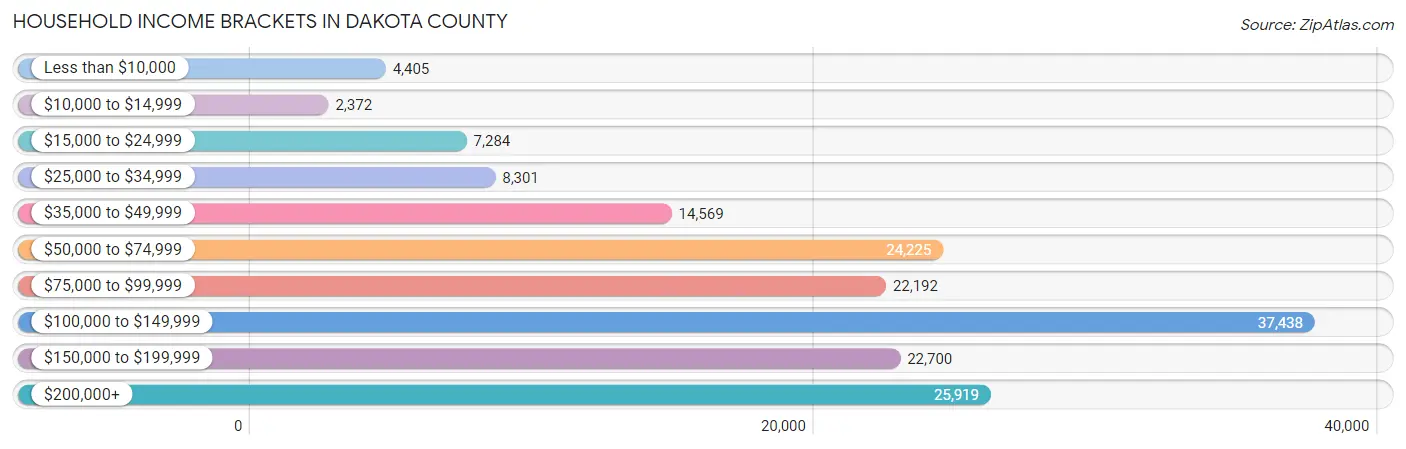
| Income Bracket | # Households | % Households |
| Less than $10,000 | 4,405 | 2.6% |
| $10,000 to $14,999 | 2,372 | 1.4% |
| $15,000 to $24,999 | 7,284 | 4.3% |
| $25,000 to $34,999 | 8,301 | 4.9% |
| $35,000 to $49,999 | 14,569 | 8.6% |
| $50,000 to $74,999 | 24,225 | 14.3% |
| $75,000 to $99,999 | 22,192 | 13.1% |
| $100,000 to $149,999 | 37,438 | 22.1% |
| $150,000 to $199,999 | 22,700 | 13.4% |
| $200,000+ | 25,919 | 15.3% |
Household Income by Householder Age in Dakota County
The median household income in Dakota County is $101,360, with the highest median household income of $126,253 found in the 45 to 64 years age bracket for the primary householder. A total of 65,784 households (38.8%) fall into this category. Meanwhile, the 65+ years age bracket for the primary householder has the lowest median household income of $64,353, with 41,546 households (24.5%) in this group.
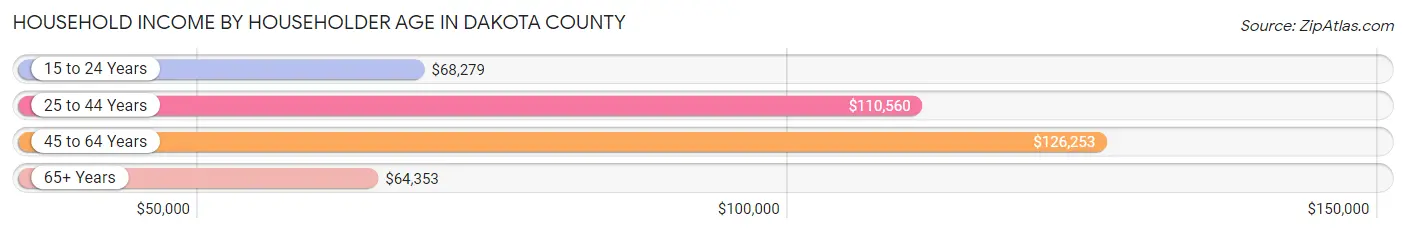
| Income Bracket | # Households | Median Income |
| 15 to 24 Years | 5,221 (3.1%) | $68,279 |
| 25 to 44 Years | 56,853 (33.6%) | $110,560 |
| 45 to 64 Years | 65,784 (38.8%) | $126,253 |
| 65+ Years | 41,546 (24.5%) | $64,353 |
| Total | 169,404 (100.0%) | $101,360 |
Poverty in Dakota County
Income Below Poverty by Sex and Age in Dakota County
With 5.0% poverty level for males and 6.3% for females among the residents of Dakota County, 15 year old males and 18 to 24 year old females are the most vulnerable to poverty, with 526 males (14.4%) and 1,690 females (9.9%) in their respective age groups living below the poverty level.
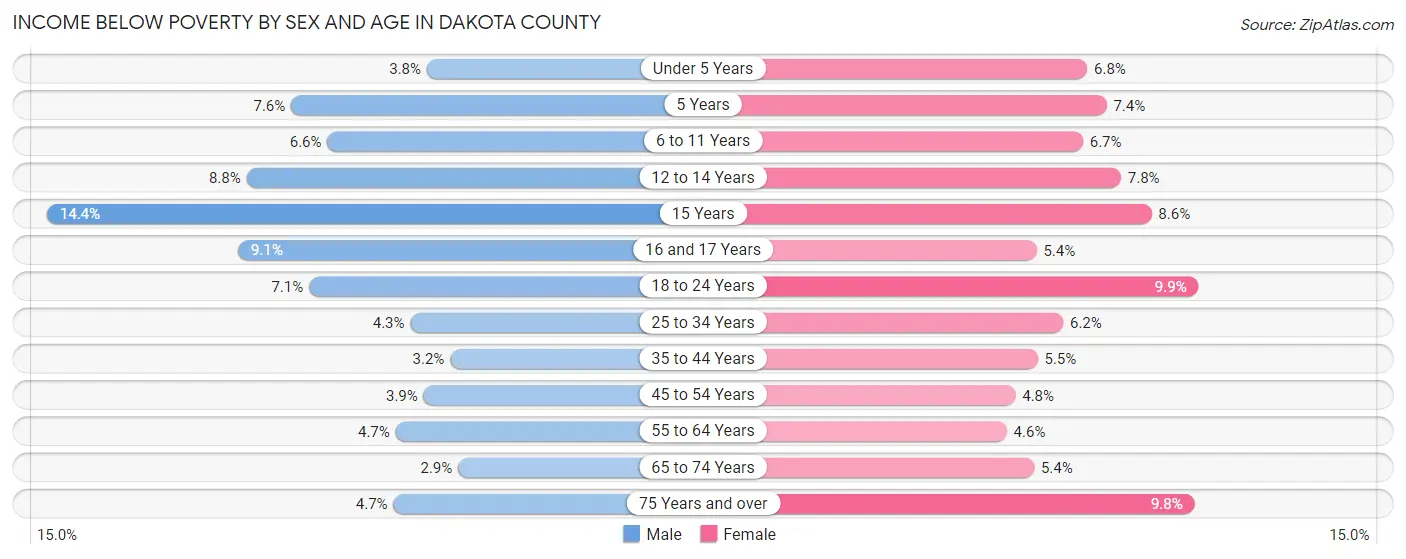
| Age Bracket | Male | Female |
| Under 5 Years | 513 (3.8%) | 888 (6.8%) |
| 5 Years | 244 (7.6%) | 175 (7.4%) |
| 6 to 11 Years | 1,192 (6.6%) | 1,183 (6.7%) |
| 12 to 14 Years | 797 (8.8%) | 676 (7.8%) |
| 15 Years | 526 (14.4%) | 271 (8.6%) |
| 16 and 17 Years | 532 (9.1%) | 321 (5.4%) |
| 18 to 24 Years | 1,283 (7.1%) | 1,690 (9.9%) |
| 25 to 34 Years | 1,208 (4.3%) | 1,703 (6.2%) |
| 35 to 44 Years | 973 (3.2%) | 1,650 (5.4%) |
| 45 to 54 Years | 1,094 (3.9%) | 1,347 (4.8%) |
| 55 to 64 Years | 1,358 (4.7%) | 1,378 (4.6%) |
| 65 to 74 Years | 536 (2.9%) | 1,121 (5.3%) |
| 75 Years and over | 488 (4.7%) | 1,453 (9.8%) |
| Total | 10,744 (5.0%) | 13,856 (6.3%) |
Income Above Poverty by Sex and Age in Dakota County
According to the poverty statistics in Dakota County, males aged 65 to 74 years and females aged 55 to 64 years are the age groups that are most secure financially, with 97.1% of males and 95.4% of females in these age groups living above the poverty line.
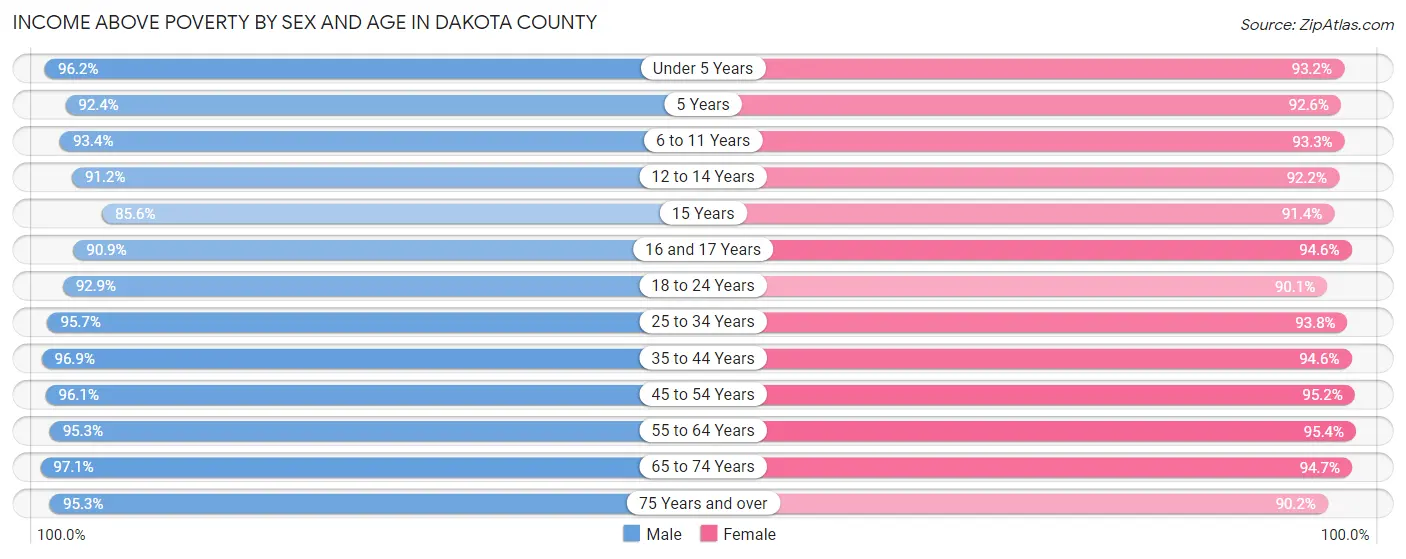
| Age Bracket | Male | Female |
| Under 5 Years | 13,004 (96.2%) | 12,107 (93.2%) |
| 5 Years | 2,975 (92.4%) | 2,201 (92.6%) |
| 6 to 11 Years | 16,952 (93.4%) | 16,451 (93.3%) |
| 12 to 14 Years | 8,237 (91.2%) | 8,026 (92.2%) |
| 15 Years | 3,132 (85.6%) | 2,873 (91.4%) |
| 16 and 17 Years | 5,340 (90.9%) | 5,598 (94.6%) |
| 18 to 24 Years | 16,846 (92.9%) | 15,334 (90.1%) |
| 25 to 34 Years | 27,146 (95.7%) | 25,949 (93.8%) |
| 35 to 44 Years | 29,885 (96.9%) | 28,650 (94.6%) |
| 45 to 54 Years | 27,035 (96.1%) | 26,542 (95.2%) |
| 55 to 64 Years | 27,714 (95.3%) | 28,656 (95.4%) |
| 65 to 74 Years | 17,775 (97.1%) | 19,819 (94.7%) |
| 75 Years and over | 9,823 (95.3%) | 13,337 (90.2%) |
| Total | 205,864 (95.0%) | 205,543 (93.7%) |
Income Below Poverty Among Married-Couple Families in Dakota County
The poverty statistics for married-couple families in Dakota County show that 1.5% or 1,439 of the total 92,748 families live below the poverty line. Families with 5 or more children have the highest poverty rate of 12.1%, comprising of 81 families. On the other hand, families with no children have the lowest poverty rate of 1.2%, which includes 616 families.
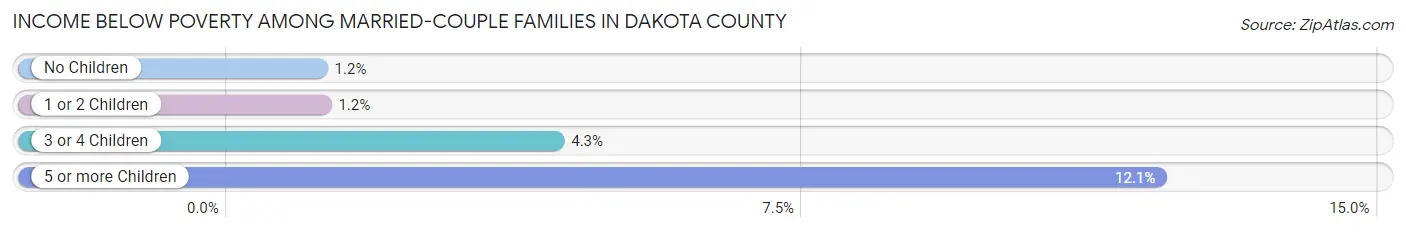
| Children | Above Poverty | Below Poverty |
| No Children | 51,953 (98.8%) | 616 (1.2%) |
| 1 or 2 Children | 30,565 (98.8%) | 377 (1.2%) |
| 3 or 4 Children | 8,204 (95.7%) | 365 (4.3%) |
| 5 or more Children | 587 (87.9%) | 81 (12.1%) |
| Total | 91,309 (98.5%) | 1,439 (1.5%) |
Income Below Poverty Among Single-Parent Households in Dakota County
According to the poverty data in Dakota County, 5.3% or 392 single-father households and 13.0% or 2,067 single-mother households are living below the poverty line. Among single-father households, those with 3 or 4 children have the highest poverty rate, with 128 households (15.0%) experiencing poverty. Likewise, among single-mother households, those with 5 or more children have the highest poverty rate, with 46 households (100.0%) falling below the poverty line.
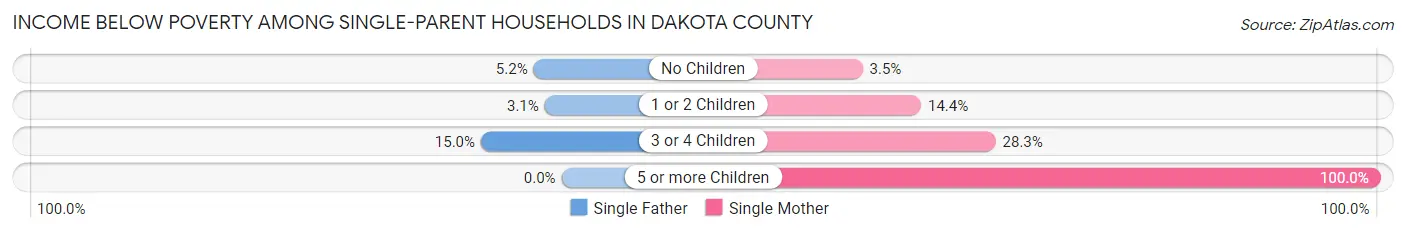
| Children | Single Father | Single Mother |
| No Children | 145 (5.2%) | 168 (3.5%) |
| 1 or 2 Children | 119 (3.1%) | 1,338 (14.4%) |
| 3 or 4 Children | 128 (15.0%) | 515 (28.3%) |
| 5 or more Children | 0 (0.0%) | 46 (100.0%) |
| Total | 392 (5.3%) | 2,067 (13.0%) |
Income Below Poverty Among Married-Couple vs Single-Parent Households in Dakota County
The poverty data for Dakota County shows that 1,439 of the married-couple family households (1.5%) and 2,459 of the single-parent households (10.5%) are living below the poverty level. Within the married-couple family households, those with 5 or more children have the highest poverty rate, with 81 households (12.1%) falling below the poverty line. Among the single-parent households, those with 5 or more children have the highest poverty rate, with 46 household (82.1%) living below poverty.
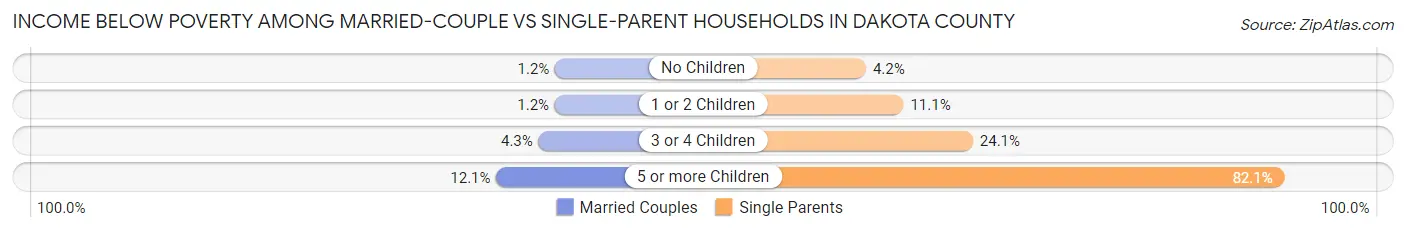
| Children | Married-Couple Families | Single-Parent Households |
| No Children | 616 (1.2%) | 313 (4.2%) |
| 1 or 2 Children | 377 (1.2%) | 1,457 (11.1%) |
| 3 or 4 Children | 365 (4.3%) | 643 (24.1%) |
| 5 or more Children | 81 (12.1%) | 46 (82.1%) |
| Total | 1,439 (1.5%) | 2,459 (10.5%) |
Race in Dakota County
The most populous races in Dakota County are White / Caucasian (342,633 | 78.0%), Hispanic or Latino (33,779 | 7.7%), and Black / African American (31,094 | 7.1%).
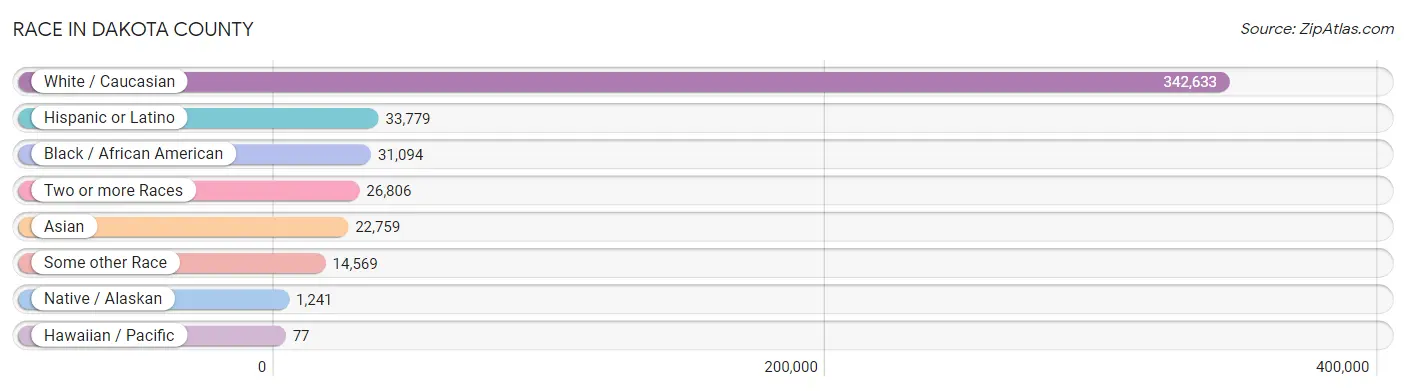
| Race | # Population | % Population |
| Asian | 22,759 | 5.2% |
| Black / African American | 31,094 | 7.1% |
| Hawaiian / Pacific | 77 | 0.0% |
| Hispanic or Latino | 33,779 | 7.7% |
| Native / Alaskan | 1,241 | 0.3% |
| White / Caucasian | 342,633 | 78.0% |
| Two or more Races | 26,806 | 6.1% |
| Some other Race | 14,569 | 3.3% |
| Total | 439,179 | 100.0% |
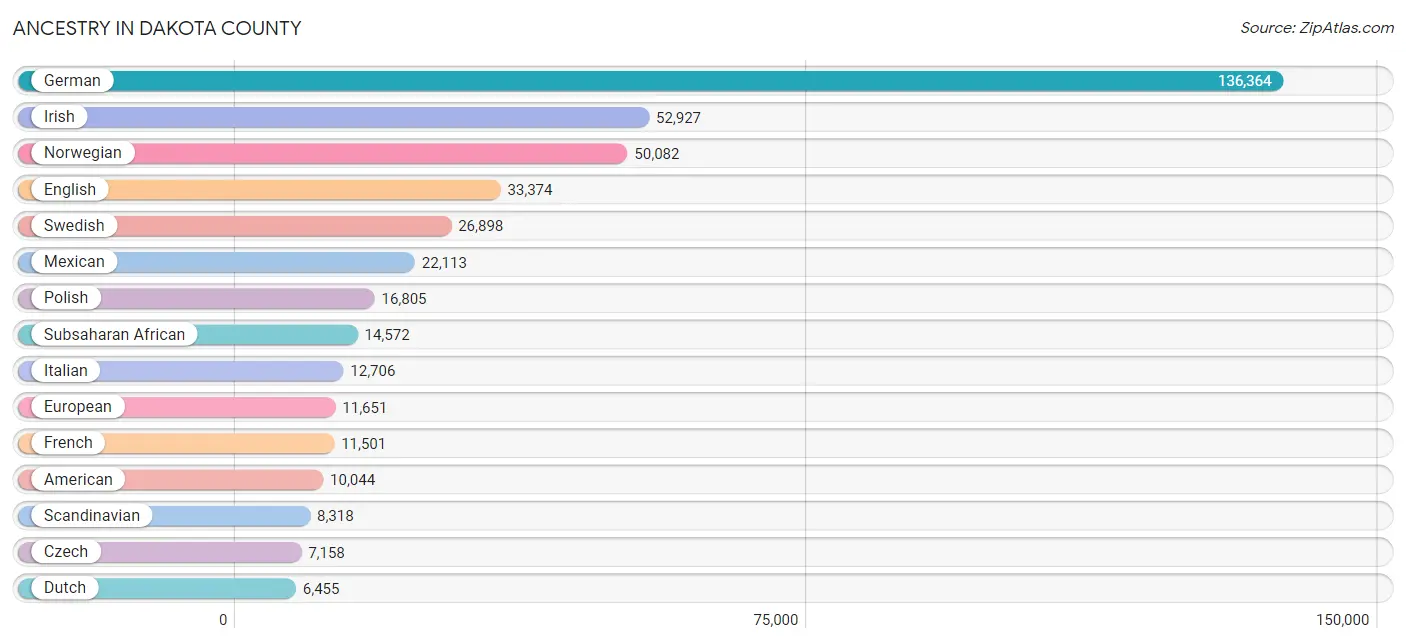
Ancestry in Dakota County
The most populous ancestries reported in Dakota County are German (136,364 | 31.0%), Irish (52,927 | 12.0%), Norwegian (50,082 | 11.4%), English (33,374 | 7.6%), and Swedish (26,898 | 6.1%), together accounting for 68.2% of all Dakota County residents.
| Ancestry | # Population | % Population |
| Afghan | 440 | 0.1% |
| African | 3,518 | 0.8% |
| Alaska Native | 6 | 0.0% |
| Aleut | 45 | 0.0% |
| Alsatian | 2 | 0.0% |
| American | 10,044 | 2.3% |
| Apache | 3 | 0.0% |
| Arab | 2,221 | 0.5% |
| Argentinean | 75 | 0.0% |
| Armenian | 92 | 0.0% |
| Australian | 110 | 0.0% |
| Austrian | 1,581 | 0.4% |
| Bahamian | 44 | 0.0% |
| Bangladeshi | 1,998 | 0.4% |
| Basque | 14 | 0.0% |
| Belgian | 650 | 0.2% |
| Bhutanese | 1,423 | 0.3% |
| Blackfeet | 159 | 0.0% |
| Brazilian | 212 | 0.1% |
| British | 1,907 | 0.4% |
| Bulgarian | 54 | 0.0% |
| Burmese | 2,829 | 0.6% |
| Cajun | 13 | 0.0% |
| Canadian | 417 | 0.1% |
| Carpatho Rusyn | 33 | 0.0% |
| Celtic | 96 | 0.0% |
| Central American | 3,680 | 0.8% |
| Central American Indian | 284 | 0.1% |
| Cherokee | 565 | 0.1% |
| Cheyenne | 2 | 0.0% |
| Chickasaw | 11 | 0.0% |
| Chilean | 61 | 0.0% |
| Chippewa | 1,355 | 0.3% |
| Choctaw | 31 | 0.0% |
| Colombian | 535 | 0.1% |
| Costa Rican | 34 | 0.0% |
| Cree | 60 | 0.0% |
| Creek | 26 | 0.0% |
| Croatian | 613 | 0.1% |
| Cuban | 850 | 0.2% |
| Czech | 7,158 | 1.6% |
| Czechoslovakian | 981 | 0.2% |
| Danish | 5,482 | 1.3% |
| Delaware | 3 | 0.0% |
| Dominican | 977 | 0.2% |
| Dutch | 6,455 | 1.5% |
| Eastern European | 1,384 | 0.3% |
| Ecuadorian | 908 | 0.2% |
| Egyptian | 288 | 0.1% |
| English | 33,374 | 7.6% |
| Estonian | 67 | 0.0% |
| Ethiopian | 2,790 | 0.6% |
| European | 11,651 | 2.6% |
| Filipino | 158 | 0.0% |
| Finnish | 4,397 | 1.0% |
| French | 11,501 | 2.6% |
| French American Indian | 64 | 0.0% |
| French Canadian | 3,336 | 0.8% |
| German | 136,364 | 31.0% |
| German Russian | 27 | 0.0% |
| Ghanaian | 113 | 0.0% |
| Greek | 1,028 | 0.2% |
| Guamanian / Chamorro | 50 | 0.0% |
| Guatemalan | 583 | 0.1% |
| Guyanese | 554 | 0.1% |
| Haitian | 323 | 0.1% |
| Honduran | 615 | 0.1% |
| Hungarian | 1,247 | 0.3% |
| Icelander | 229 | 0.1% |
| Indian (Asian) | 3,043 | 0.7% |
| Indonesian | 227 | 0.1% |
| Iranian | 434 | 0.1% |
| Iraqi | 54 | 0.0% |
| Irish | 52,927 | 12.0% |
| Iroquois | 113 | 0.0% |
| Italian | 12,706 | 2.9% |
| Jamaican | 186 | 0.0% |
| Japanese | 2,354 | 0.5% |
| Jordanian | 19 | 0.0% |
| Kenyan | 838 | 0.2% |
| Korean | 3,681 | 0.8% |
| Laotian | 27 | 0.0% |
| Latvian | 76 | 0.0% |
| Lebanese | 1,056 | 0.2% |
| Liberian | 496 | 0.1% |
| Lithuanian | 434 | 0.1% |
| Luxembourger | 339 | 0.1% |
| Malaysian | 1,216 | 0.3% |
| Mexican | 22,113 | 5.0% |
| Mexican American Indian | 180 | 0.0% |
| Mongolian | 51 | 0.0% |
| Moroccan | 46 | 0.0% |
| Native Hawaiian | 347 | 0.1% |
| Navajo | 30 | 0.0% |
| New Zealander | 87 | 0.0% |
| Nicaraguan | 315 | 0.1% |
| Nigerian | 927 | 0.2% |
| Northern European | 1,212 | 0.3% |
| Norwegian | 50,082 | 11.4% |
| Pakistani | 345 | 0.1% |
| Palestinian | 74 | 0.0% |
| Panamanian | 94 | 0.0% |
| Paraguayan | 18 | 0.0% |
| Pennsylvania German | 50 | 0.0% |
| Peruvian | 229 | 0.1% |
| Pima | 3 | 0.0% |
| Polish | 16,805 | 3.8% |
| Portuguese | 290 | 0.1% |
| Potawatomi | 28 | 0.0% |
| Puerto Rican | 2,018 | 0.5% |
| Puget Sound Salish | 218 | 0.1% |
| Romanian | 571 | 0.1% |
| Russian | 3,344 | 0.8% |
| Salvadoran | 2,039 | 0.5% |
| Samoan | 59 | 0.0% |
| Scandinavian | 8,318 | 1.9% |
| Scotch-Irish | 2,338 | 0.5% |
| Scottish | 4,505 | 1.0% |
| Seminole | 4 | 0.0% |
| Serbian | 225 | 0.1% |
| Sierra Leonean | 63 | 0.0% |
| Sioux | 496 | 0.1% |
| Slavic | 269 | 0.1% |
| Slovak | 705 | 0.2% |
| Slovene | 354 | 0.1% |
| Somali | 4,826 | 1.1% |
| South African | 46 | 0.0% |
| South American | 2,249 | 0.5% |
| South American Indian | 79 | 0.0% |
| Soviet Union | 12 | 0.0% |
| Spaniard | 654 | 0.2% |
| Spanish | 407 | 0.1% |
| Sri Lankan | 3,695 | 0.8% |
| Subsaharan African | 14,572 | 3.3% |
| Sudanese | 325 | 0.1% |
| Swedish | 26,898 | 6.1% |
| Swiss | 1,506 | 0.3% |
| Syrian | 113 | 0.0% |
| Thai | 6,267 | 1.4% |
| Tongan | 34 | 0.0% |
| Trinidadian and Tobagonian | 42 | 0.0% |
| Turkish | 140 | 0.0% |
| Ugandan | 20 | 0.0% |
| Ukrainian | 1,404 | 0.3% |
| Venezuelan | 423 | 0.1% |
| Vietnamese | 230 | 0.1% |
| Welsh | 1,867 | 0.4% |
| West Indian | 135 | 0.0% |
| Yugoslavian | 90 | 0.0% | View All 149 Rows |
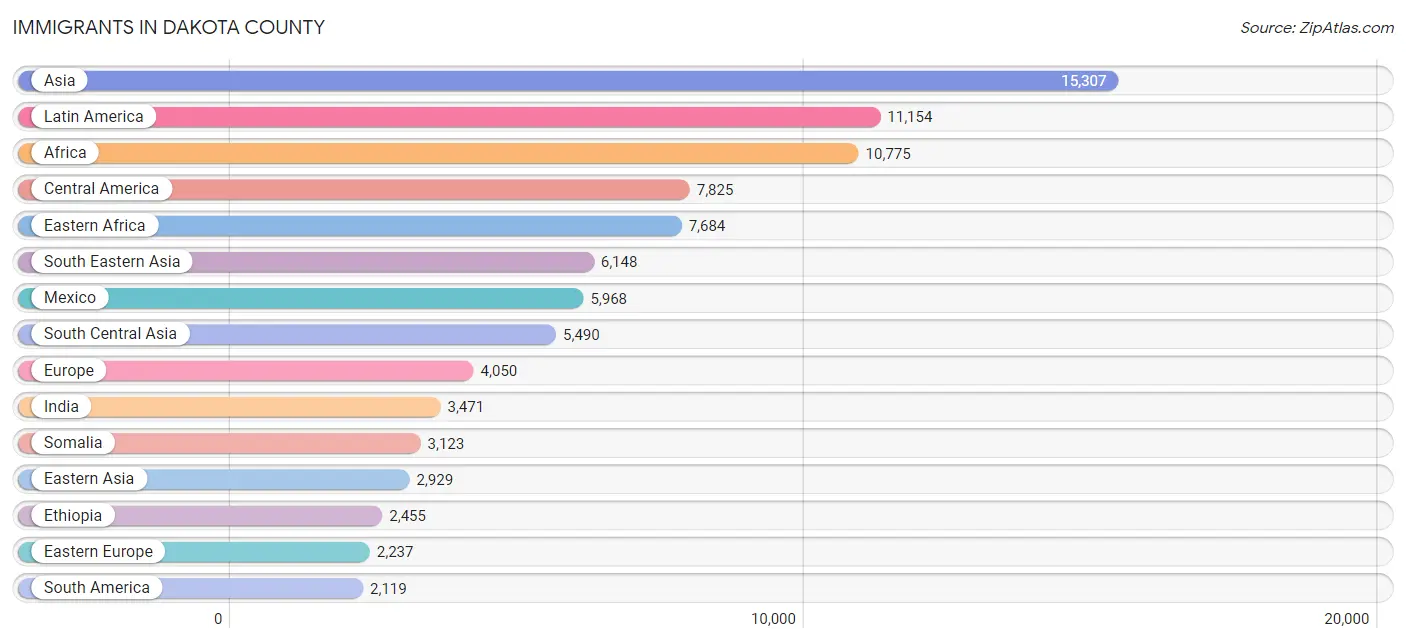
Immigrants in Dakota County
The most numerous immigrant groups reported in Dakota County came from Asia (15,307 | 3.5%), Latin America (11,154 | 2.5%), Africa (10,775 | 2.5%), Central America (7,825 | 1.8%), and Eastern Africa (7,684 | 1.8%), together accounting for 12.0% of all Dakota County residents.
| Immigration Origin | # Population | % Population |
| Afghanistan | 336 | 0.1% |
| Africa | 10,775 | 2.5% |
| Argentina | 61 | 0.0% |
| Asia | 15,307 | 3.5% |
| Australia | 77 | 0.0% |
| Austria | 37 | 0.0% |
| Bahamas | 8 | 0.0% |
| Bangladesh | 246 | 0.1% |
| Belarus | 200 | 0.1% |
| Belgium | 6 | 0.0% |
| Bosnia and Herzegovina | 56 | 0.0% |
| Brazil | 254 | 0.1% |
| Bulgaria | 19 | 0.0% |
| Cambodia | 704 | 0.2% |
| Cameroon | 326 | 0.1% |
| Canada | 875 | 0.2% |
| Caribbean | 1,210 | 0.3% |
| Central America | 7,825 | 1.8% |
| Chile | 16 | 0.0% |
| China | 1,302 | 0.3% |
| Colombia | 360 | 0.1% |
| Costa Rica | 19 | 0.0% |
| Cuba | 289 | 0.1% |
| Czechoslovakia | 56 | 0.0% |
| Denmark | 16 | 0.0% |
| Dominican Republic | 428 | 0.1% |
| Eastern Africa | 7,684 | 1.8% |
| Eastern Asia | 2,929 | 0.7% |
| Eastern Europe | 2,237 | 0.5% |
| Ecuador | 635 | 0.1% |
| Egypt | 185 | 0.0% |
| El Salvador | 1,042 | 0.2% |
| England | 149 | 0.0% |
| Eritrea | 508 | 0.1% |
| Ethiopia | 2,455 | 0.6% |
| Europe | 4,050 | 0.9% |
| France | 131 | 0.0% |
| Germany | 666 | 0.2% |
| Ghana | 240 | 0.1% |
| Greece | 46 | 0.0% |
| Guatemala | 290 | 0.1% |
| Guyana | 361 | 0.1% |
| Haiti | 254 | 0.1% |
| Honduras | 417 | 0.1% |
| Hong Kong | 135 | 0.0% |
| Hungary | 25 | 0.0% |
| India | 3,471 | 0.8% |
| Indonesia | 59 | 0.0% |
| Iran | 301 | 0.1% |
| Iraq | 86 | 0.0% |
| Ireland | 90 | 0.0% |
| Israel | 12 | 0.0% |
| Italy | 109 | 0.0% |
| Jamaica | 116 | 0.0% |
| Japan | 331 | 0.1% |
| Jordan | 49 | 0.0% |
| Kazakhstan | 242 | 0.1% |
| Kenya | 1,172 | 0.3% |
| Korea | 1,296 | 0.3% |
| Kuwait | 248 | 0.1% |
| Laos | 810 | 0.2% |
| Latin America | 11,154 | 2.5% |
| Latvia | 43 | 0.0% |
| Lebanon | 80 | 0.0% |
| Liberia | 374 | 0.1% |
| Lithuania | 2 | 0.0% |
| Malaysia | 74 | 0.0% |
| Mexico | 5,968 | 1.4% |
| Middle Africa | 358 | 0.1% |
| Moldova | 37 | 0.0% |
| Morocco | 55 | 0.0% |
| Nepal | 317 | 0.1% |
| Netherlands | 43 | 0.0% |
| Nicaragua | 45 | 0.0% |
| Nigeria | 779 | 0.2% |
| Northern Africa | 296 | 0.1% |
| Northern Europe | 754 | 0.2% |
| Norway | 28 | 0.0% |
| Oceania | 164 | 0.0% |
| Pakistan | 383 | 0.1% |
| Panama | 44 | 0.0% |
| Peru | 156 | 0.0% |
| Philippines | 1,381 | 0.3% |
| Poland | 164 | 0.0% |
| Romania | 196 | 0.0% |
| Russia | 593 | 0.1% |
| Saudi Arabia | 63 | 0.0% |
| Scotland | 45 | 0.0% |
| Sierra Leone | 99 | 0.0% |
| Singapore | 17 | 0.0% |
| Somalia | 3,123 | 0.7% |
| South Africa | 158 | 0.0% |
| South America | 2,119 | 0.5% |
| South Central Asia | 5,490 | 1.3% |
| South Eastern Asia | 6,148 | 1.4% |
| Southern Europe | 176 | 0.0% |
| Spain | 21 | 0.0% |
| Sri Lanka | 71 | 0.0% |
| Sudan | 19 | 0.0% |
| Sweden | 23 | 0.0% |
| Syria | 69 | 0.0% |
| Taiwan | 193 | 0.0% |
| Thailand | 595 | 0.1% |
| Trinidad and Tobago | 115 | 0.0% |
| Turkey | 100 | 0.0% |
| Uganda | 142 | 0.0% |
| Ukraine | 729 | 0.2% |
| Uzbekistan | 65 | 0.0% |
| Venezuela | 276 | 0.1% |
| Vietnam | 1,943 | 0.4% |
| Western Africa | 2,089 | 0.5% |
| Western Asia | 740 | 0.2% |
| Western Europe | 883 | 0.2% |
| Zaire | 32 | 0.0% |
| Zimbabwe | 71 | 0.0% | View All 115 Rows |
Sex and Age in Dakota County
Sex and Age in Dakota County
The most populous age groups in Dakota County are 35 to 39 Years (16,315 | 7.5%) for men and 55 to 59 Years (16,168 | 7.3%) for women.
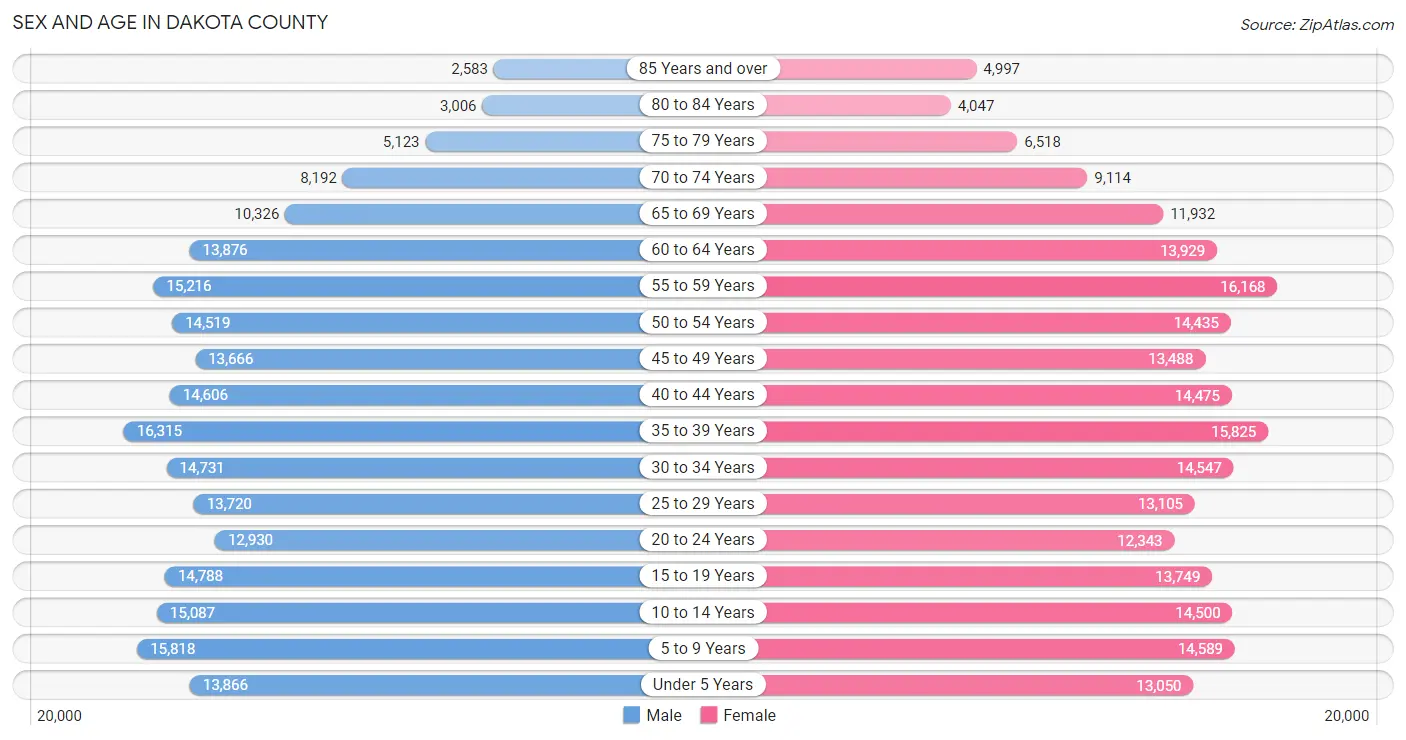
| Age Bracket | Male | Female |
| Under 5 Years | 13,866 (6.4%) | 13,050 (5.9%) |
| 5 to 9 Years | 15,818 (7.2%) | 14,589 (6.6%) |
| 10 to 14 Years | 15,087 (6.9%) | 14,500 (6.6%) |
| 15 to 19 Years | 14,788 (6.8%) | 13,749 (6.2%) |
| 20 to 24 Years | 12,930 (5.9%) | 12,343 (5.6%) |
| 25 to 29 Years | 13,720 (6.3%) | 13,105 (5.9%) |
| 30 to 34 Years | 14,731 (6.8%) | 14,547 (6.6%) |
| 35 to 39 Years | 16,315 (7.5%) | 15,825 (7.2%) |
| 40 to 44 Years | 14,606 (6.7%) | 14,475 (6.6%) |
| 45 to 49 Years | 13,666 (6.3%) | 13,488 (6.1%) |
| 50 to 54 Years | 14,519 (6.7%) | 14,435 (6.5%) |
| 55 to 59 Years | 15,216 (7.0%) | 16,168 (7.3%) |
| 60 to 64 Years | 13,876 (6.4%) | 13,929 (6.3%) |
| 65 to 69 Years | 10,326 (4.7%) | 11,932 (5.4%) |
| 70 to 74 Years | 8,192 (3.7%) | 9,114 (4.1%) |
| 75 to 79 Years | 5,123 (2.4%) | 6,518 (2.9%) |
| 80 to 84 Years | 3,006 (1.4%) | 4,047 (1.8%) |
| 85 Years and over | 2,583 (1.2%) | 4,997 (2.3%) |
| Total | 218,368 (100.0%) | 220,811 (100.0%) |
Families and Households in Dakota County
Median Family Size in Dakota County
The median family size in Dakota County is 3.11 persons per family, with married-couple families (92,748 | 79.9%) accounting for the largest median family size of 3.14 persons per family. On the other hand, single male/father families (7,432 | 6.4%) represent the smallest median family size with 2.79 persons per family.
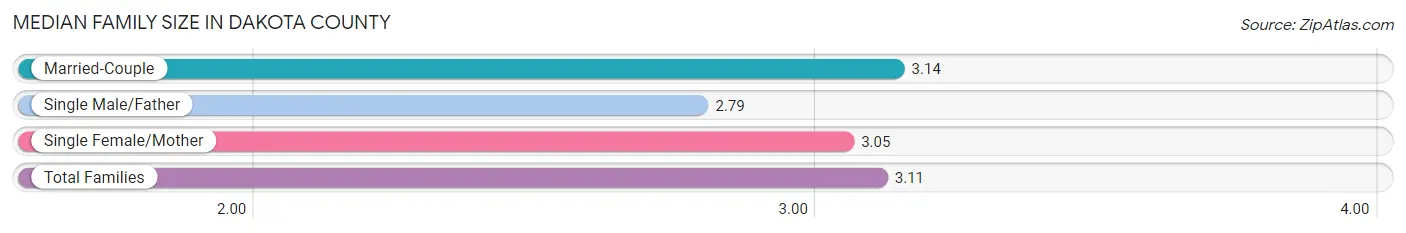
| Family Type | # Families | Family Size |
| Married-Couple | 92,748 (79.9%) | 3.14 |
| Single Male/Father | 7,432 (6.4%) | 2.79 |
| Single Female/Mother | 15,916 (13.7%) | 3.05 |
| Total Families | 116,096 (100.0%) | 3.11 |
Median Household Size in Dakota County
The median household size in Dakota County is 2.57 persons per household, with single female/mother households (15,916 | 9.4%) accounting for the largest median household size of 3.28 persons per household. non-family households (53,308 | 31.5%) represent the smallest median household size with 1.24 persons per household.
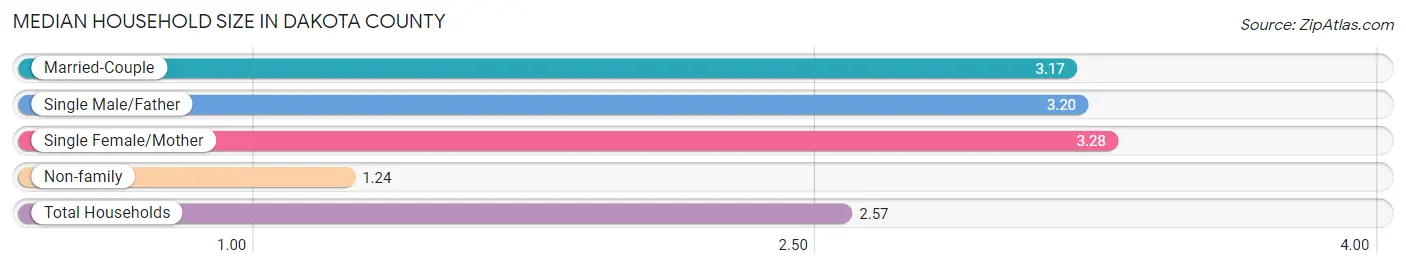
| Household Type | # Households | Household Size |
| Married-Couple | 92,748 (54.7%) | 3.17 |
| Single Male/Father | 7,432 (4.4%) | 3.20 |
| Single Female/Mother | 15,916 (9.4%) | 3.28 |
| Non-family | 53,308 (31.5%) | 1.24 |
| Total Households | 169,404 (100.0%) | 2.57 |
Household Size by Marriage Status in Dakota County
Out of a total of 169,404 households in Dakota County, 116,096 (68.5%) are family households, while 53,308 (31.5%) are nonfamily households. The most numerous type of family households are 2-person households, comprising 49,937, and the most common type of nonfamily households are 1-person households, comprising 42,462.
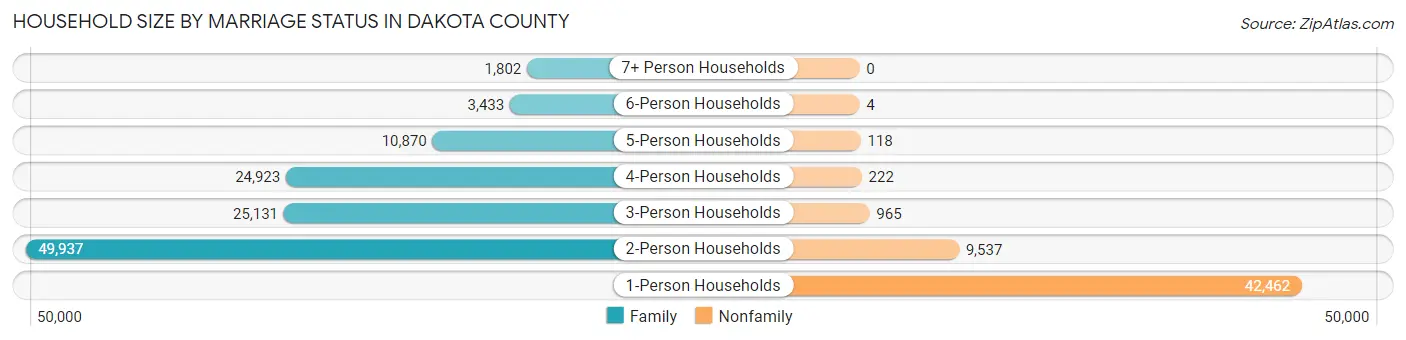
| Household Size | Family Households | Nonfamily Households |
| 1-Person Households | - | 42,462 (25.1%) |
| 2-Person Households | 49,937 (29.5%) | 9,537 (5.6%) |
| 3-Person Households | 25,131 (14.8%) | 965 (0.6%) |
| 4-Person Households | 24,923 (14.7%) | 222 (0.1%) |
| 5-Person Households | 10,870 (6.4%) | 118 (0.1%) |
| 6-Person Households | 3,433 (2.0%) | 4 (0.0%) |
| 7+ Person Households | 1,802 (1.1%) | 0 (0.0%) |
| Total | 116,096 (68.5%) | 53,308 (31.5%) |
Female Fertility in Dakota County
Fertility by Age in Dakota County
Average fertility rate in Dakota County is 61.0 births per 1,000 women. Women in the age bracket of 20 to 34 years have the highest fertility rate with 116.0 births per 1,000 women. Women in the age bracket of 20 to 34 years acount for 76.1% of all women with births.
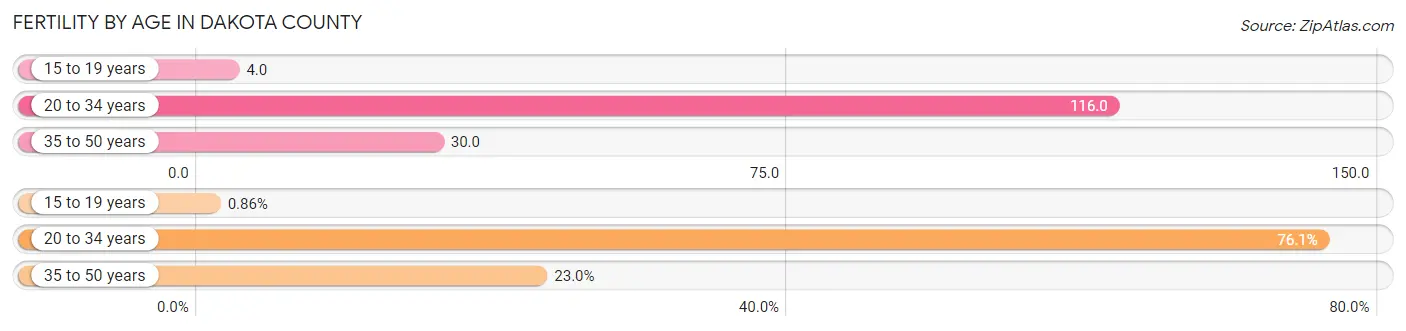
| Age Bracket | Women with Births | Births / 1,000 Women |
| 15 to 19 years | 52 (0.9%) | 4.0 |
| 20 to 34 years | 4,621 (76.1%) | 116.0 |
| 35 to 50 years | 1,398 (23.0%) | 30.0 |
| Total | 6,071 (100.0%) | 61.0 |
Fertility by Age by Marriage Status in Dakota County
77.4% of women with births (6,071) in Dakota County are married. The highest percentage of unmarried women with births falls into 15 to 19 years age bracket with 100.0% of them unmarried at the time of birth, while the lowest percentage of unmarried women with births belong to 35 to 50 years age bracket with 15.3% of them unmarried.
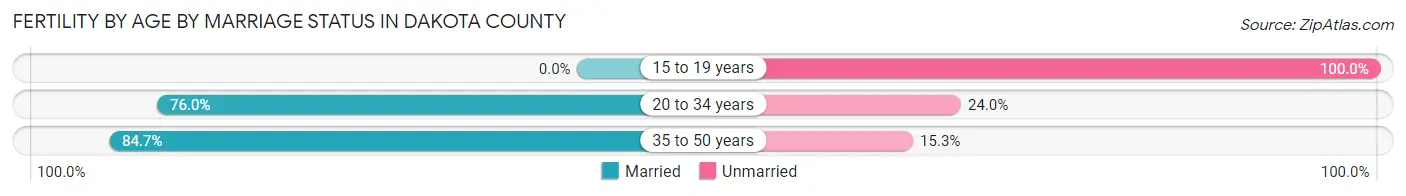
| Age Bracket | Married | Unmarried |
| 15 to 19 years | 0 (0.0%) | 52 (100.0%) |
| 20 to 34 years | 3,512 (76.0%) | 1,109 (24.0%) |
| 35 to 50 years | 1,184 (84.7%) | 214 (15.3%) |
| Total | 4,699 (77.4%) | 1,372 (22.6%) |
Fertility by Education in Dakota County
Average fertility rate in Dakota County is 61.0 births per 1,000 women. Women with the education attainment of graduate degree have the highest fertility rate of 73.0 births per 1,000 women, while women with the education attainment of less than high school have the lowest fertility at 31.0 births per 1,000 women. Women with the education attainment of bachelor's degree represent 34.7% of all women with births.
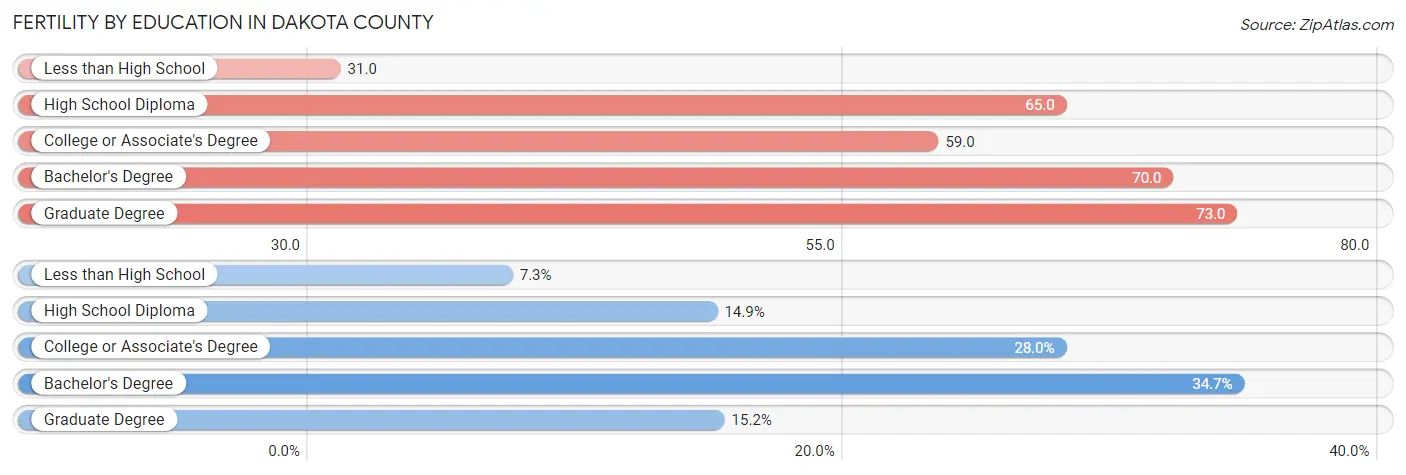
| Educational Attainment | Women with Births | Births / 1,000 Women |
| Less than High School | 440 (7.2%) | 31.0 |
| High School Diploma | 906 (14.9%) | 65.0 |
| College or Associate's Degree | 1,699 (28.0%) | 59.0 |
| Bachelor's Degree | 2,104 (34.7%) | 70.0 |
| Graduate Degree | 922 (15.2%) | 73.0 |
| Total | 6,071 (100.0%) | 61.0 |
Fertility by Education by Marriage Status in Dakota County
22.6% of women with births in Dakota County are unmarried. Women with the educational attainment of graduate degree are most likely to be married with 95.7% of them married at childbirth, while women with the educational attainment of high school diploma are least likely to be married with 47.9% of them unmarried at childbirth.
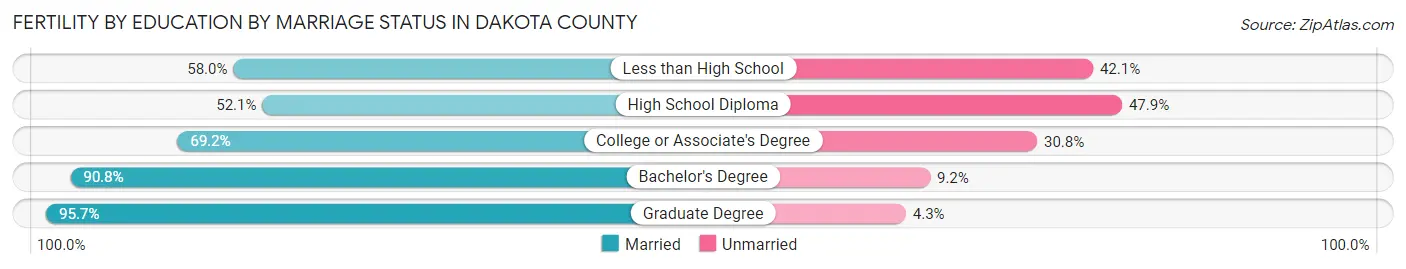
| Educational Attainment | Married | Unmarried |
| Less than High School | 255 (58.0%) | 185 (42.0%) |
| High School Diploma | 472 (52.1%) | 434 (47.9%) |
| College or Associate's Degree | 1,176 (69.2%) | 523 (30.8%) |
| Bachelor's Degree | 1,910 (90.8%) | 194 (9.2%) |
| Graduate Degree | 882 (95.7%) | 40 (4.3%) |
| Total | 4,699 (77.4%) | 1,372 (22.6%) |
Employment Characteristics in Dakota County
Employment by Class of Employer in Dakota County
Among the 235,955 employed individuals in Dakota County, private company employees (164,322 | 69.6%), not-for-profit organizations (23,395 | 9.9%), and local government employees (17,289 | 7.3%) make up the most common classes of employment.
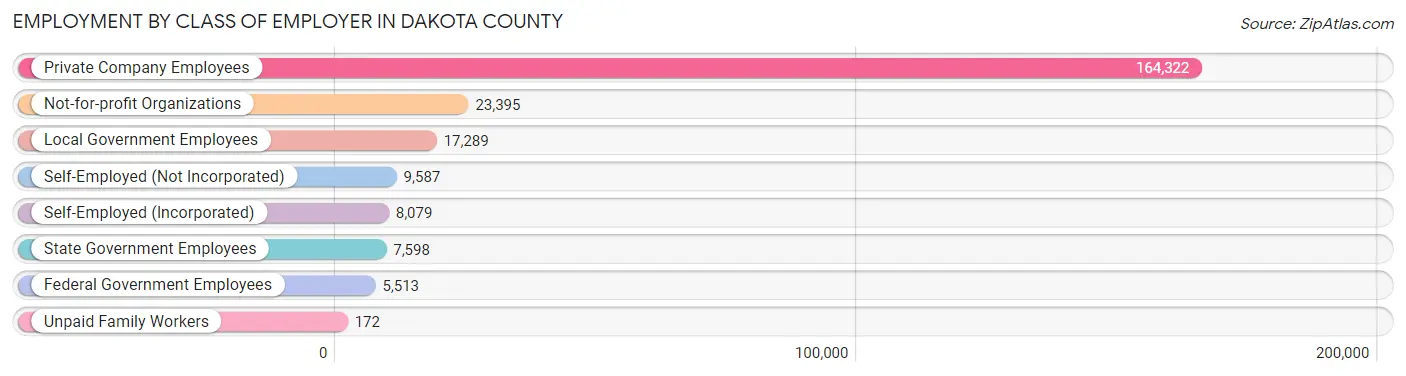
| Employer Class | # Employees | % Employees |
| Private Company Employees | 164,322 | 69.6% |
| Self-Employed (Incorporated) | 8,079 | 3.4% |
| Self-Employed (Not Incorporated) | 9,587 | 4.1% |
| Not-for-profit Organizations | 23,395 | 9.9% |
| Local Government Employees | 17,289 | 7.3% |
| State Government Employees | 7,598 | 3.2% |
| Federal Government Employees | 5,513 | 2.3% |
| Unpaid Family Workers | 172 | 0.1% |
| Total | 235,955 | 100.0% |
Employment Status by Age in Dakota County
According to the labor force statistics for Dakota County, out of the total population over 16 years of age (345,462), 72.1% or 249,078 individuals are in the labor force, with 3.7% or 9,216 of them unemployed. The age group with the highest labor force participation rate is 35 to 44 years, with 91.4% or 55,956 individuals in the labor force. Within the labor force, the 16 to 19 years age range has the highest percentage of unemployed individuals, with 9.6% or 1,154 of them being unemployed.
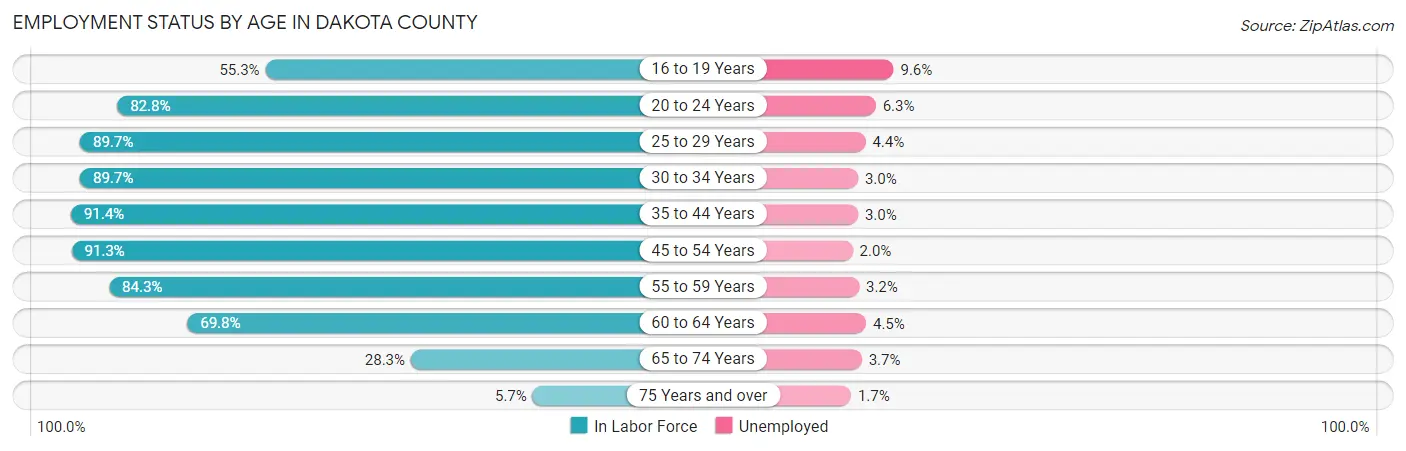
| Age Bracket | In Labor Force | Unemployed |
| 16 to 19 Years | 12,017 (55.3%) | 1,154 (9.6%) |
| 20 to 24 Years | 20,926 (82.8%) | 1,318 (6.3%) |
| 25 to 29 Years | 24,062 (89.7%) | 1,059 (4.4%) |
| 30 to 34 Years | 26,262 (89.7%) | 788 (3.0%) |
| 35 to 44 Years | 55,956 (91.4%) | 1,679 (3.0%) |
| 45 to 54 Years | 51,227 (91.3%) | 1,025 (2.0%) |
| 55 to 59 Years | 26,457 (84.3%) | 847 (3.2%) |
| 60 to 64 Years | 19,408 (69.8%) | 873 (4.5%) |
| 65 to 74 Years | 11,197 (28.3%) | 414 (3.7%) |
| 75 Years and over | 1,498 (5.7%) | 25 (1.7%) |
| Total | 249,078 (72.1%) | 9,216 (3.7%) |
Employment Status by Educational Attainment in Dakota County
According to labor force statistics for Dakota County, 87.4% of individuals (203,311) out of the total population between 25 and 64 years of age (232,621) are in the labor force, with 3.1% or 6,303 of them being unemployed. The group with the highest labor force participation rate are those with the educational attainment of bachelor's degree or higher, with 90.7% or 98,104 individuals in the labor force. Within the labor force, individuals with less than high school education have the highest percentage of unemployment, with 9.8% or 760 of them being unemployed.
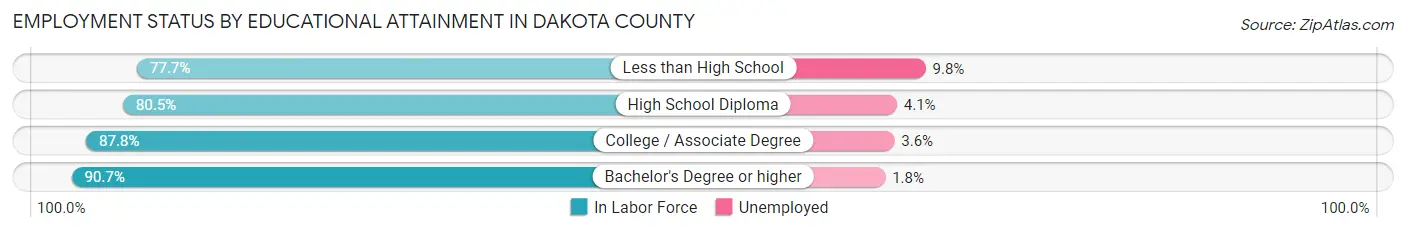
| Educational Attainment | In Labor Force | Unemployed |
| Less than High School | 7,758 (77.7%) | 979 (9.8%) |
| High School Diploma | 32,745 (80.5%) | 1,668 (4.1%) |
| College / Associate Degree | 64,793 (87.8%) | 2,657 (3.6%) |
| Bachelor's Degree or higher | 98,104 (90.7%) | 1,947 (1.8%) |
| Total | 203,311 (87.4%) | 7,211 (3.1%) |
Employment Occupations by Sex in Dakota County
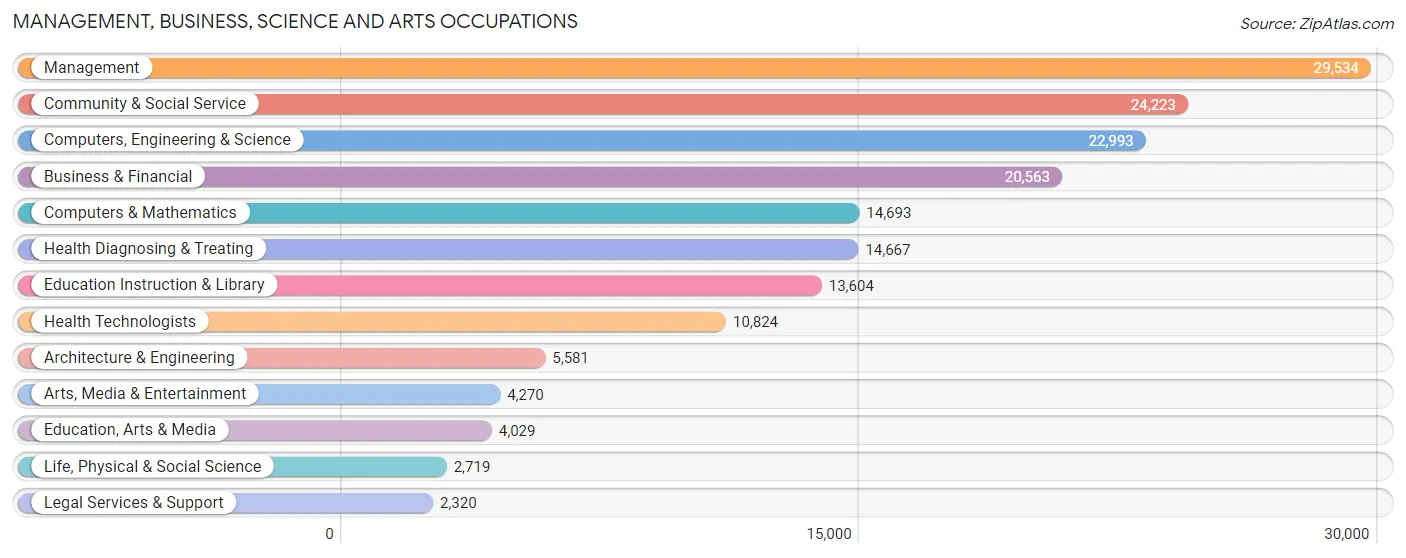
Management, Business, Science and Arts Occupations
The most common Management, Business, Science and Arts occupations in Dakota County are Management (29,534 | 12.3%), Community & Social Service (24,223 | 10.1%), Computers, Engineering & Science (22,993 | 9.6%), Business & Financial (20,563 | 8.6%), and Computers & Mathematics (14,693 | 6.1%).
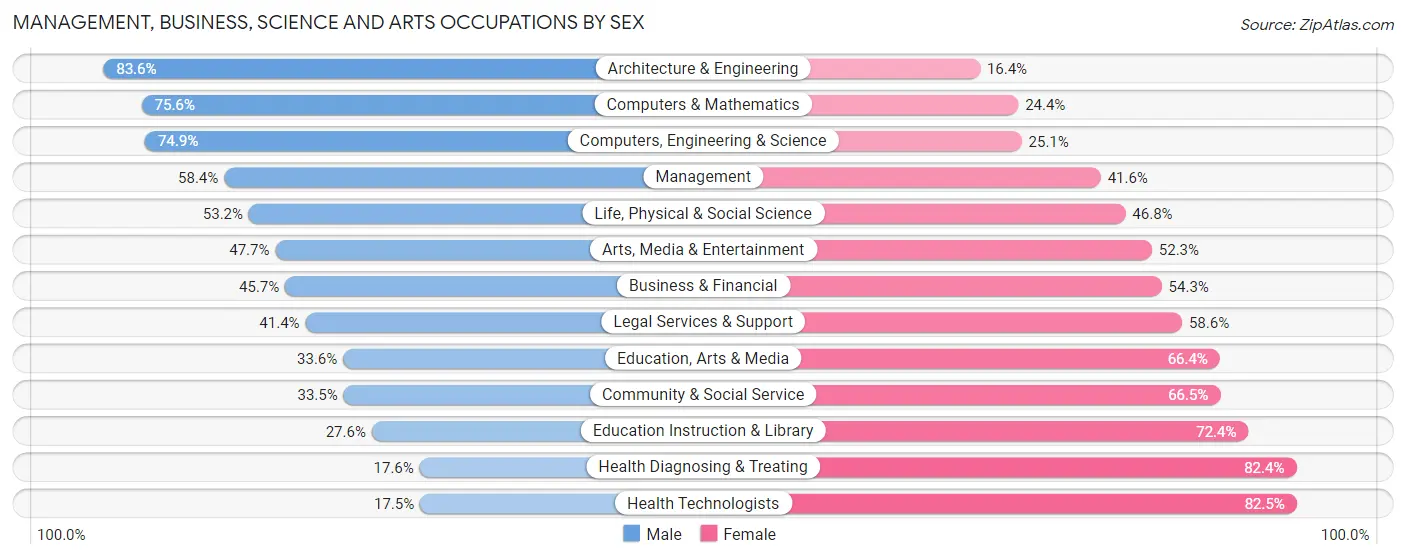
Management, Business, Science and Arts Occupations by Sex
Within the Management, Business, Science and Arts occupations in Dakota County, the most male-oriented occupations are Architecture & Engineering (83.6%), Computers & Mathematics (75.6%), and Computers, Engineering & Science (74.9%), while the most female-oriented occupations are Health Technologists (82.5%), Health Diagnosing & Treating (82.4%), and Education Instruction & Library (72.4%).
| Occupation | Male | Female |
| Management | 17,243 (58.4%) | 12,291 (41.6%) |
| Business & Financial | 9,389 (45.7%) | 11,174 (54.3%) |
| Computers, Engineering & Science | 17,217 (74.9%) | 5,776 (25.1%) |
| Computers & Mathematics | 11,106 (75.6%) | 3,587 (24.4%) |
| Architecture & Engineering | 4,664 (83.6%) | 917 (16.4%) |
| Life, Physical & Social Science | 1,447 (53.2%) | 1,272 (46.8%) |
| Community & Social Service | 8,104 (33.5%) | 16,119 (66.5%) |
| Education, Arts & Media | 1,352 (33.6%) | 2,677 (66.4%) |
| Legal Services & Support | 961 (41.4%) | 1,359 (58.6%) |
| Education Instruction & Library | 3,754 (27.6%) | 9,850 (72.4%) |
| Arts, Media & Entertainment | 2,037 (47.7%) | 2,233 (52.3%) |
| Health Diagnosing & Treating | 2,581 (17.6%) | 12,086 (82.4%) |
| Health Technologists | 1,894 (17.5%) | 8,930 (82.5%) |
| Total (Category) | 54,534 (48.7%) | 57,446 (51.3%) |
| Total (Overall) | 124,570 (52.0%) | 114,872 (48.0%) |
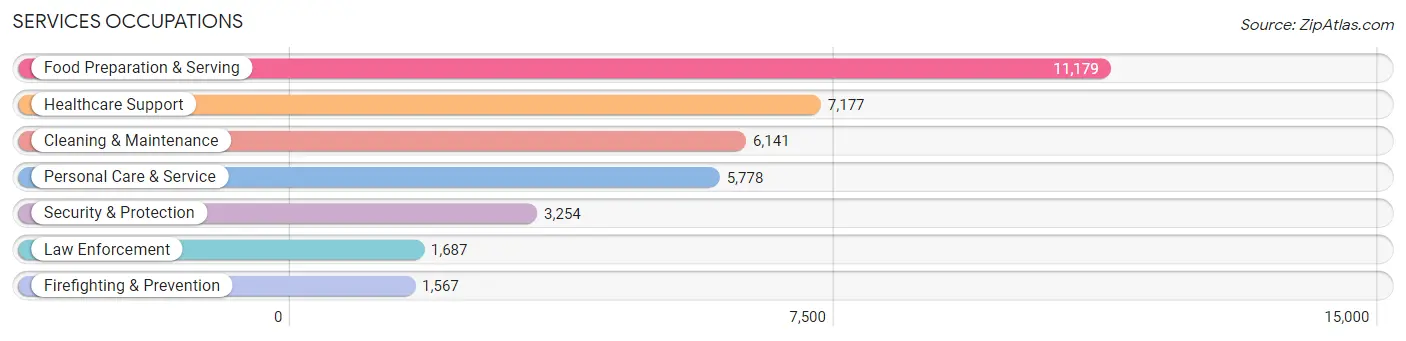
Services Occupations
The most common Services occupations in Dakota County are Food Preparation & Serving (11,179 | 4.7%), Healthcare Support (7,177 | 3.0%), Cleaning & Maintenance (6,141 | 2.6%), Personal Care & Service (5,778 | 2.4%), and Security & Protection (3,254 | 1.4%).
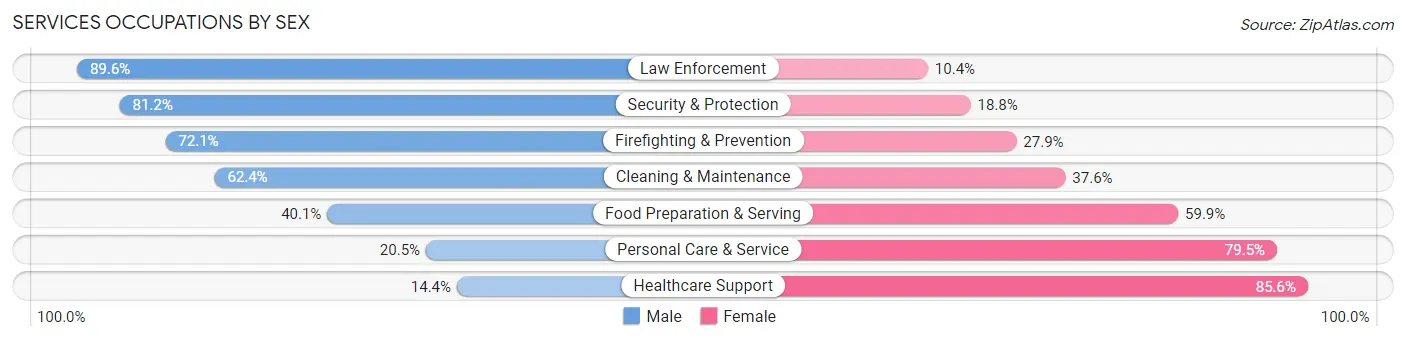
Services Occupations by Sex
Within the Services occupations in Dakota County, the most male-oriented occupations are Law Enforcement (89.6%), Security & Protection (81.2%), and Firefighting & Prevention (72.1%), while the most female-oriented occupations are Healthcare Support (85.6%), Personal Care & Service (79.5%), and Food Preparation & Serving (59.9%).
| Occupation | Male | Female |
| Healthcare Support | 1,034 (14.4%) | 6,143 (85.6%) |
| Security & Protection | 2,642 (81.2%) | 612 (18.8%) |
| Firefighting & Prevention | 1,130 (72.1%) | 437 (27.9%) |
| Law Enforcement | 1,512 (89.6%) | 175 (10.4%) |
| Food Preparation & Serving | 4,481 (40.1%) | 6,698 (59.9%) |
| Cleaning & Maintenance | 3,832 (62.4%) | 2,309 (37.6%) |
| Personal Care & Service | 1,186 (20.5%) | 4,592 (79.5%) |
| Total (Category) | 13,175 (39.3%) | 20,354 (60.7%) |
| Total (Overall) | 124,570 (52.0%) | 114,872 (48.0%) |
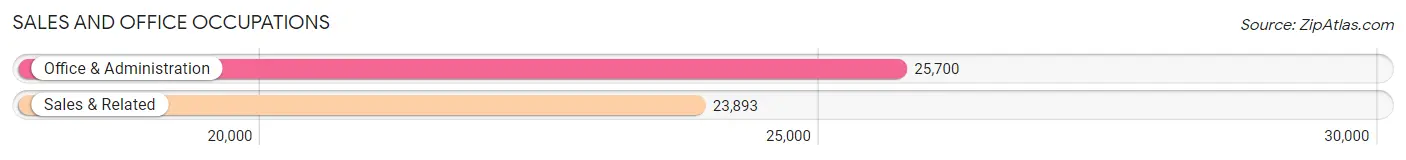
Sales and Office Occupations
The most common Sales and Office occupations in Dakota County are Office & Administration (25,700 | 10.7%), and Sales & Related (23,893 | 10.0%).
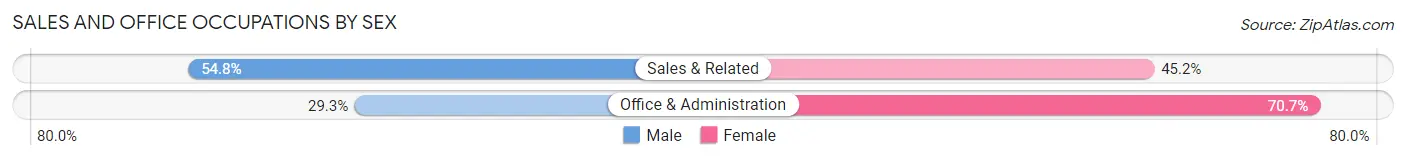
Sales and Office Occupations by Sex
| Occupation | Male | Female |
| Sales & Related | 13,098 (54.8%) | 10,795 (45.2%) |
| Office & Administration | 7,534 (29.3%) | 18,166 (70.7%) |
| Total (Category) | 20,632 (41.6%) | 28,961 (58.4%) |
| Total (Overall) | 124,570 (52.0%) | 114,872 (48.0%) |
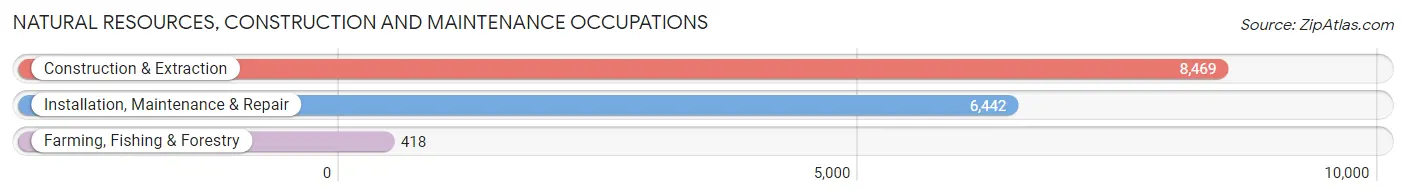
Natural Resources, Construction and Maintenance Occupations
The most common Natural Resources, Construction and Maintenance occupations in Dakota County are Construction & Extraction (8,469 | 3.5%), Installation, Maintenance & Repair (6,442 | 2.7%), and Farming, Fishing & Forestry (418 | 0.2%).
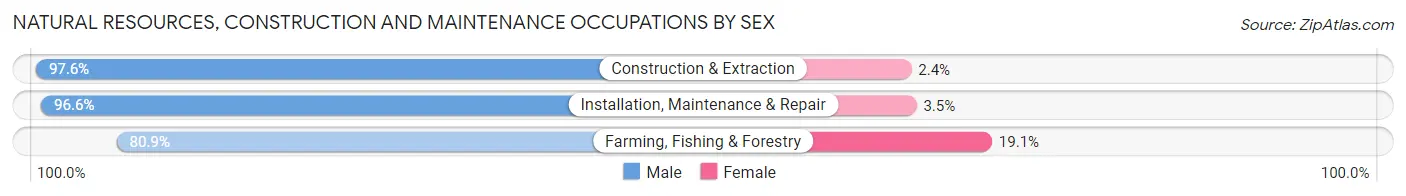
Natural Resources, Construction and Maintenance Occupations by Sex
| Occupation | Male | Female |
| Farming, Fishing & Forestry | 338 (80.9%) | 80 (19.1%) |
| Construction & Extraction | 8,268 (97.6%) | 201 (2.4%) |
| Installation, Maintenance & Repair | 6,220 (96.6%) | 222 (3.5%) |
| Total (Category) | 14,826 (96.7%) | 503 (3.3%) |
| Total (Overall) | 124,570 (52.0%) | 114,872 (48.0%) |
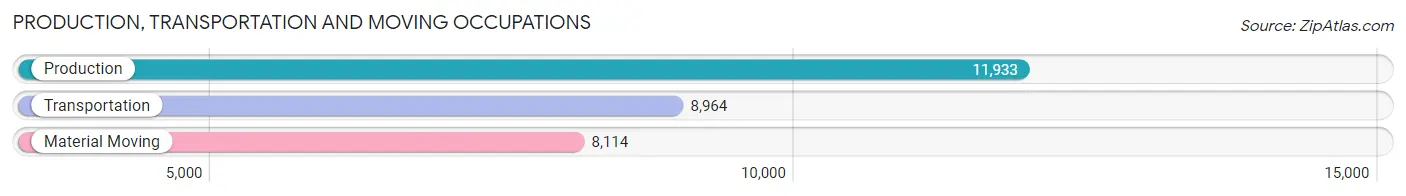
Production, Transportation and Moving Occupations
The most common Production, Transportation and Moving occupations in Dakota County are Production (11,933 | 5.0%), Transportation (8,964 | 3.7%), and Material Moving (8,114 | 3.4%).
Production, Transportation and Moving Occupations by Sex
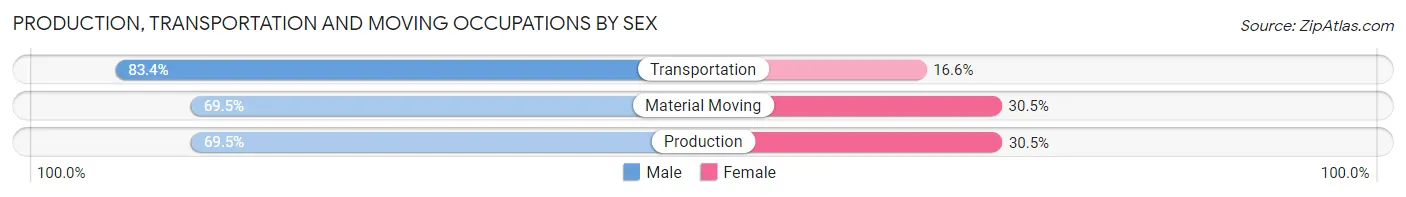
| Occupation | Male | Female |
| Production | 8,290 (69.5%) | 3,643 (30.5%) |
| Transportation | 7,472 (83.4%) | 1,492 (16.6%) |
| Material Moving | 5,641 (69.5%) | 2,473 (30.5%) |
| Total (Category) | 21,403 (73.8%) | 7,608 (26.2%) |
| Total (Overall) | 124,570 (52.0%) | 114,872 (48.0%) |
Employment Industries by Sex in Dakota County
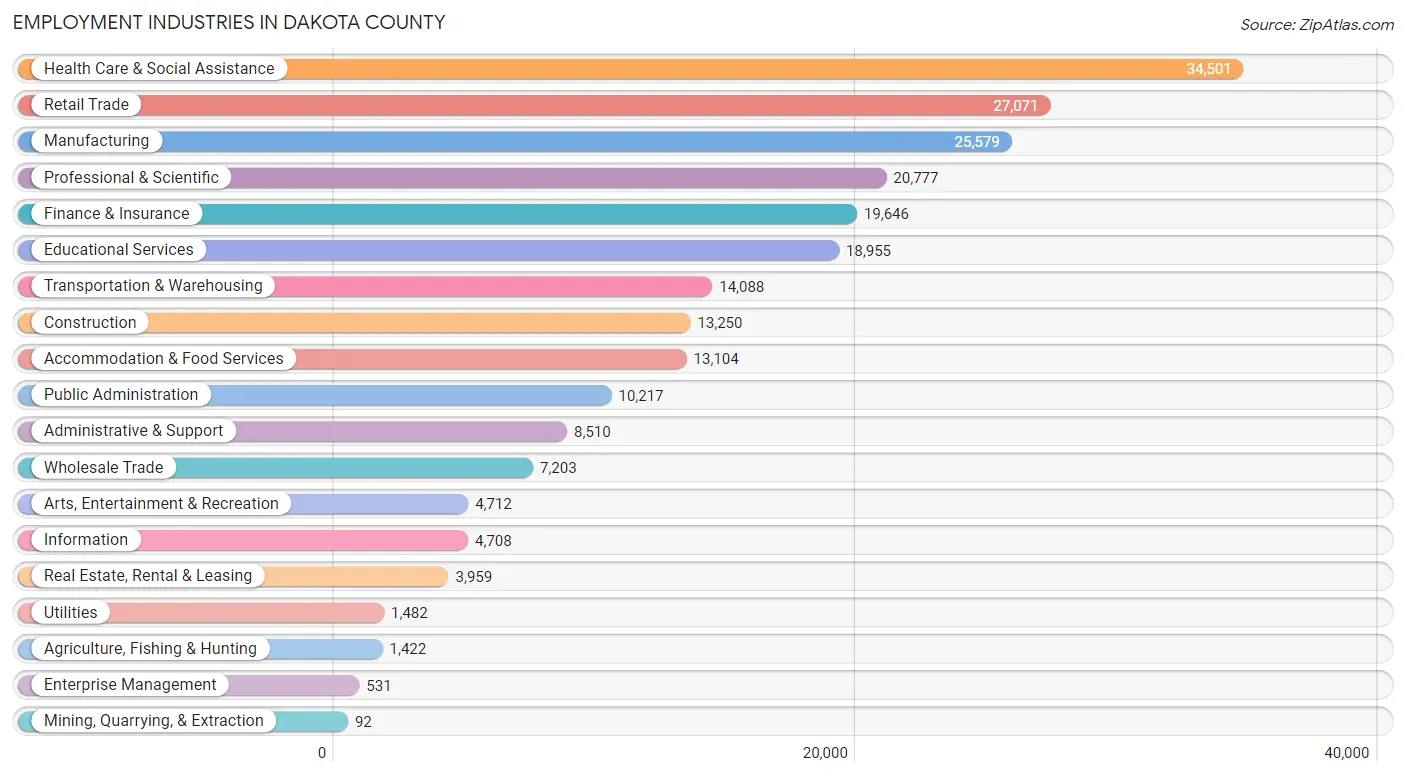
Employment Industries in Dakota County
The major employment industries in Dakota County include Health Care & Social Assistance (34,501 | 14.4%), Retail Trade (27,071 | 11.3%), Manufacturing (25,579 | 10.7%), Professional & Scientific (20,777 | 8.7%), and Finance & Insurance (19,646 | 8.2%).
Employment Industries by Sex in Dakota County
The Dakota County industries that see more men than women are Mining, Quarrying, & Extraction (98.9%), Construction (92.1%), and Agriculture, Fishing & Hunting (82.3%), whereas the industries that tend to have a higher number of women are Health Care & Social Assistance (79.9%), Educational Services (68.9%), and Accommodation & Food Services (54.7%).
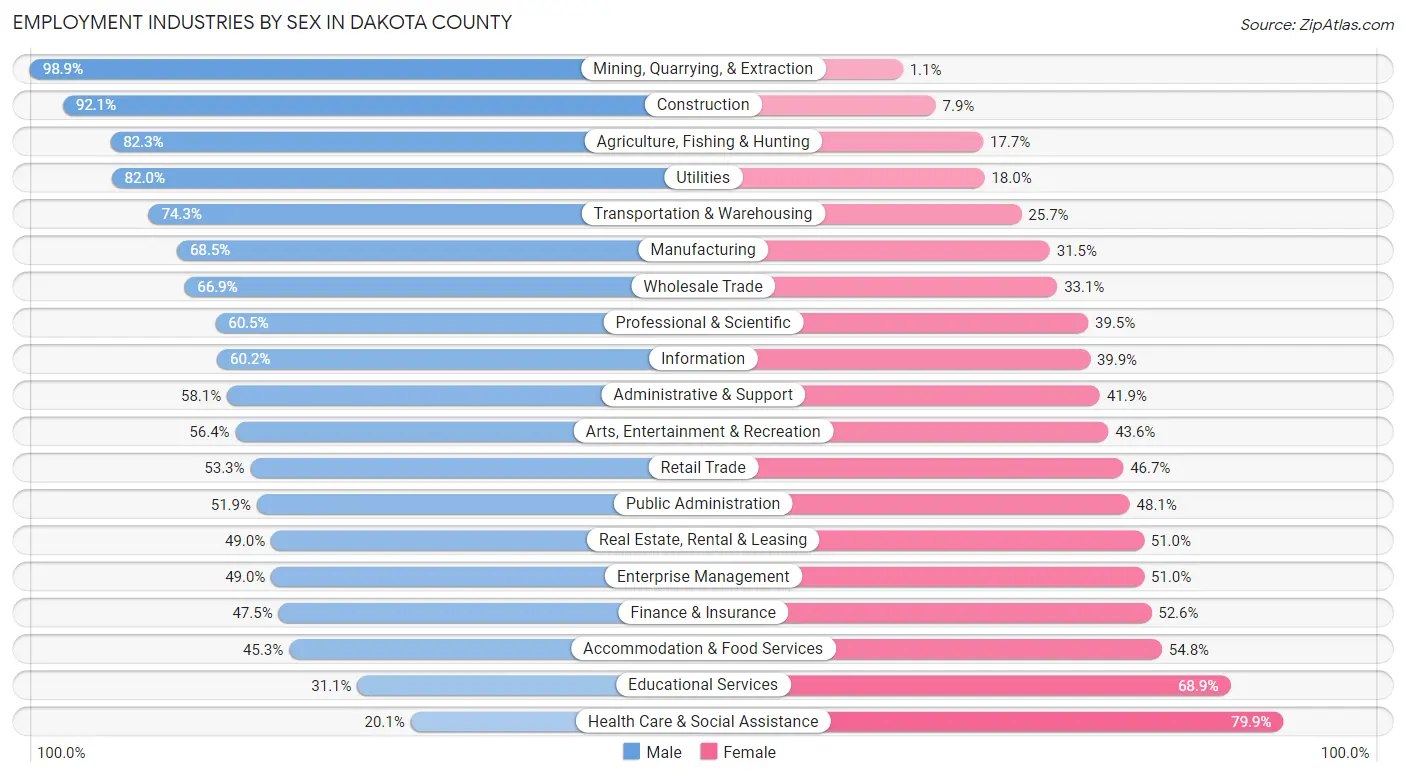
| Industry | Male | Female |
| Agriculture, Fishing & Hunting | 1,170 (82.3%) | 252 (17.7%) |
| Mining, Quarrying, & Extraction | 91 (98.9%) | 1 (1.1%) |
| Construction | 12,202 (92.1%) | 1,048 (7.9%) |
| Manufacturing | 17,512 (68.5%) | 8,067 (31.5%) |
| Wholesale Trade | 4,821 (66.9%) | 2,382 (33.1%) |
| Retail Trade | 14,421 (53.3%) | 12,650 (46.7%) |
| Transportation & Warehousing | 10,473 (74.3%) | 3,615 (25.7%) |
| Utilities | 1,215 (82.0%) | 267 (18.0%) |
| Information | 2,832 (60.2%) | 1,876 (39.9%) |
| Finance & Insurance | 9,322 (47.4%) | 10,324 (52.5%) |
| Real Estate, Rental & Leasing | 1,940 (49.0%) | 2,019 (51.0%) |
| Professional & Scientific | 12,576 (60.5%) | 8,201 (39.5%) |
| Enterprise Management | 260 (49.0%) | 271 (51.0%) |
| Administrative & Support | 4,944 (58.1%) | 3,566 (41.9%) |
| Educational Services | 5,898 (31.1%) | 13,057 (68.9%) |
| Health Care & Social Assistance | 6,942 (20.1%) | 27,559 (79.9%) |
| Arts, Entertainment & Recreation | 2,656 (56.4%) | 2,056 (43.6%) |
| Accommodation & Food Services | 5,930 (45.3%) | 7,174 (54.7%) |
| Public Administration | 5,307 (51.9%) | 4,910 (48.1%) |
| Total | 124,570 (52.0%) | 114,872 (48.0%) |
Education in Dakota County
School Enrollment in Dakota County
The most common levels of schooling among the 108,043 students in Dakota County are high school (25,879 | 23.9%), elementary school (23,949 | 22.2%), and middle school (23,264 | 21.5%).
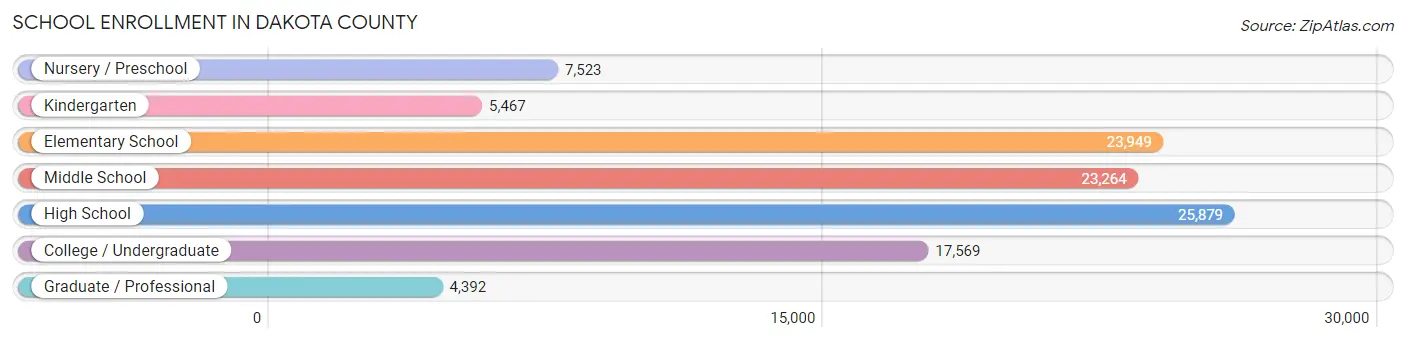
| School Level | # Students | % Students |
| Nursery / Preschool | 7,523 | 7.0% |
| Kindergarten | 5,467 | 5.1% |
| Elementary School | 23,949 | 22.2% |
| Middle School | 23,264 | 21.5% |
| High School | 25,879 | 23.9% |
| College / Undergraduate | 17,569 | 16.3% |
| Graduate / Professional | 4,392 | 4.1% |
| Total | 108,043 | 100.0% |
School Enrollment by Age by Funding Source in Dakota County
Out of a total of 108,043 students who are enrolled in schools in Dakota County, 15,558 (14.4%) attend a private institution, while the remaining 92,485 (85.6%) are enrolled in public schools. The age group of 3 to 4 year olds has the highest likelihood of being enrolled in private schools, with 2,167 (41.5% in the age bracket) enrolled. Conversely, the age group of 15 to 17 year olds has the lowest likelihood of being enrolled in a private school, with 16,852 (91.8% in the age bracket) attending a public institution.
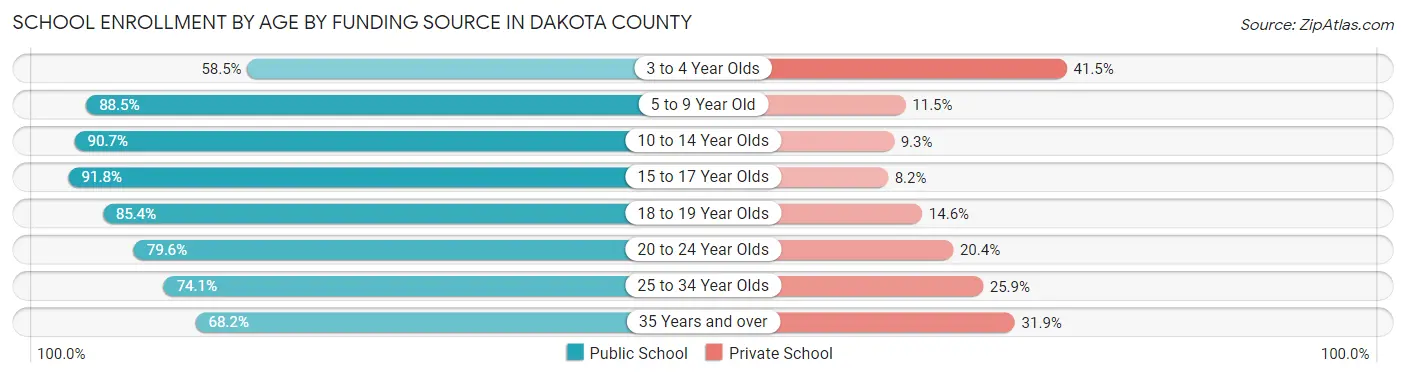
| Age Bracket | Public School | Private School |
| 3 to 4 Year Olds | 3,053 (58.5%) | 2,167 (41.5%) |
| 5 to 9 Year Old | 25,510 (88.5%) | 3,310 (11.5%) |
| 10 to 14 Year Olds | 26,296 (90.7%) | 2,702 (9.3%) |
| 15 to 17 Year Olds | 16,852 (91.8%) | 1,507 (8.2%) |
| 18 to 19 Year Olds | 6,604 (85.4%) | 1,126 (14.6%) |
| 20 to 24 Year Olds | 6,944 (79.6%) | 1,775 (20.4%) |
| 25 to 34 Year Olds | 3,935 (74.1%) | 1,377 (25.9%) |
| 35 Years and over | 3,329 (68.1%) | 1,556 (31.9%) |
| Total | 92,485 (85.6%) | 15,558 (14.4%) |
Educational Attainment by Field of Study in Dakota County
Business (33,710 | 23.4%), education (15,788 | 11.0%), science & technology (13,031 | 9.0%), social sciences (10,858 | 7.5%), and engineering (9,159 | 6.4%) are the most common fields of study among 143,925 individuals in Dakota County who have obtained a bachelor's degree or higher.
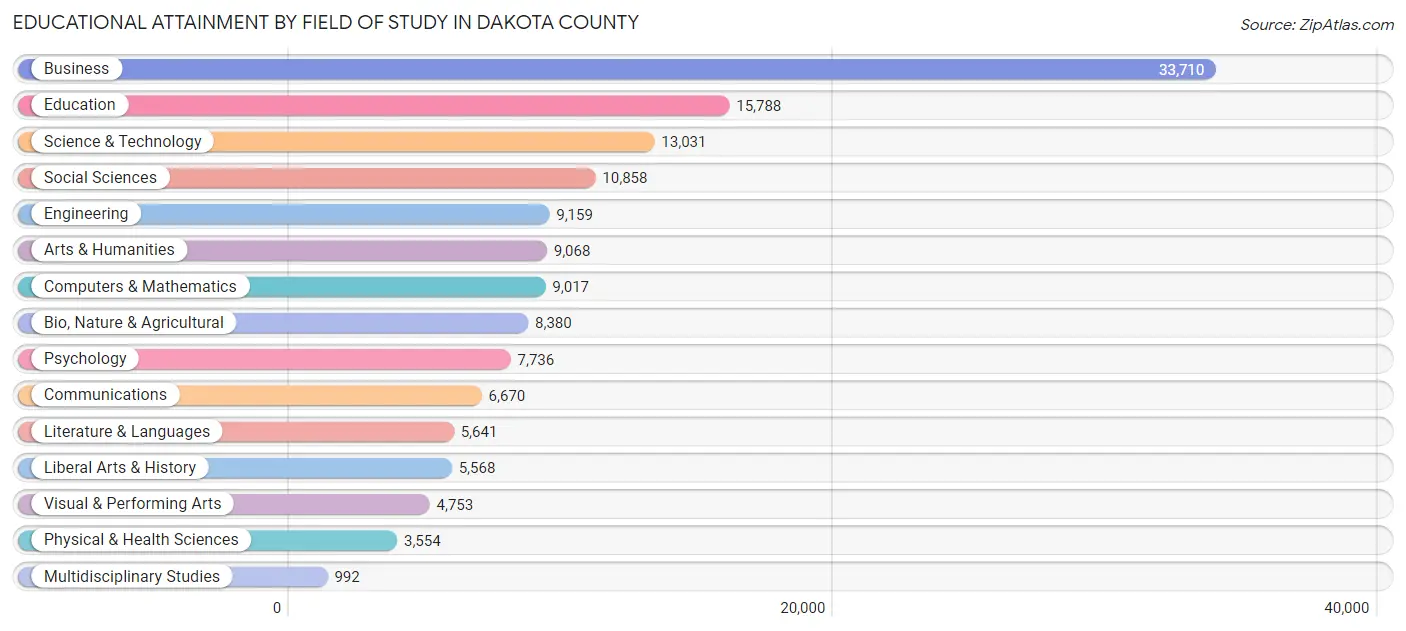
| Field of Study | # Graduates | % Graduates |
| Computers & Mathematics | 9,017 | 6.3% |
| Bio, Nature & Agricultural | 8,380 | 5.8% |
| Physical & Health Sciences | 3,554 | 2.5% |
| Psychology | 7,736 | 5.4% |
| Social Sciences | 10,858 | 7.5% |
| Engineering | 9,159 | 6.4% |
| Multidisciplinary Studies | 992 | 0.7% |
| Science & Technology | 13,031 | 9.0% |
| Business | 33,710 | 23.4% |
| Education | 15,788 | 11.0% |
| Literature & Languages | 5,641 | 3.9% |
| Liberal Arts & History | 5,568 | 3.9% |
| Visual & Performing Arts | 4,753 | 3.3% |
| Communications | 6,670 | 4.6% |
| Arts & Humanities | 9,068 | 6.3% |
| Total | 143,925 | 100.0% |
Transportation & Commute in Dakota County
Vehicle Availability by Sex in Dakota County
The most prevalent vehicle ownership categories in Dakota County are males with 2 vehicles (58,687, accounting for 47.7%) and females with 2 vehicles (50,577, making up 52.2%).
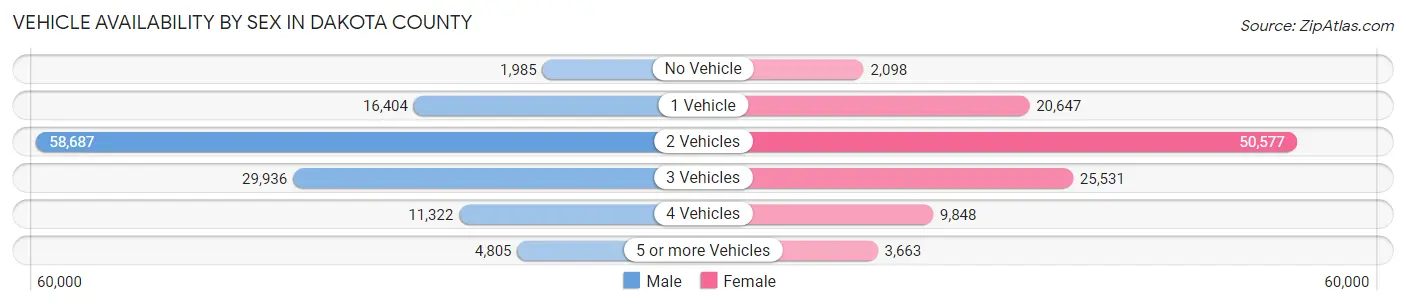
| Vehicles Available | Male | Female |
| No Vehicle | 1,985 (1.6%) | 2,098 (1.9%) |
| 1 Vehicle | 16,404 (13.3%) | 20,647 (18.4%) |
| 2 Vehicles | 58,687 (47.7%) | 50,577 (45.0%) |
| 3 Vehicles | 29,936 (24.3%) | 25,531 (22.7%) |
| 4 Vehicles | 11,322 (9.2%) | 9,848 (8.8%) |
| 5 or more Vehicles | 4,805 (3.9%) | 3,663 (3.3%) |
| Total | 123,139 (100.0%) | 112,364 (100.0%) |
Commute Time in Dakota County
The most frequently occuring commute durations in Dakota County are 30 to 34 minutes (30,248 commuters, 15.2%), 15 to 19 minutes (30,208 commuters, 15.2%), and 20 to 24 minutes (29,668 commuters, 14.9%).
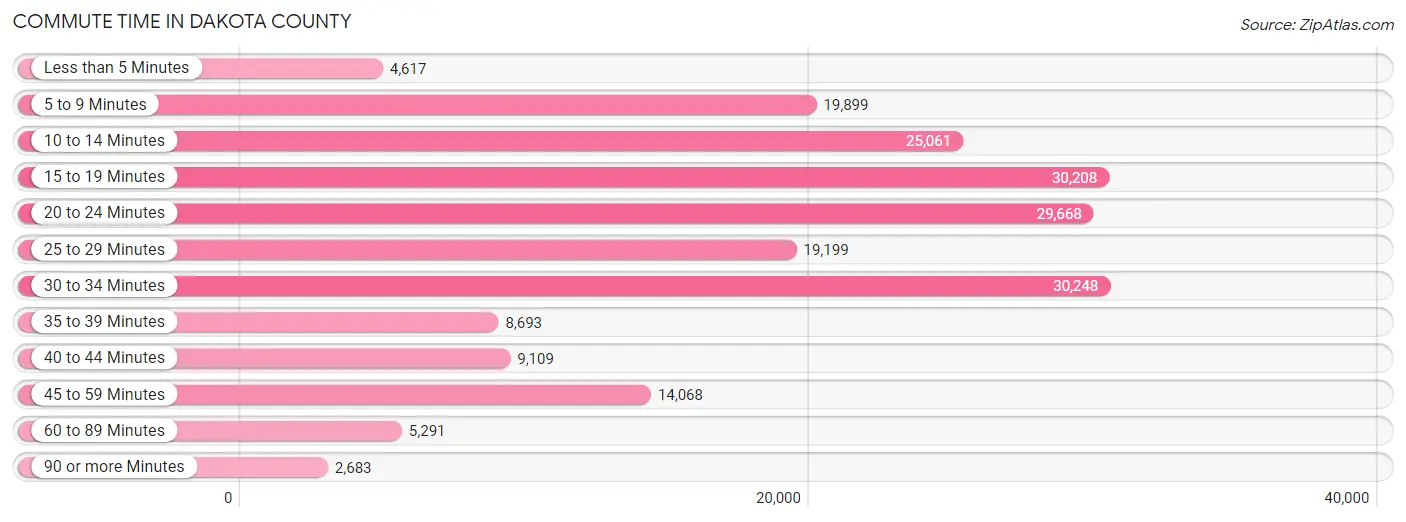
| Commute Time | # Commuters | % Commuters |
| Less than 5 Minutes | 4,617 | 2.3% |
| 5 to 9 Minutes | 19,899 | 10.0% |
| 10 to 14 Minutes | 25,061 | 12.6% |
| 15 to 19 Minutes | 30,208 | 15.2% |
| 20 to 24 Minutes | 29,668 | 14.9% |
| 25 to 29 Minutes | 19,199 | 9.7% |
| 30 to 34 Minutes | 30,248 | 15.2% |
| 35 to 39 Minutes | 8,693 | 4.4% |
| 40 to 44 Minutes | 9,109 | 4.6% |
| 45 to 59 Minutes | 14,068 | 7.1% |
| 60 to 89 Minutes | 5,291 | 2.7% |
| 90 or more Minutes | 2,683 | 1.3% |
Commute Time by Sex in Dakota County
The most common commute times in Dakota County are 30 to 34 minutes (17,154 commuters, 16.3%) for males and 15 to 19 minutes (14,860 commuters, 15.9%) for females.
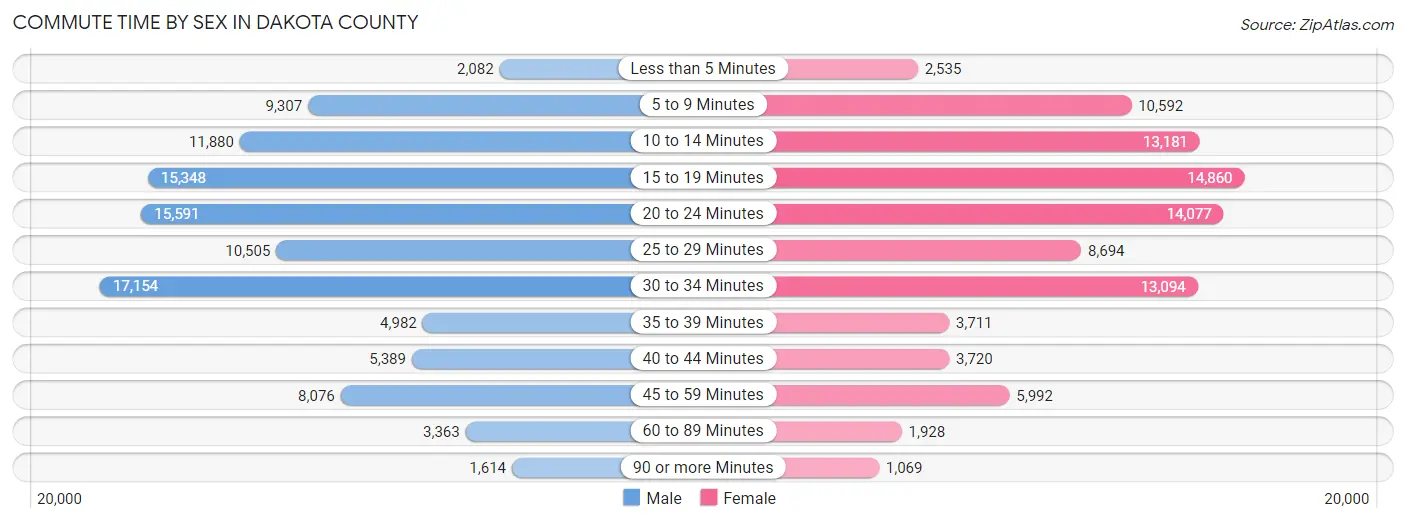
| Commute Time | Male | Female |
| Less than 5 Minutes | 2,082 (2.0%) | 2,535 (2.7%) |
| 5 to 9 Minutes | 9,307 (8.8%) | 10,592 (11.3%) |
| 10 to 14 Minutes | 11,880 (11.3%) | 13,181 (14.1%) |
| 15 to 19 Minutes | 15,348 (14.6%) | 14,860 (15.9%) |
| 20 to 24 Minutes | 15,591 (14.8%) | 14,077 (15.1%) |
| 25 to 29 Minutes | 10,505 (10.0%) | 8,694 (9.3%) |
| 30 to 34 Minutes | 17,154 (16.3%) | 13,094 (14.0%) |
| 35 to 39 Minutes | 4,982 (4.7%) | 3,711 (4.0%) |
| 40 to 44 Minutes | 5,389 (5.1%) | 3,720 (4.0%) |
| 45 to 59 Minutes | 8,076 (7.7%) | 5,992 (6.4%) |
| 60 to 89 Minutes | 3,363 (3.2%) | 1,928 (2.1%) |
| 90 or more Minutes | 1,614 (1.5%) | 1,069 (1.1%) |
Time of Departure to Work by Sex in Dakota County
The most frequent times of departure to work in Dakota County are 7:00 AM to 7:29 AM (15,262, 14.5%) for males and 7:00 AM to 7:29 AM (15,739, 16.8%) for females.
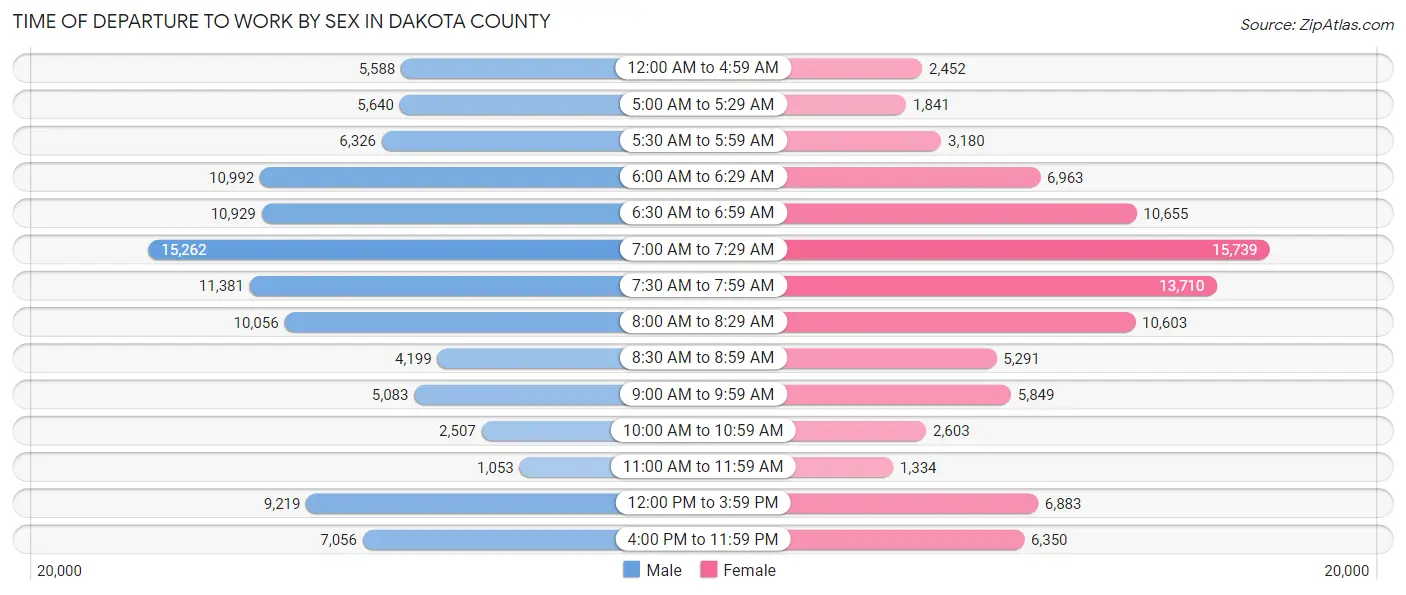
| Time of Departure | Male | Female |
| 12:00 AM to 4:59 AM | 5,588 (5.3%) | 2,452 (2.6%) |
| 5:00 AM to 5:29 AM | 5,640 (5.4%) | 1,841 (2.0%) |
| 5:30 AM to 5:59 AM | 6,326 (6.0%) | 3,180 (3.4%) |
| 6:00 AM to 6:29 AM | 10,992 (10.4%) | 6,963 (7.4%) |
| 6:30 AM to 6:59 AM | 10,929 (10.4%) | 10,655 (11.4%) |
| 7:00 AM to 7:29 AM | 15,262 (14.5%) | 15,739 (16.8%) |
| 7:30 AM to 7:59 AM | 11,381 (10.8%) | 13,710 (14.7%) |
| 8:00 AM to 8:29 AM | 10,056 (9.6%) | 10,603 (11.4%) |
| 8:30 AM to 8:59 AM | 4,199 (4.0%) | 5,291 (5.7%) |
| 9:00 AM to 9:59 AM | 5,083 (4.8%) | 5,849 (6.3%) |
| 10:00 AM to 10:59 AM | 2,507 (2.4%) | 2,603 (2.8%) |
| 11:00 AM to 11:59 AM | 1,053 (1.0%) | 1,334 (1.4%) |
| 12:00 PM to 3:59 PM | 9,219 (8.8%) | 6,883 (7.4%) |
| 4:00 PM to 11:59 PM | 7,056 (6.7%) | 6,350 (6.8%) |
| Total | 105,291 (100.0%) | 93,453 (100.0%) |
Housing Occupancy in Dakota County
Occupancy by Ownership in Dakota County
Of the total 169,404 dwellings in Dakota County, owner-occupied units account for 128,582 (75.9%), while renter-occupied units make up 40,822 (24.1%).
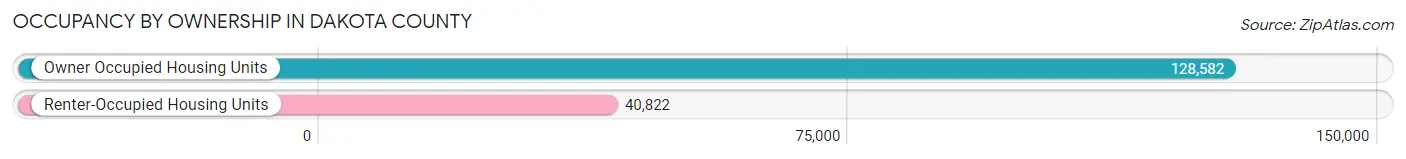
| Occupancy | # Housing Units | % Housing Units |
| Owner Occupied Housing Units | 128,582 | 75.9% |
| Renter-Occupied Housing Units | 40,822 | 24.1% |
| Total Occupied Housing Units | 169,404 | 100.0% |
Occupancy by Household Size in Dakota County
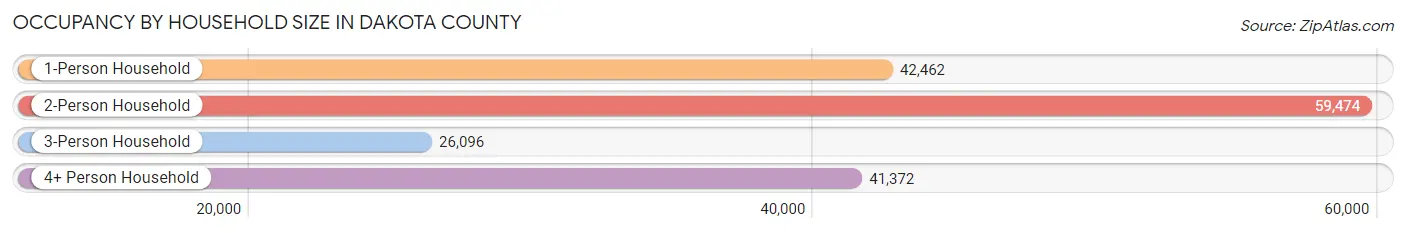
| Household Size | # Housing Units | % Housing Units |
| 1-Person Household | 42,462 | 25.1% |
| 2-Person Household | 59,474 | 35.1% |
| 3-Person Household | 26,096 | 15.4% |
| 4+ Person Household | 41,372 | 24.4% |
| Total Housing Units | 169,404 | 100.0% |
Occupancy by Ownership by Household Size in Dakota County
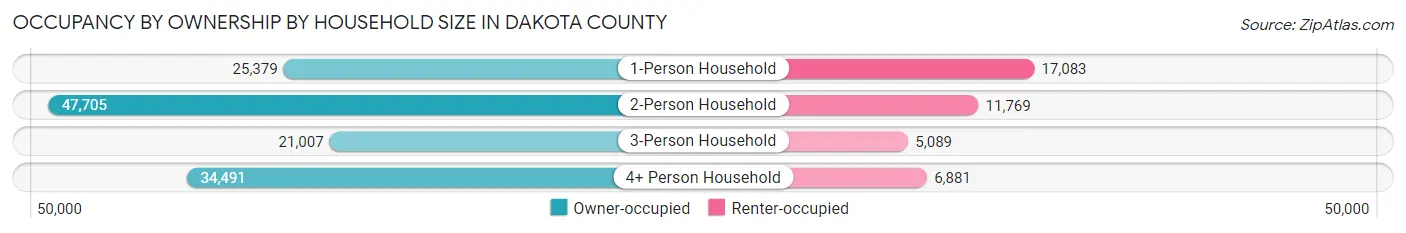
| Household Size | Owner-occupied | Renter-occupied |
| 1-Person Household | 25,379 (59.8%) | 17,083 (40.2%) |
| 2-Person Household | 47,705 (80.2%) | 11,769 (19.8%) |
| 3-Person Household | 21,007 (80.5%) | 5,089 (19.5%) |
| 4+ Person Household | 34,491 (83.4%) | 6,881 (16.6%) |
| Total Housing Units | 128,582 (75.9%) | 40,822 (24.1%) |
Occupancy by Educational Attainment in Dakota County
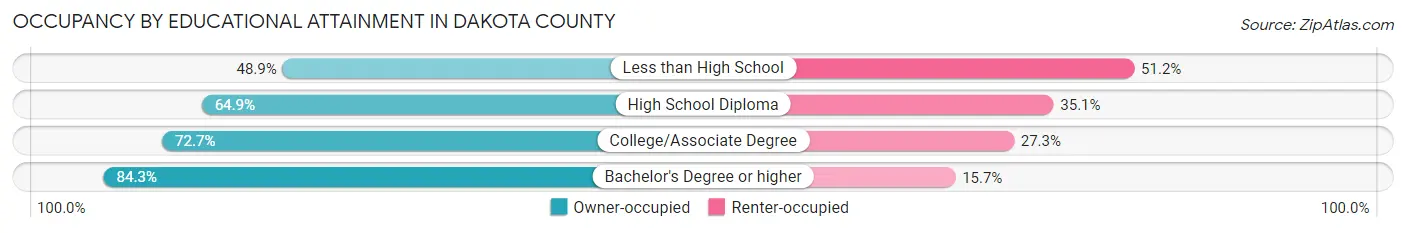
| Household Size | Owner-occupied | Renter-occupied |
| Less than High School | 2,877 (48.8%) | 3,013 (51.1%) |
| High School Diploma | 19,175 (64.9%) | 10,386 (35.1%) |
| College/Associate Degree | 40,266 (72.7%) | 15,108 (27.3%) |
| Bachelor's Degree or higher | 66,264 (84.3%) | 12,315 (15.7%) |
Occupancy by Age of Householder in Dakota County
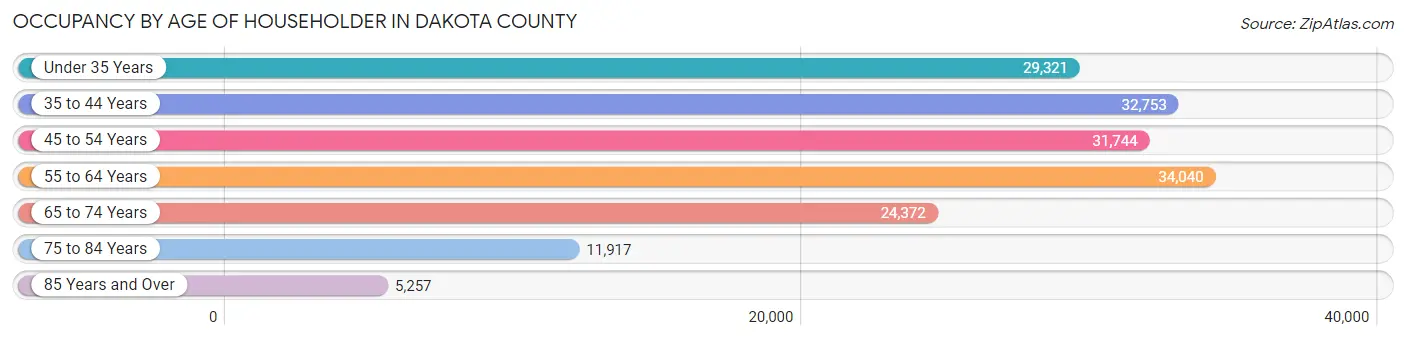
| Age Bracket | # Households | % Households |
| Under 35 Years | 29,321 | 17.3% |
| 35 to 44 Years | 32,753 | 19.3% |
| 45 to 54 Years | 31,744 | 18.7% |
| 55 to 64 Years | 34,040 | 20.1% |
| 65 to 74 Years | 24,372 | 14.4% |
| 75 to 84 Years | 11,917 | 7.0% |
| 85 Years and Over | 5,257 | 3.1% |
| Total | 169,404 | 100.0% |
Housing Finances in Dakota County
Median Income by Occupancy in Dakota County
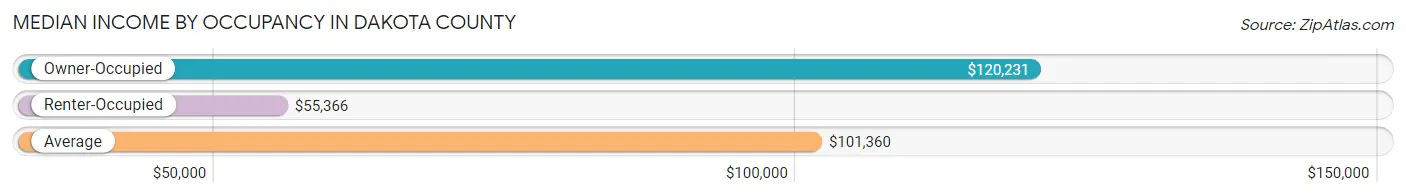
| Occupancy Type | # Households | Median Income |
| Owner-Occupied | 128,582 (75.9%) | $120,231 |
| Renter-Occupied | 40,822 (24.1%) | $55,366 |
| Average | 169,404 (100.0%) | $101,360 |
Occupancy by Householder Income Bracket in Dakota County
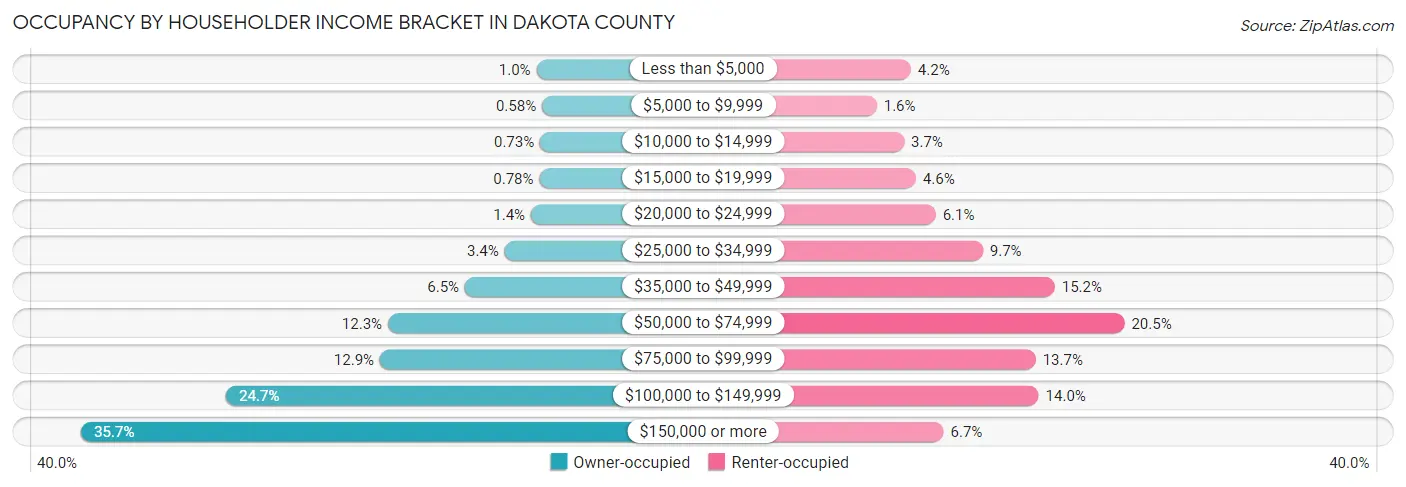
| Income Bracket | Owner-occupied | Renter-occupied |
| Less than $5,000 | 1,290 (1.0%) | 1,721 (4.2%) |
| $5,000 to $9,999 | 742 (0.6%) | 660 (1.6%) |
| $10,000 to $14,999 | 943 (0.7%) | 1,509 (3.7%) |
| $15,000 to $19,999 | 1,007 (0.8%) | 1,878 (4.6%) |
| $20,000 to $24,999 | 1,831 (1.4%) | 2,493 (6.1%) |
| $25,000 to $34,999 | 4,413 (3.4%) | 3,958 (9.7%) |
| $35,000 to $49,999 | 8,297 (6.5%) | 6,198 (15.2%) |
| $50,000 to $74,999 | 15,841 (12.3%) | 8,363 (20.5%) |
| $75,000 to $99,999 | 16,622 (12.9%) | 5,606 (13.7%) |
| $100,000 to $149,999 | 31,693 (24.6%) | 5,695 (14.0%) |
| $150,000 or more | 45,903 (35.7%) | 2,741 (6.7%) |
| Total | 128,582 (100.0%) | 40,822 (100.0%) |
Monthly Housing Cost Tiers in Dakota County
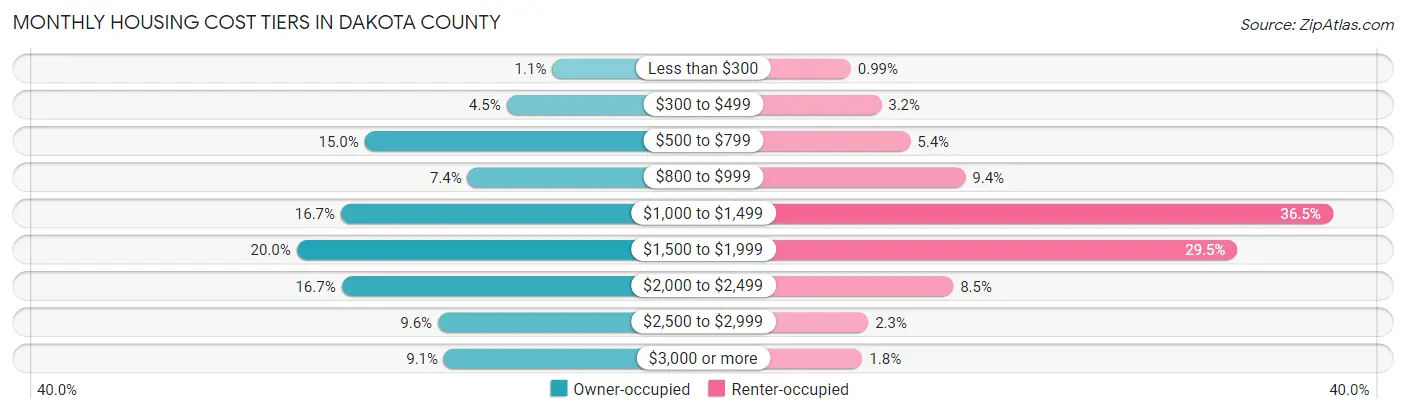
| Monthly Cost | Owner-occupied | Renter-occupied |
| Less than $300 | 1,472 (1.1%) | 404 (1.0%) |
| $300 to $499 | 5,793 (4.5%) | 1,319 (3.2%) |
| $500 to $799 | 19,232 (15.0%) | 2,193 (5.4%) |
| $800 to $999 | 9,487 (7.4%) | 3,846 (9.4%) |
| $1,000 to $1,499 | 21,482 (16.7%) | 14,887 (36.5%) |
| $1,500 to $1,999 | 25,676 (20.0%) | 12,022 (29.4%) |
| $2,000 to $2,499 | 21,418 (16.7%) | 3,482 (8.5%) |
| $2,500 to $2,999 | 12,297 (9.6%) | 927 (2.3%) |
| $3,000 or more | 11,725 (9.1%) | 752 (1.8%) |
| Total | 128,582 (100.0%) | 40,822 (100.0%) |
Physical Housing Characteristics in Dakota County
Housing Structures in Dakota County
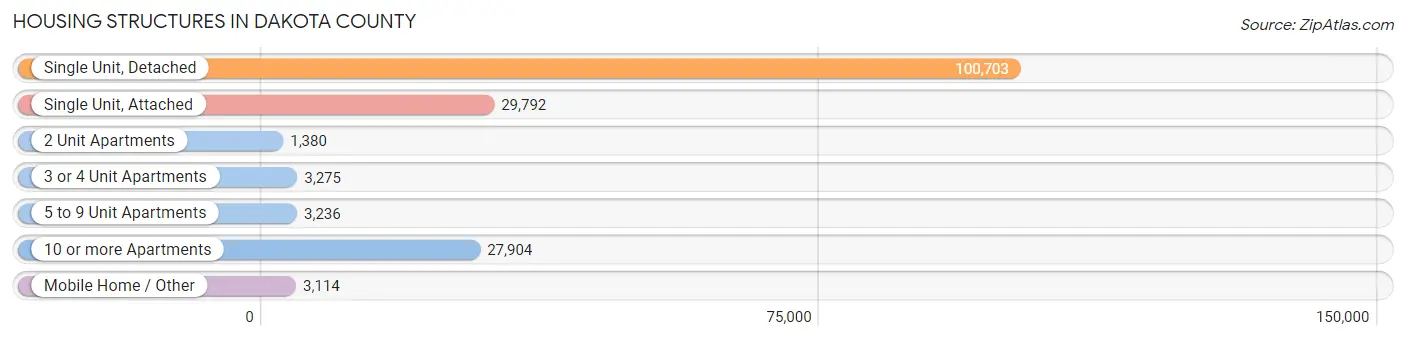
| Structure Type | # Housing Units | % Housing Units |
| Single Unit, Detached | 100,703 | 59.5% |
| Single Unit, Attached | 29,792 | 17.6% |
| 2 Unit Apartments | 1,380 | 0.8% |
| 3 or 4 Unit Apartments | 3,275 | 1.9% |
| 5 to 9 Unit Apartments | 3,236 | 1.9% |
| 10 or more Apartments | 27,904 | 16.5% |
| Mobile Home / Other | 3,114 | 1.8% |
| Total | 169,404 | 100.0% |
Housing Structures by Occupancy in Dakota County
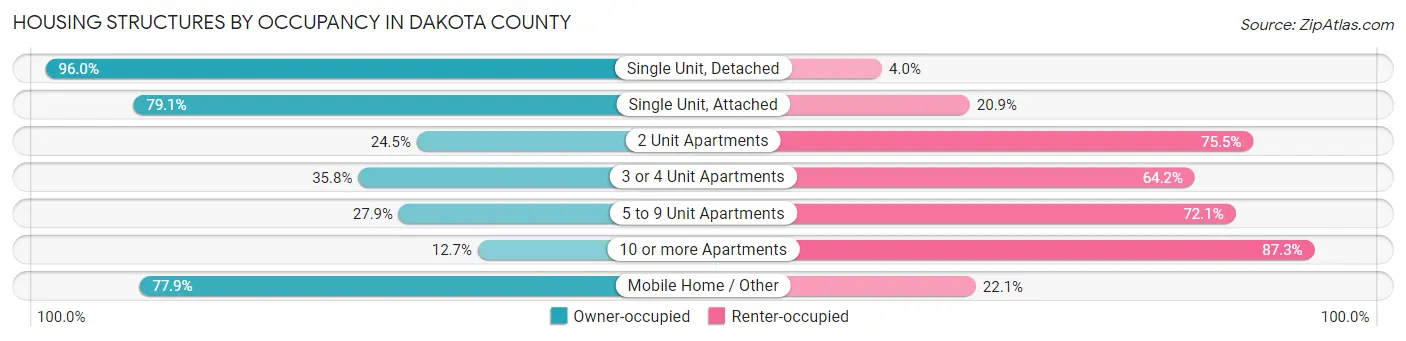
| Structure Type | Owner-occupied | Renter-occupied |
| Single Unit, Detached | 96,630 (96.0%) | 4,073 (4.0%) |
| Single Unit, Attached | 23,557 (79.1%) | 6,235 (20.9%) |
| 2 Unit Apartments | 338 (24.5%) | 1,042 (75.5%) |
| 3 or 4 Unit Apartments | 1,171 (35.8%) | 2,104 (64.2%) |
| 5 to 9 Unit Apartments | 904 (27.9%) | 2,332 (72.1%) |
| 10 or more Apartments | 3,556 (12.7%) | 24,348 (87.3%) |
| Mobile Home / Other | 2,426 (77.9%) | 688 (22.1%) |
| Total | 128,582 (75.9%) | 40,822 (24.1%) |
Housing Structures by Number of Rooms in Dakota County
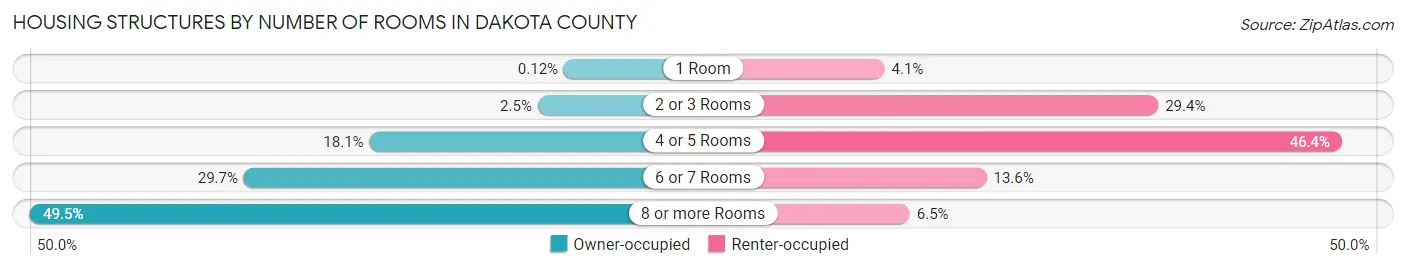
| Number of Rooms | Owner-occupied | Renter-occupied |
| 1 Room | 160 (0.1%) | 1,684 (4.1%) |
| 2 or 3 Rooms | 3,266 (2.5%) | 12,016 (29.4%) |
| 4 or 5 Rooms | 23,289 (18.1%) | 18,945 (46.4%) |
| 6 or 7 Rooms | 38,228 (29.7%) | 5,535 (13.6%) |
| 8 or more Rooms | 63,639 (49.5%) | 2,642 (6.5%) |
| Total | 128,582 (100.0%) | 40,822 (100.0%) |
Housing Structure by Heating Type in Dakota County
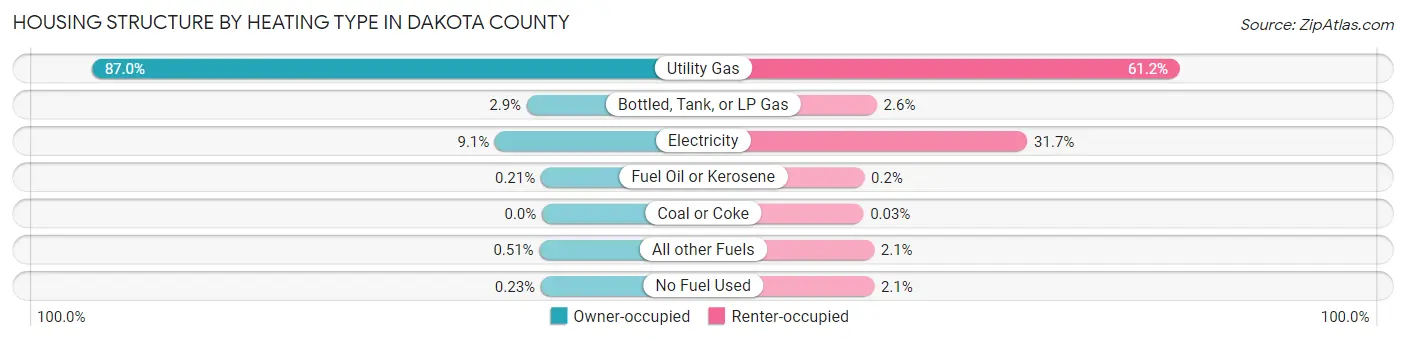
| Heating Type | Owner-occupied | Renter-occupied |
| Utility Gas | 111,904 (87.0%) | 24,996 (61.2%) |
| Bottled, Tank, or LP Gas | 3,777 (2.9%) | 1,072 (2.6%) |
| Electricity | 11,675 (9.1%) | 12,944 (31.7%) |
| Fuel Oil or Kerosene | 266 (0.2%) | 80 (0.2%) |
| Coal or Coke | 2 (0.0%) | 13 (0.0%) |
| All other Fuels | 661 (0.5%) | 854 (2.1%) |
| No Fuel Used | 297 (0.2%) | 863 (2.1%) |
| Total | 128,582 (100.0%) | 40,822 (100.0%) |
Household Vehicle Usage in Dakota County
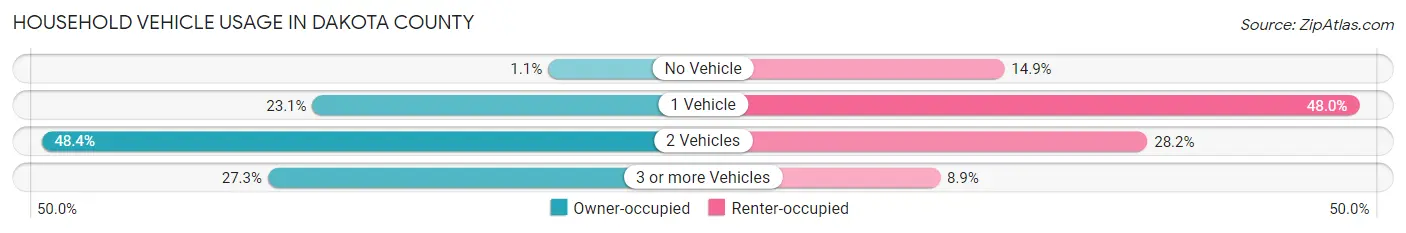
| Vehicles per Household | Owner-occupied | Renter-occupied |
| No Vehicle | 1,462 (1.1%) | 6,078 (14.9%) |
| 1 Vehicle | 29,757 (23.1%) | 19,595 (48.0%) |
| 2 Vehicles | 62,254 (48.4%) | 11,523 (28.2%) |
| 3 or more Vehicles | 35,109 (27.3%) | 3,626 (8.9%) |
| Total | 128,582 (100.0%) | 40,822 (100.0%) |
Real Estate & Mortgages in Dakota County
Real Estate and Mortgage Overview in Dakota County
| Characteristic | Without Mortgage | With Mortgage |
| Housing Units | 37,291 | 91,291 |
| Median Property Value | $329,100 | $345,600 |
| Median Household Income | $89,348 | $36,371 |
| Monthly Housing Costs | $686 | $11,627 |
| Real Estate Taxes | $3,410 | $1,287 |
Property Value by Mortgage Status in Dakota County
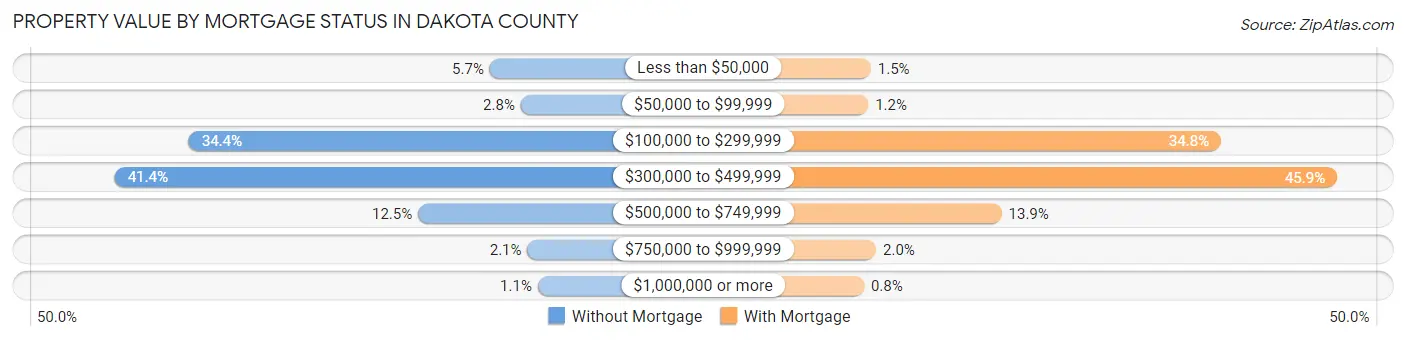
| Property Value | Without Mortgage | With Mortgage |
| Less than $50,000 | 2,126 (5.7%) | 1,332 (1.5%) |
| $50,000 to $99,999 | 1,026 (2.8%) | 1,101 (1.2%) |
| $100,000 to $299,999 | 12,813 (34.4%) | 31,780 (34.8%) |
| $300,000 to $499,999 | 15,442 (41.4%) | 41,860 (45.9%) |
| $500,000 to $749,999 | 4,672 (12.5%) | 12,703 (13.9%) |
| $750,000 to $999,999 | 792 (2.1%) | 1,787 (2.0%) |
| $1,000,000 or more | 420 (1.1%) | 728 (0.8%) |
| Total | 37,291 (100.0%) | 91,291 (100.0%) |
Household Income by Mortgage Status in Dakota County
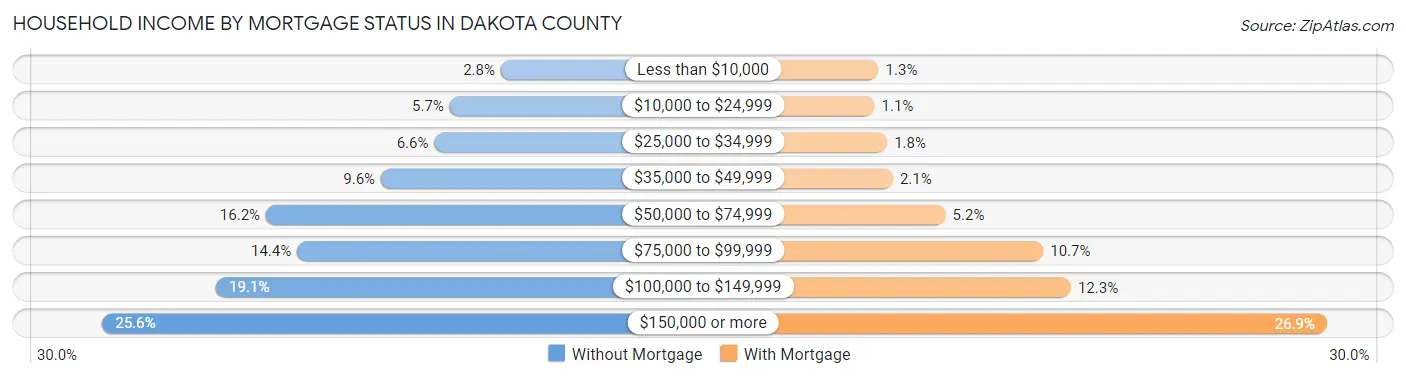
| Household Income | Without Mortgage | With Mortgage |
| Less than $10,000 | 1,041 (2.8%) | 1,207 (1.3%) |
| $10,000 to $24,999 | 2,131 (5.7%) | 991 (1.1%) |
| $25,000 to $34,999 | 2,459 (6.6%) | 1,650 (1.8%) |
| $35,000 to $49,999 | 3,593 (9.6%) | 1,954 (2.1%) |
| $50,000 to $74,999 | 6,046 (16.2%) | 4,704 (5.1%) |
| $75,000 to $99,999 | 5,380 (14.4%) | 9,795 (10.7%) |
| $100,000 to $149,999 | 7,109 (19.1%) | 11,242 (12.3%) |
| $150,000 or more | 9,532 (25.6%) | 24,584 (26.9%) |
| Total | 37,291 (100.0%) | 91,291 (100.0%) |
Property Value to Household Income Ratio in Dakota County
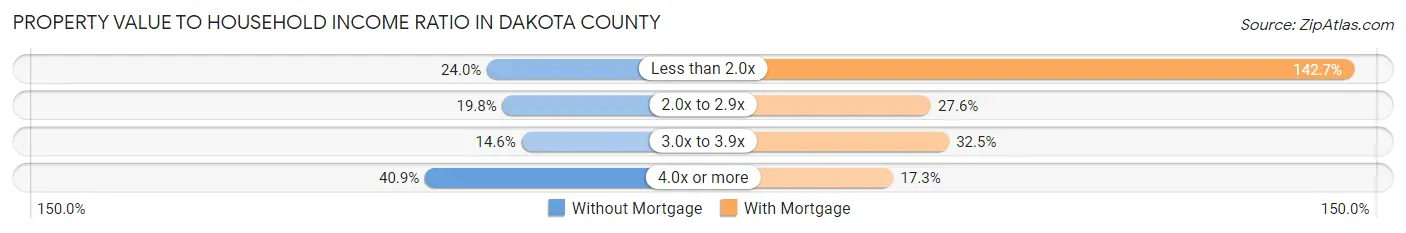
| Value-to-Income Ratio | Without Mortgage | With Mortgage |
| Less than 2.0x | 8,947 (24.0%) | 130,278 (142.7%) |
| 2.0x to 2.9x | 7,384 (19.8%) | 25,177 (27.6%) |
| 3.0x to 3.9x | 5,449 (14.6%) | 29,668 (32.5%) |
| 4.0x or more | 15,259 (40.9%) | 15,800 (17.3%) |
| Total | 37,291 (100.0%) | 91,291 (100.0%) |
Real Estate Taxes by Mortgage Status in Dakota County
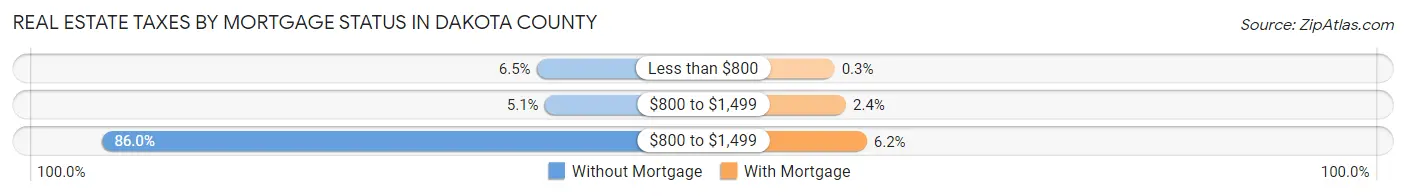
| Property Taxes | Without Mortgage | With Mortgage |
| Less than $800 | 2,427 (6.5%) | 274 (0.3%) |
| $800 to $1,499 | 1,888 (5.1%) | 2,170 (2.4%) |
| $800 to $1,499 | 32,051 (86.0%) | 5,632 (6.2%) |
| Total | 37,291 (100.0%) | 91,291 (100.0%) |
Health & Disability in Dakota County
Health Insurance Coverage by Age in Dakota County
| Age Bracket | With Coverage | Without Coverage |
| Under 6 Years | 32,068 (98.3%) | 550 (1.7%) |
| 6 to 18 Years | 76,293 (96.8%) | 2,555 (3.2%) |
| 19 to 25 Years | 32,106 (92.5%) | 2,588 (7.5%) |
| 26 to 34 Years | 46,712 (93.0%) | 3,533 (7.0%) |
| 35 to 44 Years | 58,069 (95.1%) | 2,980 (4.9%) |
| 45 to 54 Years | 54,014 (96.5%) | 1,950 (3.5%) |
| 55 to 64 Years | 57,052 (96.5%) | 2,042 (3.5%) |
| 65 to 74 Years | 39,173 (99.8%) | 78 (0.2%) |
| 75 Years and older | 25,028 (99.7%) | 73 (0.3%) |
| Total | 420,515 (96.3%) | 16,349 (3.7%) |
Health Insurance Coverage by Citizenship Status in Dakota County
| Citizenship Status | With Coverage | Without Coverage |
| Native Born | 32,068 (98.3%) | 550 (1.7%) |
| Foreign Born, Citizen | 76,293 (96.8%) | 2,555 (3.2%) |
| Foreign Born, not a Citizen | 32,106 (92.5%) | 2,588 (7.5%) |
Health Insurance Coverage by Household Income in Dakota County
| Household Income | With Coverage | Without Coverage |
| Under $25,000 | 19,105 (93.0%) | 1,446 (7.0%) |
| $25,000 to $49,999 | 39,831 (93.1%) | 2,970 (6.9%) |
| $50,000 to $74,999 | 49,315 (94.5%) | 2,879 (5.5%) |
| $75,000 to $99,999 | 51,628 (95.1%) | 2,640 (4.9%) |
| $100,000 and over | 259,213 (97.6%) | 6,401 (2.4%) |
Public vs Private Health Insurance Coverage by Age in Dakota County
| Age Bracket | Public Insurance | Private Insurance |
| Under 6 | 8,693 (26.7%) | 24,883 (76.3%) |
| 6 to 18 Years | 18,208 (23.1%) | 61,707 (78.3%) |
| 19 to 25 Years | 5,239 (15.1%) | 28,352 (81.7%) |
| 25 to 34 Years | 8,128 (16.2%) | 40,215 (80.0%) |
| 35 to 44 Years | 7,941 (13.0%) | 51,930 (85.1%) |
| 45 to 54 Years | 6,022 (10.8%) | 49,349 (88.2%) |
| 55 to 64 Years | 8,690 (14.7%) | 51,006 (86.3%) |
| 65 to 74 Years | 36,567 (93.2%) | 27,654 (70.5%) |
| 75 Years and over | 24,852 (99.0%) | 18,704 (74.5%) |
| Total | 124,340 (28.5%) | 353,800 (81.0%) |
Disability Status by Sex by Age in Dakota County
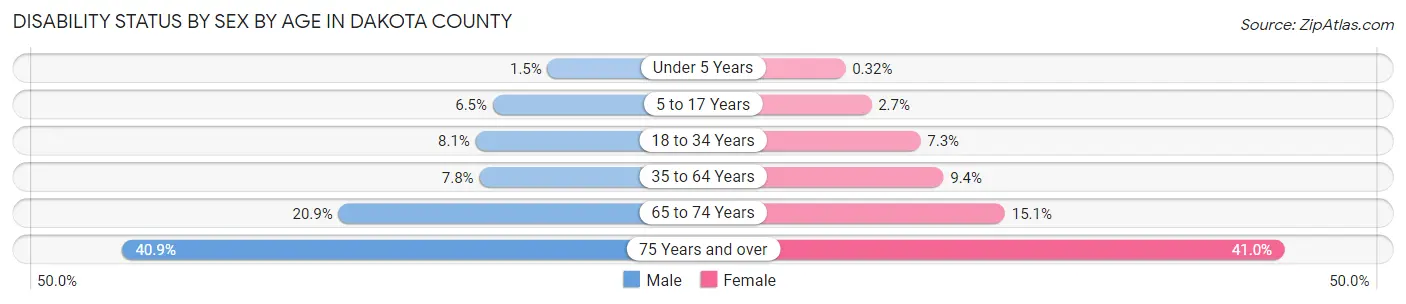
| Age Bracket | Male | Female |
| Under 5 Years | 202 (1.5%) | 42 (0.3%) |
| 5 to 17 Years | 2,644 (6.5%) | 1,041 (2.7%) |
| 18 to 34 Years | 3,765 (8.1%) | 3,254 (7.3%) |
| 35 to 64 Years | 6,848 (7.8%) | 8,307 (9.4%) |
| 65 to 74 Years | 3,820 (20.9%) | 3,168 (15.1%) |
| 75 Years and over | 4,218 (40.9%) | 6,069 (41.0%) |
Disability Class by Sex by Age in Dakota County
Disability Class: Hearing Difficulty
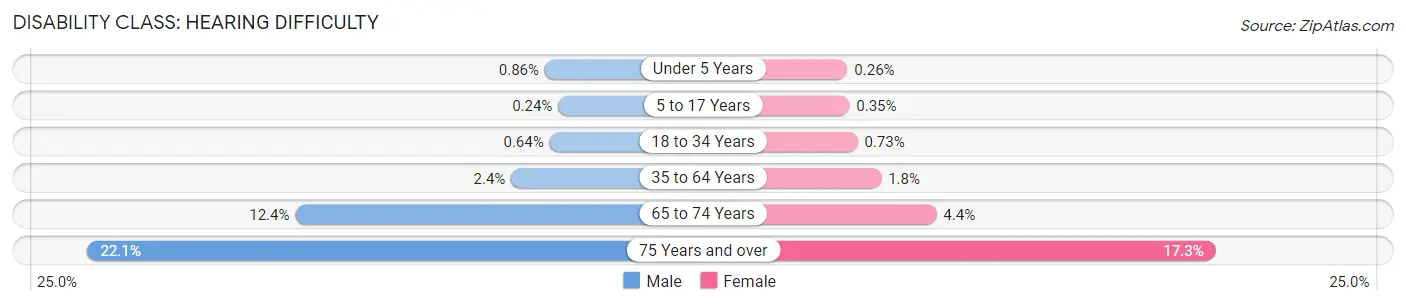
| Age Bracket | Male | Female |
| Under 5 Years | 119 (0.9%) | 34 (0.3%) |
| 5 to 17 Years | 95 (0.2%) | 135 (0.4%) |
| 18 to 34 Years | 295 (0.6%) | 327 (0.7%) |
| 35 to 64 Years | 2,130 (2.4%) | 1,613 (1.8%) |
| 65 to 74 Years | 2,277 (12.4%) | 920 (4.4%) |
| 75 Years and over | 2,277 (22.1%) | 2,564 (17.3%) |
Disability Class: Vision Difficulty
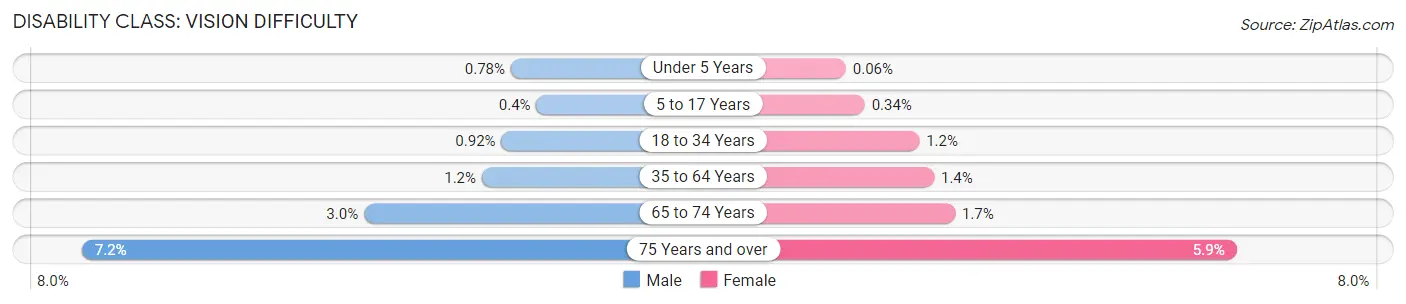
| Age Bracket | Male | Female |
| Under 5 Years | 108 (0.8%) | 8 (0.1%) |
| 5 to 17 Years | 160 (0.4%) | 130 (0.3%) |
| 18 to 34 Years | 424 (0.9%) | 513 (1.1%) |
| 35 to 64 Years | 1,067 (1.2%) | 1,204 (1.4%) |
| 65 to 74 Years | 542 (3.0%) | 352 (1.7%) |
| 75 Years and over | 737 (7.1%) | 866 (5.9%) |
Disability Class: Cognitive Difficulty
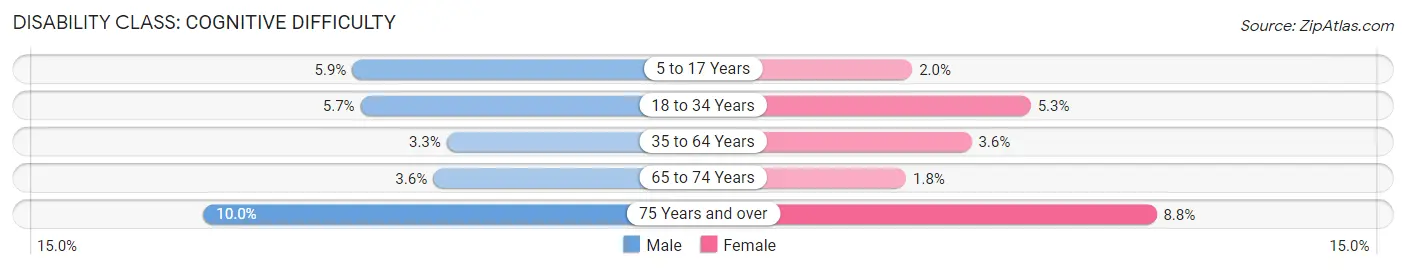
| Age Bracket | Male | Female |
| 5 to 17 Years | 2,378 (5.9%) | 748 (2.0%) |
| 18 to 34 Years | 2,612 (5.7%) | 2,351 (5.3%) |
| 35 to 64 Years | 2,857 (3.3%) | 3,182 (3.6%) |
| 65 to 74 Years | 664 (3.6%) | 375 (1.8%) |
| 75 Years and over | 1,033 (10.0%) | 1,295 (8.8%) |
Disability Class: Ambulatory Difficulty
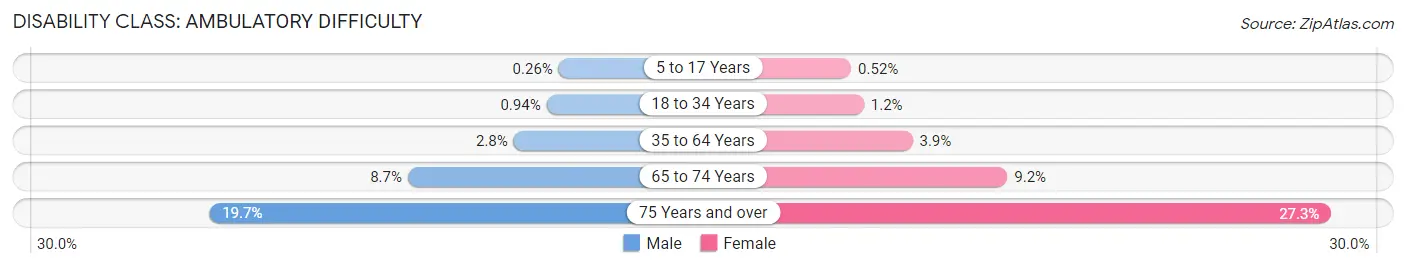
| Age Bracket | Male | Female |
| 5 to 17 Years | 104 (0.3%) | 200 (0.5%) |
| 18 to 34 Years | 434 (0.9%) | 548 (1.2%) |
| 35 to 64 Years | 2,432 (2.8%) | 3,477 (3.9%) |
| 65 to 74 Years | 1,585 (8.7%) | 1,930 (9.2%) |
| 75 Years and over | 2,033 (19.7%) | 4,031 (27.3%) |
Disability Class: Self-Care Difficulty
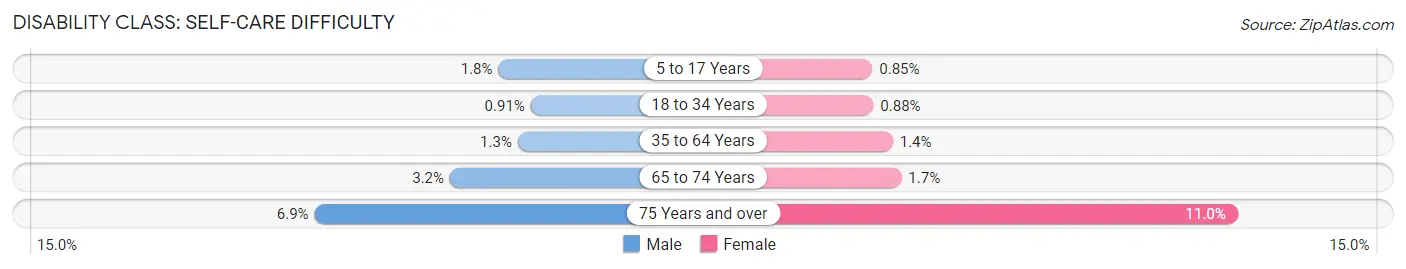
| Age Bracket | Male | Female |
| 5 to 17 Years | 730 (1.8%) | 323 (0.9%) |
| 18 to 34 Years | 420 (0.9%) | 392 (0.9%) |
| 35 to 64 Years | 1,116 (1.3%) | 1,250 (1.4%) |
| 65 to 74 Years | 578 (3.2%) | 347 (1.7%) |
| 75 Years and over | 715 (6.9%) | 1,630 (11.0%) |
Technology Access in Dakota County
Computing Device Access in Dakota County
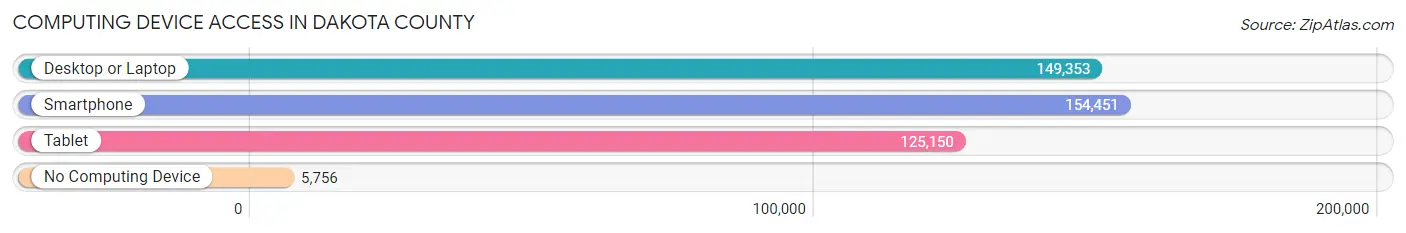
| Device Type | # Households | % Households |
| Desktop or Laptop | 149,353 | 88.2% |
| Smartphone | 154,451 | 91.2% |
| Tablet | 125,150 | 73.9% |
| No Computing Device | 5,756 | 3.4% |
| Total | 169,404 | 100.0% |
Internet Access in Dakota County
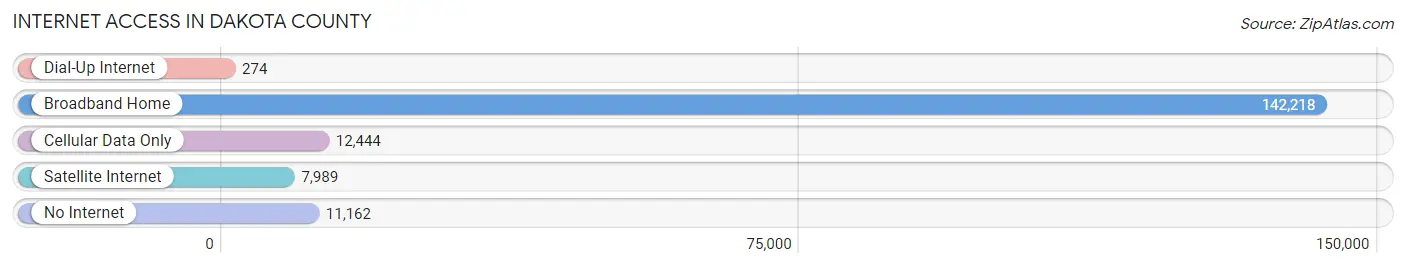
| Internet Type | # Households | % Households |
| Dial-Up Internet | 274 | 0.2% |
| Broadband Home | 142,218 | 84.0% |
| Cellular Data Only | 12,444 | 7.3% |
| Satellite Internet | 7,989 | 4.7% |
| No Internet | 11,162 | 6.6% |
| Total | 169,404 | 100.0% |
Dakota County Summary
Dakota County is a county located in the U.S. state of Minnesota. As of the 2010 census, the population was 398,552, making it the third-most populous county in Minnesota. The county seat is Hastings. Dakota County is included in the Minneapolis-St. Paul-Bloomington, MN-WI Metropolitan Statistical Area.
History
Dakota County was established in 1849. It was named after the Dakota Sioux tribal bands who had inhabited the area. The county was originally part of the Minnesota Territory, which was organized in 1849. The first county seat was established in Mendota, which is now part of the city of Mendota Heights. The county seat was moved to Hastings in 1853.
Geography
Dakota County is located in the southeastern part of Minnesota. It is bordered by the Mississippi River to the east, the Minnesota River to the south, and the counties of Goodhue to the north, Scott to the northeast, and Ramsey to the west. The county has a total area of 523 square miles, of which 517 square miles is land and 6.2 square miles is water.
Economy
Dakota County is home to a diverse economy. The county is home to several large employers, including 3M, Ecolab, and the Mayo Clinic. The county is also home to several smaller businesses, including manufacturing, retail, and service industries. The county is also home to several educational institutions, including the University of Minnesota, the University of St. Thomas, and the Minnesota State Colleges and Universities system.
Demographics
As of the 2010 census, there were 398,552 people, 151,945 households, and 103,945 families residing in the county. The population density was 774.3 people per square mile. There were 159,945 housing units at an average density of 310.7 per square mile. The racial makeup of the county was 81.2% White, 8.3% Black or African American, 0.5% Native American, 5.2% Asian, 0.1% Pacific Islander, 2.7% from other races, and 2.1% from two or more races. Hispanic or Latino of any race were 6.3% of the population.
The median income for a household in the county was $68,945 and the median income for a family was $83,945. The per capita income for the county was $33,945. About 5.2% of families and 8.2% of the population were below the poverty line, including 10.2% of those under age 18 and 5.2% of those age 65 or over.
Conclusion
Dakota County is a vibrant and diverse county located in the southeastern part of Minnesota. It is home to a diverse economy, with several large employers and smaller businesses. The county is also home to several educational institutions. The population of the county is 398,552, with a median household income of $68,945 and a median family income of $83,945. The county is also home to a diverse population, with 81.2% of the population being White, 8.3% Black or African American, 0.5% Native American, 5.2% Asian, 0.1% Pacific Islander, 2.7% from other races, and 2.1% from two or more races.
Common Questions
What is Per Capita Income in Dakota County?
Per Capita income in Dakota County is $48,894.
What is the Median Family Income in Dakota County?
Median Family Income in Dakota County is $124,610.
What is the Median Household income in Dakota County?
Median Household Income in Dakota County is $101,360.
What is Income or Wage Gap in Dakota County?
Income or Wage Gap in Dakota County is 28.9%.
Women in Dakota County earn 71.1 cents for every dollar earned by a man.
What is Family Income Deficit in Dakota County?
Family Income Deficit in Dakota County is $10,021.
Families that are below poverty line in Dakota County earn $10,021 less on average than the poverty threshold level.
What is Inequality or Gini Index in Dakota County?
Inequality or Gini Index in Dakota County is 0.41.
What is the Total Population of Dakota County?
Total Population of Dakota County is 439,179.
What is the Total Male Population of Dakota County?
Total Male Population of Dakota County is 218,368.
What is the Total Female Population of Dakota County?
Total Female Population of Dakota County is 220,811.
What is the Ratio of Males per 100 Females in Dakota County?
There are 98.89 Males per 100 Females in Dakota County.
What is the Ratio of Females per 100 Males in Dakota County?
There are 101.12 Females per 100 Males in Dakota County.
What is the Median Population Age in Dakota County?
Median Population Age in Dakota County is 38.4 Years.
What is the Average Family Size in Dakota County
Average Family Size in Dakota County is 3.1 People.
What is the Average Household Size in Dakota County
Average Household Size in Dakota County is 2.6 People.
How Large is the Labor Force in Dakota County?
There are 249,078 People in the Labor Forcein in Dakota County.
What is the Percentage of People in the Labor Force in Dakota County?
72.1% of People are in the Labor Force in Dakota County.
What is the Unemployment Rate in Dakota County?
Unemployment Rate in Dakota County is 3.7%.