Big Stone County, MN Map & Demographics
Big Stone County Overview
$35,797
PER CAPITA INCOME
$81,836
AVG FAMILY INCOME
$63,024
AVG HOUSEHOLD INCOME
39.6%
WAGE / INCOME GAP [ % ]
60.4¢/ $1
WAGE / INCOME GAP [ $ ]
0.44
INEQUALITY / GINI INDEX
5,161
TOTAL POPULATION
2,618
MALE POPULATION
2,543
FEMALE POPULATION
102.95
MALES / 100 FEMALES
97.14
FEMALES / 100 MALES
47.7
MEDIAN AGE
2.9
AVG FAMILY SIZE
2.2
AVG HOUSEHOLD SIZE
2,409
LABOR FORCE [ PEOPLE ]
58.0%
PERCENT IN LABOR FORCE
2.0%
UNEMPLOYMENT RATE
Big Stone County Area Codes
Income in Big Stone County
Income Overview in Big Stone County
Per Capita Income in Big Stone County is $35,797, while median incomes of families and households are $81,836 and $63,024 respectively.
| Characteristic | Number | Measure |
| Per Capita Income | 5,161 | $35,797 |
| Median Family Income | 1,361 | $81,836 |
| Mean Family Income | 1,361 | $101,439 |
| Median Household Income | 2,242 | $63,024 |
| Mean Household Income | 2,242 | $79,511 |
| Income Deficit | 1,361 | $0 |
| Wage / Income Gap (%) | 5,161 | 39.63% |
| Wage / Income Gap ($) | 5,161 | 60.37¢ per $1 |
| Gini / Inequality Index | 5,161 | 0.44 |
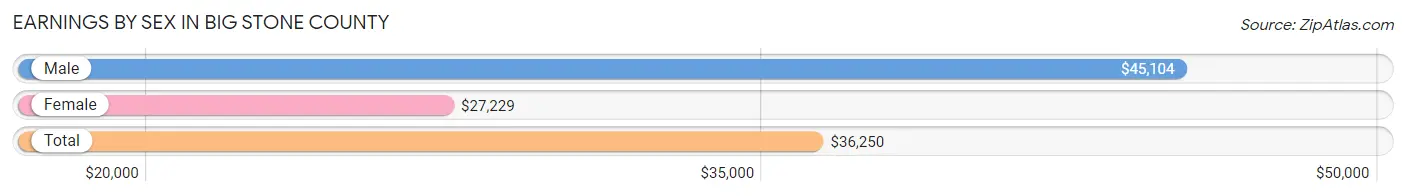
Earnings by Sex in Big Stone County
Average Earnings in Big Stone County are $36,250, $45,104 for men and $27,229 for women, a difference of 39.6%.
| Sex | Number | Average Earnings |
| Male | 1,455 (54.4%) | $45,104 |
| Female | 1,221 (45.6%) | $27,229 |
| Total | 2,676 (100.0%) | $36,250 |
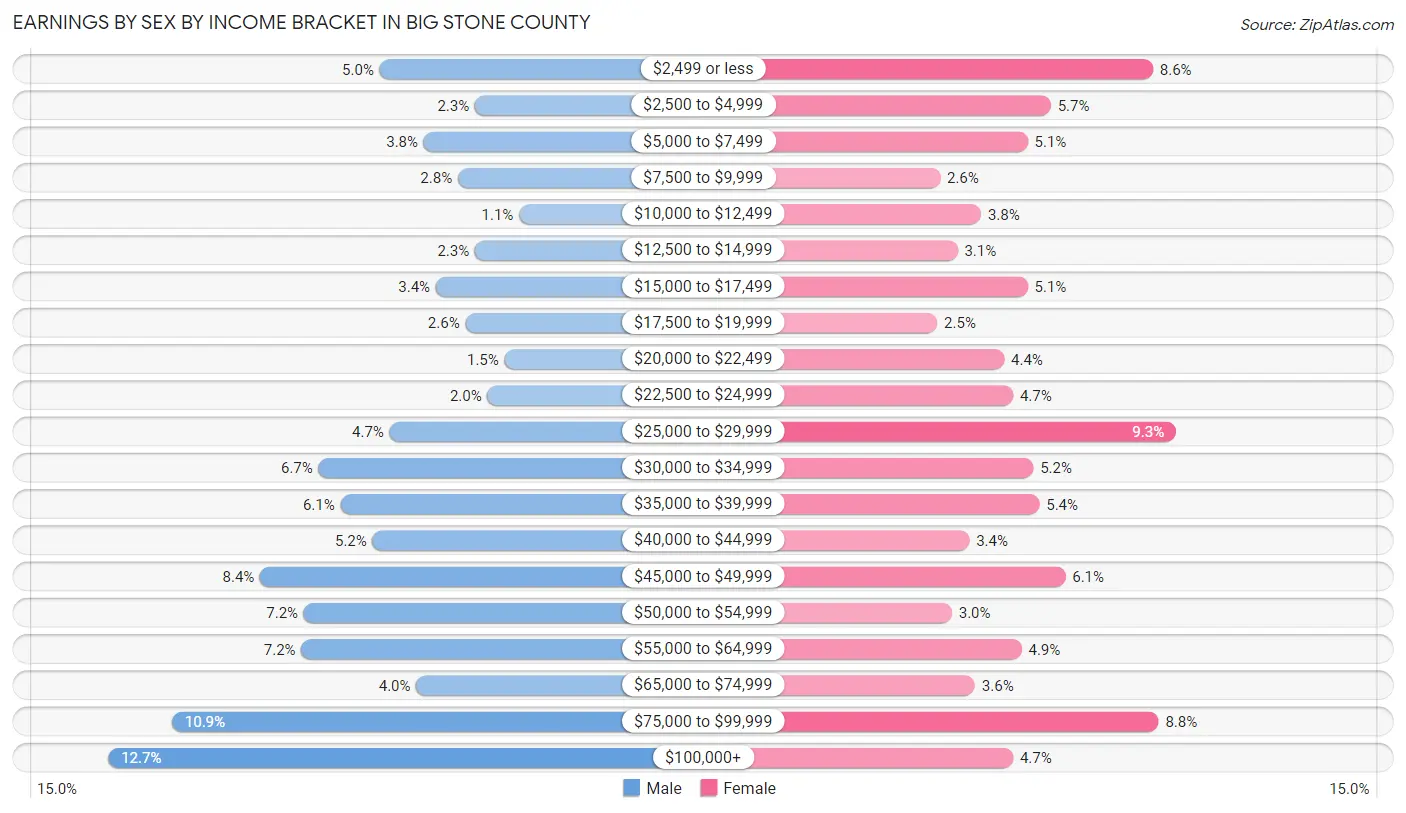
Earnings by Sex by Income Bracket in Big Stone County
The most common earnings brackets in Big Stone County are $100,000+ for men (184 | 12.7%) and $25,000 to $29,999 for women (113 | 9.2%).
| Income | Male | Female |
| $2,499 or less | 73 (5.0%) | 105 (8.6%) |
| $2,500 to $4,999 | 34 (2.3%) | 70 (5.7%) |
| $5,000 to $7,499 | 55 (3.8%) | 62 (5.1%) |
| $7,500 to $9,999 | 41 (2.8%) | 32 (2.6%) |
| $10,000 to $12,499 | 16 (1.1%) | 46 (3.8%) |
| $12,500 to $14,999 | 34 (2.3%) | 38 (3.1%) |
| $15,000 to $17,499 | 50 (3.4%) | 62 (5.1%) |
| $17,500 to $19,999 | 38 (2.6%) | 31 (2.5%) |
| $20,000 to $22,499 | 22 (1.5%) | 54 (4.4%) |
| $22,500 to $24,999 | 29 (2.0%) | 57 (4.7%) |
| $25,000 to $29,999 | 69 (4.7%) | 113 (9.2%) |
| $30,000 to $34,999 | 98 (6.7%) | 64 (5.2%) |
| $35,000 to $39,999 | 89 (6.1%) | 66 (5.4%) |
| $40,000 to $44,999 | 76 (5.2%) | 42 (3.4%) |
| $45,000 to $49,999 | 122 (8.4%) | 75 (6.1%) |
| $50,000 to $54,999 | 104 (7.1%) | 36 (2.9%) |
| $55,000 to $64,999 | 105 (7.2%) | 60 (4.9%) |
| $65,000 to $74,999 | 58 (4.0%) | 44 (3.6%) |
| $75,000 to $99,999 | 158 (10.9%) | 107 (8.8%) |
| $100,000+ | 184 (12.7%) | 57 (4.7%) |
| Total | 1,455 (100.0%) | 1,221 (100.0%) |
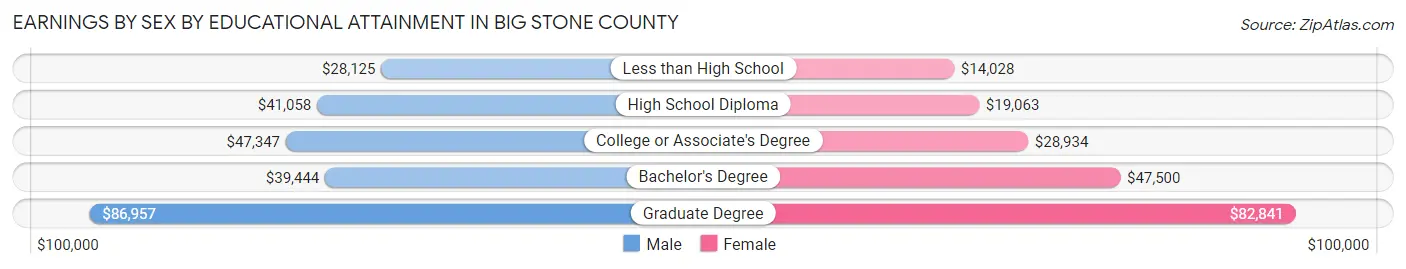
Earnings by Sex by Educational Attainment in Big Stone County
Average earnings in Big Stone County are $46,548 for men and $29,225 for women, a difference of 37.2%. Men with an educational attainment of graduate degree enjoy the highest average annual earnings of $86,957, while those with less than high school education earn the least with $28,125. Women with an educational attainment of graduate degree earn the most with the average annual earnings of $82,841, while those with less than high school education have the smallest earnings of $14,028.
| Educational Attainment | Male Income | Female Income |
| Less than High School | $28,125 | $14,028 |
| High School Diploma | $41,058 | $19,063 |
| College or Associate's Degree | $47,347 | $28,934 |
| Bachelor's Degree | $39,444 | $47,500 |
| Graduate Degree | $86,957 | $82,841 |
| Total | $46,548 | $29,225 |
Family Income in Big Stone County
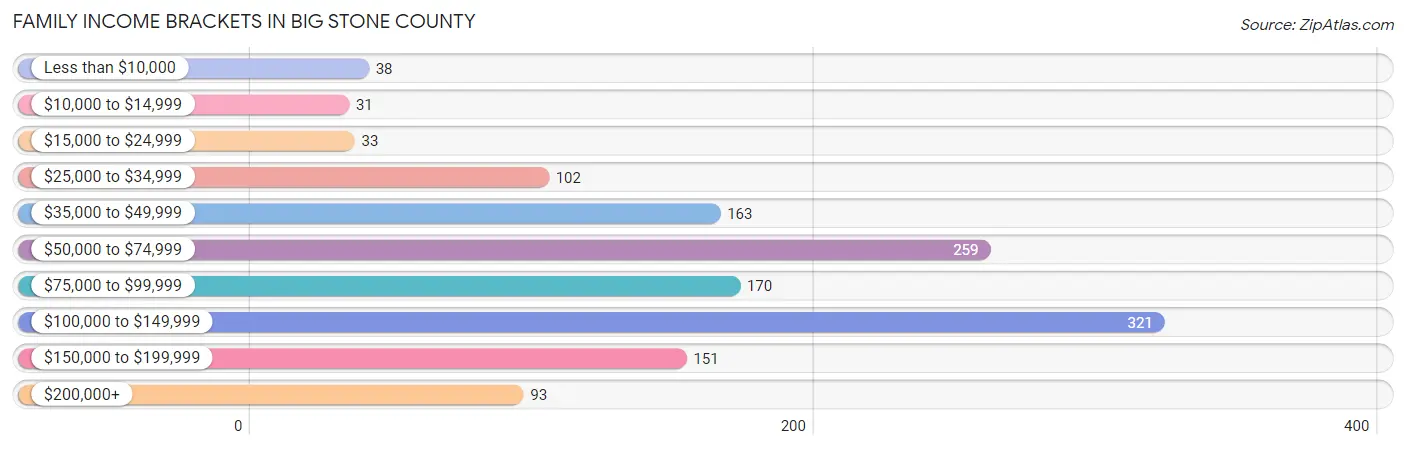
Family Income Brackets in Big Stone County
According to the Big Stone County family income data, there are 321 families falling into the $100,000 to $149,999 income range, which is the most common income bracket and makes up 23.6% of all families. Conversely, the $10,000 to $14,999 income bracket is the least frequent group with only 31 families (2.3%) belonging to this category.
| Income Bracket | # Families | % Families |
| Less than $10,000 | 38 | 2.8% |
| $10,000 to $14,999 | 31 | 2.3% |
| $15,000 to $24,999 | 33 | 2.4% |
| $25,000 to $34,999 | 102 | 7.5% |
| $35,000 to $49,999 | 163 | 12.0% |
| $50,000 to $74,999 | 259 | 19.0% |
| $75,000 to $99,999 | 170 | 12.5% |
| $100,000 to $149,999 | 321 | 23.6% |
| $150,000 to $199,999 | 151 | 11.1% |
| $200,000+ | 93 | 6.8% |
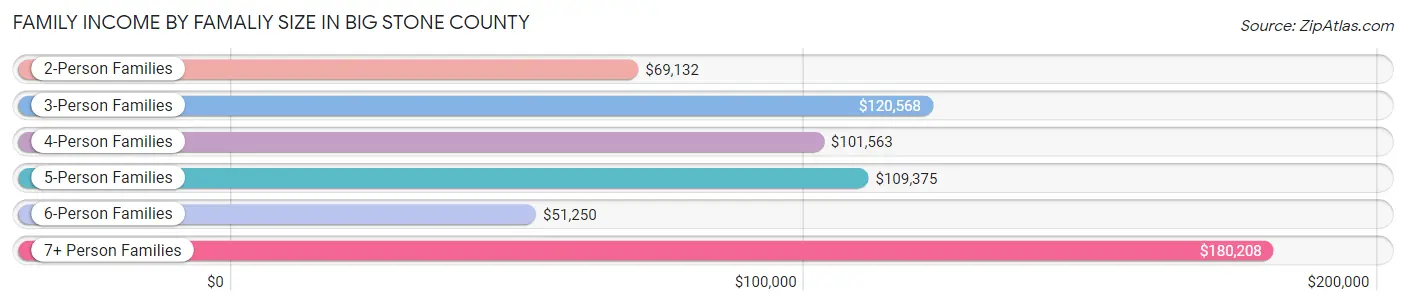
Family Income by Famaliy Size in Big Stone County
7+ person families (15 | 1.1%) account for the highest median family income in Big Stone County with $180,208 per family, while 3-person families (246 | 18.1%) have the highest median income of $40,189 per family member.
| Income Bracket | # Families | Median Income |
| 2-Person Families | 791 (58.1%) | $69,132 |
| 3-Person Families | 246 (18.1%) | $120,568 |
| 4-Person Families | 158 (11.6%) | $101,563 |
| 5-Person Families | 101 (7.4%) | $109,375 |
| 6-Person Families | 50 (3.7%) | $51,250 |
| 7+ Person Families | 15 (1.1%) | $180,208 |
| Total | 1,361 (100.0%) | $81,836 |
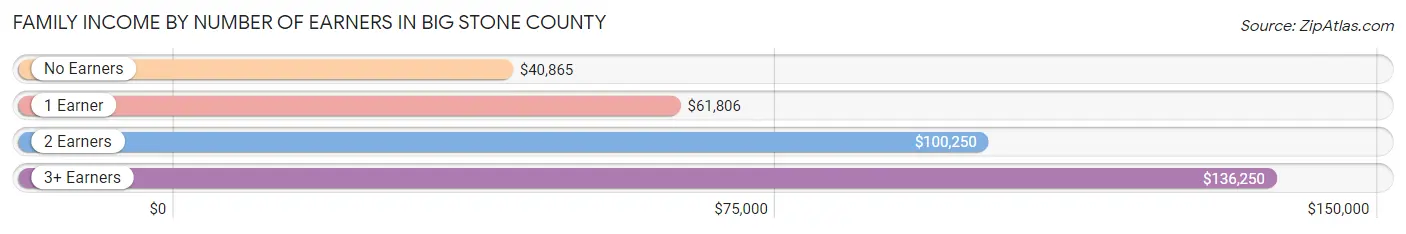
Family Income by Number of Earners in Big Stone County
The median family income in Big Stone County is $81,836, with families comprising 3+ earners (171) having the highest median family income of $136,250, while families with no earners (283) have the lowest median family income of $40,865, accounting for 12.6% and 20.8% of families, respectively.
| Number of Earners | # Families | Median Income |
| No Earners | 283 (20.8%) | $40,865 |
| 1 Earner | 279 (20.5%) | $61,806 |
| 2 Earners | 628 (46.1%) | $100,250 |
| 3+ Earners | 171 (12.6%) | $136,250 |
| Total | 1,361 (100.0%) | $81,836 |
Household Income in Big Stone County
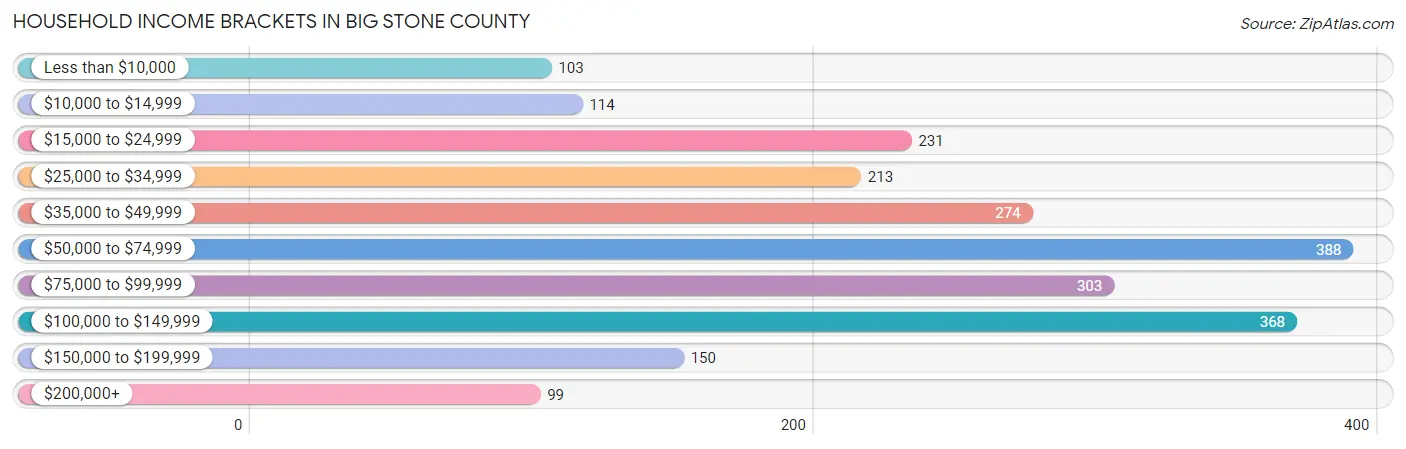
Household Income Brackets in Big Stone County
With 388 households falling in the category, the $50,000 to $74,999 income range is the most frequent in Big Stone County, accounting for 17.3% of all households. In contrast, only 99 households (4.4%) fall into the $200,000+ income bracket, making it the least populous group.
| Income Bracket | # Households | % Households |
| Less than $10,000 | 103 | 4.6% |
| $10,000 to $14,999 | 114 | 5.1% |
| $15,000 to $24,999 | 231 | 10.3% |
| $25,000 to $34,999 | 213 | 9.5% |
| $35,000 to $49,999 | 274 | 12.2% |
| $50,000 to $74,999 | 388 | 17.3% |
| $75,000 to $99,999 | 303 | 13.5% |
| $100,000 to $149,999 | 368 | 16.4% |
| $150,000 to $199,999 | 150 | 6.7% |
| $200,000+ | 99 | 4.4% |
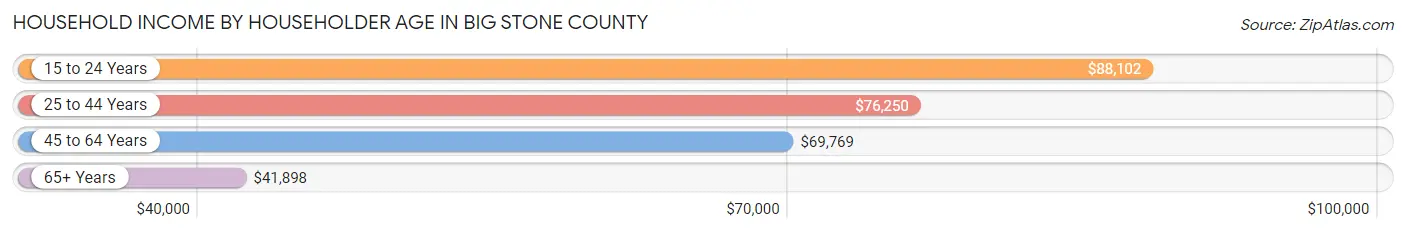
Household Income by Householder Age in Big Stone County
The median household income in Big Stone County is $63,024, with the highest median household income of $88,102 found in the 15 to 24 years age bracket for the primary householder. A total of 85 households (3.8%) fall into this category. Meanwhile, the 65+ years age bracket for the primary householder has the lowest median household income of $41,898, with 813 households (36.3%) in this group.
| Income Bracket | # Households | Median Income |
| 15 to 24 Years | 85 (3.8%) | $88,102 |
| 25 to 44 Years | 551 (24.6%) | $76,250 |
| 45 to 64 Years | 793 (35.4%) | $69,769 |
| 65+ Years | 813 (36.3%) | $41,898 |
| Total | 2,242 (100.0%) | $63,024 |
Poverty in Big Stone County
Income Below Poverty by Sex and Age in Big Stone County
With 9.7% poverty level for males and 11.3% for females among the residents of Big Stone County, 15 year old males and 12 to 14 year old females are the most vulnerable to poverty, with 21 males (42.9%) and 22 females (22.0%) in their respective age groups living below the poverty level.
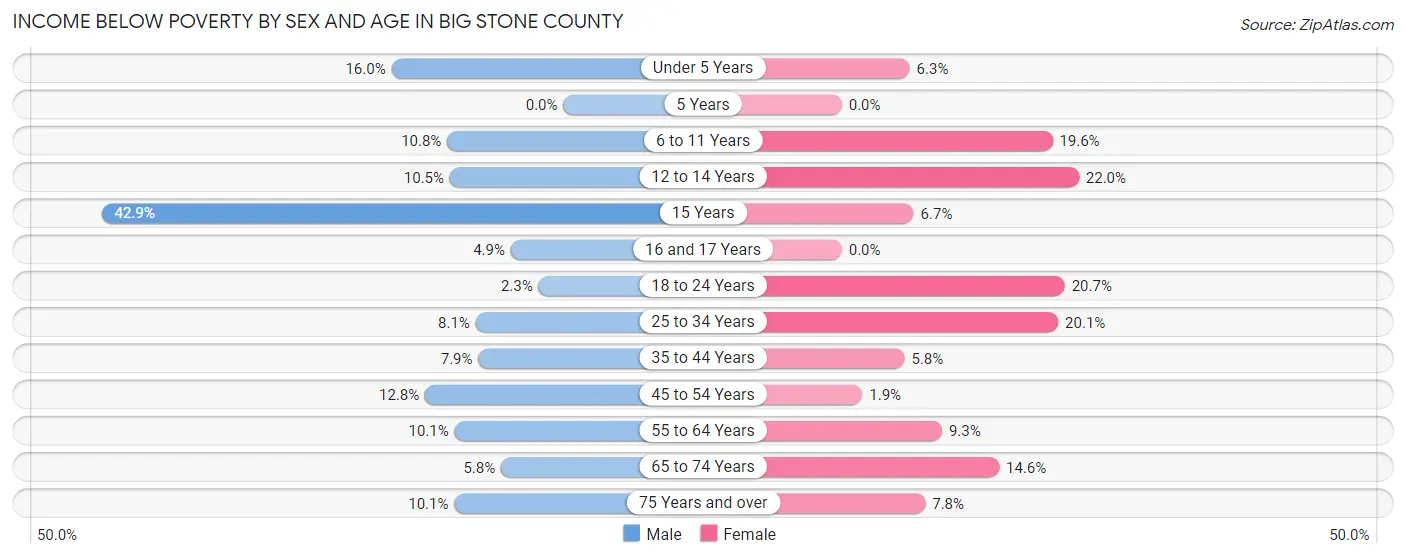
| Age Bracket | Male | Female |
| Under 5 Years | 26 (16.0%) | 8 (6.3%) |
| 5 Years | 0 (0.0%) | 0 (0.0%) |
| 6 to 11 Years | 22 (10.8%) | 35 (19.6%) |
| 12 to 14 Years | 8 (10.5%) | 22 (22.0%) |
| 15 Years | 21 (42.9%) | 3 (6.7%) |
| 16 and 17 Years | 2 (4.9%) | 0 (0.0%) |
| 18 to 24 Years | 4 (2.3%) | 30 (20.7%) |
| 25 to 34 Years | 21 (8.1%) | 49 (20.1%) |
| 35 to 44 Years | 21 (7.9%) | 16 (5.8%) |
| 45 to 54 Years | 34 (12.8%) | 5 (1.9%) |
| 55 to 64 Years | 46 (10.1%) | 36 (9.3%) |
| 65 to 74 Years | 20 (5.8%) | 48 (14.6%) |
| 75 Years and over | 26 (10.1%) | 20 (7.7%) |
| Total | 251 (9.7%) | 272 (11.3%) |
Income Above Poverty by Sex and Age in Big Stone County
According to the poverty statistics in Big Stone County, males aged 5 years and females aged 5 years are the age groups that are most secure financially, with 100.0% of males and 100.0% of females in these age groups living above the poverty line.
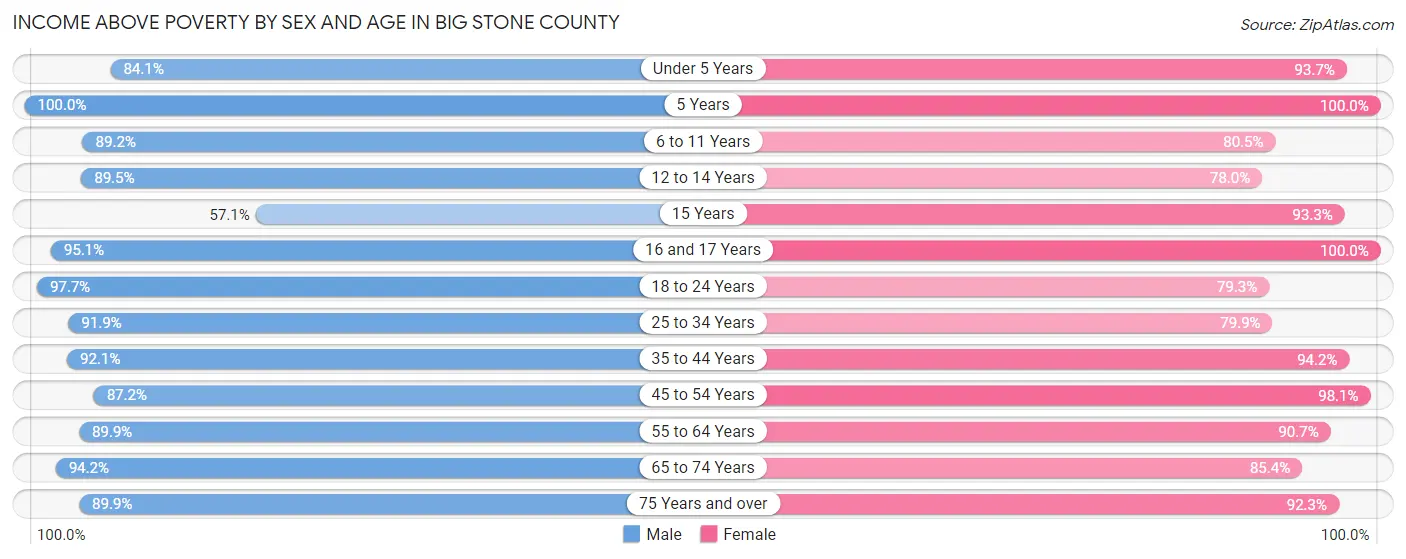
| Age Bracket | Male | Female |
| Under 5 Years | 137 (84.1%) | 119 (93.7%) |
| 5 Years | 25 (100.0%) | 16 (100.0%) |
| 6 to 11 Years | 182 (89.2%) | 144 (80.4%) |
| 12 to 14 Years | 68 (89.5%) | 78 (78.0%) |
| 15 Years | 28 (57.1%) | 42 (93.3%) |
| 16 and 17 Years | 39 (95.1%) | 47 (100.0%) |
| 18 to 24 Years | 170 (97.7%) | 115 (79.3%) |
| 25 to 34 Years | 237 (91.9%) | 195 (79.9%) |
| 35 to 44 Years | 245 (92.1%) | 259 (94.2%) |
| 45 to 54 Years | 231 (87.2%) | 257 (98.1%) |
| 55 to 64 Years | 410 (89.9%) | 351 (90.7%) |
| 65 to 74 Years | 326 (94.2%) | 281 (85.4%) |
| 75 Years and over | 231 (89.9%) | 238 (92.2%) |
| Total | 2,329 (90.3%) | 2,142 (88.7%) |
Income Below Poverty Among Married-Couple Families in Big Stone County
The poverty statistics for married-couple families in Big Stone County show that 7.3% or 90 of the total 1,224 families live below the poverty line. Families with 3 or 4 children have the highest poverty rate of 23.5%, comprising of 28 families. On the other hand, families with 5 or more children have the lowest poverty rate of 0.0%, which includes 0 families.
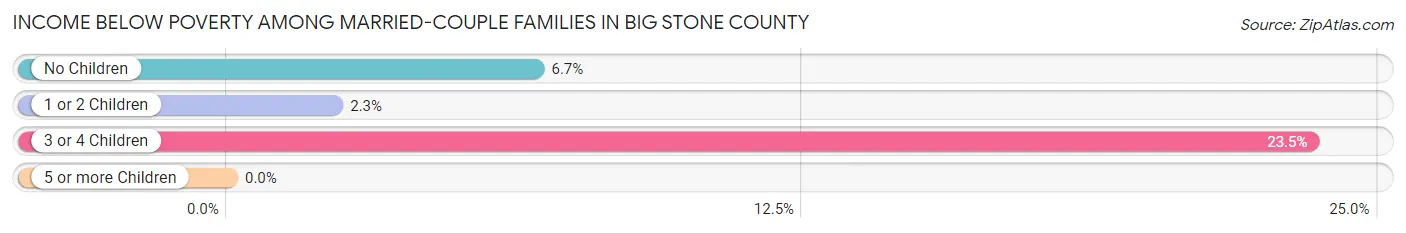
| Children | Above Poverty | Below Poverty |
| No Children | 784 (93.3%) | 56 (6.7%) |
| 1 or 2 Children | 256 (97.7%) | 6 (2.3%) |
| 3 or 4 Children | 91 (76.5%) | 28 (23.5%) |
| 5 or more Children | 3 (100.0%) | 0 (0.0%) |
| Total | 1,134 (92.6%) | 90 (7.3%) |
Income Below Poverty Among Single-Parent Households in Big Stone County
According to the poverty data in Big Stone County, 2.1% or 1 single-father households and 17.8% or 16 single-mother households are living below the poverty line. Among single-father households, those with 1 or 2 children have the highest poverty rate, with 1 households (2.9%) experiencing poverty. Likewise, among single-mother households, those with 3 or 4 children have the highest poverty rate, with 4 households (100.0%) falling below the poverty line.
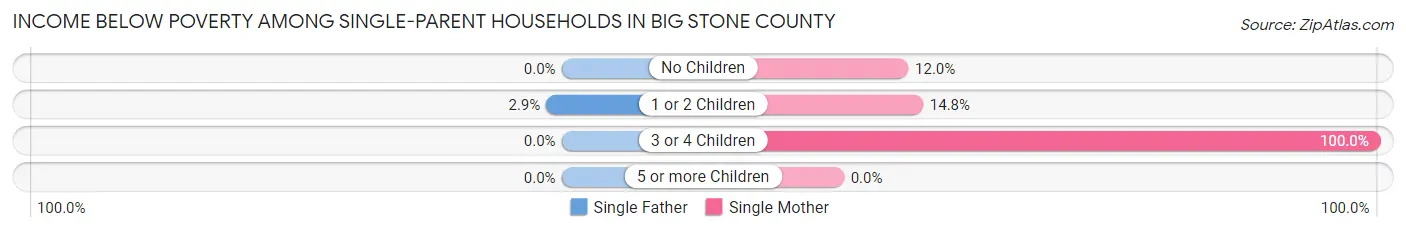
| Children | Single Father | Single Mother |
| No Children | 0 (0.0%) | 3 (12.0%) |
| 1 or 2 Children | 1 (2.9%) | 9 (14.7%) |
| 3 or 4 Children | 0 (0.0%) | 4 (100.0%) |
| 5 or more Children | 0 (0.0%) | 0 (0.0%) |
| Total | 1 (2.1%) | 16 (17.8%) |
Income Below Poverty Among Married-Couple vs Single-Parent Households in Big Stone County
The poverty data for Big Stone County shows that 90 of the married-couple family households (7.3%) and 17 of the single-parent households (12.4%) are living below the poverty level. Within the married-couple family households, those with 3 or 4 children have the highest poverty rate, with 28 households (23.5%) falling below the poverty line. Among the single-parent households, those with 3 or 4 children have the highest poverty rate, with 4 household (100.0%) living below poverty.
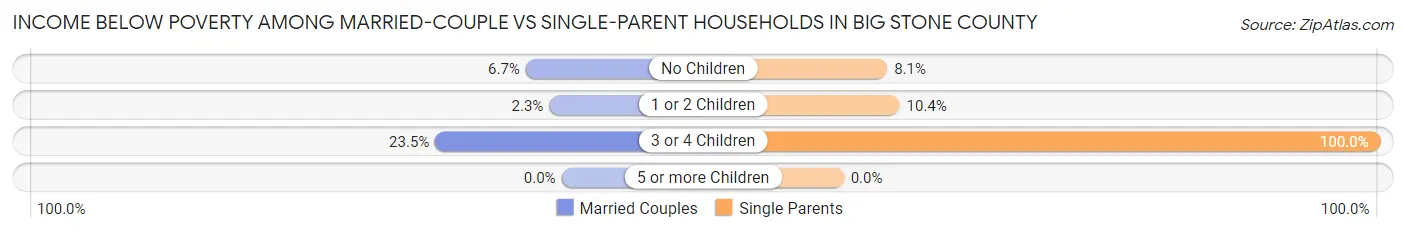
| Children | Married-Couple Families | Single-Parent Households |
| No Children | 56 (6.7%) | 3 (8.1%) |
| 1 or 2 Children | 6 (2.3%) | 10 (10.4%) |
| 3 or 4 Children | 28 (23.5%) | 4 (100.0%) |
| 5 or more Children | 0 (0.0%) | 0 (0.0%) |
| Total | 90 (7.3%) | 17 (12.4%) |
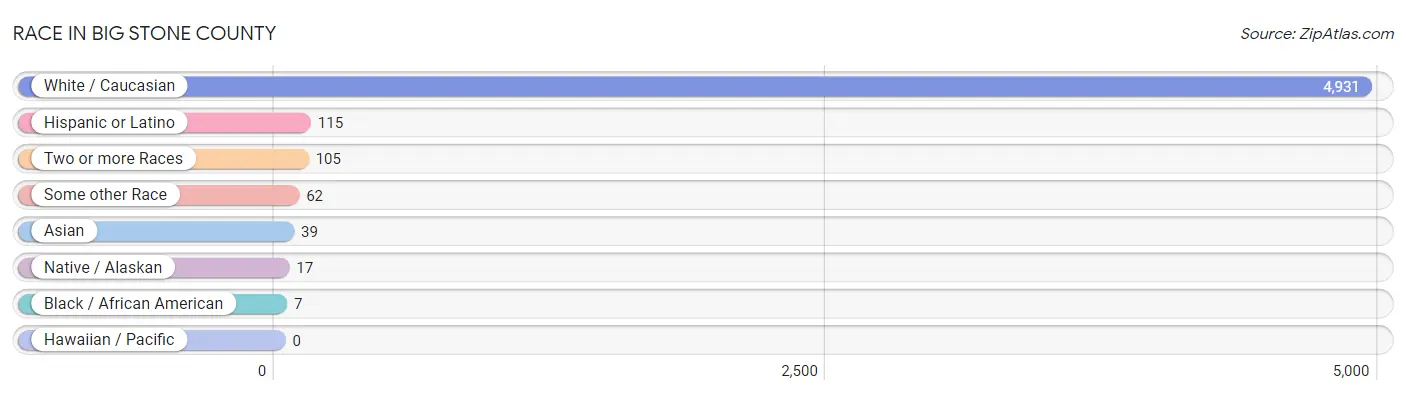
Race in Big Stone County
The most populous races in Big Stone County are White / Caucasian (4,931 | 95.5%), Hispanic or Latino (115 | 2.2%), and Two or more Races (105 | 2.0%).
| Race | # Population | % Population |
| Asian | 39 | 0.8% |
| Black / African American | 7 | 0.1% |
| Hawaiian / Pacific | 0 | 0.0% |
| Hispanic or Latino | 115 | 2.2% |
| Native / Alaskan | 17 | 0.3% |
| White / Caucasian | 4,931 | 95.5% |
| Two or more Races | 105 | 2.0% |
| Some other Race | 62 | 1.2% |
| Total | 5,161 | 100.0% |
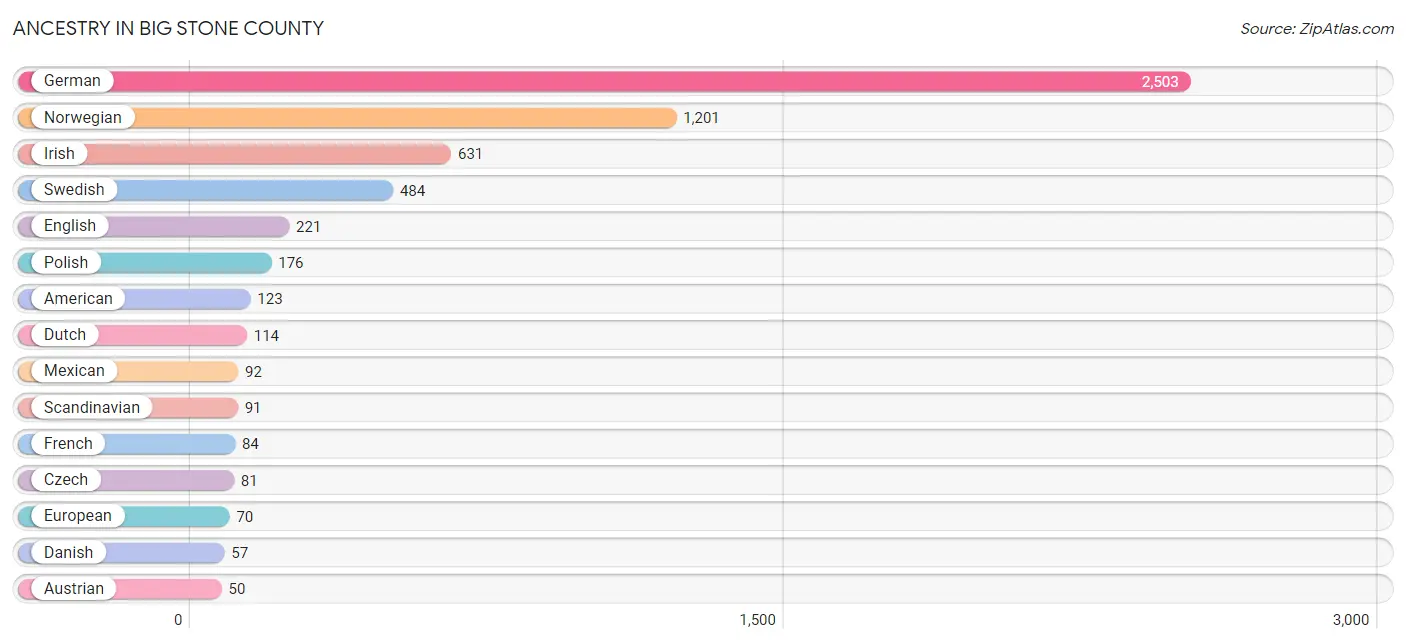
Ancestry in Big Stone County
The most populous ancestries reported in Big Stone County are German (2,503 | 48.5%), Norwegian (1,201 | 23.3%), Irish (631 | 12.2%), Swedish (484 | 9.4%), and English (221 | 4.3%), together accounting for 97.7% of all Big Stone County residents.
| Ancestry | # Population | % Population |
| American | 123 | 2.4% |
| Austrian | 50 | 1.0% |
| Belgian | 8 | 0.2% |
| Bhutanese | 6 | 0.1% |
| Burmese | 5 | 0.1% |
| Chippewa | 10 | 0.2% |
| Cuban | 15 | 0.3% |
| Czech | 81 | 1.6% |
| Danish | 57 | 1.1% |
| Dutch | 114 | 2.2% |
| English | 221 | 4.3% |
| European | 70 | 1.4% |
| Finnish | 44 | 0.9% |
| French | 84 | 1.6% |
| French Canadian | 48 | 0.9% |
| German | 2,503 | 48.5% |
| German Russian | 2 | 0.0% |
| Ghanaian | 12 | 0.2% |
| Hungarian | 9 | 0.2% |
| Indian (Asian) | 4 | 0.1% |
| Irish | 631 | 12.2% |
| Italian | 37 | 0.7% |
| Korean | 27 | 0.5% |
| Latvian | 4 | 0.1% |
| Lithuanian | 7 | 0.1% |
| Mexican | 92 | 1.8% |
| Norwegian | 1,201 | 23.3% |
| Polish | 176 | 3.4% |
| Puerto Rican | 6 | 0.1% |
| Russian | 11 | 0.2% |
| Scandinavian | 91 | 1.8% |
| Scotch-Irish | 6 | 0.1% |
| Scottish | 36 | 0.7% |
| Sioux | 1 | 0.0% |
| Subsaharan African | 12 | 0.2% |
| Swedish | 484 | 9.4% |
| Swiss | 14 | 0.3% |
| Thai | 8 | 0.2% |
| Welsh | 27 | 0.5% |
| Yugoslavian | 5 | 0.1% | View All 40 Rows |
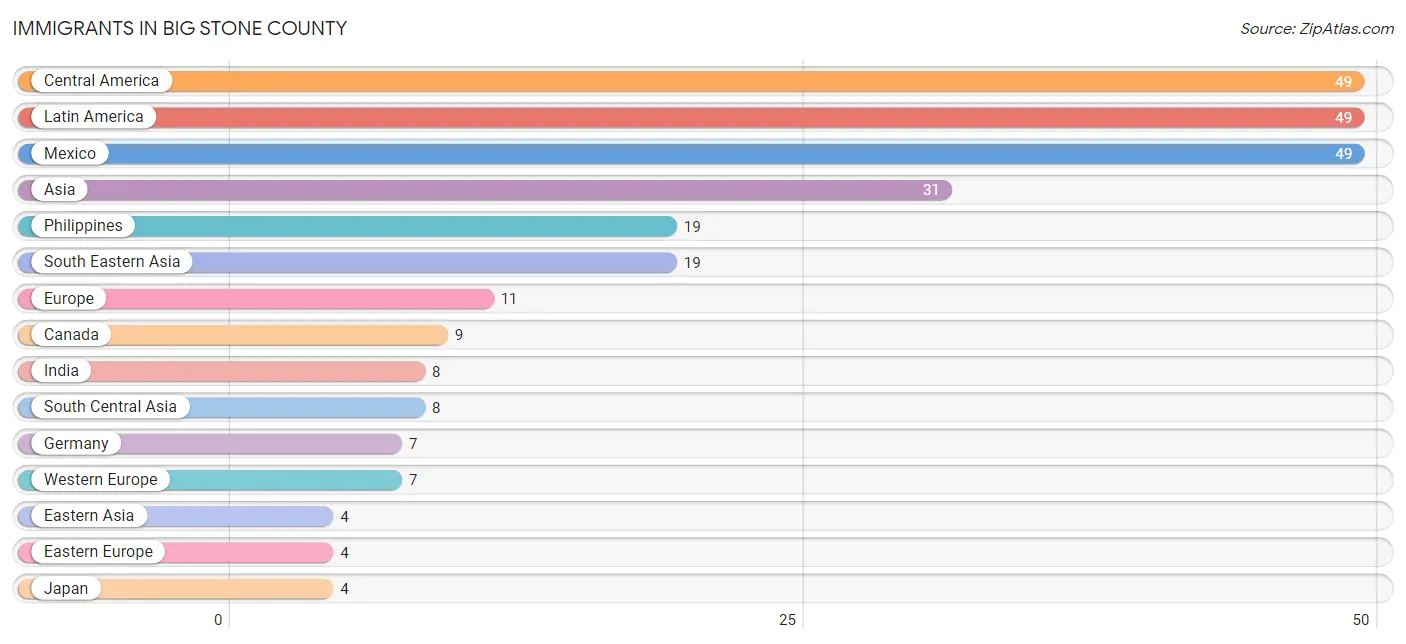
Immigrants in Big Stone County
The most numerous immigrant groups reported in Big Stone County came from Central America (49 | 0.9%), Latin America (49 | 0.9%), Mexico (49 | 0.9%), Asia (31 | 0.6%), and Philippines (19 | 0.4%), together accounting for 3.8% of all Big Stone County residents.
| Immigration Origin | # Population | % Population |
| Asia | 31 | 0.6% |
| Canada | 9 | 0.2% |
| Central America | 49 | 0.9% |
| Eastern Asia | 4 | 0.1% |
| Eastern Europe | 4 | 0.1% |
| Europe | 11 | 0.2% |
| Germany | 7 | 0.1% |
| Hungary | 2 | 0.0% |
| India | 8 | 0.2% |
| Japan | 4 | 0.1% |
| Latin America | 49 | 0.9% |
| Lithuania | 2 | 0.0% |
| Mexico | 49 | 0.9% |
| Philippines | 19 | 0.4% |
| South Central Asia | 8 | 0.2% |
| South Eastern Asia | 19 | 0.4% |
| Western Europe | 7 | 0.1% | View All 17 Rows |
Sex and Age in Big Stone County
Sex and Age in Big Stone County
The most populous age groups in Big Stone County are 60 to 64 Years (258 | 9.9%) for men and 60 to 64 Years (241 | 9.5%) for women.
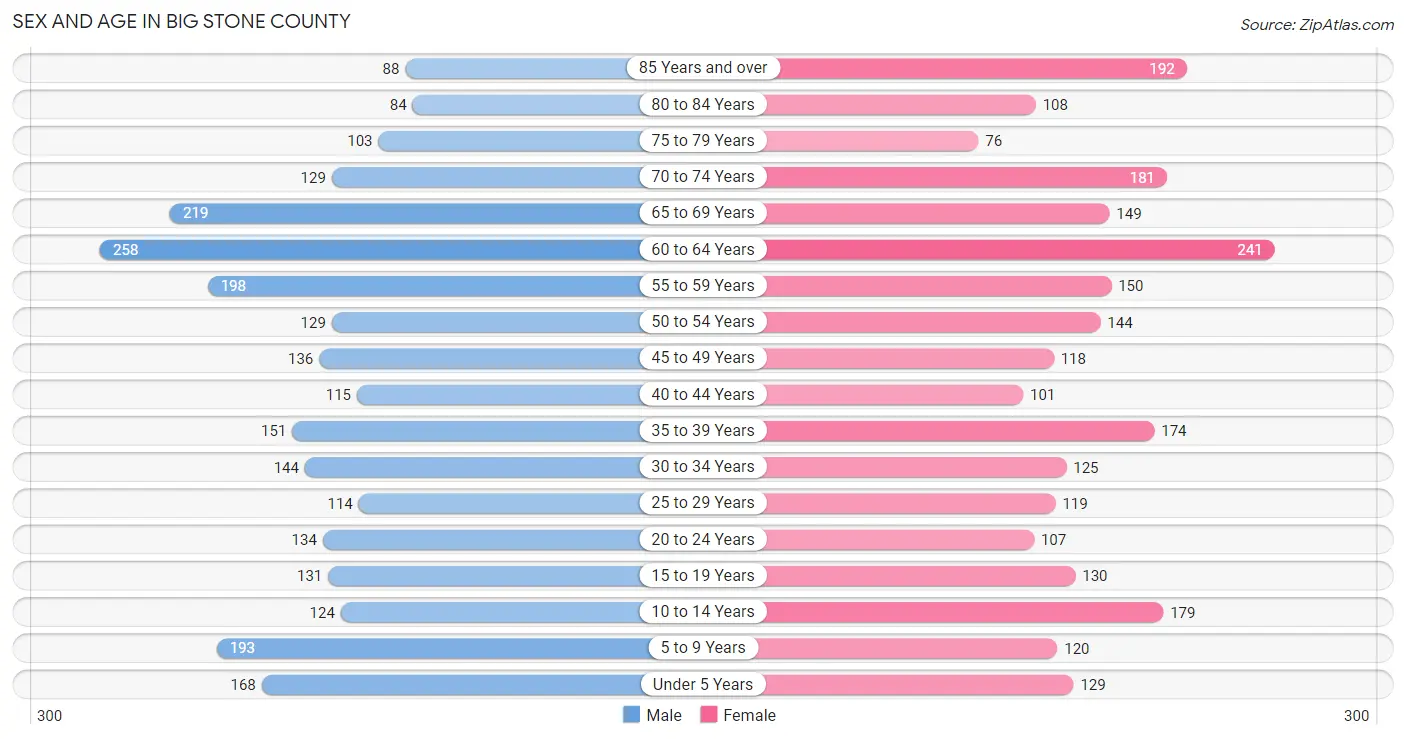
| Age Bracket | Male | Female |
| Under 5 Years | 168 (6.4%) | 129 (5.1%) |
| 5 to 9 Years | 193 (7.4%) | 120 (4.7%) |
| 10 to 14 Years | 124 (4.7%) | 179 (7.0%) |
| 15 to 19 Years | 131 (5.0%) | 130 (5.1%) |
| 20 to 24 Years | 134 (5.1%) | 107 (4.2%) |
| 25 to 29 Years | 114 (4.3%) | 119 (4.7%) |
| 30 to 34 Years | 144 (5.5%) | 125 (4.9%) |
| 35 to 39 Years | 151 (5.8%) | 174 (6.8%) |
| 40 to 44 Years | 115 (4.4%) | 101 (4.0%) |
| 45 to 49 Years | 136 (5.2%) | 118 (4.6%) |
| 50 to 54 Years | 129 (4.9%) | 144 (5.7%) |
| 55 to 59 Years | 198 (7.6%) | 150 (5.9%) |
| 60 to 64 Years | 258 (9.9%) | 241 (9.5%) |
| 65 to 69 Years | 219 (8.4%) | 149 (5.9%) |
| 70 to 74 Years | 129 (4.9%) | 181 (7.1%) |
| 75 to 79 Years | 103 (3.9%) | 76 (3.0%) |
| 80 to 84 Years | 84 (3.2%) | 108 (4.3%) |
| 85 Years and over | 88 (3.4%) | 192 (7.5%) |
| Total | 2,618 (100.0%) | 2,543 (100.0%) |
Families and Households in Big Stone County
Median Family Size in Big Stone County
The median family size in Big Stone County is 2.87 persons per family, with married-couple families (1,224 | 89.9%) accounting for the largest median family size of 2.92 persons per family. On the other hand, single female/mother families (90 | 6.6%) represent the smallest median family size with 2.18 persons per family.
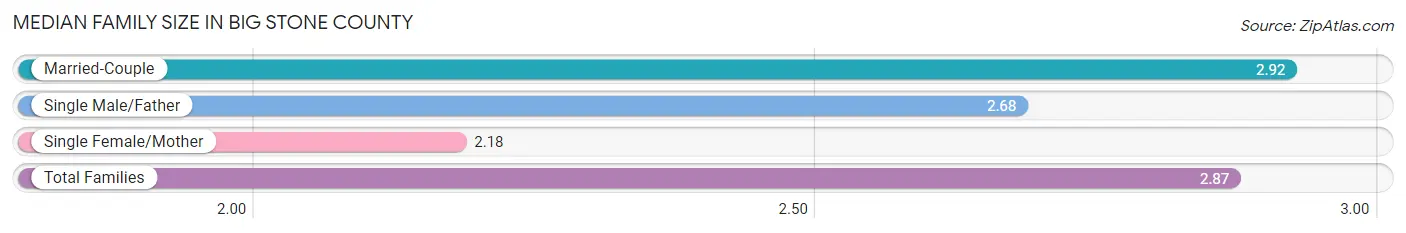
| Family Type | # Families | Family Size |
| Married-Couple | 1,224 (89.9%) | 2.92 |
| Single Male/Father | 47 (3.5%) | 2.68 |
| Single Female/Mother | 90 (6.6%) | 2.18 |
| Total Families | 1,361 (100.0%) | 2.87 |
Median Household Size in Big Stone County
The median household size in Big Stone County is 2.21 persons per household, with single male/father households (47 | 2.1%) accounting for the largest median household size of 3.02 persons per household. non-family households (881 | 39.3%) represent the smallest median household size with 1.12 persons per household.
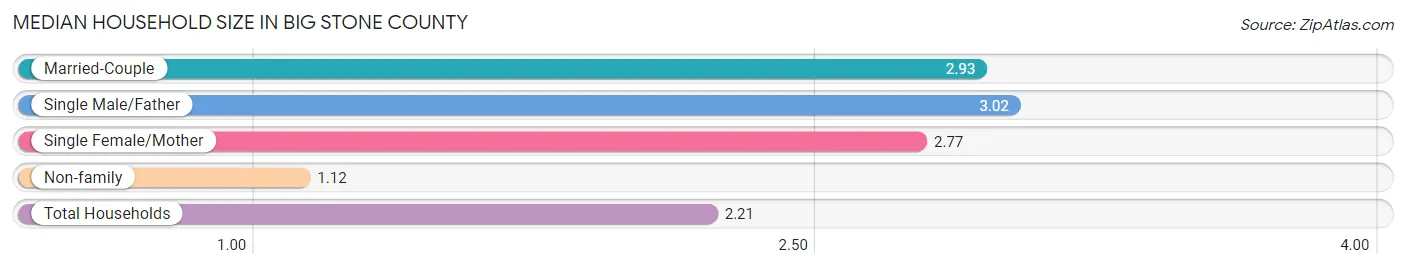
| Household Type | # Households | Household Size |
| Married-Couple | 1,224 (54.6%) | 2.93 |
| Single Male/Father | 47 (2.1%) | 3.02 |
| Single Female/Mother | 90 (4.0%) | 2.77 |
| Non-family | 881 (39.3%) | 1.12 |
| Total Households | 2,242 (100.0%) | 2.21 |
Household Size by Marriage Status in Big Stone County
Out of a total of 2,242 households in Big Stone County, 1,361 (60.7%) are family households, while 881 (39.3%) are nonfamily households. The most numerous type of family households are 2-person households, comprising 753, and the most common type of nonfamily households are 1-person households, comprising 764.
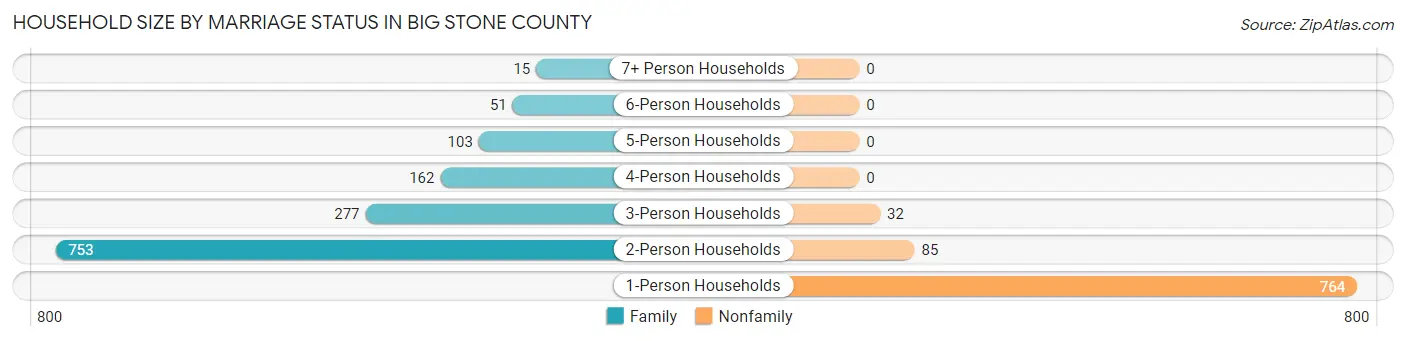
| Household Size | Family Households | Nonfamily Households |
| 1-Person Households | - | 764 (34.1%) |
| 2-Person Households | 753 (33.6%) | 85 (3.8%) |
| 3-Person Households | 277 (12.4%) | 32 (1.4%) |
| 4-Person Households | 162 (7.2%) | 0 (0.0%) |
| 5-Person Households | 103 (4.6%) | 0 (0.0%) |
| 6-Person Households | 51 (2.3%) | 0 (0.0%) |
| 7+ Person Households | 15 (0.7%) | 0 (0.0%) |
| Total | 1,361 (60.7%) | 881 (39.3%) |
Female Fertility in Big Stone County
Fertility by Age in Big Stone County
Average fertility rate in Big Stone County is 68.0 births per 1,000 women. Women in the age bracket of 20 to 34 years have the highest fertility rate with 120.0 births per 1,000 women. Women in the age bracket of 20 to 34 years acount for 66.7% of all women with births.
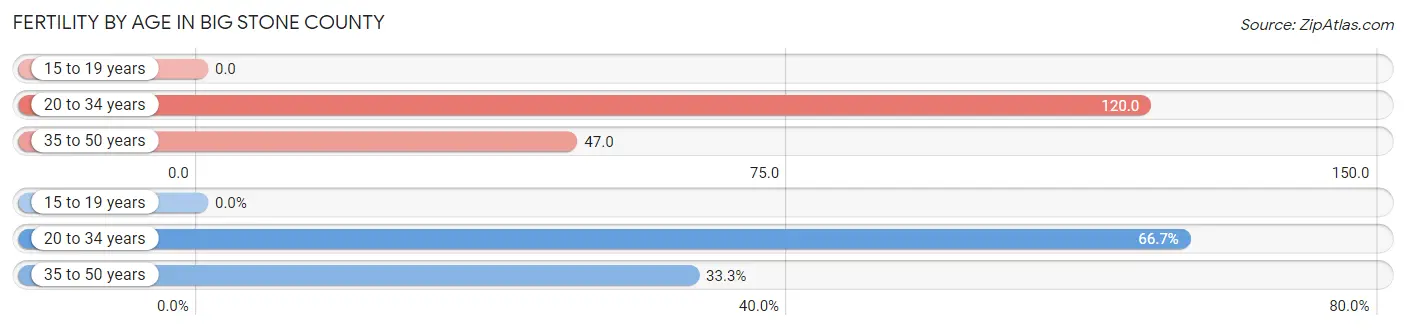
| Age Bracket | Women with Births | Births / 1,000 Women |
| 15 to 19 years | 0 (0.0%) | 0.0 |
| 20 to 34 years | 42 (66.7%) | 120.0 |
| 35 to 50 years | 21 (33.3%) | 47.0 |
| Total | 63 (100.0%) | 68.0 |
Fertility by Age by Marriage Status in Big Stone County
81.0% of women with births (63) in Big Stone County are married. The highest percentage of unmarried women with births falls into 20 to 34 years age bracket with 28.6% of them unmarried at the time of birth, while the lowest percentage of unmarried women with births belong to 35 to 50 years age bracket with 0.0% of them unmarried.
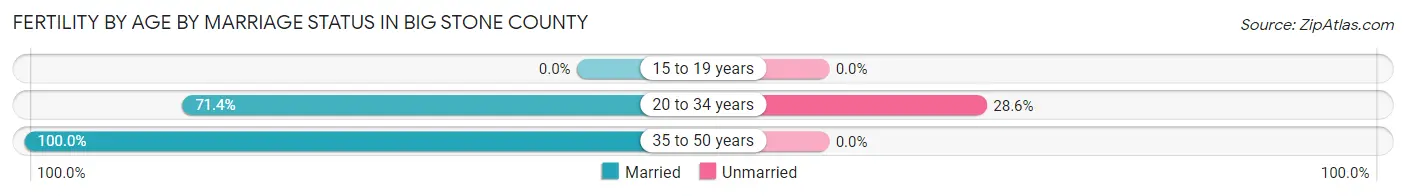
| Age Bracket | Married | Unmarried |
| 15 to 19 years | 0 (0.0%) | 0 (0.0%) |
| 20 to 34 years | 30 (71.4%) | 12 (28.6%) |
| 35 to 50 years | 21 (100.0%) | 0 (0.0%) |
| Total | 51 (80.9%) | 12 (19.1%) |
Fertility by Education in Big Stone County
Average fertility rate in Big Stone County is 68.0 births per 1,000 women. Women with the education attainment of graduate degree have the highest fertility rate of 174.0 births per 1,000 women, while women with the education attainment of bachelor's degree have the lowest fertility at 33.0 births per 1,000 women. Women with the education attainment of college or associate's degree represent 34.9% of all women with births.
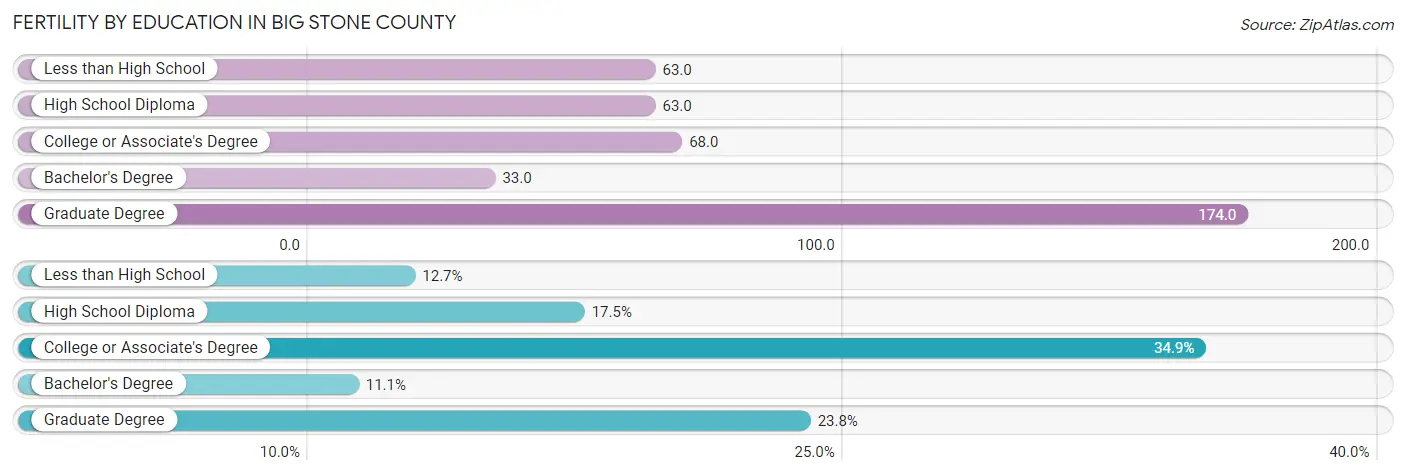
| Educational Attainment | Women with Births | Births / 1,000 Women |
| Less than High School | 8 (12.7%) | 63.0 |
| High School Diploma | 11 (17.5%) | 63.0 |
| College or Associate's Degree | 22 (34.9%) | 68.0 |
| Bachelor's Degree | 7 (11.1%) | 33.0 |
| Graduate Degree | 15 (23.8%) | 174.0 |
| Total | 63 (100.0%) | 68.0 |
Fertility by Education by Marriage Status in Big Stone County
19.1% of women with births in Big Stone County are unmarried. Women with the educational attainment of less than high school are most likely to be married with 100.0% of them married at childbirth, while women with the educational attainment of high school diploma are least likely to be married with 81.8% of them unmarried at childbirth.
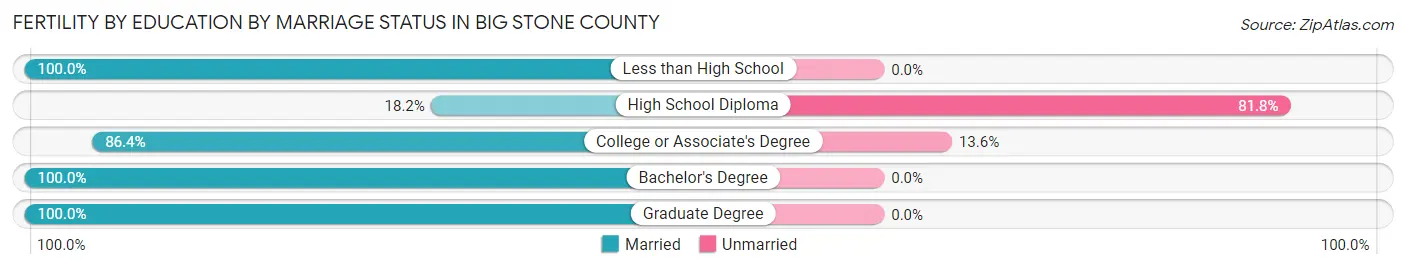
| Educational Attainment | Married | Unmarried |
| Less than High School | 8 (100.0%) | 0 (0.0%) |
| High School Diploma | 2 (18.2%) | 9 (81.8%) |
| College or Associate's Degree | 19 (86.4%) | 3 (13.6%) |
| Bachelor's Degree | 7 (100.0%) | 0 (0.0%) |
| Graduate Degree | 15 (100.0%) | 0 (0.0%) |
| Total | 51 (80.9%) | 12 (19.1%) |
Employment Characteristics in Big Stone County
Employment by Class of Employer in Big Stone County
Among the 2,256 employed individuals in Big Stone County, private company employees (1,211 | 53.7%), not-for-profit organizations (326 | 14.4%), and self-employed (not incorporated) (271 | 12.0%) make up the most common classes of employment.
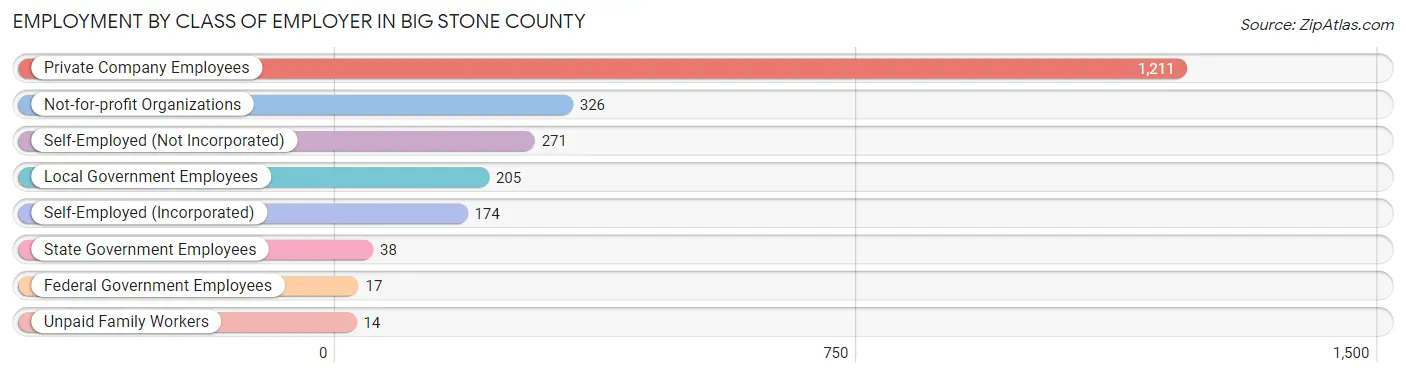
| Employer Class | # Employees | % Employees |
| Private Company Employees | 1,211 | 53.7% |
| Self-Employed (Incorporated) | 174 | 7.7% |
| Self-Employed (Not Incorporated) | 271 | 12.0% |
| Not-for-profit Organizations | 326 | 14.4% |
| Local Government Employees | 205 | 9.1% |
| State Government Employees | 38 | 1.7% |
| Federal Government Employees | 17 | 0.7% |
| Unpaid Family Workers | 14 | 0.6% |
| Total | 2,256 | 100.0% |
Employment Status by Age in Big Stone County
According to the labor force statistics for Big Stone County, out of the total population over 16 years of age (4,154), 58.0% or 2,409 individuals are in the labor force, with 2.0% or 48 of them unemployed. The age group with the highest labor force participation rate is 20 to 24 years, with 94.2% or 227 individuals in the labor force. Within the labor force, the 25 to 29 years age range has the highest percentage of unemployed individuals, with 5.9% or 12 of them being unemployed.
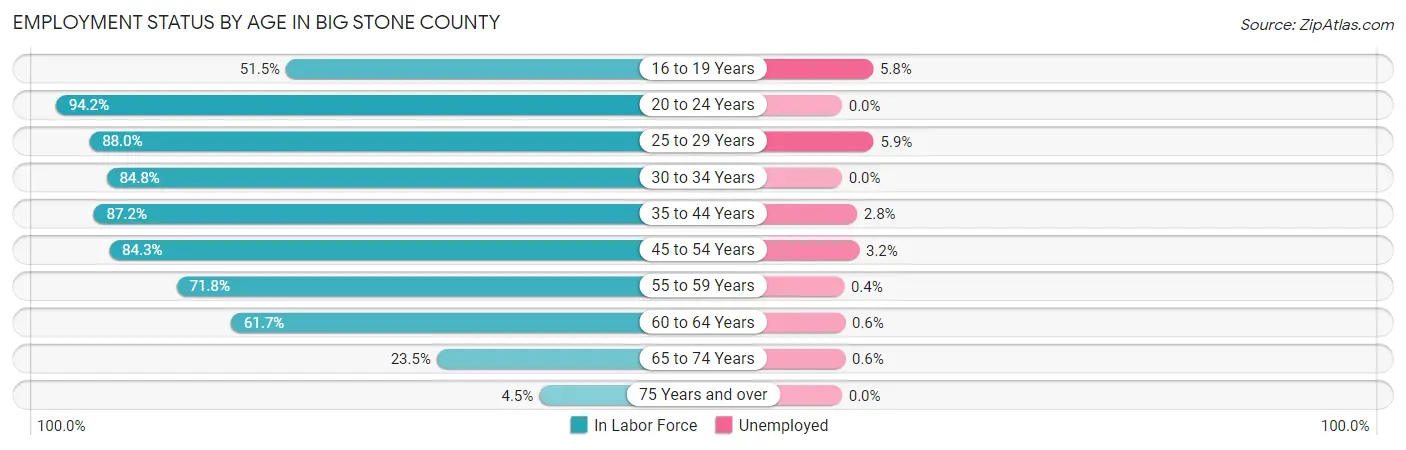
| Age Bracket | In Labor Force | Unemployed |
| 16 to 19 Years | 86 (51.5%) | 5 (5.8%) |
| 20 to 24 Years | 227 (94.2%) | 0 (0.0%) |
| 25 to 29 Years | 205 (88.0%) | 12 (5.9%) |
| 30 to 34 Years | 228 (84.8%) | 0 (0.0%) |
| 35 to 44 Years | 472 (87.2%) | 13 (2.8%) |
| 45 to 54 Years | 444 (84.3%) | 14 (3.2%) |
| 55 to 59 Years | 250 (71.8%) | 1 (0.4%) |
| 60 to 64 Years | 308 (61.7%) | 2 (0.6%) |
| 65 to 74 Years | 159 (23.5%) | 1 (0.6%) |
| 75 Years and over | 29 (4.5%) | 0 (0.0%) |
| Total | 2,409 (58.0%) | 48 (2.0%) |
Employment Status by Educational Attainment in Big Stone County
According to labor force statistics for Big Stone County, 78.9% of individuals (1,907) out of the total population between 25 and 64 years of age (2,417) are in the labor force, with 2.2% or 42 of them being unemployed. The group with the highest labor force participation rate are those with the educational attainment of college / associate degree, with 88.2% or 920 individuals in the labor force. Within the labor force, individuals with college / associate degree education have the highest percentage of unemployment, with 3.2% or 29 of them being unemployed.
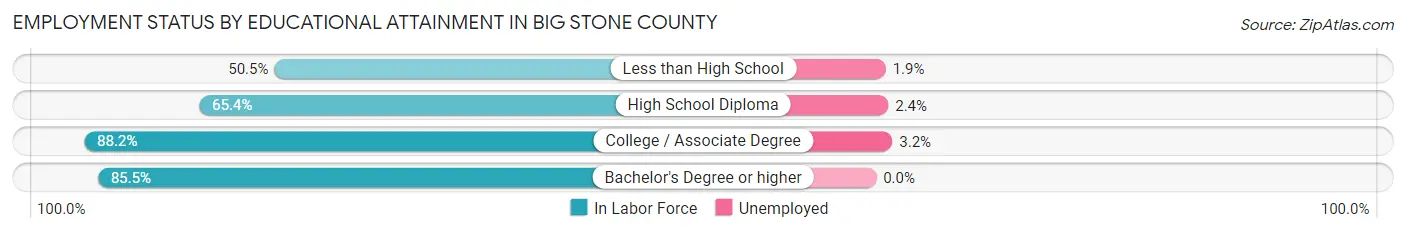
| Educational Attainment | In Labor Force | Unemployed |
| Less than High School | 54 (50.5%) | 2 (1.9%) |
| High School Diploma | 490 (65.4%) | 18 (2.4%) |
| College / Associate Degree | 920 (88.2%) | 33 (3.2%) |
| Bachelor's Degree or higher | 443 (85.5%) | 0 (0.0%) |
| Total | 1,907 (78.9%) | 53 (2.2%) |
Employment Occupations by Sex in Big Stone County
Management, Business, Science and Arts Occupations
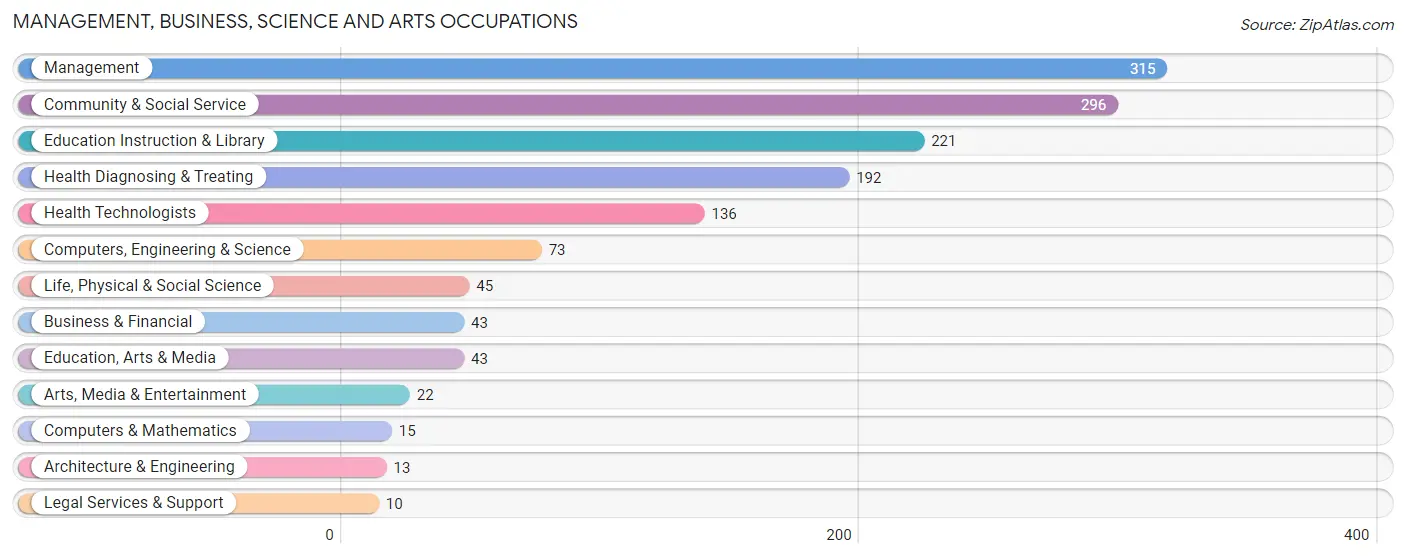
The most common Management, Business, Science and Arts occupations in Big Stone County are Management (315 | 13.4%), Community & Social Service (296 | 12.5%), Education Instruction & Library (221 | 9.4%), Health Diagnosing & Treating (192 | 8.1%), and Health Technologists (136 | 5.8%).
Management, Business, Science and Arts Occupations by Sex
Within the Management, Business, Science and Arts occupations in Big Stone County, the most male-oriented occupations are Computers & Mathematics (93.3%), Computers, Engineering & Science (89.0%), and Life, Physical & Social Science (88.9%), while the most female-oriented occupations are Legal Services & Support (100.0%), Business & Financial (88.4%), and Health Diagnosing & Treating (78.6%).
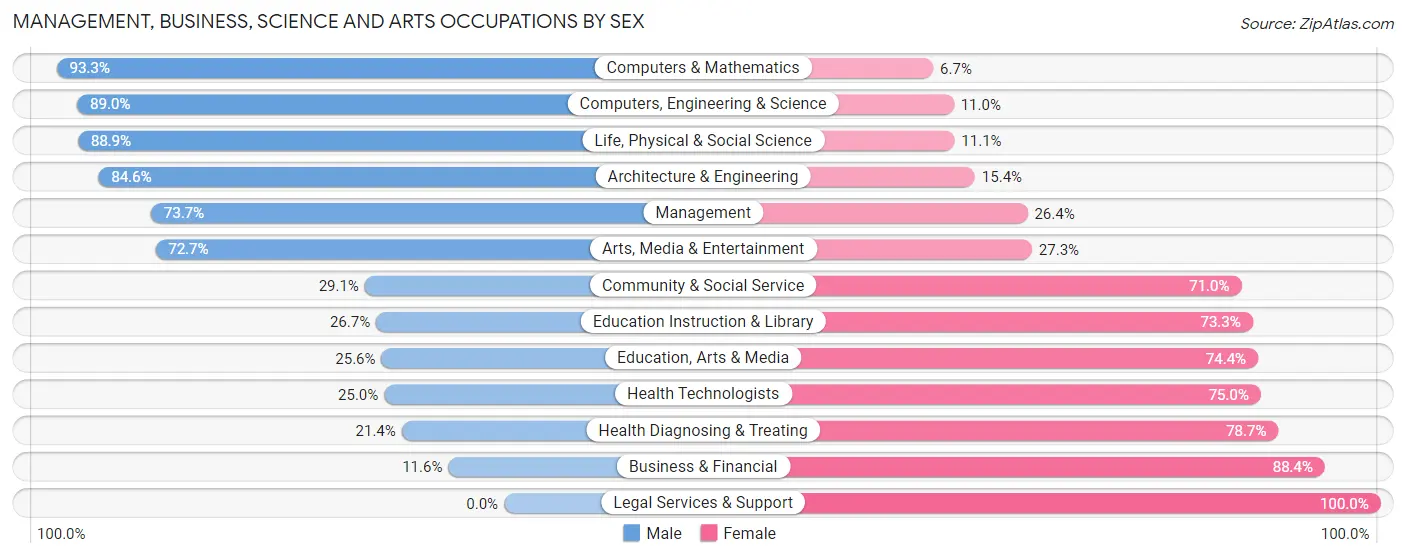
| Occupation | Male | Female |
| Management | 232 (73.7%) | 83 (26.4%) |
| Business & Financial | 5 (11.6%) | 38 (88.4%) |
| Computers, Engineering & Science | 65 (89.0%) | 8 (11.0%) |
| Computers & Mathematics | 14 (93.3%) | 1 (6.7%) |
| Architecture & Engineering | 11 (84.6%) | 2 (15.4%) |
| Life, Physical & Social Science | 40 (88.9%) | 5 (11.1%) |
| Community & Social Service | 86 (29.0%) | 210 (71.0%) |
| Education, Arts & Media | 11 (25.6%) | 32 (74.4%) |
| Legal Services & Support | 0 (0.0%) | 10 (100.0%) |
| Education Instruction & Library | 59 (26.7%) | 162 (73.3%) |
| Arts, Media & Entertainment | 16 (72.7%) | 6 (27.3%) |
| Health Diagnosing & Treating | 41 (21.3%) | 151 (78.6%) |
| Health Technologists | 34 (25.0%) | 102 (75.0%) |
| Total (Category) | 429 (46.7%) | 490 (53.3%) |
| Total (Overall) | 1,296 (54.9%) | 1,064 (45.1%) |
Services Occupations
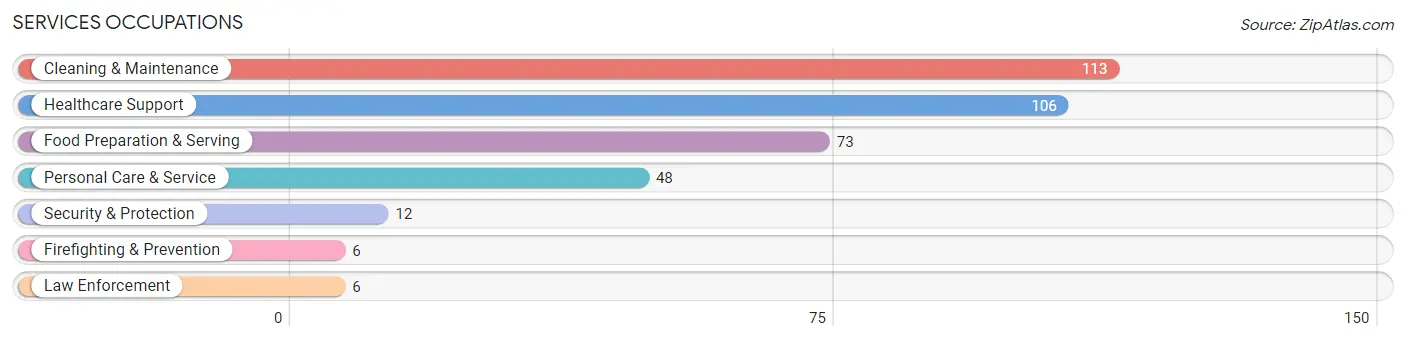
The most common Services occupations in Big Stone County are Cleaning & Maintenance (113 | 4.8%), Healthcare Support (106 | 4.5%), Food Preparation & Serving (73 | 3.1%), Personal Care & Service (48 | 2.0%), and Security & Protection (12 | 0.5%).
Services Occupations by Sex
Within the Services occupations in Big Stone County, the most male-oriented occupations are Law Enforcement (100.0%), Security & Protection (83.3%), and Firefighting & Prevention (66.7%), while the most female-oriented occupations are Healthcare Support (100.0%), Personal Care & Service (77.1%), and Food Preparation & Serving (76.7%).
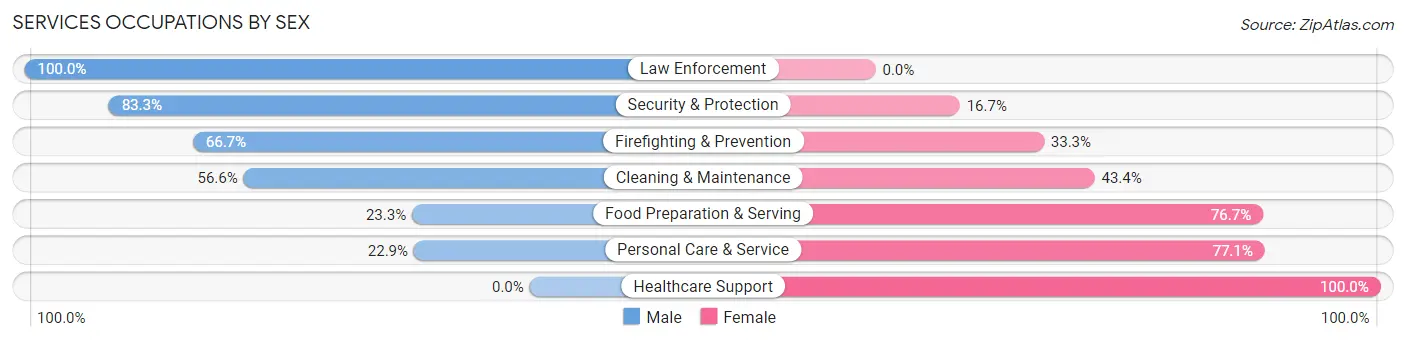
| Occupation | Male | Female |
| Healthcare Support | 0 (0.0%) | 106 (100.0%) |
| Security & Protection | 10 (83.3%) | 2 (16.7%) |
| Firefighting & Prevention | 4 (66.7%) | 2 (33.3%) |
| Law Enforcement | 6 (100.0%) | 0 (0.0%) |
| Food Preparation & Serving | 17 (23.3%) | 56 (76.7%) |
| Cleaning & Maintenance | 64 (56.6%) | 49 (43.4%) |
| Personal Care & Service | 11 (22.9%) | 37 (77.1%) |
| Total (Category) | 102 (29.0%) | 250 (71.0%) |
| Total (Overall) | 1,296 (54.9%) | 1,064 (45.1%) |
Sales and Office Occupations
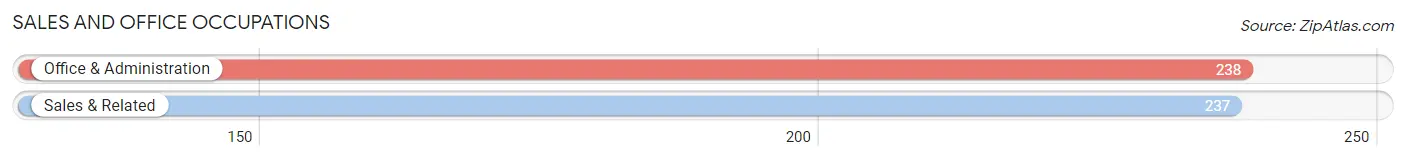
The most common Sales and Office occupations in Big Stone County are Office & Administration (238 | 10.1%), and Sales & Related (237 | 10.0%).
Sales and Office Occupations by Sex
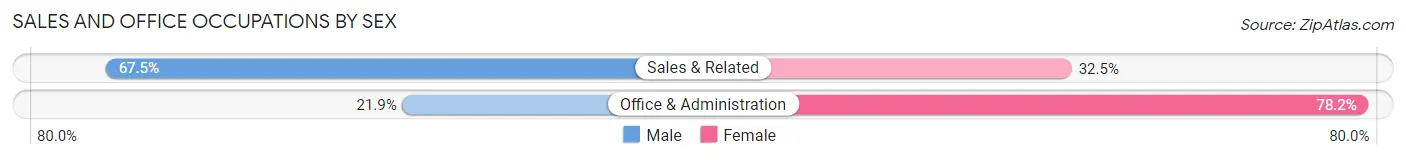
| Occupation | Male | Female |
| Sales & Related | 160 (67.5%) | 77 (32.5%) |
| Office & Administration | 52 (21.8%) | 186 (78.1%) |
| Total (Category) | 212 (44.6%) | 263 (55.4%) |
| Total (Overall) | 1,296 (54.9%) | 1,064 (45.1%) |
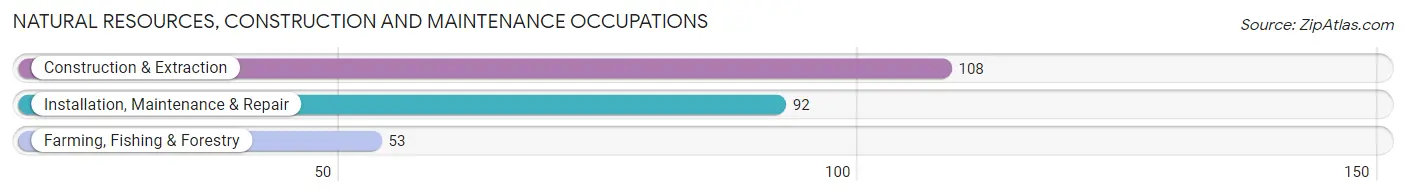
Natural Resources, Construction and Maintenance Occupations
The most common Natural Resources, Construction and Maintenance occupations in Big Stone County are Construction & Extraction (108 | 4.6%), Installation, Maintenance & Repair (92 | 3.9%), and Farming, Fishing & Forestry (53 | 2.2%).
Natural Resources, Construction and Maintenance Occupations by Sex
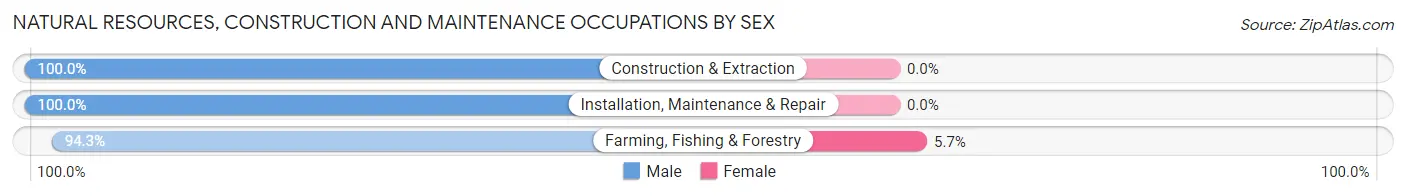
| Occupation | Male | Female |
| Farming, Fishing & Forestry | 50 (94.3%) | 3 (5.7%) |
| Construction & Extraction | 108 (100.0%) | 0 (0.0%) |
| Installation, Maintenance & Repair | 92 (100.0%) | 0 (0.0%) |
| Total (Category) | 250 (98.8%) | 3 (1.2%) |
| Total (Overall) | 1,296 (54.9%) | 1,064 (45.1%) |
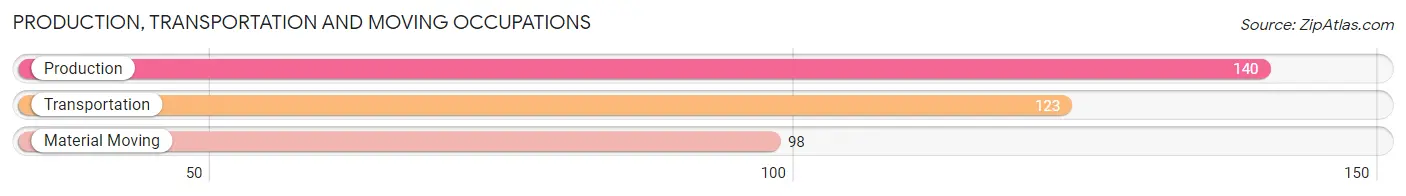
Production, Transportation and Moving Occupations
The most common Production, Transportation and Moving occupations in Big Stone County are Production (140 | 5.9%), Transportation (123 | 5.2%), and Material Moving (98 | 4.2%).
Production, Transportation and Moving Occupations by Sex
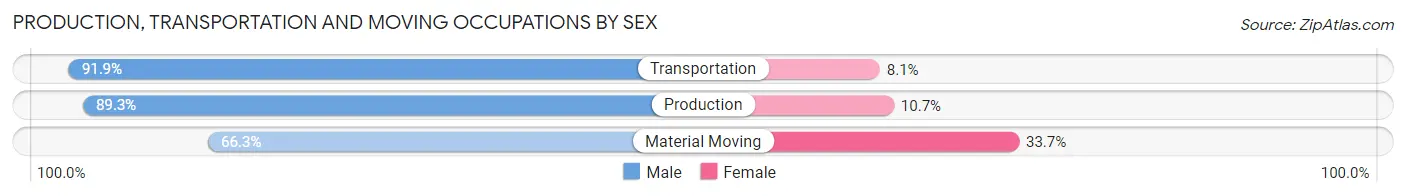
| Occupation | Male | Female |
| Production | 125 (89.3%) | 15 (10.7%) |
| Transportation | 113 (91.9%) | 10 (8.1%) |
| Material Moving | 65 (66.3%) | 33 (33.7%) |
| Total (Category) | 303 (83.9%) | 58 (16.1%) |
| Total (Overall) | 1,296 (54.9%) | 1,064 (45.1%) |
Employment Industries by Sex in Big Stone County
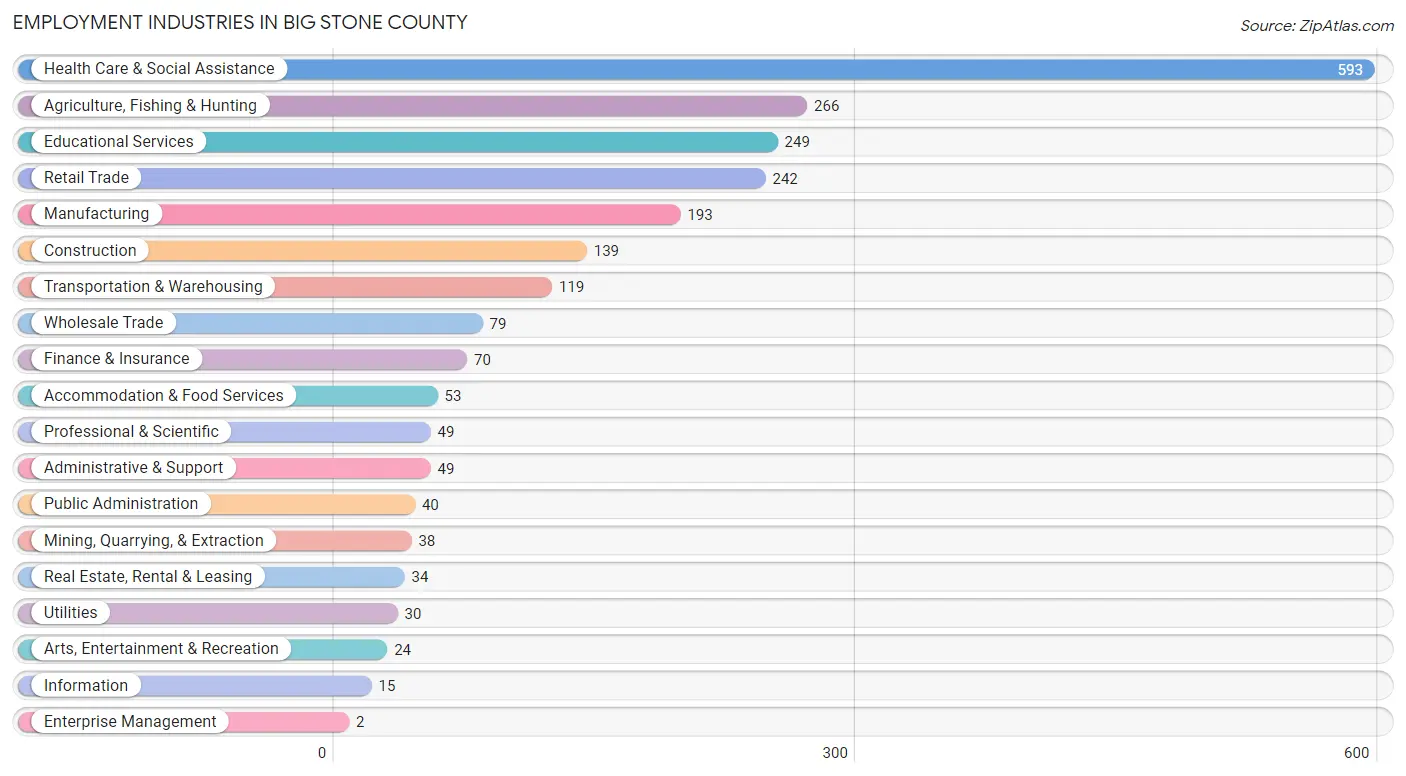
Employment Industries in Big Stone County
The major employment industries in Big Stone County include Health Care & Social Assistance (593 | 25.1%), Agriculture, Fishing & Hunting (266 | 11.3%), Educational Services (249 | 10.5%), Retail Trade (242 | 10.2%), and Manufacturing (193 | 8.2%).
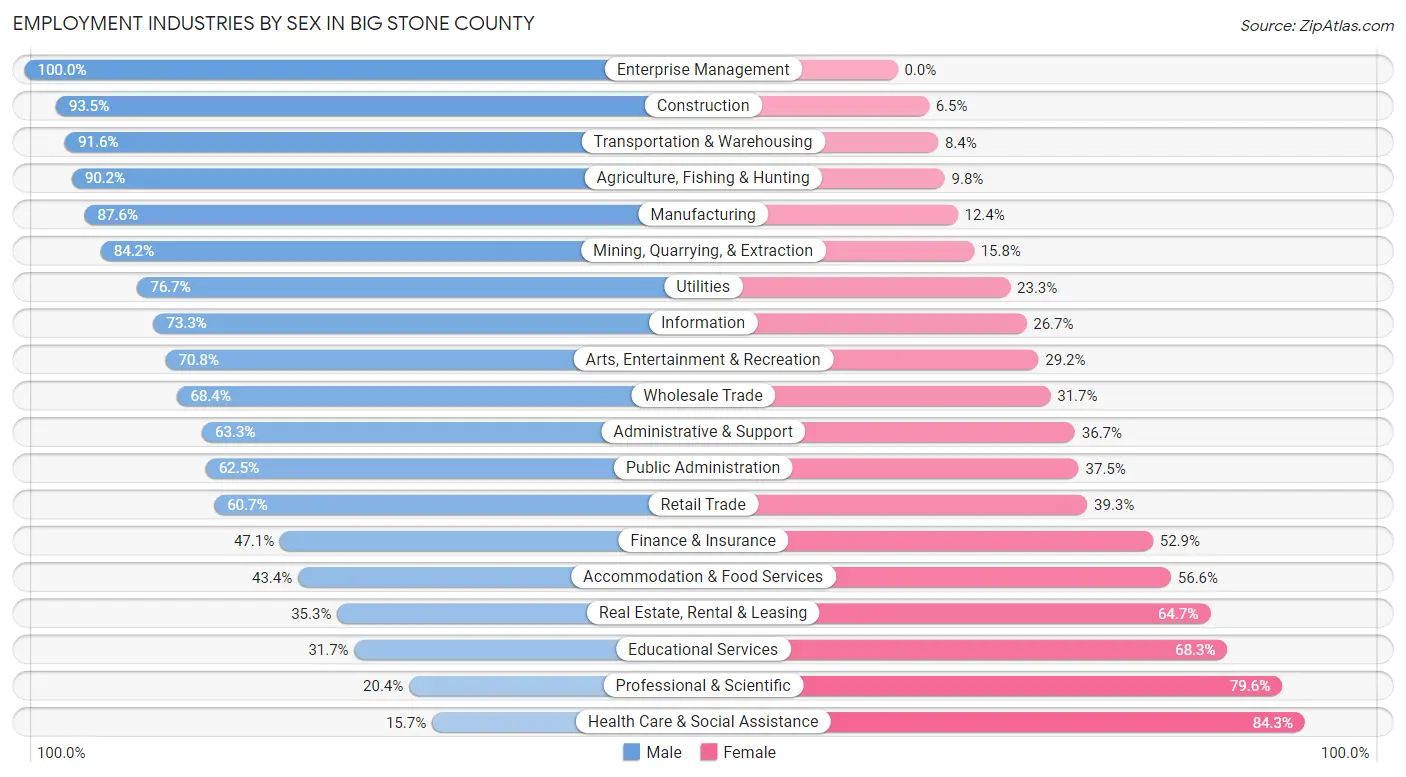
Employment Industries by Sex in Big Stone County
The Big Stone County industries that see more men than women are Enterprise Management (100.0%), Construction (93.5%), and Transportation & Warehousing (91.6%), whereas the industries that tend to have a higher number of women are Health Care & Social Assistance (84.3%), Professional & Scientific (79.6%), and Educational Services (68.3%).
| Industry | Male | Female |
| Agriculture, Fishing & Hunting | 240 (90.2%) | 26 (9.8%) |
| Mining, Quarrying, & Extraction | 32 (84.2%) | 6 (15.8%) |
| Construction | 130 (93.5%) | 9 (6.5%) |
| Manufacturing | 169 (87.6%) | 24 (12.4%) |
| Wholesale Trade | 54 (68.3%) | 25 (31.7%) |
| Retail Trade | 147 (60.7%) | 95 (39.3%) |
| Transportation & Warehousing | 109 (91.6%) | 10 (8.4%) |
| Utilities | 23 (76.7%) | 7 (23.3%) |
| Information | 11 (73.3%) | 4 (26.7%) |
| Finance & Insurance | 33 (47.1%) | 37 (52.9%) |
| Real Estate, Rental & Leasing | 12 (35.3%) | 22 (64.7%) |
| Professional & Scientific | 10 (20.4%) | 39 (79.6%) |
| Enterprise Management | 2 (100.0%) | 0 (0.0%) |
| Administrative & Support | 31 (63.3%) | 18 (36.7%) |
| Educational Services | 79 (31.7%) | 170 (68.3%) |
| Health Care & Social Assistance | 93 (15.7%) | 500 (84.3%) |
| Arts, Entertainment & Recreation | 17 (70.8%) | 7 (29.2%) |
| Accommodation & Food Services | 23 (43.4%) | 30 (56.6%) |
| Public Administration | 25 (62.5%) | 15 (37.5%) |
| Total | 1,296 (54.9%) | 1,064 (45.1%) |
Education in Big Stone County
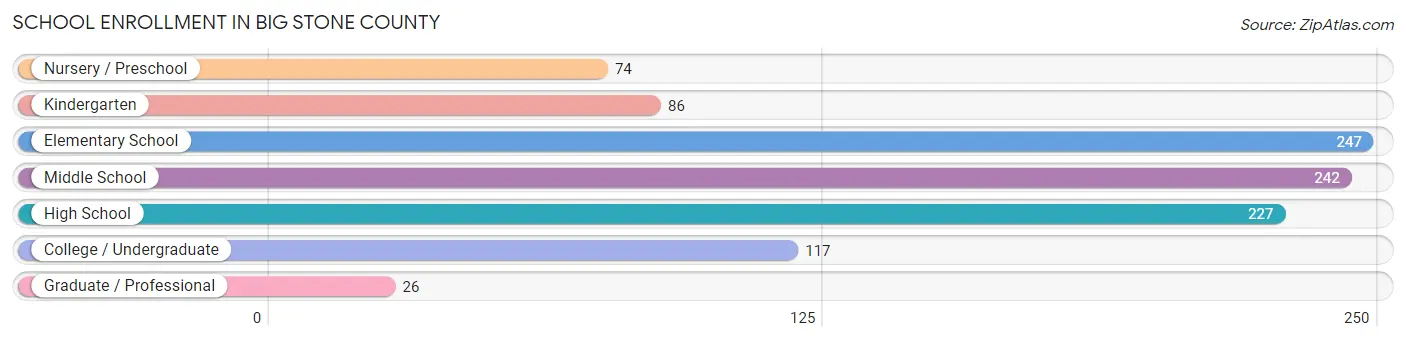
School Enrollment in Big Stone County
The most common levels of schooling among the 1,019 students in Big Stone County are elementary school (247 | 24.2%), middle school (242 | 23.7%), and high school (227 | 22.3%).
| School Level | # Students | % Students |
| Nursery / Preschool | 74 | 7.3% |
| Kindergarten | 86 | 8.4% |
| Elementary School | 247 | 24.2% |
| Middle School | 242 | 23.7% |
| High School | 227 | 22.3% |
| College / Undergraduate | 117 | 11.5% |
| Graduate / Professional | 26 | 2.5% |
| Total | 1,019 | 100.0% |
School Enrollment by Age by Funding Source in Big Stone County
Out of a total of 1,019 students who are enrolled in schools in Big Stone County, 56 (5.5%) attend a private institution, while the remaining 963 (94.5%) are enrolled in public schools. The age group of 3 to 4 year olds has the highest likelihood of being enrolled in private schools, with 6 (9.4% in the age bracket) enrolled. Conversely, the age group of 25 to 34 year olds has the lowest likelihood of being enrolled in a private school, with 6 (100.0% in the age bracket) attending a public institution.
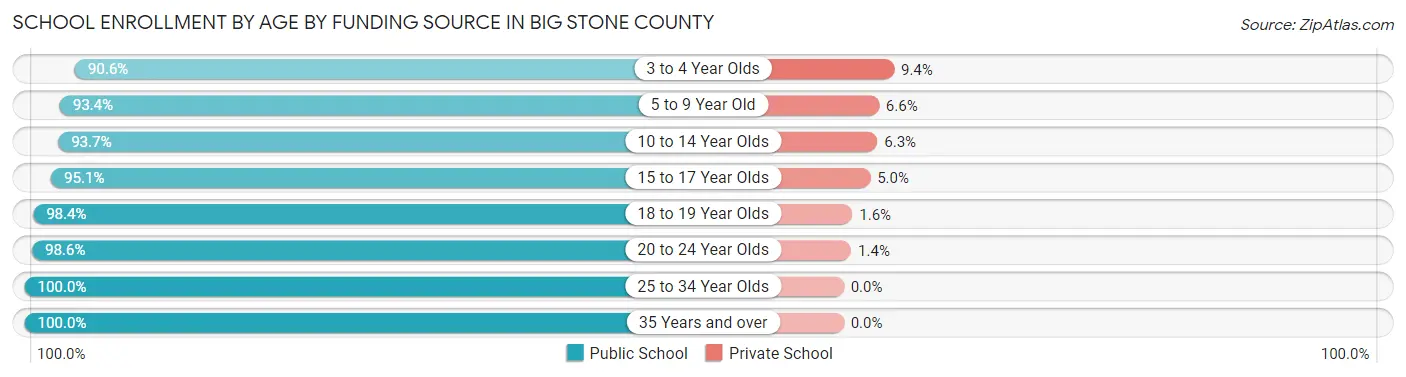
| Age Bracket | Public School | Private School |
| 3 to 4 Year Olds | 58 (90.6%) | 6 (9.4%) |
| 5 to 9 Year Old | 285 (93.4%) | 20 (6.6%) |
| 10 to 14 Year Olds | 284 (93.7%) | 19 (6.3%) |
| 15 to 17 Year Olds | 173 (95.1%) | 9 (5.0%) |
| 18 to 19 Year Olds | 61 (98.4%) | 1 (1.6%) |
| 20 to 24 Year Olds | 71 (98.6%) | 1 (1.4%) |
| 25 to 34 Year Olds | 6 (100.0%) | 0 (0.0%) |
| 35 Years and over | 25 (100.0%) | 0 (0.0%) |
| Total | 963 (94.5%) | 56 (5.5%) |
Educational Attainment by Field of Study in Big Stone County
Education (223 | 27.3%), science & technology (112 | 13.7%), bio, nature & agricultural (110 | 13.5%), business (106 | 13.0%), and psychology (47 | 5.8%) are the most common fields of study among 818 individuals in Big Stone County who have obtained a bachelor's degree or higher.
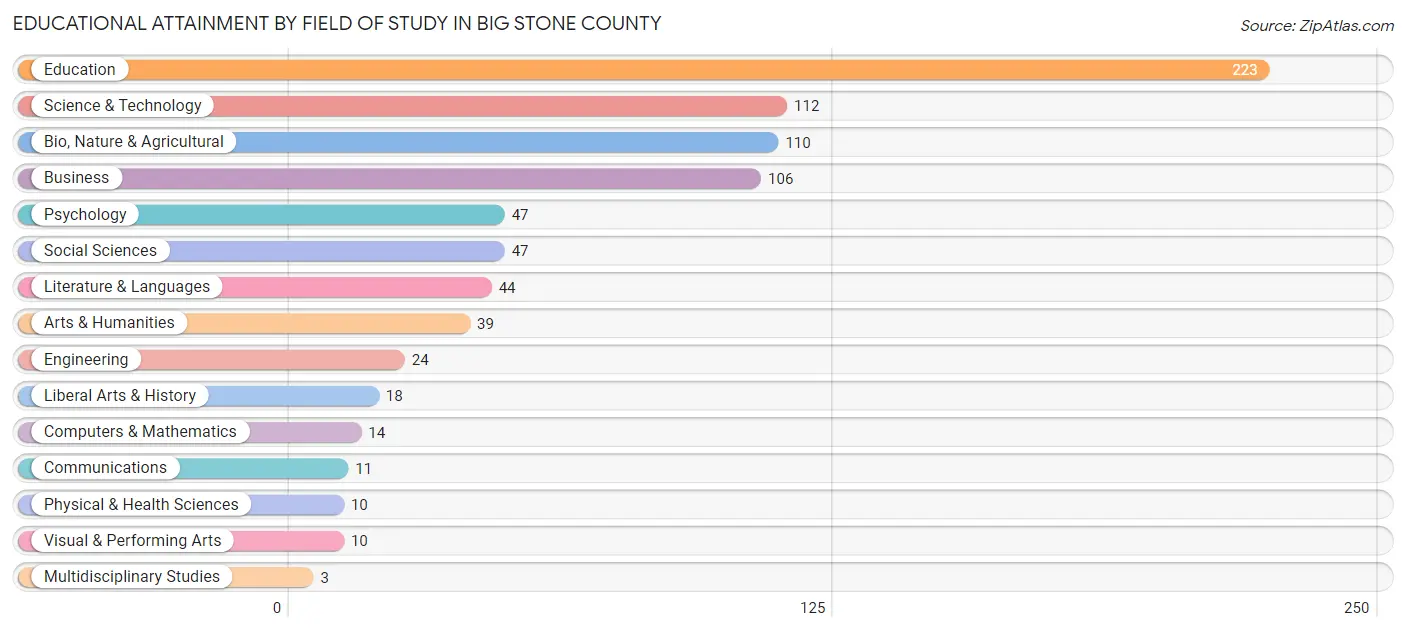
| Field of Study | # Graduates | % Graduates |
| Computers & Mathematics | 14 | 1.7% |
| Bio, Nature & Agricultural | 110 | 13.5% |
| Physical & Health Sciences | 10 | 1.2% |
| Psychology | 47 | 5.8% |
| Social Sciences | 47 | 5.8% |
| Engineering | 24 | 2.9% |
| Multidisciplinary Studies | 3 | 0.4% |
| Science & Technology | 112 | 13.7% |
| Business | 106 | 13.0% |
| Education | 223 | 27.3% |
| Literature & Languages | 44 | 5.4% |
| Liberal Arts & History | 18 | 2.2% |
| Visual & Performing Arts | 10 | 1.2% |
| Communications | 11 | 1.3% |
| Arts & Humanities | 39 | 4.8% |
| Total | 818 | 100.0% |
Transportation & Commute in Big Stone County
Vehicle Availability by Sex in Big Stone County
The most prevalent vehicle ownership categories in Big Stone County are males with 2 vehicles (487, accounting for 39.2%) and females with 2 vehicles (390, making up 49.8%).
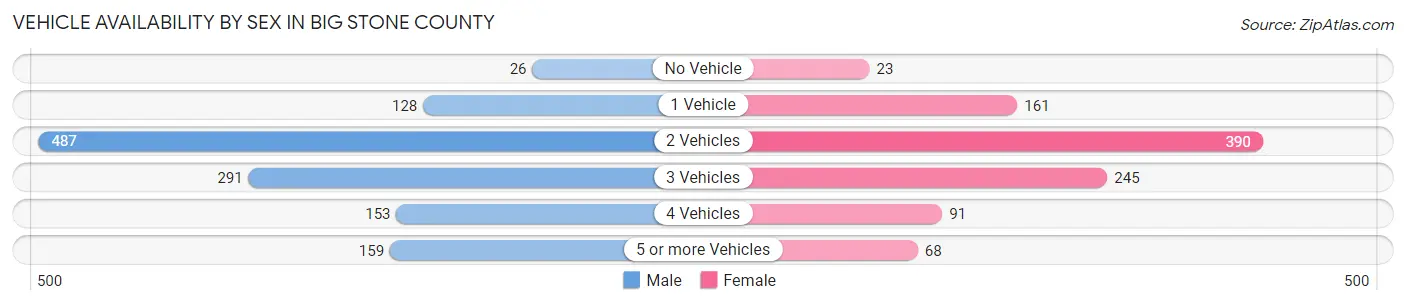
| Vehicles Available | Male | Female |
| No Vehicle | 26 (2.1%) | 23 (2.4%) |
| 1 Vehicle | 128 (10.3%) | 161 (16.5%) |
| 2 Vehicles | 487 (39.2%) | 390 (39.9%) |
| 3 Vehicles | 291 (23.4%) | 245 (25.1%) |
| 4 Vehicles | 153 (12.3%) | 91 (9.3%) |
| 5 or more Vehicles | 159 (12.8%) | 68 (7.0%) |
| Total | 1,244 (100.0%) | 978 (100.0%) |
Commute Time in Big Stone County
The most frequently occuring commute durations in Big Stone County are 5 to 9 minutes (467 commuters, 22.5%), less than 5 minutes (305 commuters, 14.7%), and 15 to 19 minutes (292 commuters, 14.1%).
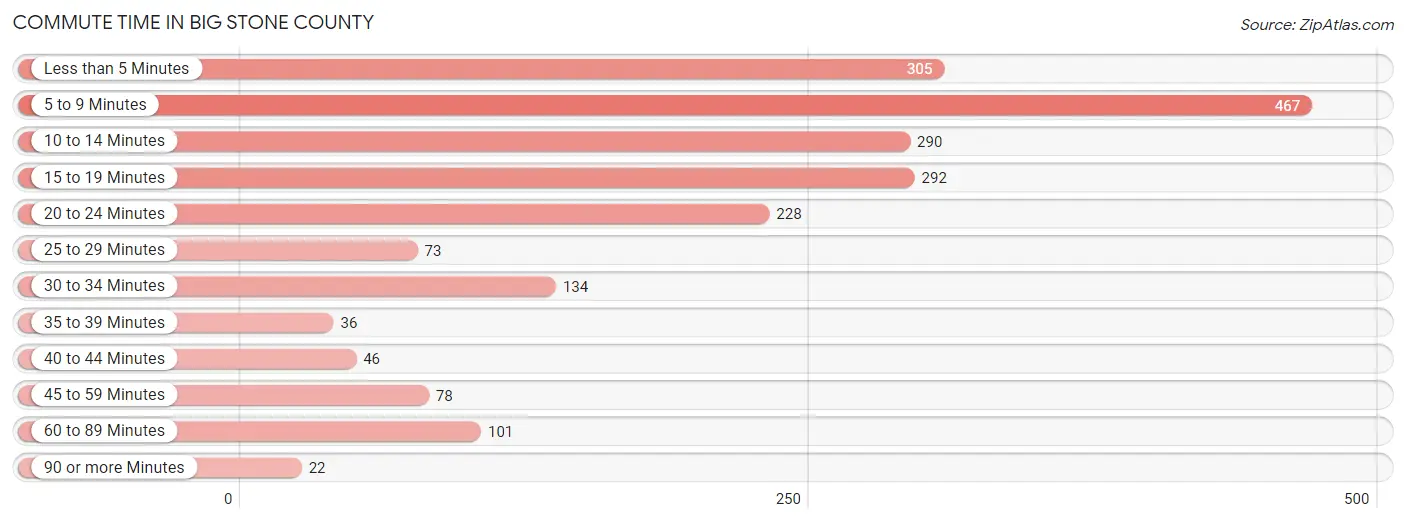
| Commute Time | # Commuters | % Commuters |
| Less than 5 Minutes | 305 | 14.7% |
| 5 to 9 Minutes | 467 | 22.5% |
| 10 to 14 Minutes | 290 | 14.0% |
| 15 to 19 Minutes | 292 | 14.1% |
| 20 to 24 Minutes | 228 | 11.0% |
| 25 to 29 Minutes | 73 | 3.5% |
| 30 to 34 Minutes | 134 | 6.5% |
| 35 to 39 Minutes | 36 | 1.7% |
| 40 to 44 Minutes | 46 | 2.2% |
| 45 to 59 Minutes | 78 | 3.8% |
| 60 to 89 Minutes | 101 | 4.9% |
| 90 or more Minutes | 22 | 1.1% |
Commute Time by Sex in Big Stone County
The most common commute times in Big Stone County are 5 to 9 minutes (264 commuters, 23.2%) for males and 5 to 9 minutes (203 commuters, 21.7%) for females.
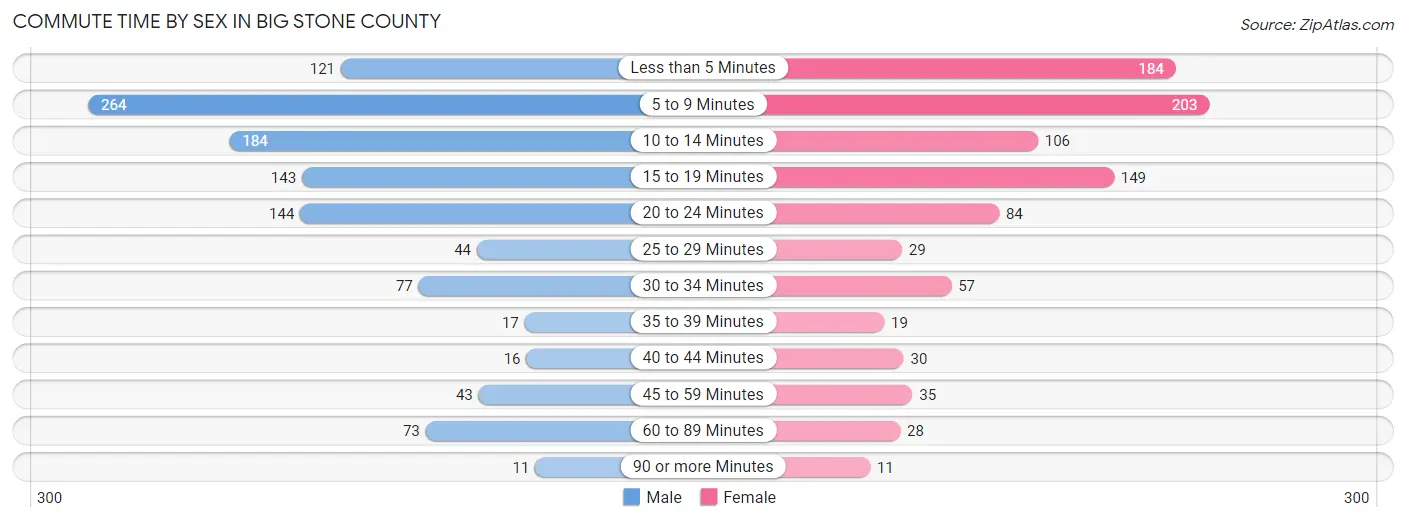
| Commute Time | Male | Female |
| Less than 5 Minutes | 121 (10.6%) | 184 (19.7%) |
| 5 to 9 Minutes | 264 (23.2%) | 203 (21.7%) |
| 10 to 14 Minutes | 184 (16.2%) | 106 (11.3%) |
| 15 to 19 Minutes | 143 (12.6%) | 149 (15.9%) |
| 20 to 24 Minutes | 144 (12.7%) | 84 (9.0%) |
| 25 to 29 Minutes | 44 (3.9%) | 29 (3.1%) |
| 30 to 34 Minutes | 77 (6.8%) | 57 (6.1%) |
| 35 to 39 Minutes | 17 (1.5%) | 19 (2.0%) |
| 40 to 44 Minutes | 16 (1.4%) | 30 (3.2%) |
| 45 to 59 Minutes | 43 (3.8%) | 35 (3.7%) |
| 60 to 89 Minutes | 73 (6.4%) | 28 (3.0%) |
| 90 or more Minutes | 11 (1.0%) | 11 (1.2%) |
Time of Departure to Work by Sex in Big Stone County
The most frequent times of departure to work in Big Stone County are 7:30 AM to 7:59 AM (232, 20.4%) for males and 7:30 AM to 7:59 AM (235, 25.1%) for females.
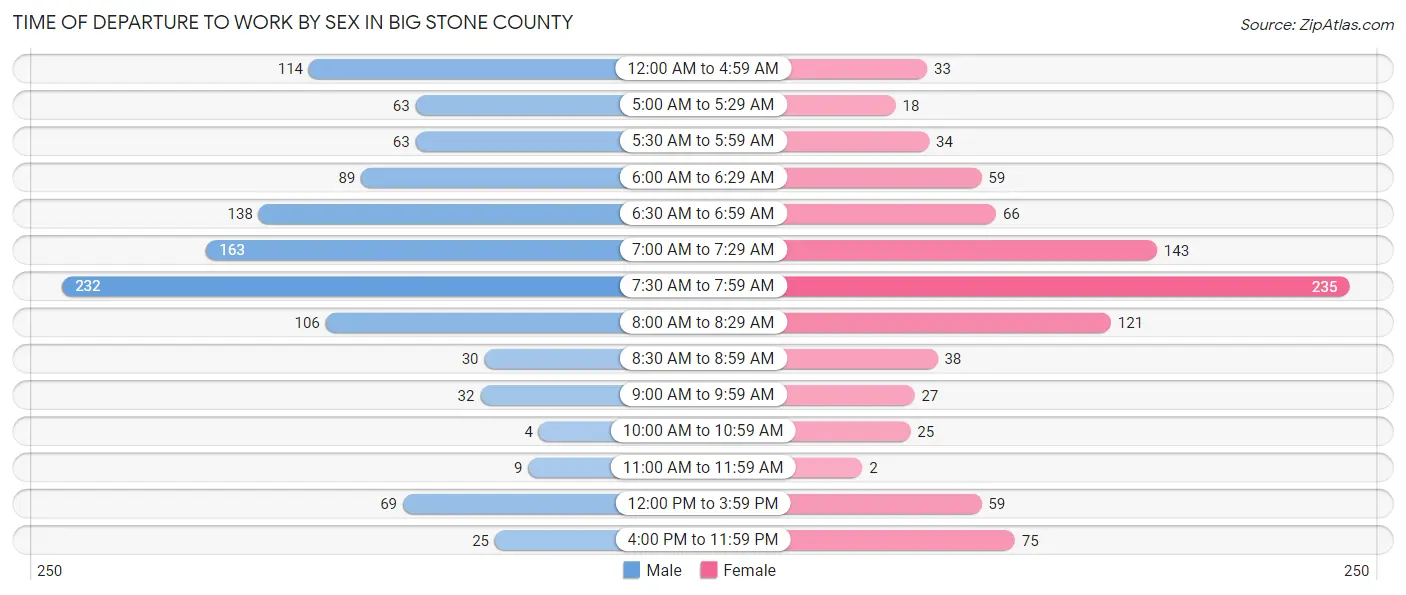
| Time of Departure | Male | Female |
| 12:00 AM to 4:59 AM | 114 (10.0%) | 33 (3.5%) |
| 5:00 AM to 5:29 AM | 63 (5.5%) | 18 (1.9%) |
| 5:30 AM to 5:59 AM | 63 (5.5%) | 34 (3.6%) |
| 6:00 AM to 6:29 AM | 89 (7.8%) | 59 (6.3%) |
| 6:30 AM to 6:59 AM | 138 (12.1%) | 66 (7.1%) |
| 7:00 AM to 7:29 AM | 163 (14.3%) | 143 (15.3%) |
| 7:30 AM to 7:59 AM | 232 (20.4%) | 235 (25.1%) |
| 8:00 AM to 8:29 AM | 106 (9.3%) | 121 (12.9%) |
| 8:30 AM to 8:59 AM | 30 (2.6%) | 38 (4.1%) |
| 9:00 AM to 9:59 AM | 32 (2.8%) | 27 (2.9%) |
| 10:00 AM to 10:59 AM | 4 (0.4%) | 25 (2.7%) |
| 11:00 AM to 11:59 AM | 9 (0.8%) | 2 (0.2%) |
| 12:00 PM to 3:59 PM | 69 (6.1%) | 59 (6.3%) |
| 4:00 PM to 11:59 PM | 25 (2.2%) | 75 (8.0%) |
| Total | 1,137 (100.0%) | 935 (100.0%) |
Housing Occupancy in Big Stone County
Occupancy by Ownership in Big Stone County
Of the total 2,242 dwellings in Big Stone County, owner-occupied units account for 1,698 (75.7%), while renter-occupied units make up 544 (24.3%).
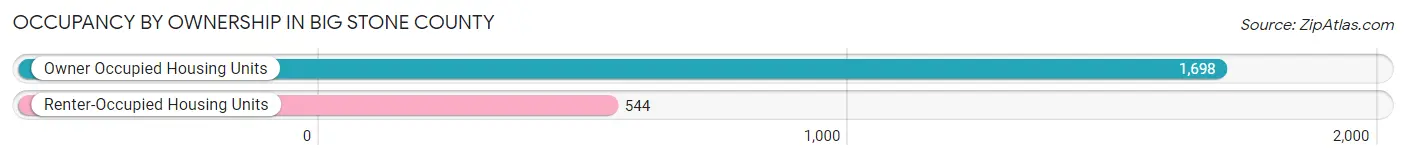
| Occupancy | # Housing Units | % Housing Units |
| Owner Occupied Housing Units | 1,698 | 75.7% |
| Renter-Occupied Housing Units | 544 | 24.3% |
| Total Occupied Housing Units | 2,242 | 100.0% |
Occupancy by Household Size in Big Stone County
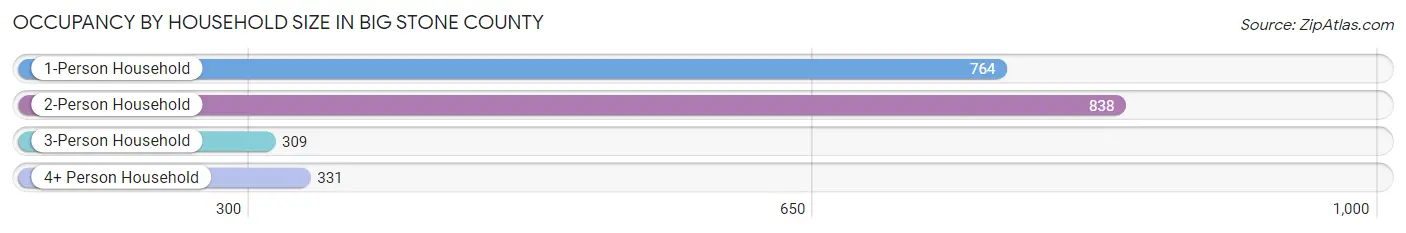
| Household Size | # Housing Units | % Housing Units |
| 1-Person Household | 764 | 34.1% |
| 2-Person Household | 838 | 37.4% |
| 3-Person Household | 309 | 13.8% |
| 4+ Person Household | 331 | 14.8% |
| Total Housing Units | 2,242 | 100.0% |
Occupancy by Ownership by Household Size in Big Stone County
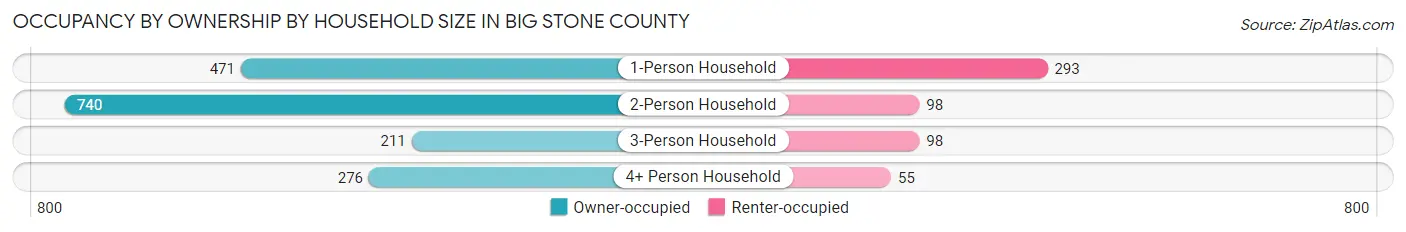
| Household Size | Owner-occupied | Renter-occupied |
| 1-Person Household | 471 (61.7%) | 293 (38.4%) |
| 2-Person Household | 740 (88.3%) | 98 (11.7%) |
| 3-Person Household | 211 (68.3%) | 98 (31.7%) |
| 4+ Person Household | 276 (83.4%) | 55 (16.6%) |
| Total Housing Units | 1,698 (75.7%) | 544 (24.3%) |
Occupancy by Educational Attainment in Big Stone County
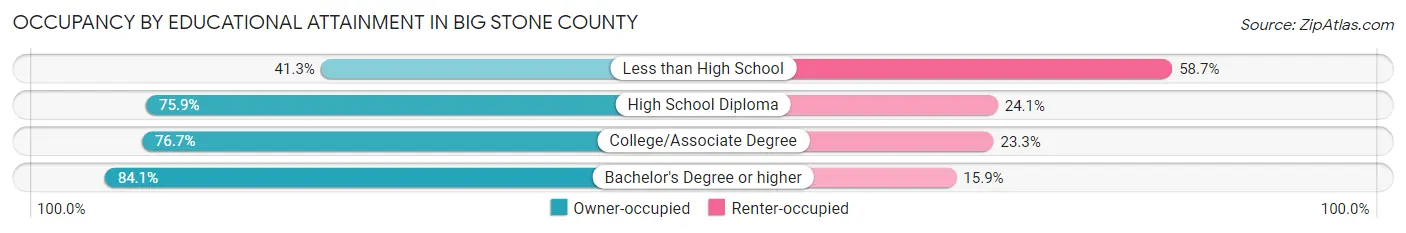
| Household Size | Owner-occupied | Renter-occupied |
| Less than High School | 57 (41.3%) | 81 (58.7%) |
| High School Diploma | 680 (75.9%) | 216 (24.1%) |
| College/Associate Degree | 570 (76.7%) | 173 (23.3%) |
| Bachelor's Degree or higher | 391 (84.1%) | 74 (15.9%) |
Occupancy by Age of Householder in Big Stone County
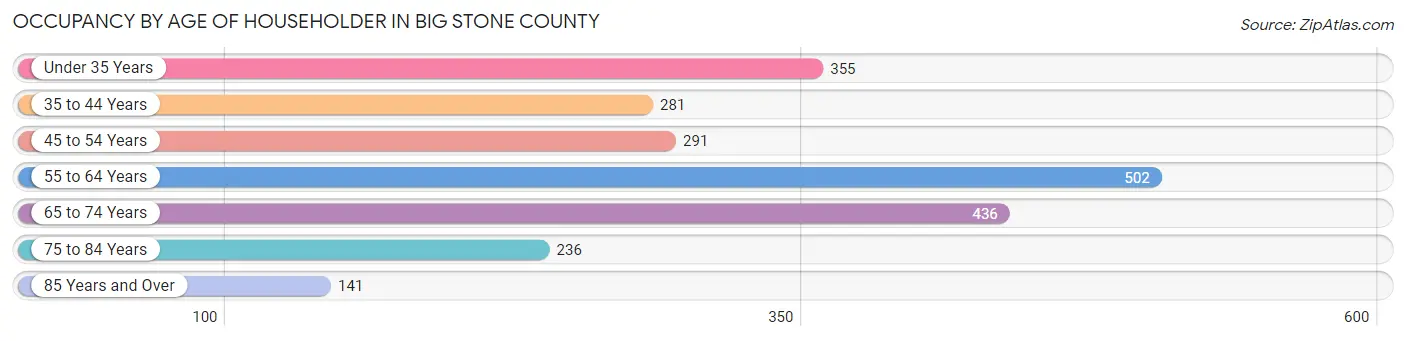
| Age Bracket | # Households | % Households |
| Under 35 Years | 355 | 15.8% |
| 35 to 44 Years | 281 | 12.5% |
| 45 to 54 Years | 291 | 13.0% |
| 55 to 64 Years | 502 | 22.4% |
| 65 to 74 Years | 436 | 19.5% |
| 75 to 84 Years | 236 | 10.5% |
| 85 Years and Over | 141 | 6.3% |
| Total | 2,242 | 100.0% |
Housing Finances in Big Stone County
Median Income by Occupancy in Big Stone County
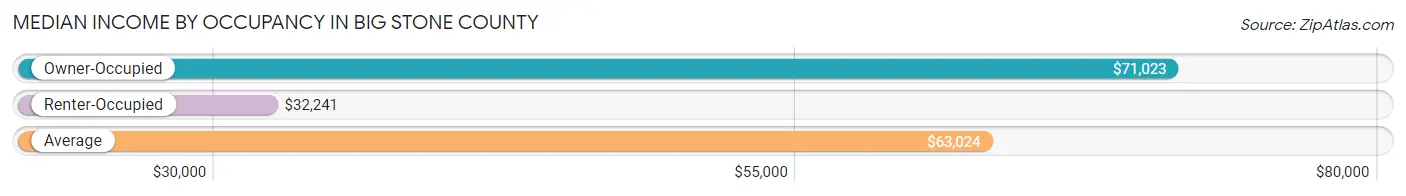
| Occupancy Type | # Households | Median Income |
| Owner-Occupied | 1,698 (75.7%) | $71,023 |
| Renter-Occupied | 544 (24.3%) | $32,241 |
| Average | 2,242 (100.0%) | $63,024 |
Occupancy by Householder Income Bracket in Big Stone County
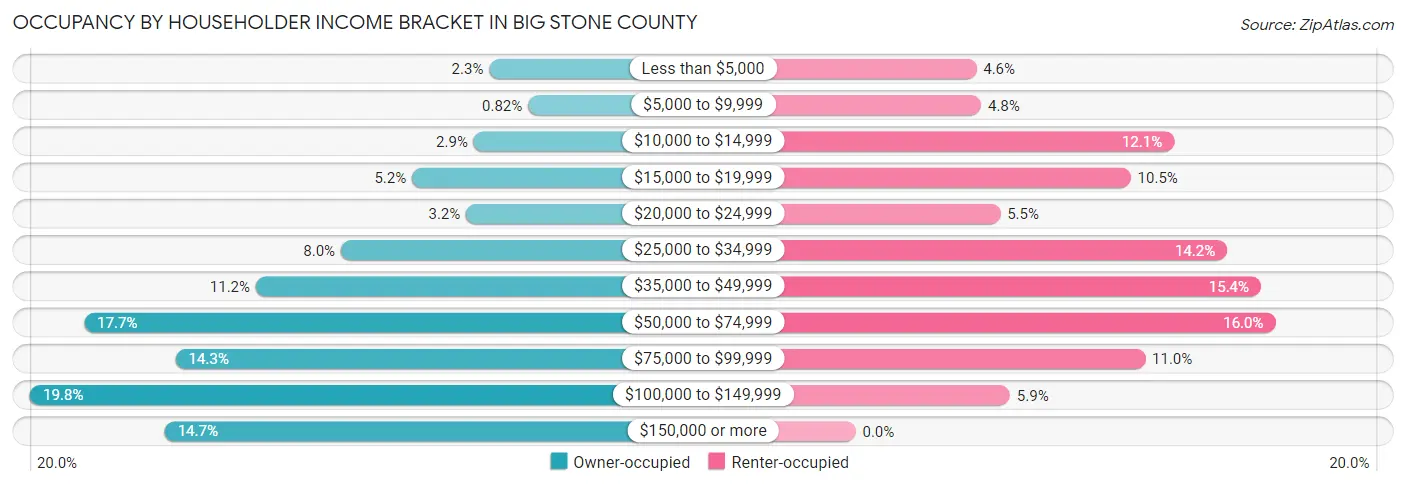
| Income Bracket | Owner-occupied | Renter-occupied |
| Less than $5,000 | 39 (2.3%) | 25 (4.6%) |
| $5,000 to $9,999 | 14 (0.8%) | 26 (4.8%) |
| $10,000 to $14,999 | 49 (2.9%) | 66 (12.1%) |
| $15,000 to $19,999 | 89 (5.2%) | 57 (10.5%) |
| $20,000 to $24,999 | 54 (3.2%) | 30 (5.5%) |
| $25,000 to $34,999 | 135 (8.0%) | 77 (14.1%) |
| $35,000 to $49,999 | 190 (11.2%) | 84 (15.4%) |
| $50,000 to $74,999 | 301 (17.7%) | 87 (16.0%) |
| $75,000 to $99,999 | 242 (14.2%) | 60 (11.0%) |
| $100,000 to $149,999 | 336 (19.8%) | 32 (5.9%) |
| $150,000 or more | 249 (14.7%) | 0 (0.0%) |
| Total | 1,698 (100.0%) | 544 (100.0%) |
Monthly Housing Cost Tiers in Big Stone County
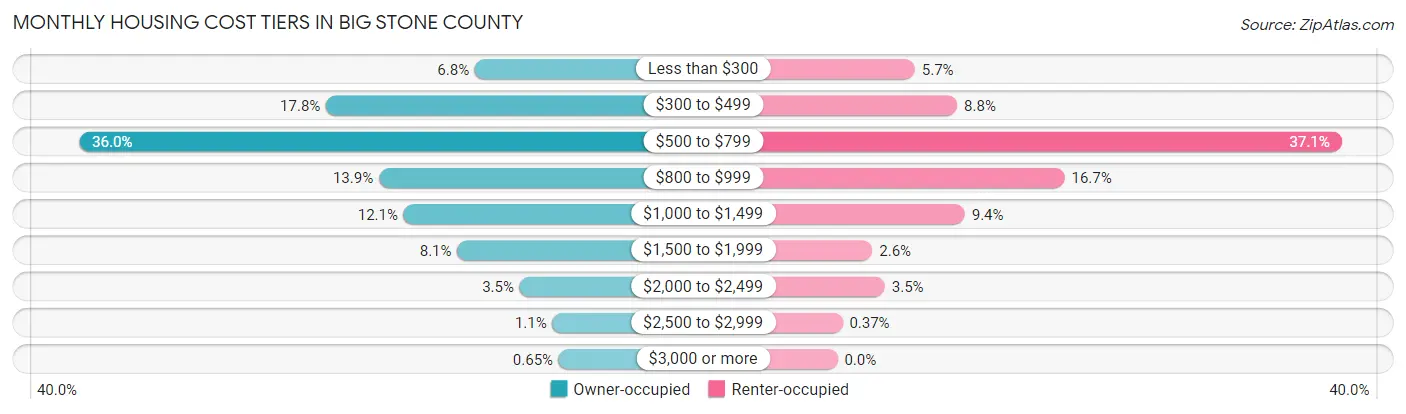
| Monthly Cost | Owner-occupied | Renter-occupied |
| Less than $300 | 116 (6.8%) | 31 (5.7%) |
| $300 to $499 | 302 (17.8%) | 48 (8.8%) |
| $500 to $799 | 611 (36.0%) | 202 (37.1%) |
| $800 to $999 | 236 (13.9%) | 91 (16.7%) |
| $1,000 to $1,499 | 205 (12.1%) | 51 (9.4%) |
| $1,500 to $1,999 | 138 (8.1%) | 14 (2.6%) |
| $2,000 to $2,499 | 60 (3.5%) | 19 (3.5%) |
| $2,500 to $2,999 | 19 (1.1%) | 2 (0.4%) |
| $3,000 or more | 11 (0.6%) | 0 (0.0%) |
| Total | 1,698 (100.0%) | 544 (100.0%) |
Physical Housing Characteristics in Big Stone County
Housing Structures in Big Stone County
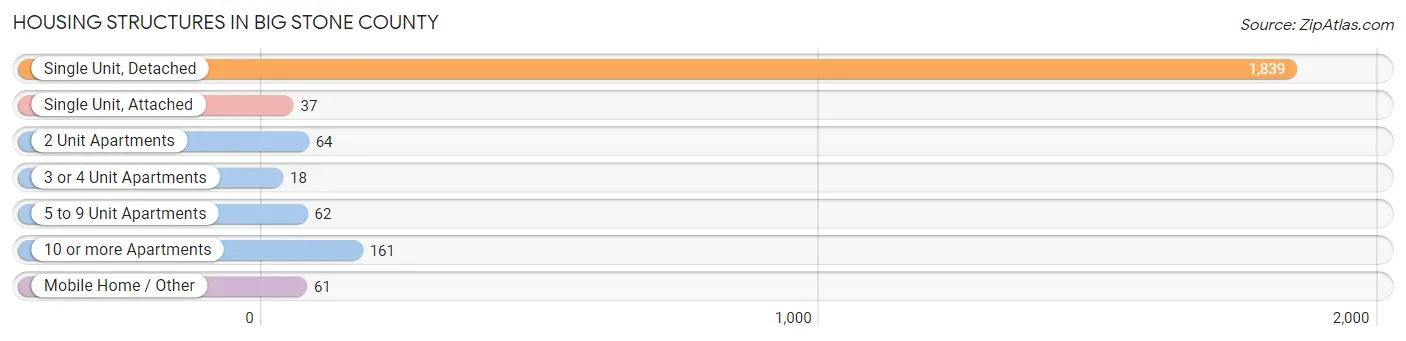
| Structure Type | # Housing Units | % Housing Units |
| Single Unit, Detached | 1,839 | 82.0% |
| Single Unit, Attached | 37 | 1.7% |
| 2 Unit Apartments | 64 | 2.9% |
| 3 or 4 Unit Apartments | 18 | 0.8% |
| 5 to 9 Unit Apartments | 62 | 2.8% |
| 10 or more Apartments | 161 | 7.2% |
| Mobile Home / Other | 61 | 2.7% |
| Total | 2,242 | 100.0% |
Housing Structures by Occupancy in Big Stone County
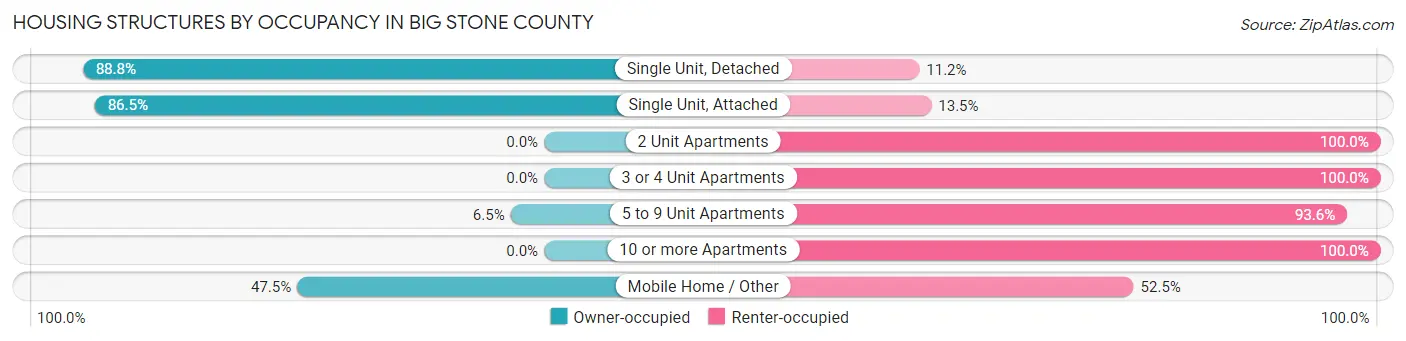
| Structure Type | Owner-occupied | Renter-occupied |
| Single Unit, Detached | 1,633 (88.8%) | 206 (11.2%) |
| Single Unit, Attached | 32 (86.5%) | 5 (13.5%) |
| 2 Unit Apartments | 0 (0.0%) | 64 (100.0%) |
| 3 or 4 Unit Apartments | 0 (0.0%) | 18 (100.0%) |
| 5 to 9 Unit Apartments | 4 (6.5%) | 58 (93.5%) |
| 10 or more Apartments | 0 (0.0%) | 161 (100.0%) |
| Mobile Home / Other | 29 (47.5%) | 32 (52.5%) |
| Total | 1,698 (75.7%) | 544 (24.3%) |
Housing Structures by Number of Rooms in Big Stone County
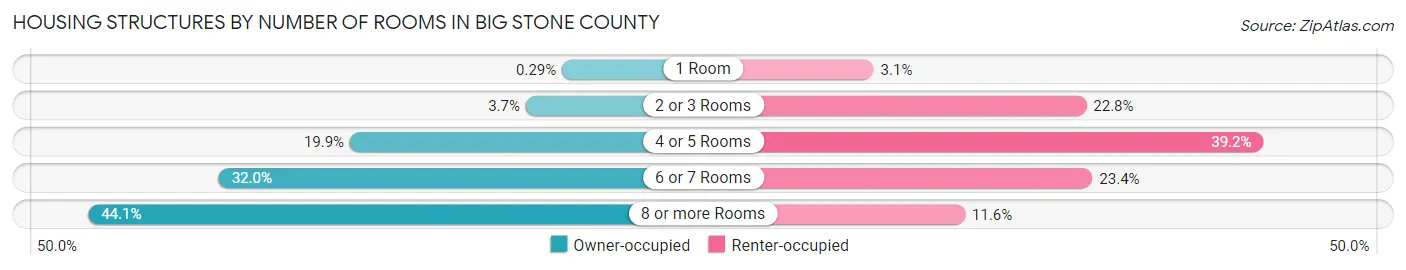
| Number of Rooms | Owner-occupied | Renter-occupied |
| 1 Room | 5 (0.3%) | 17 (3.1%) |
| 2 or 3 Rooms | 62 (3.6%) | 124 (22.8%) |
| 4 or 5 Rooms | 338 (19.9%) | 213 (39.2%) |
| 6 or 7 Rooms | 544 (32.0%) | 127 (23.4%) |
| 8 or more Rooms | 749 (44.1%) | 63 (11.6%) |
| Total | 1,698 (100.0%) | 544 (100.0%) |
Housing Structure by Heating Type in Big Stone County
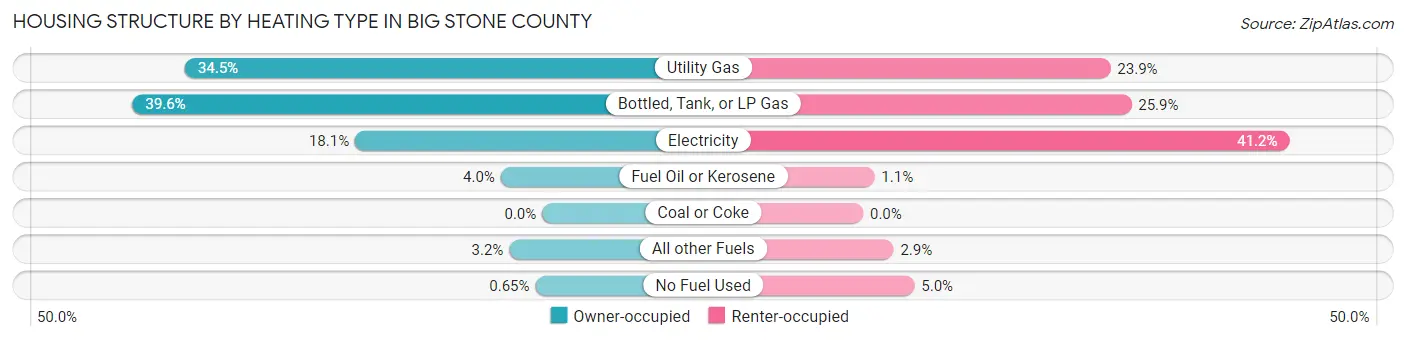
| Heating Type | Owner-occupied | Renter-occupied |
| Utility Gas | 586 (34.5%) | 130 (23.9%) |
| Bottled, Tank, or LP Gas | 672 (39.6%) | 141 (25.9%) |
| Electricity | 307 (18.1%) | 224 (41.2%) |
| Fuel Oil or Kerosene | 68 (4.0%) | 6 (1.1%) |
| Coal or Coke | 0 (0.0%) | 0 (0.0%) |
| All other Fuels | 54 (3.2%) | 16 (2.9%) |
| No Fuel Used | 11 (0.6%) | 27 (5.0%) |
| Total | 1,698 (100.0%) | 544 (100.0%) |
Household Vehicle Usage in Big Stone County
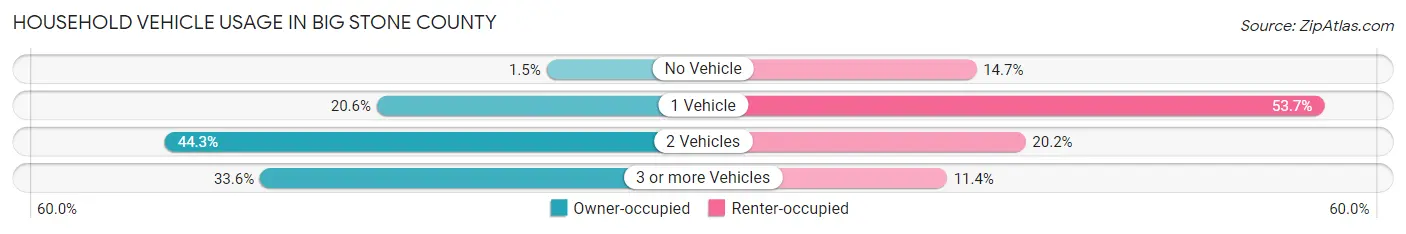
| Vehicles per Household | Owner-occupied | Renter-occupied |
| No Vehicle | 26 (1.5%) | 80 (14.7%) |
| 1 Vehicle | 349 (20.5%) | 292 (53.7%) |
| 2 Vehicles | 752 (44.3%) | 110 (20.2%) |
| 3 or more Vehicles | 571 (33.6%) | 62 (11.4%) |
| Total | 1,698 (100.0%) | 544 (100.0%) |
Real Estate & Mortgages in Big Stone County
Real Estate and Mortgage Overview in Big Stone County
| Characteristic | Without Mortgage | With Mortgage |
| Housing Units | 976 | 722 |
| Median Property Value | $109,800 | $122,400 |
| Median Household Income | $63,906 | $116 |
| Monthly Housing Costs | $561 | $11 |
| Real Estate Taxes | $1,053 | $5 |
Property Value by Mortgage Status in Big Stone County
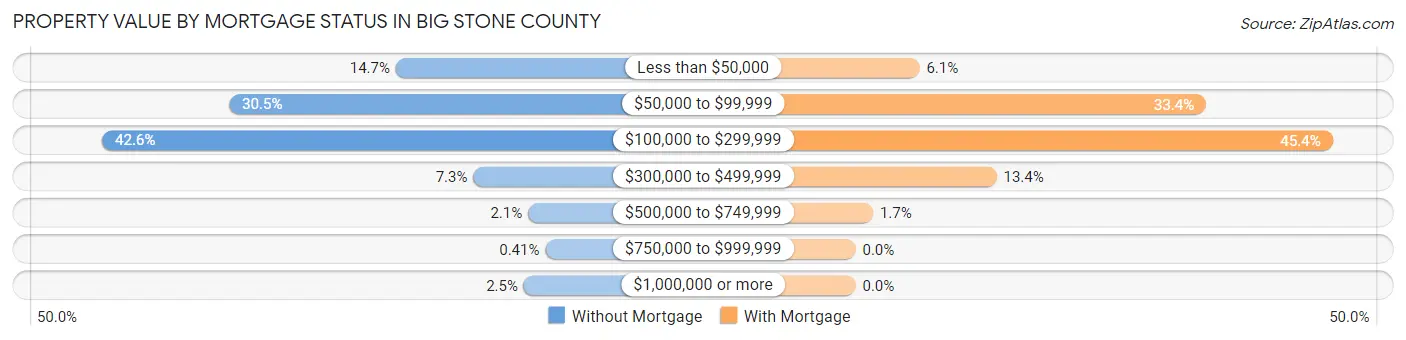
| Property Value | Without Mortgage | With Mortgage |
| Less than $50,000 | 143 (14.6%) | 44 (6.1%) |
| $50,000 to $99,999 | 298 (30.5%) | 241 (33.4%) |
| $100,000 to $299,999 | 416 (42.6%) | 328 (45.4%) |
| $300,000 to $499,999 | 71 (7.3%) | 97 (13.4%) |
| $500,000 to $749,999 | 20 (2.1%) | 12 (1.7%) |
| $750,000 to $999,999 | 4 (0.4%) | 0 (0.0%) |
| $1,000,000 or more | 24 (2.5%) | 0 (0.0%) |
| Total | 976 (100.0%) | 722 (100.0%) |
Household Income by Mortgage Status in Big Stone County
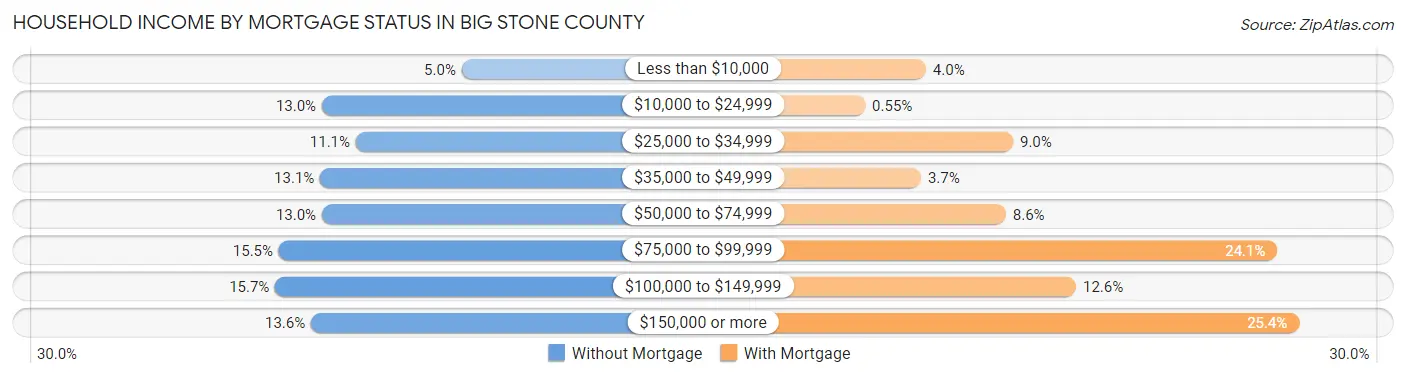
| Household Income | Without Mortgage | With Mortgage |
| Less than $10,000 | 49 (5.0%) | 29 (4.0%) |
| $10,000 to $24,999 | 127 (13.0%) | 4 (0.5%) |
| $25,000 to $34,999 | 108 (11.1%) | 65 (9.0%) |
| $35,000 to $49,999 | 128 (13.1%) | 27 (3.7%) |
| $50,000 to $74,999 | 127 (13.0%) | 62 (8.6%) |
| $75,000 to $99,999 | 151 (15.5%) | 174 (24.1%) |
| $100,000 to $149,999 | 153 (15.7%) | 91 (12.6%) |
| $150,000 or more | 133 (13.6%) | 183 (25.4%) |
| Total | 976 (100.0%) | 722 (100.0%) |
Property Value to Household Income Ratio in Big Stone County
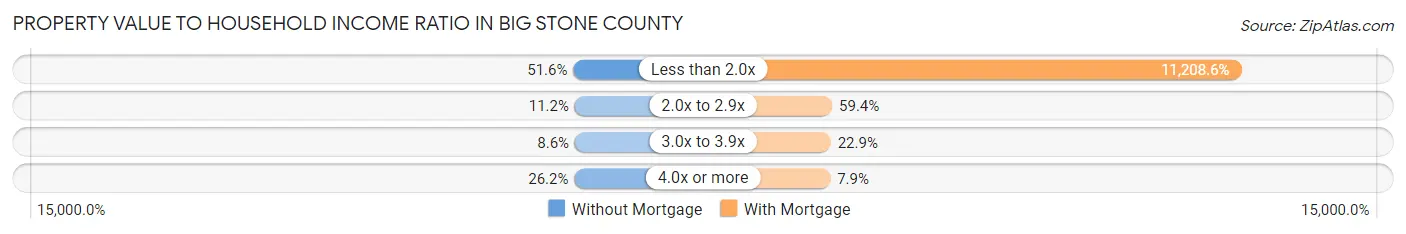
| Value-to-Income Ratio | Without Mortgage | With Mortgage |
| Less than 2.0x | 504 (51.6%) | 80,926 (11,208.6%) |
| 2.0x to 2.9x | 109 (11.2%) | 429 (59.4%) |
| 3.0x to 3.9x | 84 (8.6%) | 165 (22.9%) |
| 4.0x or more | 256 (26.2%) | 57 (7.9%) |
| Total | 976 (100.0%) | 722 (100.0%) |
Real Estate Taxes by Mortgage Status in Big Stone County
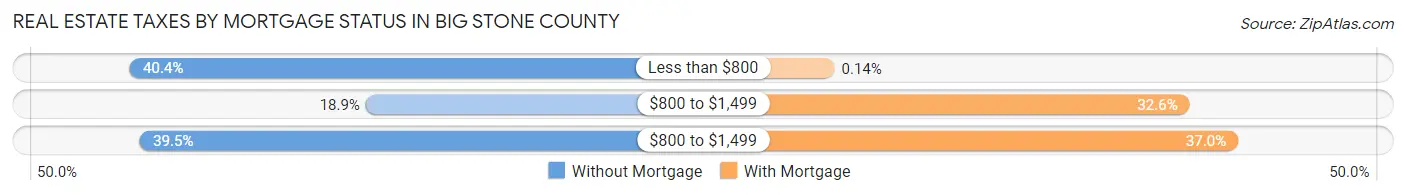
| Property Taxes | Without Mortgage | With Mortgage |
| Less than $800 | 394 (40.4%) | 1 (0.1%) |
| $800 to $1,499 | 184 (18.9%) | 235 (32.6%) |
| $800 to $1,499 | 385 (39.5%) | 267 (37.0%) |
| Total | 976 (100.0%) | 722 (100.0%) |
Health & Disability in Big Stone County
Health Insurance Coverage by Age in Big Stone County
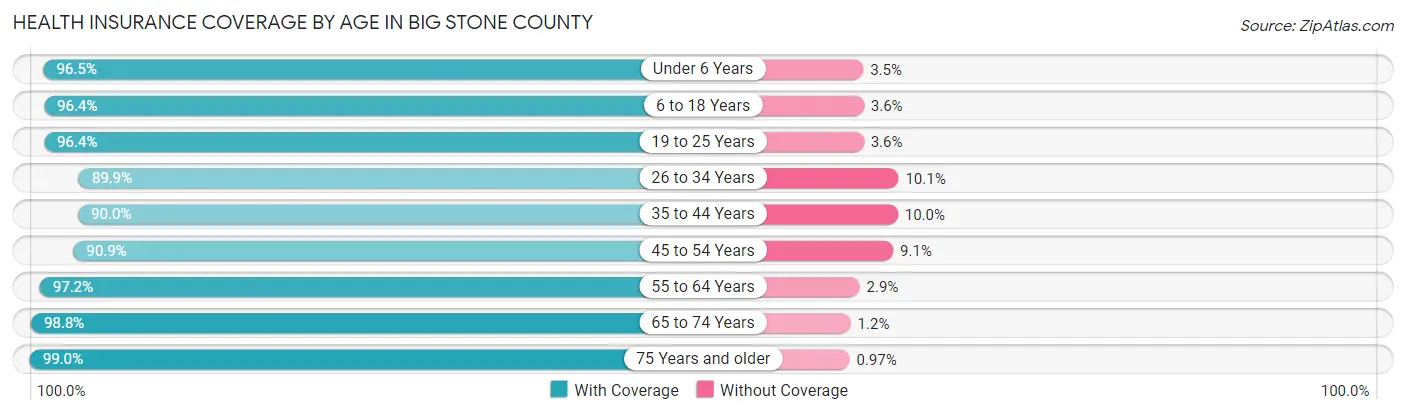
| Age Bracket | With Coverage | Without Coverage |
| Under 6 Years | 328 (96.5%) | 12 (3.5%) |
| 6 to 18 Years | 767 (96.4%) | 29 (3.6%) |
| 19 to 25 Years | 293 (96.4%) | 11 (3.6%) |
| 26 to 34 Years | 427 (89.9%) | 48 (10.1%) |
| 35 to 44 Years | 487 (90.0%) | 54 (10.0%) |
| 45 to 54 Years | 479 (90.9%) | 48 (9.1%) |
| 55 to 64 Years | 819 (97.2%) | 24 (2.9%) |
| 65 to 74 Years | 667 (98.8%) | 8 (1.2%) |
| 75 Years and older | 510 (99.0%) | 5 (1.0%) |
| Total | 4,777 (95.2%) | 239 (4.8%) |
Health Insurance Coverage by Citizenship Status in Big Stone County
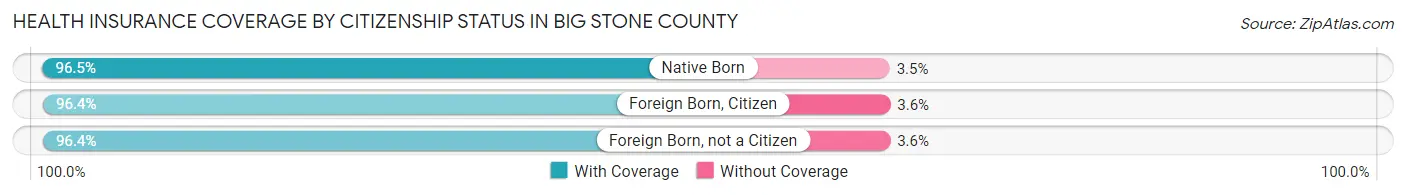
| Citizenship Status | With Coverage | Without Coverage |
| Native Born | 328 (96.5%) | 12 (3.5%) |
| Foreign Born, Citizen | 767 (96.4%) | 29 (3.6%) |
| Foreign Born, not a Citizen | 293 (96.4%) | 11 (3.6%) |
Health Insurance Coverage by Household Income in Big Stone County
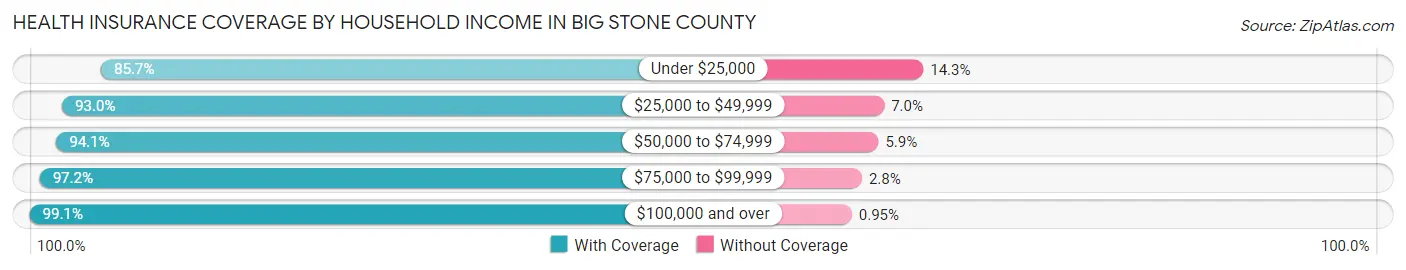
| Household Income | With Coverage | Without Coverage |
| Under $25,000 | 508 (85.7%) | 85 (14.3%) |
| $25,000 to $49,999 | 823 (93.0%) | 62 (7.0%) |
| $50,000 to $74,999 | 871 (94.1%) | 55 (5.9%) |
| $75,000 to $99,999 | 649 (97.2%) | 19 (2.8%) |
| $100,000 and over | 1,873 (99.1%) | 18 (0.9%) |
Public vs Private Health Insurance Coverage by Age in Big Stone County
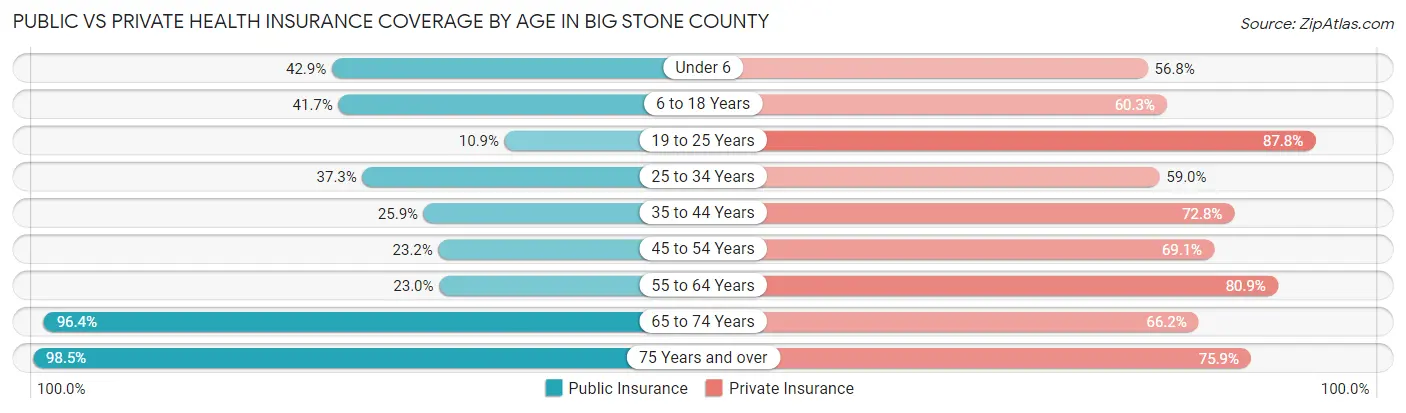
| Age Bracket | Public Insurance | Private Insurance |
| Under 6 | 146 (42.9%) | 193 (56.8%) |
| 6 to 18 Years | 332 (41.7%) | 480 (60.3%) |
| 19 to 25 Years | 33 (10.9%) | 267 (87.8%) |
| 25 to 34 Years | 177 (37.3%) | 280 (59.0%) |
| 35 to 44 Years | 140 (25.9%) | 394 (72.8%) |
| 45 to 54 Years | 122 (23.2%) | 364 (69.1%) |
| 55 to 64 Years | 194 (23.0%) | 682 (80.9%) |
| 65 to 74 Years | 651 (96.4%) | 447 (66.2%) |
| 75 Years and over | 507 (98.5%) | 391 (75.9%) |
| Total | 2,302 (45.9%) | 3,498 (69.7%) |
Disability Status by Sex by Age in Big Stone County
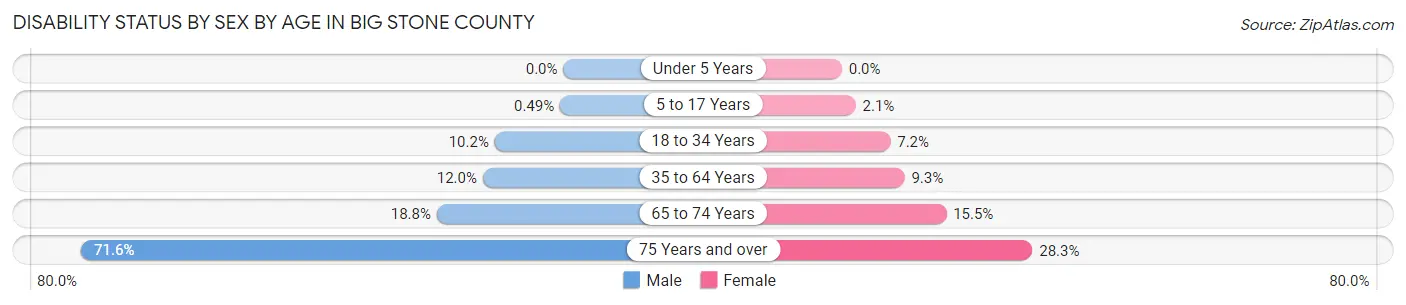
| Age Bracket | Male | Female |
| Under 5 Years | 0 (0.0%) | 0 (0.0%) |
| 5 to 17 Years | 2 (0.5%) | 8 (2.1%) |
| 18 to 34 Years | 44 (10.2%) | 28 (7.2%) |
| 35 to 64 Years | 118 (12.0%) | 86 (9.3%) |
| 65 to 74 Years | 65 (18.8%) | 51 (15.5%) |
| 75 Years and over | 184 (71.6%) | 73 (28.3%) |
Disability Class by Sex by Age in Big Stone County
Disability Class: Hearing Difficulty
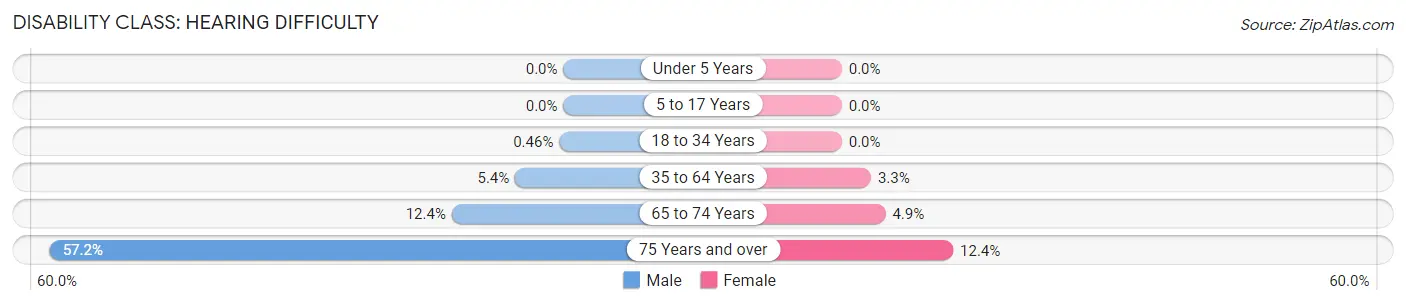
| Age Bracket | Male | Female |
| Under 5 Years | 0 (0.0%) | 0 (0.0%) |
| 5 to 17 Years | 0 (0.0%) | 0 (0.0%) |
| 18 to 34 Years | 2 (0.5%) | 0 (0.0%) |
| 35 to 64 Years | 53 (5.4%) | 30 (3.3%) |
| 65 to 74 Years | 43 (12.4%) | 16 (4.9%) |
| 75 Years and over | 147 (57.2%) | 32 (12.4%) |
Disability Class: Vision Difficulty
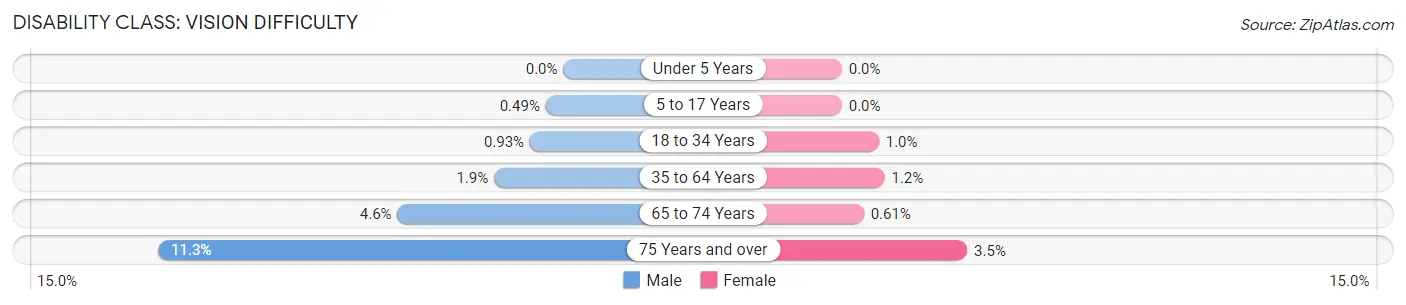
| Age Bracket | Male | Female |
| Under 5 Years | 0 (0.0%) | 0 (0.0%) |
| 5 to 17 Years | 2 (0.5%) | 0 (0.0%) |
| 18 to 34 Years | 4 (0.9%) | 4 (1.0%) |
| 35 to 64 Years | 19 (1.9%) | 11 (1.2%) |
| 65 to 74 Years | 16 (4.6%) | 2 (0.6%) |
| 75 Years and over | 29 (11.3%) | 9 (3.5%) |
Disability Class: Cognitive Difficulty
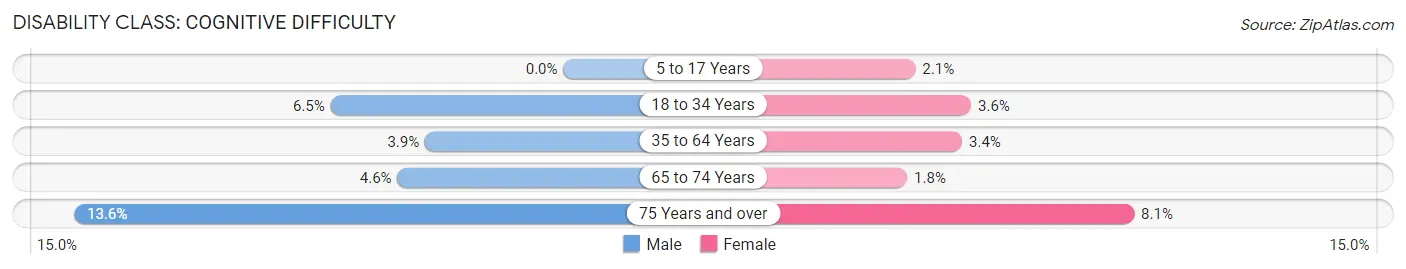
| Age Bracket | Male | Female |
| 5 to 17 Years | 0 (0.0%) | 8 (2.1%) |
| 18 to 34 Years | 28 (6.5%) | 14 (3.6%) |
| 35 to 64 Years | 38 (3.8%) | 31 (3.4%) |
| 65 to 74 Years | 16 (4.6%) | 6 (1.8%) |
| 75 Years and over | 35 (13.6%) | 21 (8.1%) |
Disability Class: Ambulatory Difficulty
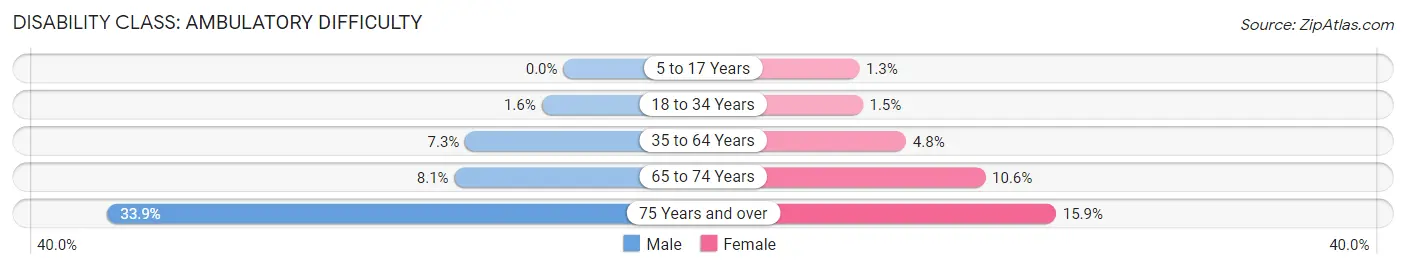
| Age Bracket | Male | Female |
| 5 to 17 Years | 0 (0.0%) | 5 (1.3%) |
| 18 to 34 Years | 7 (1.6%) | 6 (1.5%) |
| 35 to 64 Years | 72 (7.3%) | 44 (4.8%) |
| 65 to 74 Years | 28 (8.1%) | 35 (10.6%) |
| 75 Years and over | 87 (33.9%) | 41 (15.9%) |
Disability Class: Self-Care Difficulty
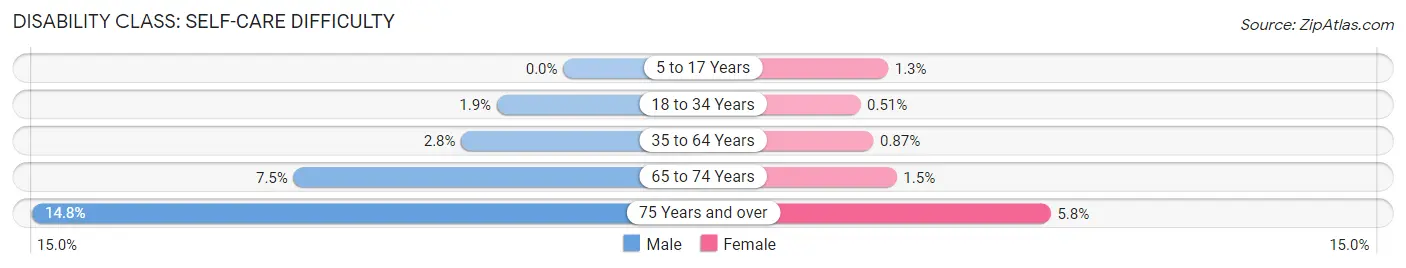
| Age Bracket | Male | Female |
| 5 to 17 Years | 0 (0.0%) | 5 (1.3%) |
| 18 to 34 Years | 8 (1.8%) | 2 (0.5%) |
| 35 to 64 Years | 28 (2.8%) | 8 (0.9%) |
| 65 to 74 Years | 26 (7.5%) | 5 (1.5%) |
| 75 Years and over | 38 (14.8%) | 15 (5.8%) |
Technology Access in Big Stone County
Computing Device Access in Big Stone County
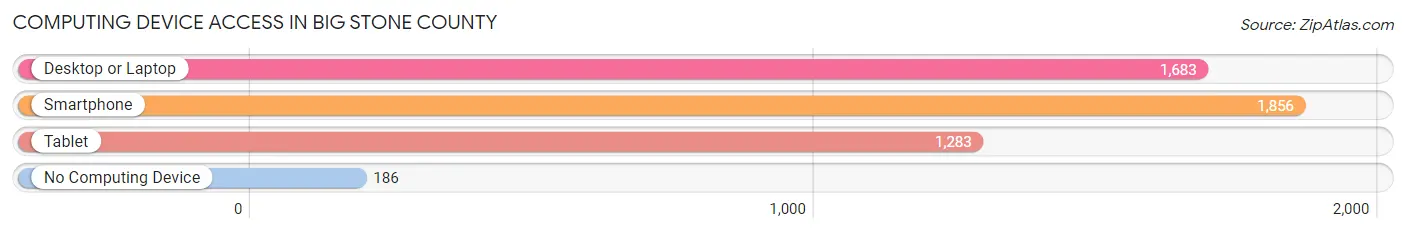
| Device Type | # Households | % Households |
| Desktop or Laptop | 1,683 | 75.1% |
| Smartphone | 1,856 | 82.8% |
| Tablet | 1,283 | 57.2% |
| No Computing Device | 186 | 8.3% |
| Total | 2,242 | 100.0% |
Internet Access in Big Stone County
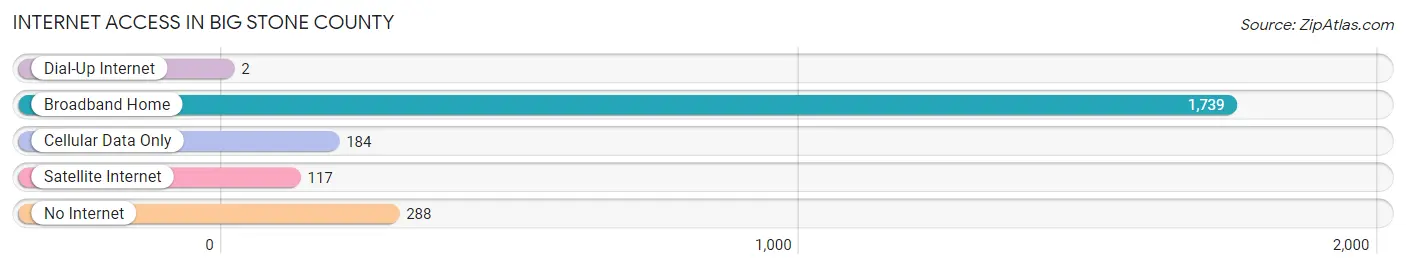
| Internet Type | # Households | % Households |
| Dial-Up Internet | 2 | 0.1% |
| Broadband Home | 1,739 | 77.6% |
| Cellular Data Only | 184 | 8.2% |
| Satellite Internet | 117 | 5.2% |
| No Internet | 288 | 12.9% |
| Total | 2,242 | 100.0% |
Big Stone County Summary
Stone County is a county located in the U.S. state of Minnesota. As of the 2010 United States Census, the population was 5,816. Its county seat is Ortonville.
History
Stone County was established in 1872. It was named for the large deposits of stone found in the area. The county was originally part of Big Stone County, which was established in 1858. In 1872, Big Stone County was divided into two counties, Big Stone and Stone.
Geography
Stone County is located in the west-central part of Minnesota. It is bordered by Big Stone County to the north, Traverse County to the east, Wilkin County to the south, and Grant County to the west. The county has a total area of 576 square miles, of which 574 square miles is land and 2.2 square miles (0.4%) is water.
The terrain of Stone County is generally flat, with some rolling hills. The county is drained by the Minnesota River, which forms its western boundary. The county is home to several lakes, including Big Stone Lake, Lake Traverse, and Lake Wilkin.
Economy
Stone County's economy is largely based on agriculture. The county is home to several large farms, which produce a variety of crops, including corn, soybeans, wheat, and hay. The county also has a thriving dairy industry.
The county is also home to several manufacturing companies, including a furniture factory, a plastics factory, and a metal fabrication plant.
Demographics
As of the 2010 United States Census, there were 5,816 people, 2,310 households, and 1,541 families living in the county. The population density was 10.1 people per square mile. There were 2,619 housing units at an average density of 4.5 per square mile. The racial makeup of the county was 97.2% White, 0.3% Black or African American, 0.3% Native American, 0.2% Asian, 0.1% Pacific Islander, 0.7% from other races, and 1.2% from two or more races. 2.2% of the population were Hispanic or Latino of any race.
There were 2,310 households, out of which 30.2% had children under the age of 18 living with them, 56.2% were married couples living together, 8.2% had a female householder with no husband present, and 31.7% were non-families. 27.2% of all households were made up of individuals, and 13.2% had someone living alone who was 65 years of age or older. The average household size was 2.50 and the average family size was 3.04.
In the county, the population was spread out, with 25.7% under the age of 18, 6.7% from 18 to 24, 24.2% from 25 to 44, 25.2% from 45 to 64, and 18.2% who were 65 years of age or older. The median age was 40 years. For every 100 females there were 97.2 males. For every 100 females age 18 and over, there were 94.2 males.
The median income for a household in the county was $37,917, and the median income for a family was $45,938. Males had a median income of $31,917 versus $22,917 for females. The per capita income for the county was $18,845. About 6.7% of families and 9.2% of the population were below the poverty line, including 11.2% of those under age 18 and 11.2% of those age 65 or over.
Stone County is part of the Ortonville Public School District. The county is also home to several private schools, including the Ortonville Christian School and the Big Stone County Academy.
Common Questions
What is Per Capita Income in Big Stone County?
Per Capita income in Big Stone County is $35,797.
What is the Median Family Income in Big Stone County?
Median Family Income in Big Stone County is $81,836.
What is the Median Household income in Big Stone County?
Median Household Income in Big Stone County is $63,024.
What is Income or Wage Gap in Big Stone County?
Income or Wage Gap in Big Stone County is 39.6%.
Women in Big Stone County earn 60.4 cents for every dollar earned by a man.
What is Inequality or Gini Index in Big Stone County?
Inequality or Gini Index in Big Stone County is 0.44.
What is the Total Population of Big Stone County?
Total Population of Big Stone County is 5,161.
What is the Total Male Population of Big Stone County?
Total Male Population of Big Stone County is 2,618.
What is the Total Female Population of Big Stone County?
Total Female Population of Big Stone County is 2,543.
What is the Ratio of Males per 100 Females in Big Stone County?
There are 102.95 Males per 100 Females in Big Stone County.
What is the Ratio of Females per 100 Males in Big Stone County?
There are 97.14 Females per 100 Males in Big Stone County.
What is the Median Population Age in Big Stone County?
Median Population Age in Big Stone County is 47.7 Years.
What is the Average Family Size in Big Stone County
Average Family Size in Big Stone County is 2.9 People.
What is the Average Household Size in Big Stone County
Average Household Size in Big Stone County is 2.2 People.
How Large is the Labor Force in Big Stone County?
There are 2,409 People in the Labor Forcein in Big Stone County.
What is the Percentage of People in the Labor Force in Big Stone County?
58.0% of People are in the Labor Force in Big Stone County.
What is the Unemployment Rate in Big Stone County?
Unemployment Rate in Big Stone County is 2.0%.