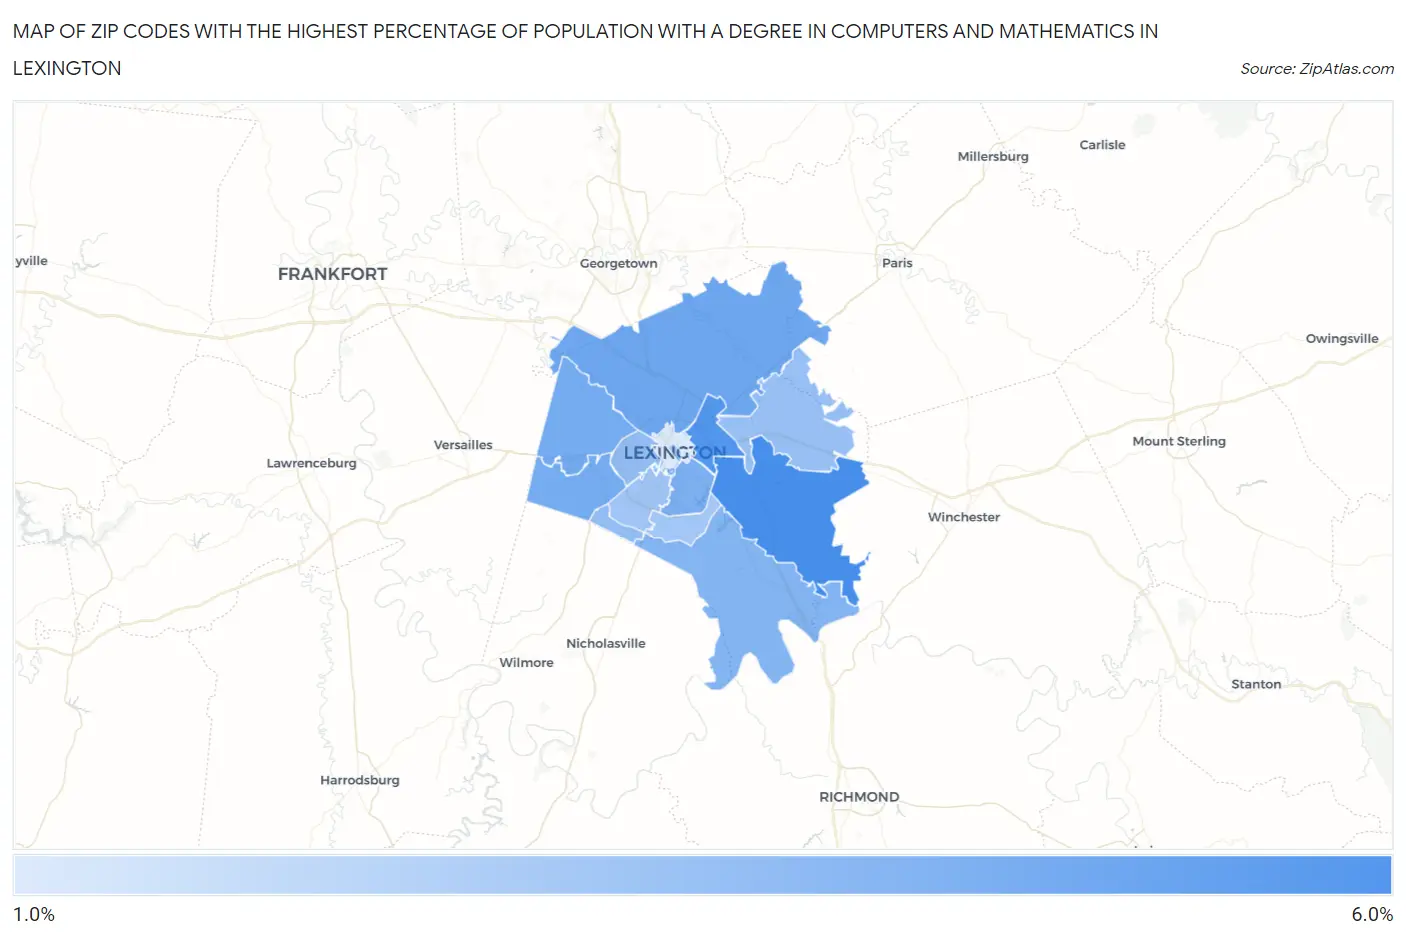
Zip Codes with the Highest Percentage of Population with a Degree in Computers and Mathematics in Lexington, KY
RELATED REPORTS & OPTIONS
Computers and Mathematics
Lexington
Compare Zip Codes
Map of Zip Codes with the Highest Percentage of Population with a Degree in Computers and Mathematics in Lexington
1.6%
5.2%
Zip Codes with the Highest Percentage of Population with a Degree in Computers and Mathematics in Lexington, KY
| Zip Code | % Graduates | vs State | vs National | |
| 1. | 40509 | 5.2% | 3.8%(+1.36)#107 | 4.9%(+0.302)#6,997 |
| 2. | 40505 | 4.9% | 3.8%(+1.06)#117 | 4.9%(+0.003)#7,702 |
| 3. | 40511 | 4.3% | 3.8%(+0.416)#147 | 4.9%(-0.643)#9,681 |
| 4. | 40513 | 4.1% | 3.8%(+0.265)#157 | 4.9%(-0.793)#10,137 |
| 5. | 40510 | 4.1% | 3.8%(+0.246)#160 | 4.9%(-0.812)#10,202 |
| 6. | 40502 | 3.9% | 3.8%(+0.064)#173 | 4.9%(-0.994)#10,810 |
| 7. | 40515 | 3.8% | 3.8%(-0.078)#181 | 4.9%(-1.14)#11,337 |
| 8. | 40504 | 3.4% | 3.8%(-0.460)#203 | 4.9%(-1.52)#12,738 |
| 9. | 40514 | 3.4% | 3.8%(-0.475)#204 | 4.9%(-1.53)#12,789 |
| 10. | 40516 | 3.3% | 3.8%(-0.567)#212 | 4.9%(-1.63)#13,124 |
| 11. | 40503 | 3.0% | 3.8%(-0.822)#228 | 4.9%(-1.88)#14,050 |
| 12. | 40517 | 3.0% | 3.8%(-0.853)#232 | 4.9%(-1.91)#14,149 |
| 13. | 40507 | 2.9% | 3.8%(-0.950)#238 | 4.9%(-2.01)#14,474 |
| 14. | 40508 | 1.6% | 3.8%(-2.23)#288 | 4.9%(-3.29)#18,846 |
1
Common Questions
What are the Top 10 Zip Codes with the Highest Percentage of Population with a Degree in Computers and Mathematics in Lexington, KY?
Top 10 Zip Codes with the Highest Percentage of Population with a Degree in Computers and Mathematics in Lexington, KY are:
What zip code has the Highest Percentage of Population with a Degree in Computers and Mathematics in Lexington, KY?
40509 has the Highest Percentage of Population with a Degree in Computers and Mathematics in Lexington, KY with 5.2%.
What is the Percentage of Population with a Degree in Computers and Mathematics in Lexington, KY?
Percentage of Population with a Degree in Computers and Mathematics in Lexington is 3.8%.
What is the Percentage of Population with a Degree in Computers and Mathematics in Kentucky?
Percentage of Population with a Degree in Computers and Mathematics in Kentucky is 3.8%.
What is the Percentage of Population with a Degree in Computers and Mathematics in the United States?
Percentage of Population with a Degree in Computers and Mathematics in the United States is 4.9%.