Yulee, FL Map & Demographics
Yulee Map
Yulee Overview
$34,559
PER CAPITA INCOME
$87,566
AVG FAMILY INCOME
$79,818
AVG HOUSEHOLD INCOME
32.7%
WAGE / INCOME GAP [ % ]
67.3¢/ $1
WAGE / INCOME GAP [ $ ]
0.38
INEQUALITY / GINI INDEX
13,776
TOTAL POPULATION
7,370
MALE POPULATION
6,406
FEMALE POPULATION
115.05
MALES / 100 FEMALES
86.92
FEMALES / 100 MALES
37.6
MEDIAN AGE
3.0
AVG FAMILY SIZE
2.6
AVG HOUSEHOLD SIZE
6,773
LABOR FORCE [ PEOPLE ]
61.7%
PERCENT IN LABOR FORCE
1.9%
UNEMPLOYMENT RATE
Yulee Zip Codes
Yulee Area Codes
Income in Yulee
Income Overview in Yulee
Per Capita Income in Yulee is $34,559, while median incomes of families and households are $87,566 and $79,818 respectively.
| Characteristic | Number | Measure |
| Per Capita Income | 13,776 | $34,559 |
| Median Family Income | 3,874 | $87,566 |
| Mean Family Income | 3,874 | $92,154 |
| Median Household Income | 5,337 | $79,818 |
| Mean Household Income | 5,337 | $84,986 |
| Income Deficit | 3,874 | $0 |
| Wage / Income Gap (%) | 13,776 | 32.72% |
| Wage / Income Gap ($) | 13,776 | 67.28¢ per $1 |
| Gini / Inequality Index | 13,776 | 0.38 |
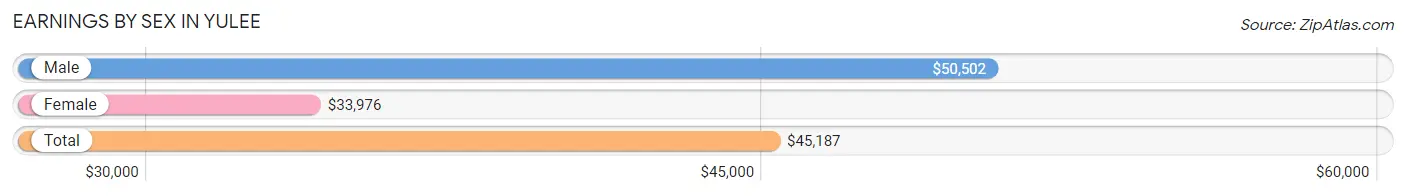
Earnings by Sex in Yulee
Average Earnings in Yulee are $45,187, $50,502 for men and $33,976 for women, a difference of 32.7%.
| Sex | Number | Average Earnings |
| Male | 4,136 (57.4%) | $50,502 |
| Female | 3,076 (42.6%) | $33,976 |
| Total | 7,212 (100.0%) | $45,187 |
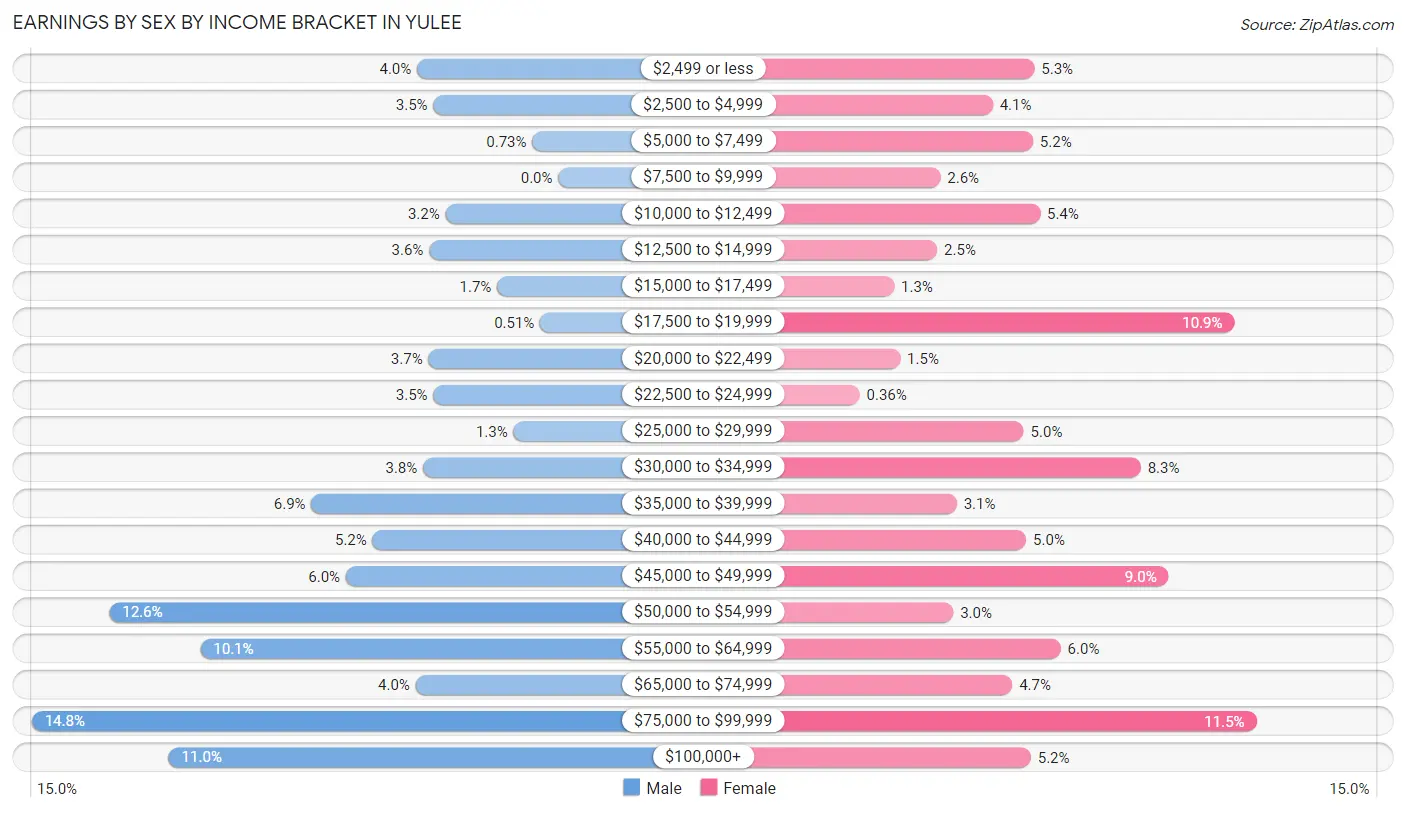
Earnings by Sex by Income Bracket in Yulee
The most common earnings brackets in Yulee are $75,000 to $99,999 for men (612 | 14.8%) and $75,000 to $99,999 for women (354 | 11.5%).
| Income | Male | Female |
| $2,499 or less | 164 (4.0%) | 162 (5.3%) |
| $2,500 to $4,999 | 145 (3.5%) | 126 (4.1%) |
| $5,000 to $7,499 | 30 (0.7%) | 161 (5.2%) |
| $7,500 to $9,999 | 0 (0.0%) | 81 (2.6%) |
| $10,000 to $12,499 | 131 (3.2%) | 167 (5.4%) |
| $12,500 to $14,999 | 150 (3.6%) | 78 (2.5%) |
| $15,000 to $17,499 | 71 (1.7%) | 41 (1.3%) |
| $17,500 to $19,999 | 21 (0.5%) | 335 (10.9%) |
| $20,000 to $22,499 | 151 (3.6%) | 46 (1.5%) |
| $22,500 to $24,999 | 145 (3.5%) | 11 (0.4%) |
| $25,000 to $29,999 | 52 (1.3%) | 153 (5.0%) |
| $30,000 to $34,999 | 157 (3.8%) | 254 (8.3%) |
| $35,000 to $39,999 | 287 (6.9%) | 95 (3.1%) |
| $40,000 to $44,999 | 216 (5.2%) | 155 (5.0%) |
| $45,000 to $49,999 | 247 (6.0%) | 278 (9.0%) |
| $50,000 to $54,999 | 522 (12.6%) | 92 (3.0%) |
| $55,000 to $64,999 | 416 (10.1%) | 185 (6.0%) |
| $65,000 to $74,999 | 166 (4.0%) | 143 (4.6%) |
| $75,000 to $99,999 | 612 (14.8%) | 354 (11.5%) |
| $100,000+ | 453 (11.0%) | 159 (5.2%) |
| Total | 4,136 (100.0%) | 3,076 (100.0%) |
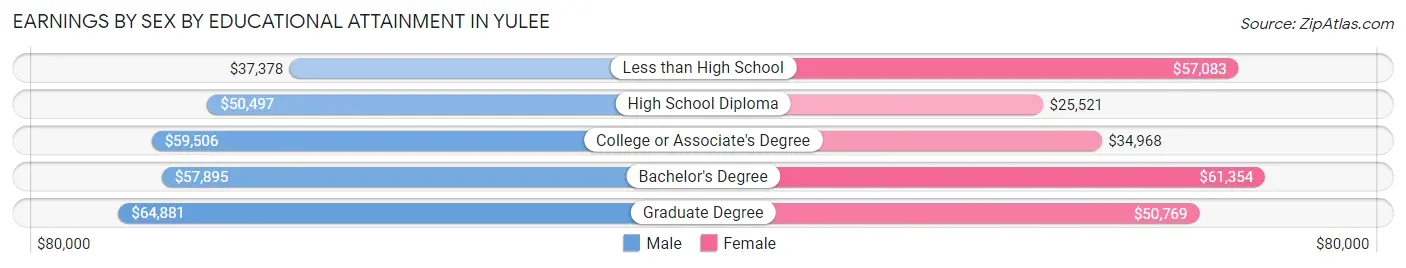
Earnings by Sex by Educational Attainment in Yulee
Average earnings in Yulee are $51,665 for men and $42,640 for women, a difference of 17.5%. Men with an educational attainment of graduate degree enjoy the highest average annual earnings of $64,881, while those with less than high school education earn the least with $37,378. Women with an educational attainment of bachelor's degree earn the most with the average annual earnings of $61,354, while those with high school diploma education have the smallest earnings of $25,521.
| Educational Attainment | Male Income | Female Income |
| Less than High School | $37,378 | $57,083 |
| High School Diploma | $50,497 | $25,521 |
| College or Associate's Degree | $59,506 | $34,968 |
| Bachelor's Degree | $57,895 | $61,354 |
| Graduate Degree | $64,881 | $50,769 |
| Total | $51,665 | $42,640 |
Family Income in Yulee
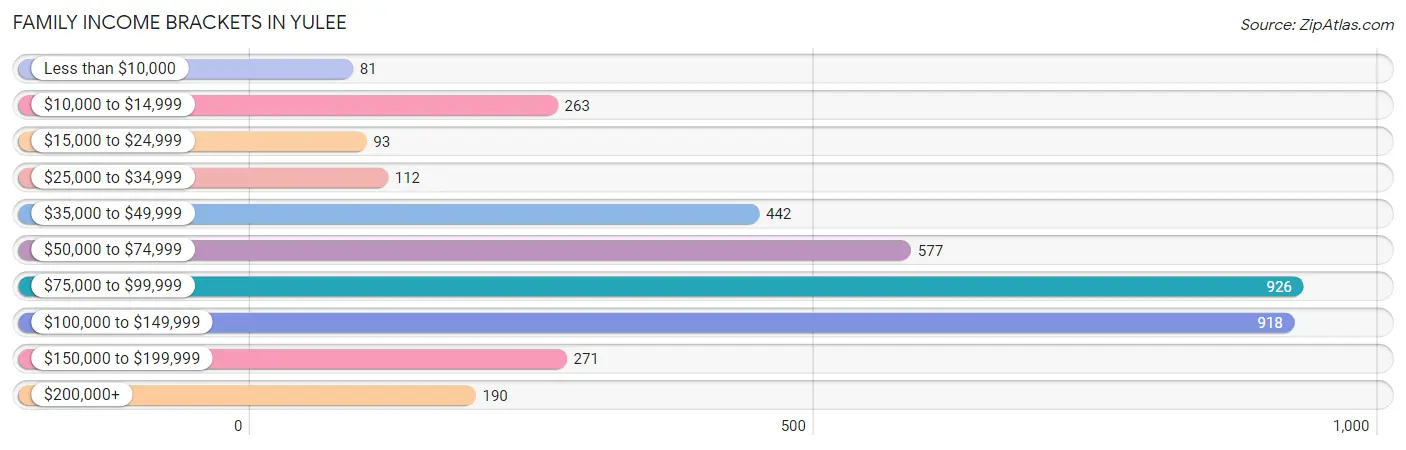
Family Income Brackets in Yulee
According to the Yulee family income data, there are 926 families falling into the $75,000 to $99,999 income range, which is the most common income bracket and makes up 23.9% of all families. Conversely, the less than $10,000 income bracket is the least frequent group with only 81 families (2.1%) belonging to this category.
| Income Bracket | # Families | % Families |
| Less than $10,000 | 81 | 2.1% |
| $10,000 to $14,999 | 263 | 6.8% |
| $15,000 to $24,999 | 93 | 2.4% |
| $25,000 to $34,999 | 112 | 2.9% |
| $35,000 to $49,999 | 442 | 11.4% |
| $50,000 to $74,999 | 577 | 14.9% |
| $75,000 to $99,999 | 926 | 23.9% |
| $100,000 to $149,999 | 918 | 23.7% |
| $150,000 to $199,999 | 271 | 7.0% |
| $200,000+ | 190 | 4.9% |
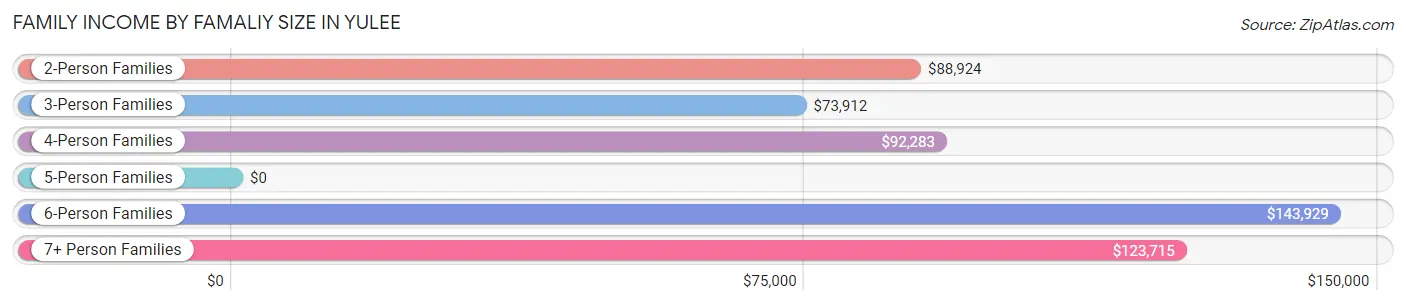
Family Income by Famaliy Size in Yulee
6-person families (66 | 1.7%) account for the highest median family income in Yulee with $143,929 per family, while 2-person families (1,966 | 50.7%) have the highest median income of $44,462 per family member.
| Income Bracket | # Families | Median Income |
| 2-Person Families | 1,966 (50.7%) | $88,924 |
| 3-Person Families | 913 (23.6%) | $73,912 |
| 4-Person Families | 718 (18.5%) | $92,283 |
| 5-Person Families | 154 (4.0%) | $0 |
| 6-Person Families | 66 (1.7%) | $143,929 |
| 7+ Person Families | 57 (1.5%) | $123,715 |
| Total | 3,874 (100.0%) | $87,566 |
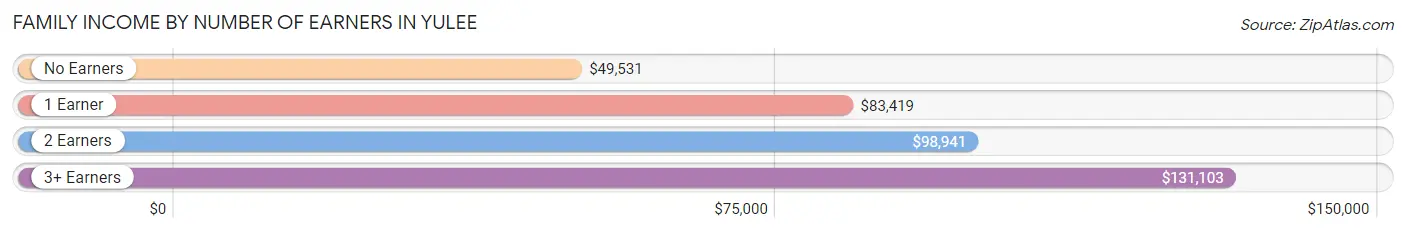
Family Income by Number of Earners in Yulee
The median family income in Yulee is $87,566, with families comprising 3+ earners (265) having the highest median family income of $131,103, while families with no earners (931) have the lowest median family income of $49,531, accounting for 6.8% and 24.0% of families, respectively.
| Number of Earners | # Families | Median Income |
| No Earners | 931 (24.0%) | $49,531 |
| 1 Earner | 1,054 (27.2%) | $83,419 |
| 2 Earners | 1,624 (41.9%) | $98,941 |
| 3+ Earners | 265 (6.8%) | $131,103 |
| Total | 3,874 (100.0%) | $87,566 |
Household Income in Yulee
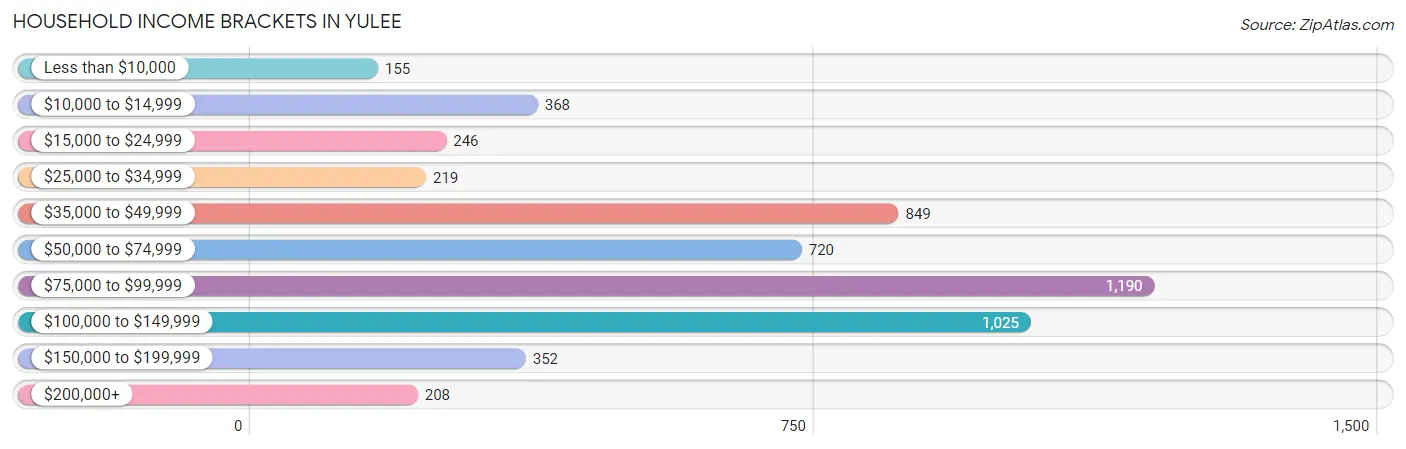
Household Income Brackets in Yulee
With 1,190 households falling in the category, the $75,000 to $99,999 income range is the most frequent in Yulee, accounting for 22.3% of all households. In contrast, only 155 households (2.9%) fall into the less than $10,000 income bracket, making it the least populous group.
| Income Bracket | # Households | % Households |
| Less than $10,000 | 155 | 2.9% |
| $10,000 to $14,999 | 368 | 6.9% |
| $15,000 to $24,999 | 246 | 4.6% |
| $25,000 to $34,999 | 219 | 4.1% |
| $35,000 to $49,999 | 849 | 15.9% |
| $50,000 to $74,999 | 720 | 13.5% |
| $75,000 to $99,999 | 1,190 | 22.3% |
| $100,000 to $149,999 | 1,025 | 19.2% |
| $150,000 to $199,999 | 352 | 6.6% |
| $200,000+ | 208 | 3.9% |
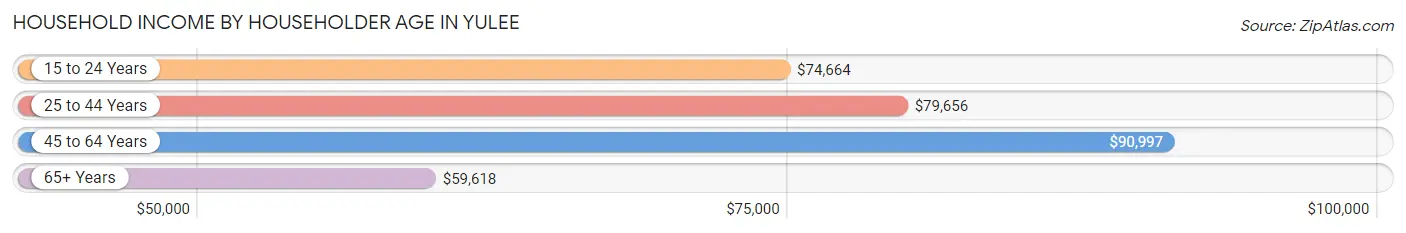
Household Income by Householder Age in Yulee
The median household income in Yulee is $79,818, with the highest median household income of $90,997 found in the 45 to 64 years age bracket for the primary householder. A total of 1,707 households (32.0%) fall into this category. Meanwhile, the 65+ years age bracket for the primary householder has the lowest median household income of $59,618, with 1,581 households (29.6%) in this group.
| Income Bracket | # Households | Median Income |
| 15 to 24 Years | 202 (3.8%) | $74,664 |
| 25 to 44 Years | 1,847 (34.6%) | $79,656 |
| 45 to 64 Years | 1,707 (32.0%) | $90,997 |
| 65+ Years | 1,581 (29.6%) | $59,618 |
| Total | 5,337 (100.0%) | $79,818 |
Poverty in Yulee
Income Below Poverty by Sex and Age in Yulee
With 9.9% poverty level for males and 14.5% for females among the residents of Yulee, under 5 year old males and 6 to 11 year old females are the most vulnerable to poverty, with 191 males (30.6%) and 131 females (43.8%) in their respective age groups living below the poverty level.
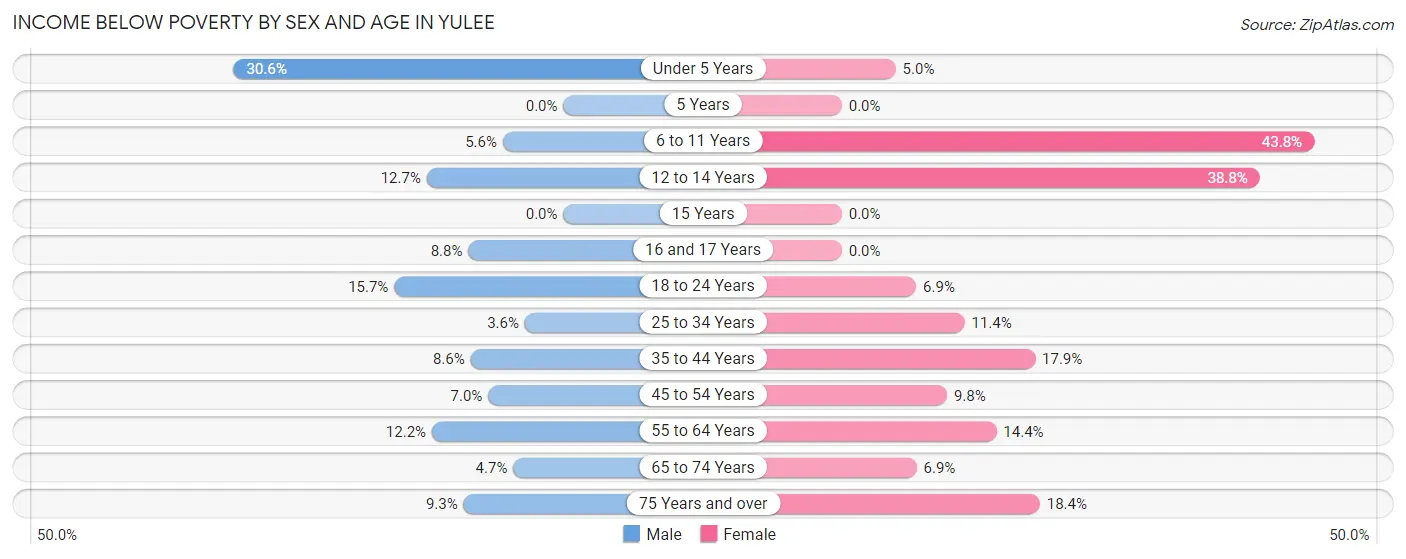
| Age Bracket | Male | Female |
| Under 5 Years | 191 (30.6%) | 20 (5.0%) |
| 5 Years | 0 (0.0%) | 0 (0.0%) |
| 6 to 11 Years | 33 (5.6%) | 131 (43.8%) |
| 12 to 14 Years | 26 (12.7%) | 140 (38.8%) |
| 15 Years | 0 (0.0%) | 0 (0.0%) |
| 16 and 17 Years | 18 (8.8%) | 0 (0.0%) |
| 18 to 24 Years | 105 (15.7%) | 29 (6.9%) |
| 25 to 34 Years | 43 (3.6%) | 95 (11.4%) |
| 35 to 44 Years | 77 (8.6%) | 174 (17.9%) |
| 45 to 54 Years | 61 (7.0%) | 68 (9.8%) |
| 55 to 64 Years | 100 (12.2%) | 131 (14.3%) |
| 65 to 74 Years | 35 (4.6%) | 55 (6.9%) |
| 75 Years and over | 34 (9.3%) | 86 (18.4%) |
| Total | 723 (9.9%) | 929 (14.5%) |
Income Above Poverty by Sex and Age in Yulee
According to the poverty statistics in Yulee, males aged 5 years and females aged 5 years are the age groups that are most secure financially, with 100.0% of males and 100.0% of females in these age groups living above the poverty line.
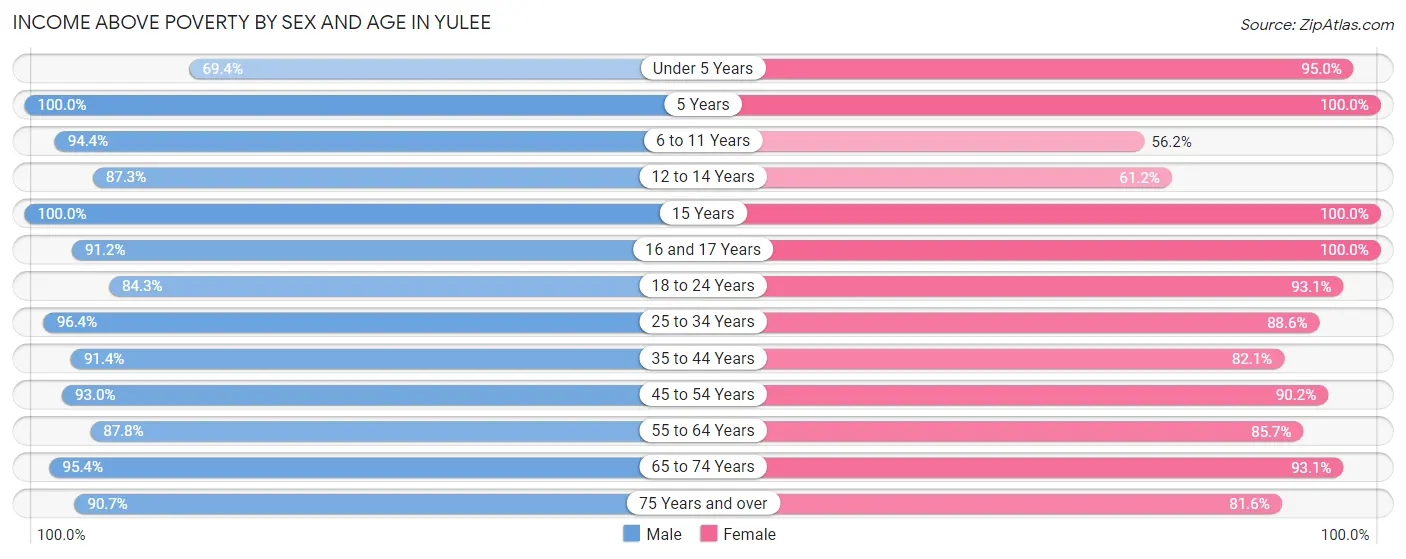
| Age Bracket | Male | Female |
| Under 5 Years | 433 (69.4%) | 380 (95.0%) |
| 5 Years | 39 (100.0%) | 60 (100.0%) |
| 6 to 11 Years | 554 (94.4%) | 168 (56.2%) |
| 12 to 14 Years | 179 (87.3%) | 221 (61.2%) |
| 15 Years | 92 (100.0%) | 90 (100.0%) |
| 16 and 17 Years | 186 (91.2%) | 102 (100.0%) |
| 18 to 24 Years | 564 (84.3%) | 391 (93.1%) |
| 25 to 34 Years | 1,158 (96.4%) | 739 (88.6%) |
| 35 to 44 Years | 817 (91.4%) | 796 (82.1%) |
| 45 to 54 Years | 813 (93.0%) | 629 (90.2%) |
| 55 to 64 Years | 720 (87.8%) | 782 (85.7%) |
| 65 to 74 Years | 717 (95.4%) | 737 (93.1%) |
| 75 Years and over | 333 (90.7%) | 382 (81.6%) |
| Total | 6,605 (90.1%) | 5,477 (85.5%) |
Income Below Poverty Among Married-Couple Families in Yulee
The poverty statistics for married-couple families in Yulee show that 2.1% or 56 of the total 2,602 families live below the poverty line. Families with 3 or 4 children have the highest poverty rate of 16.4%, comprising of 19 families. On the other hand, families with 1 or 2 children have the lowest poverty rate of 0.0%, which includes 0 families.
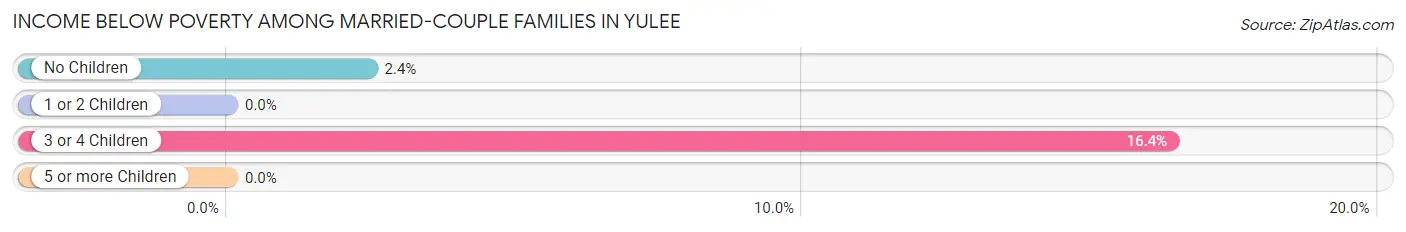
| Children | Above Poverty | Below Poverty |
| No Children | 1,488 (97.6%) | 37 (2.4%) |
| 1 or 2 Children | 914 (100.0%) | 0 (0.0%) |
| 3 or 4 Children | 97 (83.6%) | 19 (16.4%) |
| 5 or more Children | 47 (100.0%) | 0 (0.0%) |
| Total | 2,546 (97.9%) | 56 (2.1%) |
Income Below Poverty Among Single-Parent Households in Yulee
According to the poverty data in Yulee, 15.8% or 58 single-father households and 31.9% or 288 single-mother households are living below the poverty line. Among single-father households, those with 1 or 2 children have the highest poverty rate, with 58 households (23.8%) experiencing poverty. Likewise, among single-mother households, those with 3 or 4 children have the highest poverty rate, with 141 households (84.9%) falling below the poverty line.
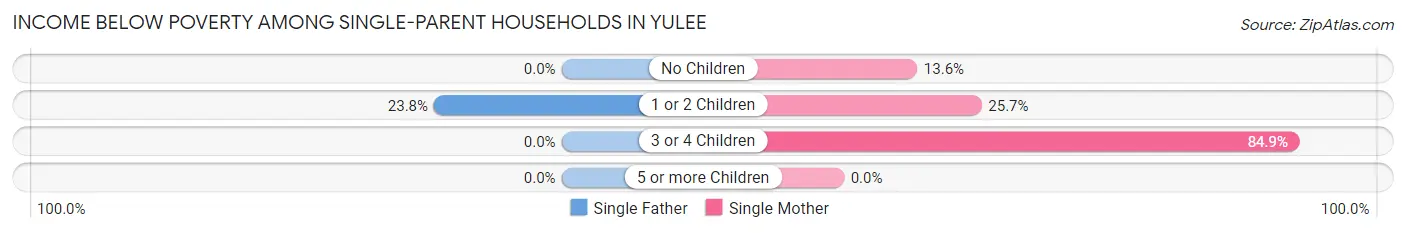
| Children | Single Father | Single Mother |
| No Children | 0 (0.0%) | 48 (13.6%) |
| 1 or 2 Children | 58 (23.8%) | 99 (25.7%) |
| 3 or 4 Children | 0 (0.0%) | 141 (84.9%) |
| 5 or more Children | 0 (0.0%) | 0 (0.0%) |
| Total | 58 (15.8%) | 288 (31.9%) |
Income Below Poverty Among Married-Couple vs Single-Parent Households in Yulee
The poverty data for Yulee shows that 56 of the married-couple family households (2.1%) and 346 of the single-parent households (27.2%) are living below the poverty level. Within the married-couple family households, those with 3 or 4 children have the highest poverty rate, with 19 households (16.4%) falling below the poverty line. Among the single-parent households, those with 3 or 4 children have the highest poverty rate, with 141 household (84.9%) living below poverty.
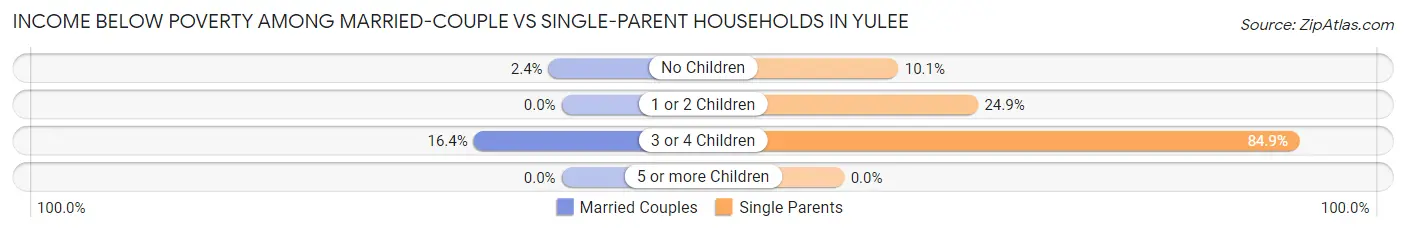
| Children | Married-Couple Families | Single-Parent Households |
| No Children | 37 (2.4%) | 48 (10.1%) |
| 1 or 2 Children | 0 (0.0%) | 157 (24.9%) |
| 3 or 4 Children | 19 (16.4%) | 141 (84.9%) |
| 5 or more Children | 0 (0.0%) | 0 (0.0%) |
| Total | 56 (2.1%) | 346 (27.2%) |
Race in Yulee
The most populous races in Yulee are White / Caucasian (11,558 | 83.9%), Two or more Races (977 | 7.1%), and Black / African American (840 | 6.1%).
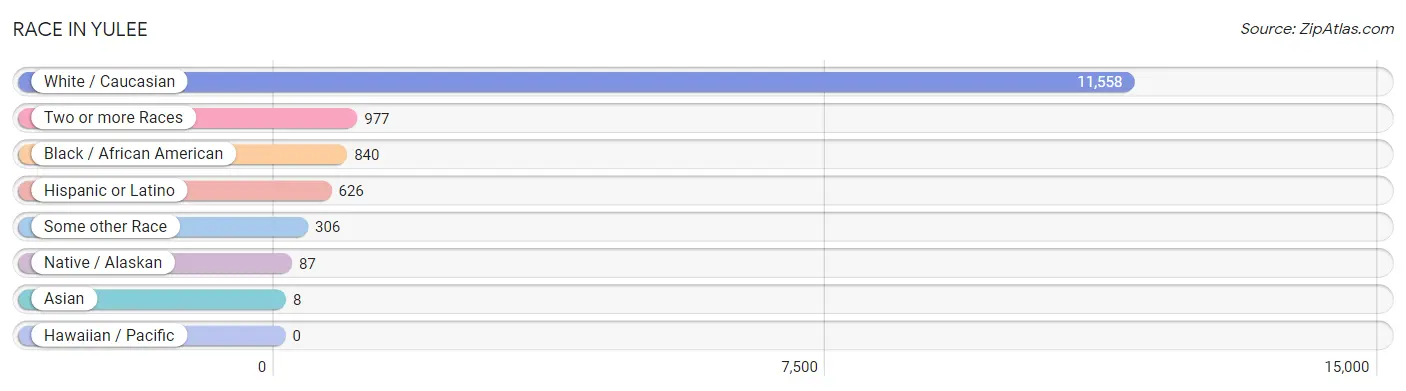
| Race | # Population | % Population |
| Asian | 8 | 0.1% |
| Black / African American | 840 | 6.1% |
| Hawaiian / Pacific | 0 | 0.0% |
| Hispanic or Latino | 626 | 4.5% |
| Native / Alaskan | 87 | 0.6% |
| White / Caucasian | 11,558 | 83.9% |
| Two or more Races | 977 | 7.1% |
| Some other Race | 306 | 2.2% |
| Total | 13,776 | 100.0% |
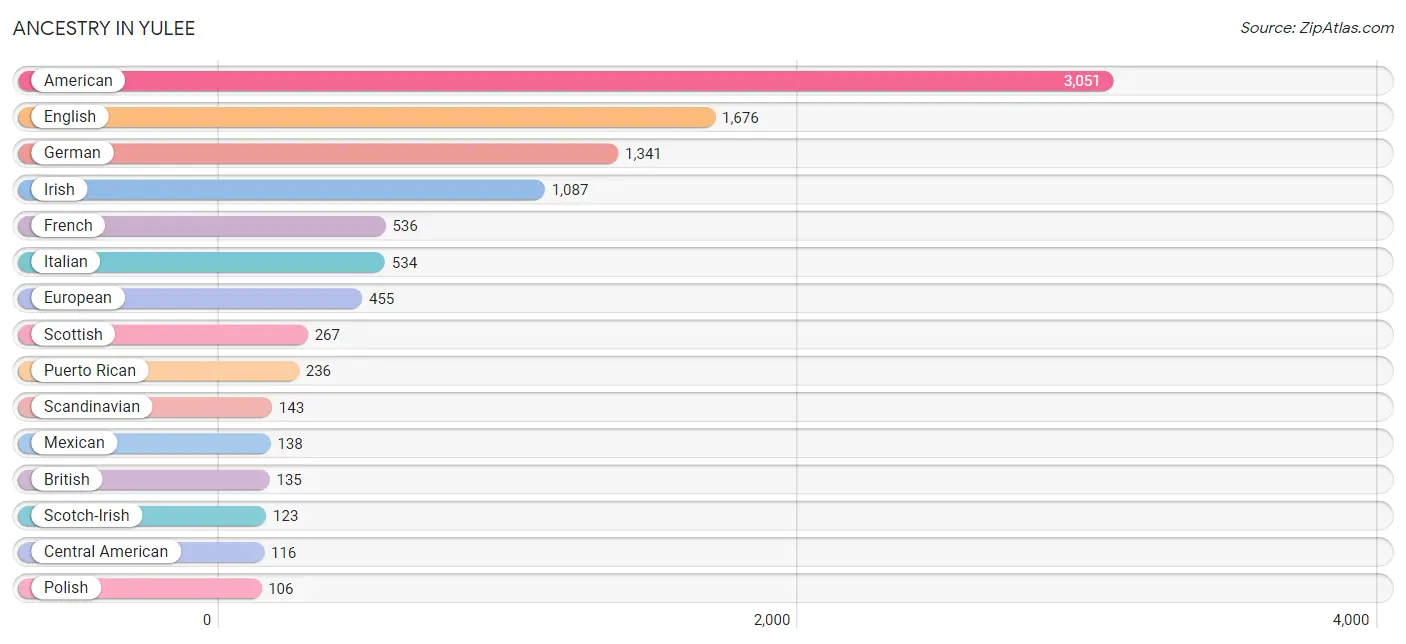
Ancestry in Yulee
The most populous ancestries reported in Yulee are American (3,051 | 22.2%), English (1,676 | 12.2%), German (1,341 | 9.7%), Irish (1,087 | 7.9%), and French (536 | 3.9%), together accounting for 55.8% of all Yulee residents.
| Ancestry | # Population | % Population |
| African | 49 | 0.4% |
| American | 3,051 | 22.2% |
| Arab | 95 | 0.7% |
| Bahamian | 25 | 0.2% |
| Basque | 11 | 0.1% |
| Belgian | 62 | 0.4% |
| Brazilian | 45 | 0.3% |
| British | 135 | 1.0% |
| Burmese | 36 | 0.3% |
| Canadian | 17 | 0.1% |
| Central American | 116 | 0.8% |
| Central American Indian | 13 | 0.1% |
| Cherokee | 43 | 0.3% |
| Cuban | 7 | 0.1% |
| Czechoslovakian | 13 | 0.1% |
| Dutch | 86 | 0.6% |
| English | 1,676 | 12.2% |
| Estonian | 15 | 0.1% |
| European | 455 | 3.3% |
| Finnish | 52 | 0.4% |
| French | 536 | 3.9% |
| French Canadian | 52 | 0.4% |
| German | 1,341 | 9.7% |
| Honduran | 16 | 0.1% |
| Irish | 1,087 | 7.9% |
| Iroquois | 20 | 0.2% |
| Italian | 534 | 3.9% |
| Korean | 8 | 0.1% |
| Lebanese | 63 | 0.5% |
| Lithuanian | 25 | 0.2% |
| Mexican | 138 | 1.0% |
| Norwegian | 82 | 0.6% |
| Panamanian | 26 | 0.2% |
| Polish | 106 | 0.8% |
| Portuguese | 47 | 0.3% |
| Puerto Rican | 236 | 1.7% |
| Russian | 46 | 0.3% |
| Salvadoran | 74 | 0.5% |
| Scandinavian | 143 | 1.0% |
| Scotch-Irish | 123 | 0.9% |
| Scottish | 267 | 1.9% |
| South American | 11 | 0.1% |
| Spaniard | 93 | 0.7% |
| Subsaharan African | 49 | 0.4% |
| Swedish | 84 | 0.6% |
| Swiss | 48 | 0.4% |
| Syrian | 32 | 0.2% |
| Turkish | 27 | 0.2% |
| Ukrainian | 104 | 0.7% |
| Uruguayan | 11 | 0.1% |
| Welsh | 58 | 0.4% | View All 51 Rows |
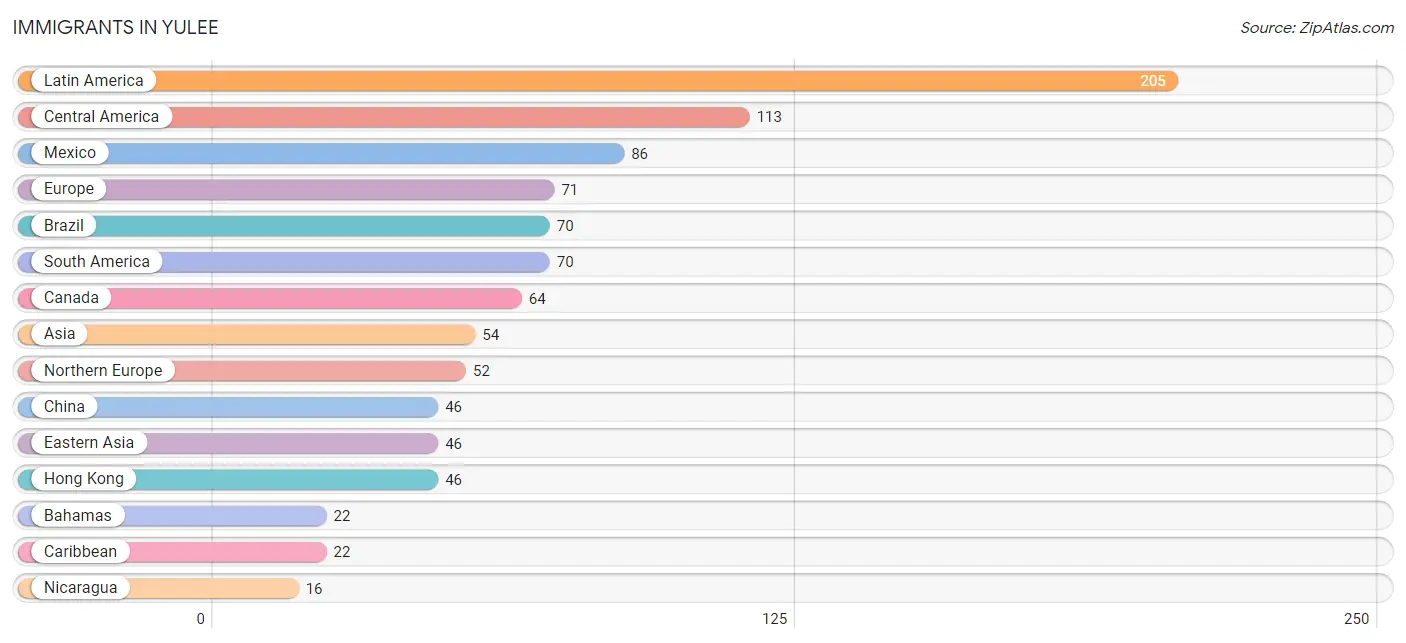
Immigrants in Yulee
The most numerous immigrant groups reported in Yulee came from Latin America (205 | 1.5%), Central America (113 | 0.8%), Mexico (86 | 0.6%), Europe (71 | 0.5%), and Brazil (70 | 0.5%), together accounting for 4.0% of all Yulee residents.
| Immigration Origin | # Population | % Population |
| Africa | 12 | 0.1% |
| Asia | 54 | 0.4% |
| Bahamas | 22 | 0.2% |
| Brazil | 70 | 0.5% |
| Cabo Verde | 12 | 0.1% |
| Canada | 64 | 0.5% |
| Caribbean | 22 | 0.2% |
| Central America | 113 | 0.8% |
| China | 46 | 0.3% |
| Eastern Asia | 46 | 0.3% |
| England | 11 | 0.1% |
| Europe | 71 | 0.5% |
| France | 6 | 0.0% |
| Guatemala | 11 | 0.1% |
| Hong Kong | 46 | 0.3% |
| Latin America | 205 | 1.5% |
| Mexico | 86 | 0.6% |
| Nicaragua | 16 | 0.1% |
| Northern Europe | 52 | 0.4% |
| Philippines | 8 | 0.1% |
| Portugal | 13 | 0.1% |
| South America | 70 | 0.5% |
| South Eastern Asia | 8 | 0.1% |
| Southern Europe | 13 | 0.1% |
| Sweden | 15 | 0.1% |
| Western Africa | 12 | 0.1% |
| Western Europe | 6 | 0.0% | View All 27 Rows |
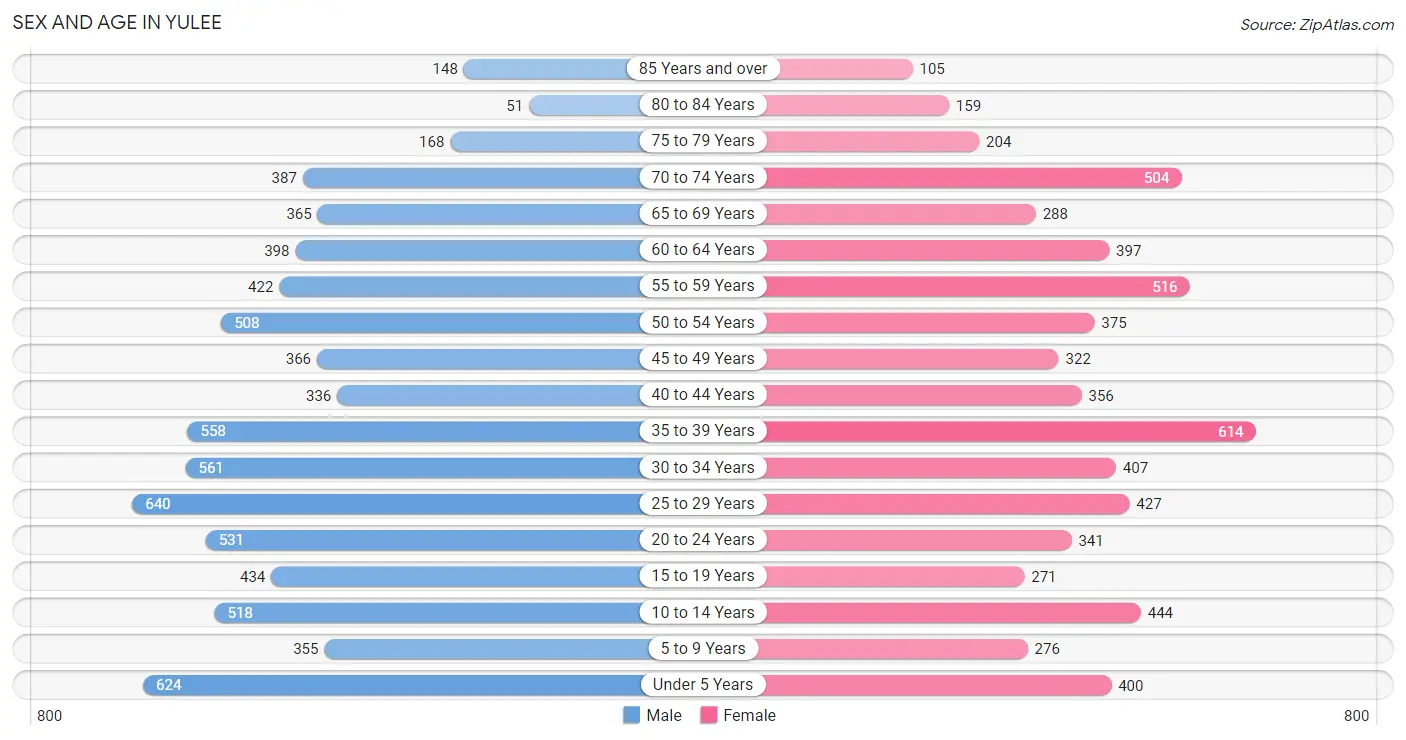
Sex and Age in Yulee
Sex and Age in Yulee
The most populous age groups in Yulee are 25 to 29 Years (640 | 8.7%) for men and 35 to 39 Years (614 | 9.6%) for women.
| Age Bracket | Male | Female |
| Under 5 Years | 624 (8.5%) | 400 (6.2%) |
| 5 to 9 Years | 355 (4.8%) | 276 (4.3%) |
| 10 to 14 Years | 518 (7.0%) | 444 (6.9%) |
| 15 to 19 Years | 434 (5.9%) | 271 (4.2%) |
| 20 to 24 Years | 531 (7.2%) | 341 (5.3%) |
| 25 to 29 Years | 640 (8.7%) | 427 (6.7%) |
| 30 to 34 Years | 561 (7.6%) | 407 (6.4%) |
| 35 to 39 Years | 558 (7.6%) | 614 (9.6%) |
| 40 to 44 Years | 336 (4.6%) | 356 (5.6%) |
| 45 to 49 Years | 366 (5.0%) | 322 (5.0%) |
| 50 to 54 Years | 508 (6.9%) | 375 (5.9%) |
| 55 to 59 Years | 422 (5.7%) | 516 (8.1%) |
| 60 to 64 Years | 398 (5.4%) | 397 (6.2%) |
| 65 to 69 Years | 365 (5.0%) | 288 (4.5%) |
| 70 to 74 Years | 387 (5.2%) | 504 (7.9%) |
| 75 to 79 Years | 168 (2.3%) | 204 (3.2%) |
| 80 to 84 Years | 51 (0.7%) | 159 (2.5%) |
| 85 Years and over | 148 (2.0%) | 105 (1.6%) |
| Total | 7,370 (100.0%) | 6,406 (100.0%) |
Families and Households in Yulee
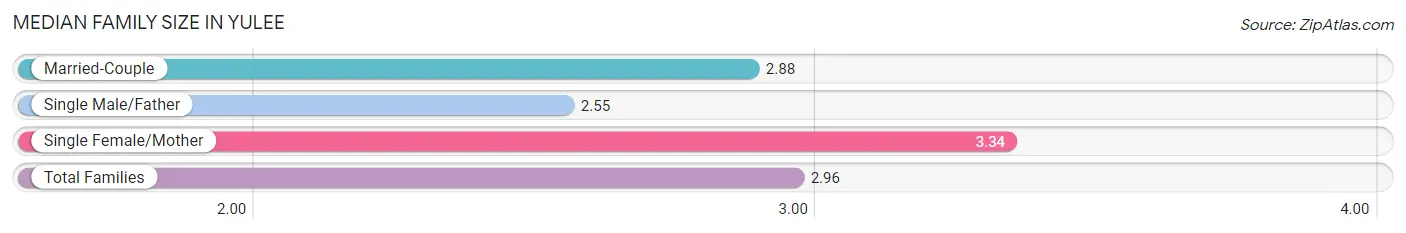
Median Family Size in Yulee
The median family size in Yulee is 2.96 persons per family, with single female/mother families (904 | 23.3%) accounting for the largest median family size of 3.34 persons per family. On the other hand, single male/father families (368 | 9.5%) represent the smallest median family size with 2.55 persons per family.
| Family Type | # Families | Family Size |
| Married-Couple | 2,602 (67.2%) | 2.88 |
| Single Male/Father | 368 (9.5%) | 2.55 |
| Single Female/Mother | 904 (23.3%) | 3.34 |
| Total Families | 3,874 (100.0%) | 2.96 |
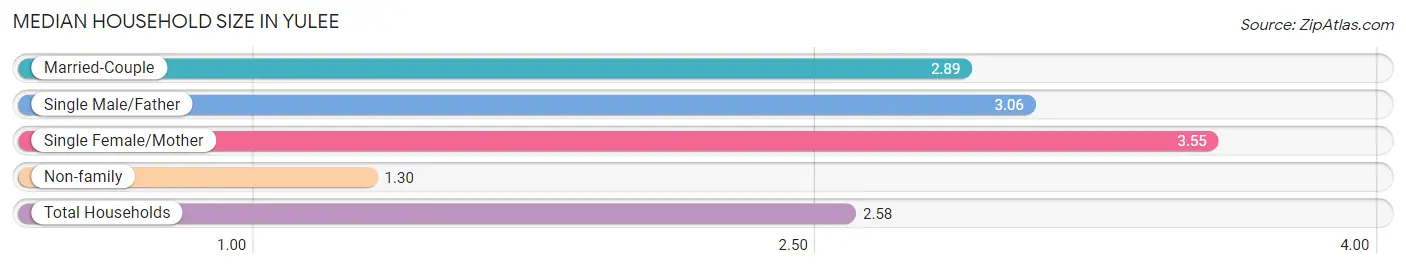
Median Household Size in Yulee
The median household size in Yulee is 2.58 persons per household, with single female/mother households (904 | 16.9%) accounting for the largest median household size of 3.55 persons per household. non-family households (1,463 | 27.4%) represent the smallest median household size with 1.30 persons per household.
| Household Type | # Households | Household Size |
| Married-Couple | 2,602 (48.7%) | 2.89 |
| Single Male/Father | 368 (6.9%) | 3.06 |
| Single Female/Mother | 904 (16.9%) | 3.55 |
| Non-family | 1,463 (27.4%) | 1.30 |
| Total Households | 5,337 (100.0%) | 2.58 |
Household Size by Marriage Status in Yulee
Out of a total of 5,337 households in Yulee, 3,874 (72.6%) are family households, while 1,463 (27.4%) are nonfamily households. The most numerous type of family households are 2-person households, comprising 1,951, and the most common type of nonfamily households are 1-person households, comprising 1,055.
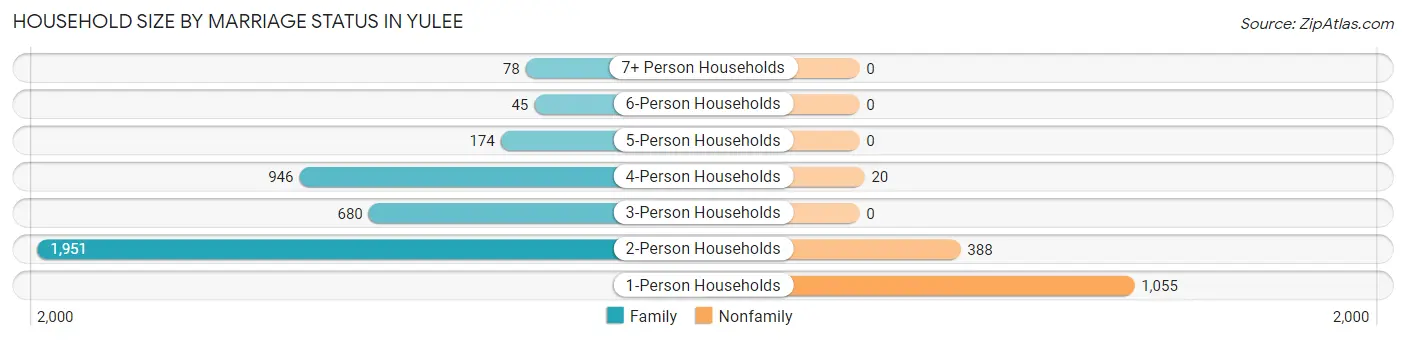
| Household Size | Family Households | Nonfamily Households |
| 1-Person Households | - | 1,055 (19.8%) |
| 2-Person Households | 1,951 (36.6%) | 388 (7.3%) |
| 3-Person Households | 680 (12.7%) | 0 (0.0%) |
| 4-Person Households | 946 (17.7%) | 20 (0.4%) |
| 5-Person Households | 174 (3.3%) | 0 (0.0%) |
| 6-Person Households | 45 (0.8%) | 0 (0.0%) |
| 7+ Person Households | 78 (1.5%) | 0 (0.0%) |
| Total | 3,874 (72.6%) | 1,463 (27.4%) |
Female Fertility in Yulee
Fertility by Age in Yulee
Average fertility rate in Yulee is 73.0 births per 1,000 women. Women in the age bracket of 20 to 34 years have the highest fertility rate with 160.0 births per 1,000 women. Women in the age bracket of 20 to 34 years acount for 89.9% of all women with births.
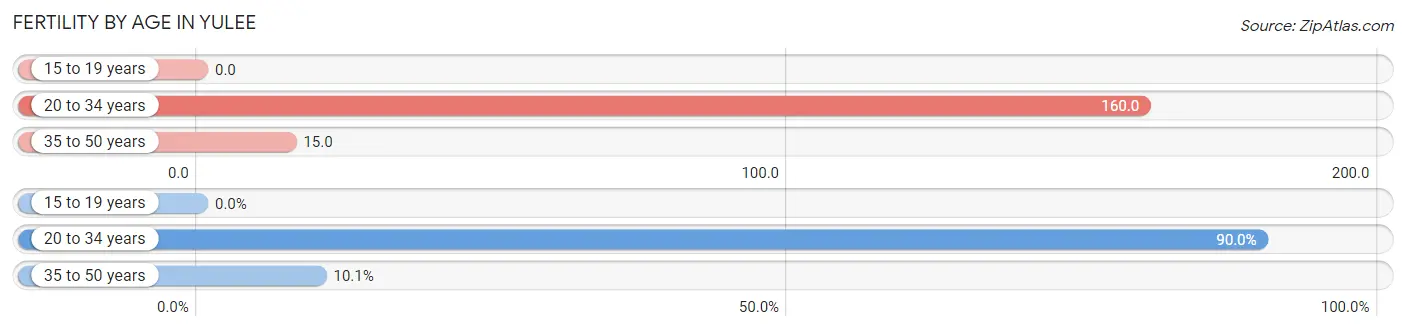
| Age Bracket | Women with Births | Births / 1,000 Women |
| 15 to 19 years | 0 (0.0%) | 0.0 |
| 20 to 34 years | 188 (89.9%) | 160.0 |
| 35 to 50 years | 21 (10.1%) | 15.0 |
| Total | 209 (100.0%) | 73.0 |
Fertility by Age by Marriage Status in Yulee
25.4% of women with births (209) in Yulee are married. The highest percentage of unmarried women with births falls into 20 to 34 years age bracket with 83.0% of them unmarried at the time of birth, while the lowest percentage of unmarried women with births belong to 35 to 50 years age bracket with 0.0% of them unmarried.
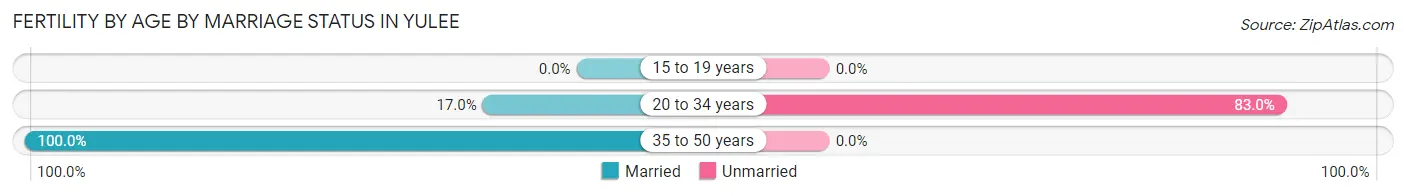
| Age Bracket | Married | Unmarried |
| 15 to 19 years | 0 (0.0%) | 0 (0.0%) |
| 20 to 34 years | 32 (17.0%) | 156 (83.0%) |
| 35 to 50 years | 21 (100.0%) | 0 (0.0%) |
| Total | 53 (25.4%) | 156 (74.6%) |
Fertility by Education in Yulee
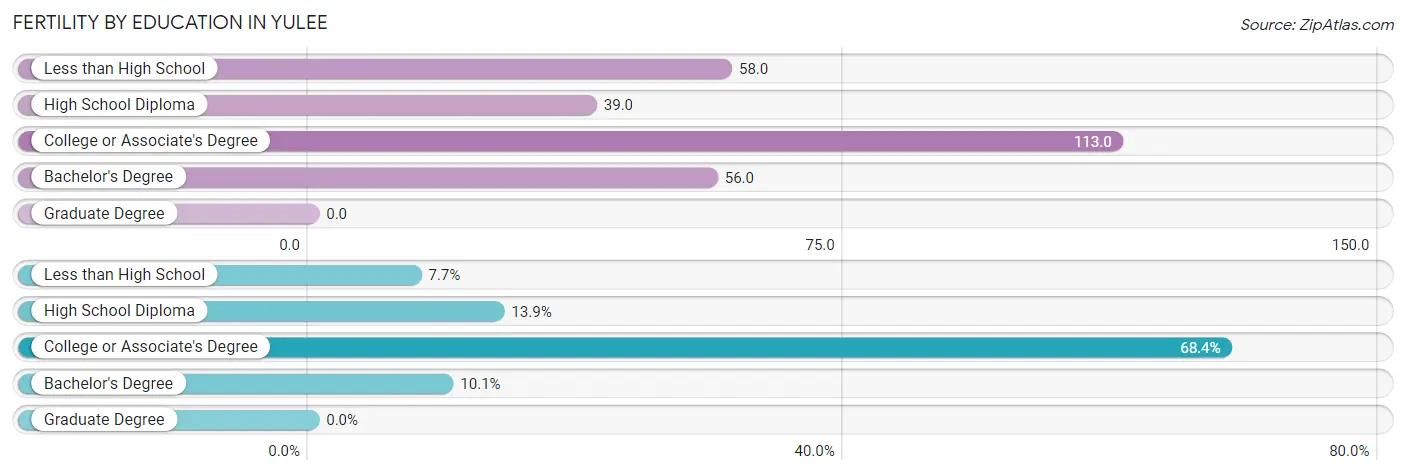
| Educational Attainment | Women with Births | Births / 1,000 Women |
| Less than High School | 16 (7.7%) | 58.0 |
| High School Diploma | 29 (13.9%) | 39.0 |
| College or Associate's Degree | 143 (68.4%) | 113.0 |
| Bachelor's Degree | 21 (10.1%) | 56.0 |
| Graduate Degree | 0 (0.0%) | 0.0 |
| Total | 209 (100.0%) | 73.0 |
Fertility by Education by Marriage Status in Yulee
74.6% of women with births in Yulee are unmarried. Women with the educational attainment of less than high school are most likely to be married with 100.0% of them married at childbirth, while women with the educational attainment of high school diploma are least likely to be married with 100.0% of them unmarried at childbirth.
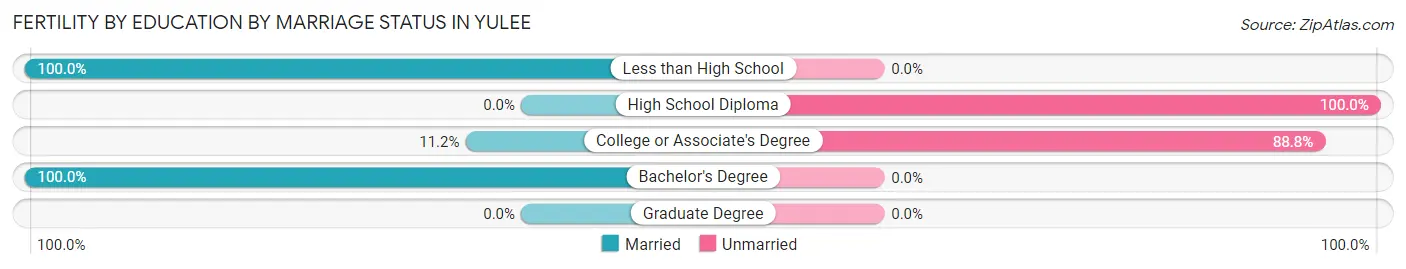
| Educational Attainment | Married | Unmarried |
| Less than High School | 16 (100.0%) | 0 (0.0%) |
| High School Diploma | 0 (0.0%) | 29 (100.0%) |
| College or Associate's Degree | 16 (11.2%) | 127 (88.8%) |
| Bachelor's Degree | 21 (100.0%) | 0 (0.0%) |
| Graduate Degree | 0 (0.0%) | 0 (0.0%) |
| Total | 53 (25.4%) | 156 (74.6%) |
Employment Characteristics in Yulee
Employment by Class of Employer in Yulee
Among the 6,477 employed individuals in Yulee, private company employees (4,965 | 76.7%), local government employees (558 | 8.6%), and federal government employees (261 | 4.0%) make up the most common classes of employment.
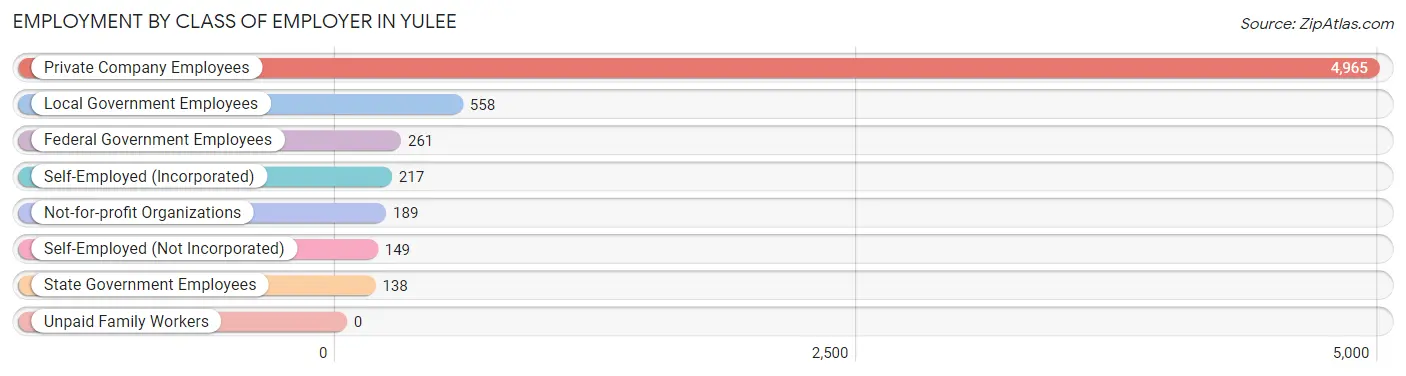
| Employer Class | # Employees | % Employees |
| Private Company Employees | 4,965 | 76.7% |
| Self-Employed (Incorporated) | 217 | 3.4% |
| Self-Employed (Not Incorporated) | 149 | 2.3% |
| Not-for-profit Organizations | 189 | 2.9% |
| Local Government Employees | 558 | 8.6% |
| State Government Employees | 138 | 2.1% |
| Federal Government Employees | 261 | 4.0% |
| Unpaid Family Workers | 0 | 0.0% |
| Total | 6,477 | 100.0% |
Employment Status by Age in Yulee
According to the labor force statistics for Yulee, out of the total population over 16 years of age (10,977), 61.7% or 6,773 individuals are in the labor force, with 1.9% or 129 of them unemployed. The age group with the highest labor force participation rate is 30 to 34 years, with 89.4% or 865 individuals in the labor force. Within the labor force, the 16 to 19 years age range has the highest percentage of unemployed individuals, with 12.6% or 29 of them being unemployed.
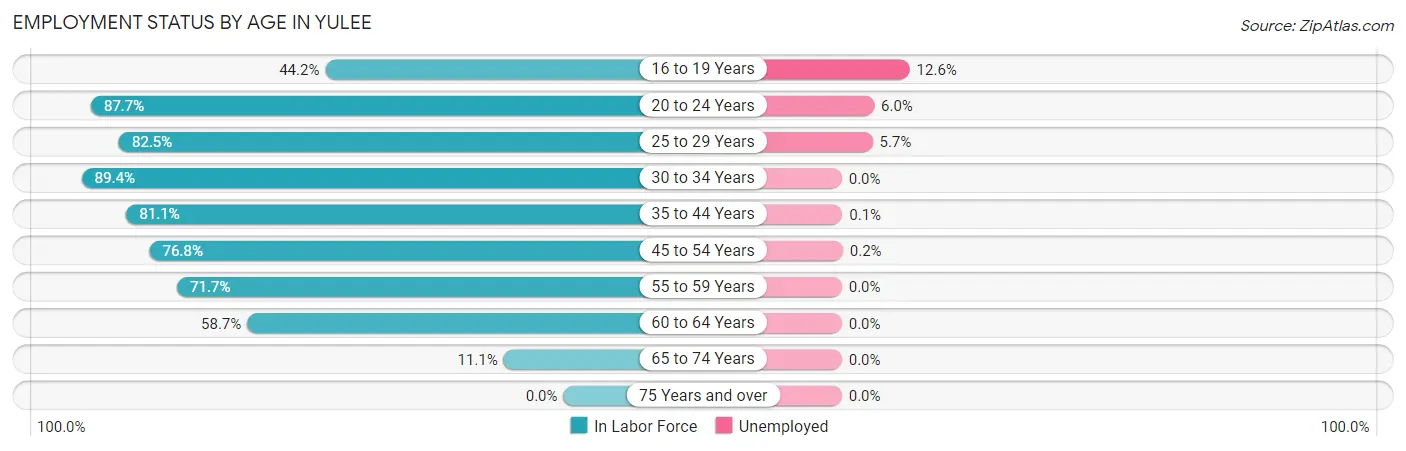
| Age Bracket | In Labor Force | Unemployed |
| 16 to 19 Years | 231 (44.2%) | 29 (12.6%) |
| 20 to 24 Years | 765 (87.7%) | 46 (6.0%) |
| 25 to 29 Years | 880 (82.5%) | 50 (5.7%) |
| 30 to 34 Years | 865 (89.4%) | 0 (0.0%) |
| 35 to 44 Years | 1,512 (81.1%) | 2 (0.1%) |
| 45 to 54 Years | 1,207 (76.8%) | 2 (0.2%) |
| 55 to 59 Years | 673 (71.7%) | 0 (0.0%) |
| 60 to 64 Years | 467 (58.7%) | 0 (0.0%) |
| 65 to 74 Years | 171 (11.1%) | 0 (0.0%) |
| 75 Years and over | 0 (0.0%) | 0 (0.0%) |
| Total | 6,773 (61.7%) | 129 (1.9%) |
Employment Status by Educational Attainment in Yulee
According to labor force statistics for Yulee, 77.8% of individuals (5,604) out of the total population between 25 and 64 years of age (7,203) are in the labor force, with 0.9% or 50 of them being unemployed. The group with the highest labor force participation rate are those with the educational attainment of bachelor's degree or higher, with 88.8% or 1,212 individuals in the labor force. Within the labor force, individuals with high school diploma education have the highest percentage of unemployment, with 2.2% or 48 of them being unemployed.
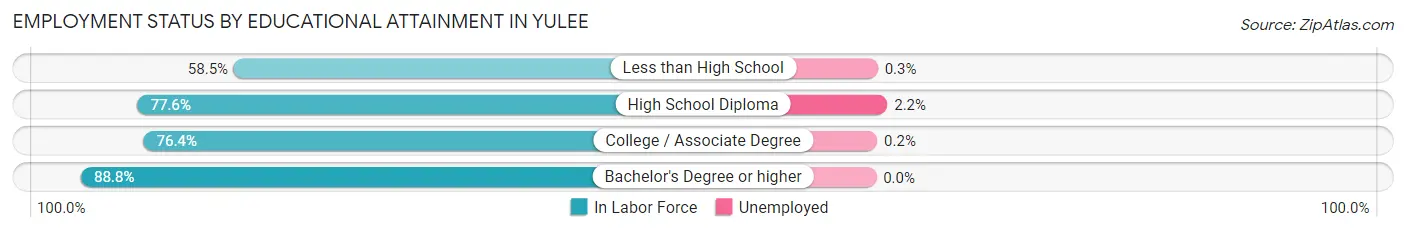
| Educational Attainment | In Labor Force | Unemployed |
| Less than High School | 336 (58.5%) | 2 (0.3%) |
| High School Diploma | 2,175 (77.6%) | 62 (2.2%) |
| College / Associate Degree | 1,880 (76.4%) | 5 (0.2%) |
| Bachelor's Degree or higher | 1,212 (88.8%) | 0 (0.0%) |
| Total | 5,604 (77.8%) | 65 (0.9%) |
Employment Occupations by Sex in Yulee
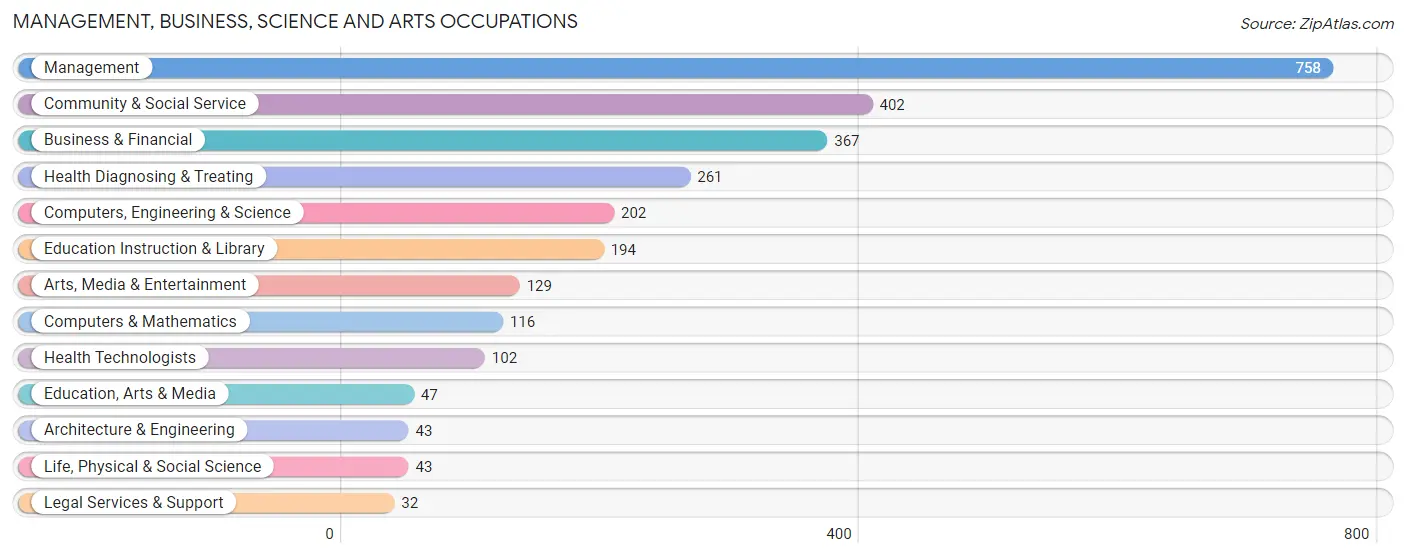
Management, Business, Science and Arts Occupations
The most common Management, Business, Science and Arts occupations in Yulee are Management (758 | 11.6%), Community & Social Service (402 | 6.2%), Business & Financial (367 | 5.6%), Health Diagnosing & Treating (261 | 4.0%), and Computers, Engineering & Science (202 | 3.1%).
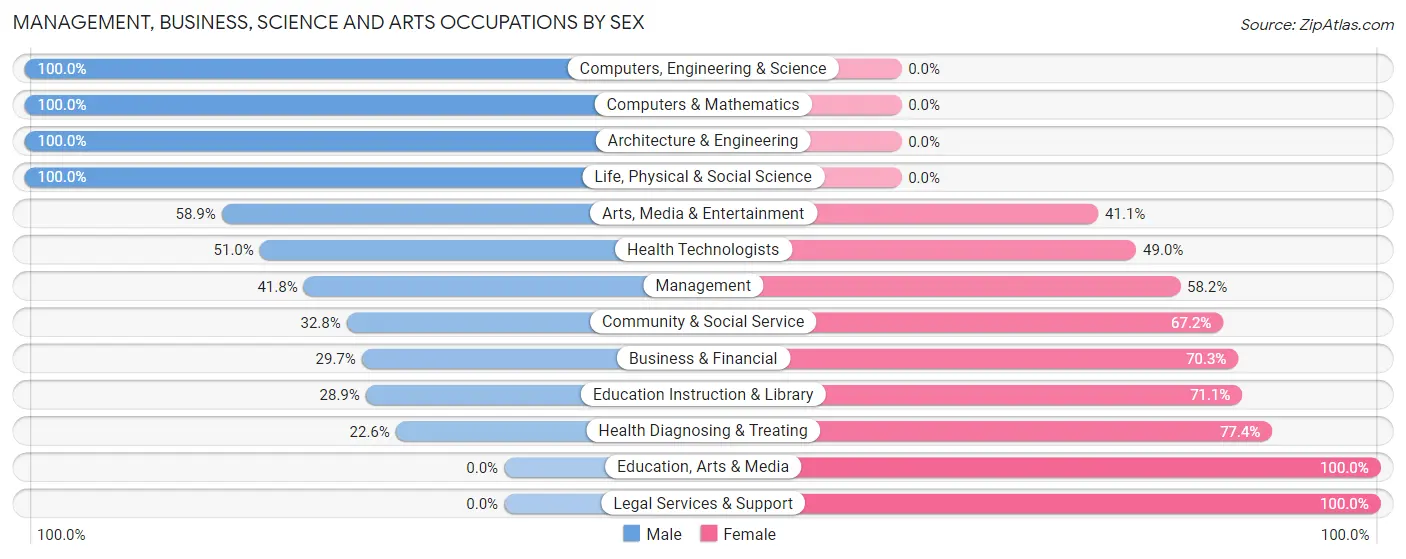
Management, Business, Science and Arts Occupations by Sex
Within the Management, Business, Science and Arts occupations in Yulee, the most male-oriented occupations are Computers, Engineering & Science (100.0%), Computers & Mathematics (100.0%), and Architecture & Engineering (100.0%), while the most female-oriented occupations are Education, Arts & Media (100.0%), Legal Services & Support (100.0%), and Health Diagnosing & Treating (77.4%).
| Occupation | Male | Female |
| Management | 317 (41.8%) | 441 (58.2%) |
| Business & Financial | 109 (29.7%) | 258 (70.3%) |
| Computers, Engineering & Science | 202 (100.0%) | 0 (0.0%) |
| Computers & Mathematics | 116 (100.0%) | 0 (0.0%) |
| Architecture & Engineering | 43 (100.0%) | 0 (0.0%) |
| Life, Physical & Social Science | 43 (100.0%) | 0 (0.0%) |
| Community & Social Service | 132 (32.8%) | 270 (67.2%) |
| Education, Arts & Media | 0 (0.0%) | 47 (100.0%) |
| Legal Services & Support | 0 (0.0%) | 32 (100.0%) |
| Education Instruction & Library | 56 (28.9%) | 138 (71.1%) |
| Arts, Media & Entertainment | 76 (58.9%) | 53 (41.1%) |
| Health Diagnosing & Treating | 59 (22.6%) | 202 (77.4%) |
| Health Technologists | 52 (51.0%) | 50 (49.0%) |
| Total (Category) | 819 (41.2%) | 1,171 (58.8%) |
| Total (Overall) | 3,714 (56.9%) | 2,809 (43.1%) |
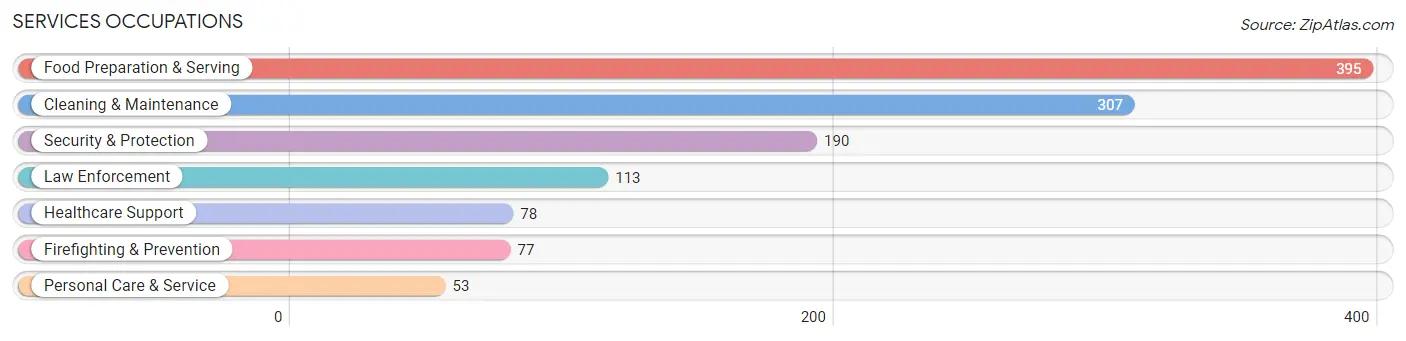
Services Occupations
The most common Services occupations in Yulee are Food Preparation & Serving (395 | 6.1%), Cleaning & Maintenance (307 | 4.7%), Security & Protection (190 | 2.9%), Law Enforcement (113 | 1.7%), and Healthcare Support (78 | 1.2%).
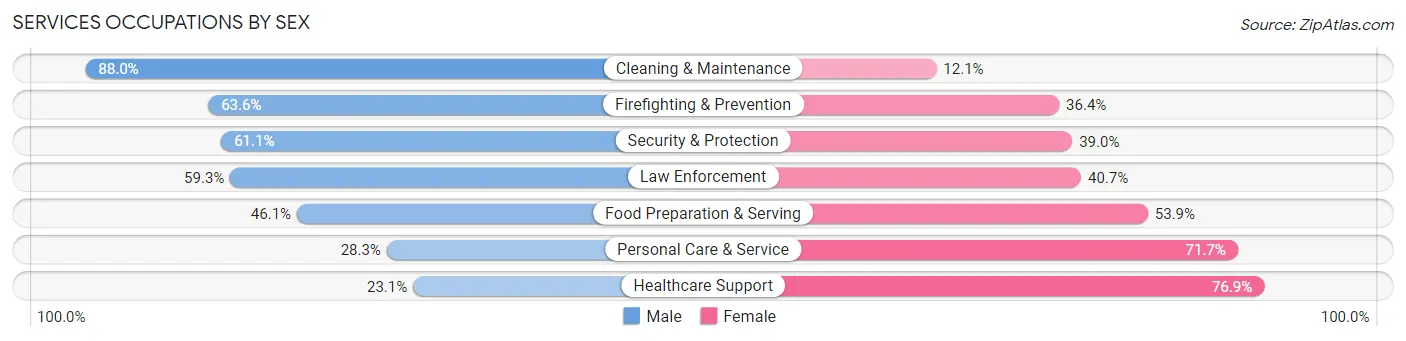
Services Occupations by Sex
Within the Services occupations in Yulee, the most male-oriented occupations are Cleaning & Maintenance (87.9%), Firefighting & Prevention (63.6%), and Security & Protection (61.1%), while the most female-oriented occupations are Healthcare Support (76.9%), Personal Care & Service (71.7%), and Food Preparation & Serving (53.9%).
| Occupation | Male | Female |
| Healthcare Support | 18 (23.1%) | 60 (76.9%) |
| Security & Protection | 116 (61.1%) | 74 (39.0%) |
| Firefighting & Prevention | 49 (63.6%) | 28 (36.4%) |
| Law Enforcement | 67 (59.3%) | 46 (40.7%) |
| Food Preparation & Serving | 182 (46.1%) | 213 (53.9%) |
| Cleaning & Maintenance | 270 (87.9%) | 37 (12.0%) |
| Personal Care & Service | 15 (28.3%) | 38 (71.7%) |
| Total (Category) | 601 (58.8%) | 422 (41.2%) |
| Total (Overall) | 3,714 (56.9%) | 2,809 (43.1%) |
Sales and Office Occupations
The most common Sales and Office occupations in Yulee are Office & Administration (1,061 | 16.3%), and Sales & Related (499 | 7.6%).

Sales and Office Occupations by Sex
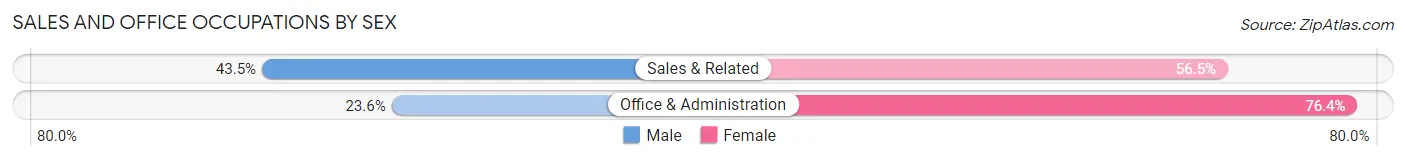
| Occupation | Male | Female |
| Sales & Related | 217 (43.5%) | 282 (56.5%) |
| Office & Administration | 250 (23.6%) | 811 (76.4%) |
| Total (Category) | 467 (29.9%) | 1,093 (70.1%) |
| Total (Overall) | 3,714 (56.9%) | 2,809 (43.1%) |
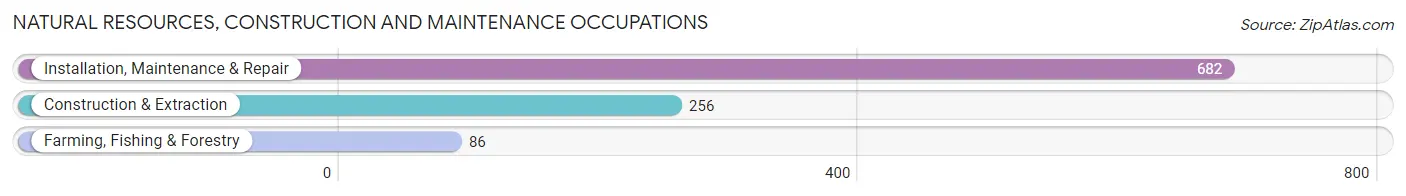
Natural Resources, Construction and Maintenance Occupations
The most common Natural Resources, Construction and Maintenance occupations in Yulee are Installation, Maintenance & Repair (682 | 10.5%), Construction & Extraction (256 | 3.9%), and Farming, Fishing & Forestry (86 | 1.3%).
Natural Resources, Construction and Maintenance Occupations by Sex
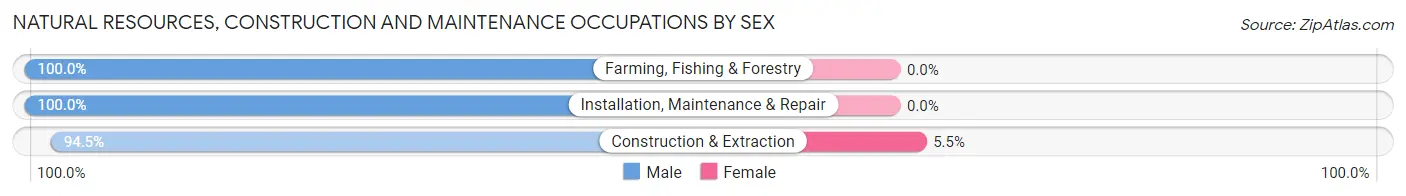
| Occupation | Male | Female |
| Farming, Fishing & Forestry | 86 (100.0%) | 0 (0.0%) |
| Construction & Extraction | 242 (94.5%) | 14 (5.5%) |
| Installation, Maintenance & Repair | 682 (100.0%) | 0 (0.0%) |
| Total (Category) | 1,010 (98.6%) | 14 (1.4%) |
| Total (Overall) | 3,714 (56.9%) | 2,809 (43.1%) |
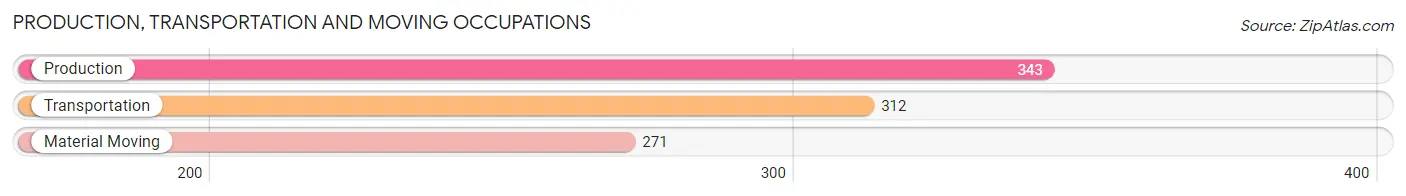
Production, Transportation and Moving Occupations
The most common Production, Transportation and Moving occupations in Yulee are Production (343 | 5.3%), Transportation (312 | 4.8%), and Material Moving (271 | 4.2%).
Production, Transportation and Moving Occupations by Sex
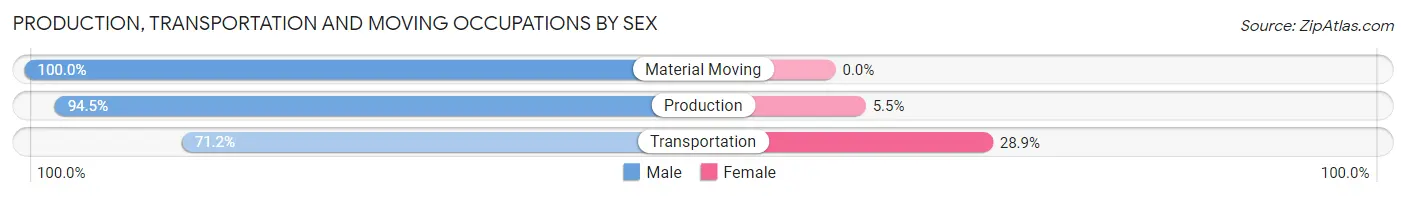
| Occupation | Male | Female |
| Production | 324 (94.5%) | 19 (5.5%) |
| Transportation | 222 (71.2%) | 90 (28.8%) |
| Material Moving | 271 (100.0%) | 0 (0.0%) |
| Total (Category) | 817 (88.2%) | 109 (11.8%) |
| Total (Overall) | 3,714 (56.9%) | 2,809 (43.1%) |
Employment Industries by Sex in Yulee
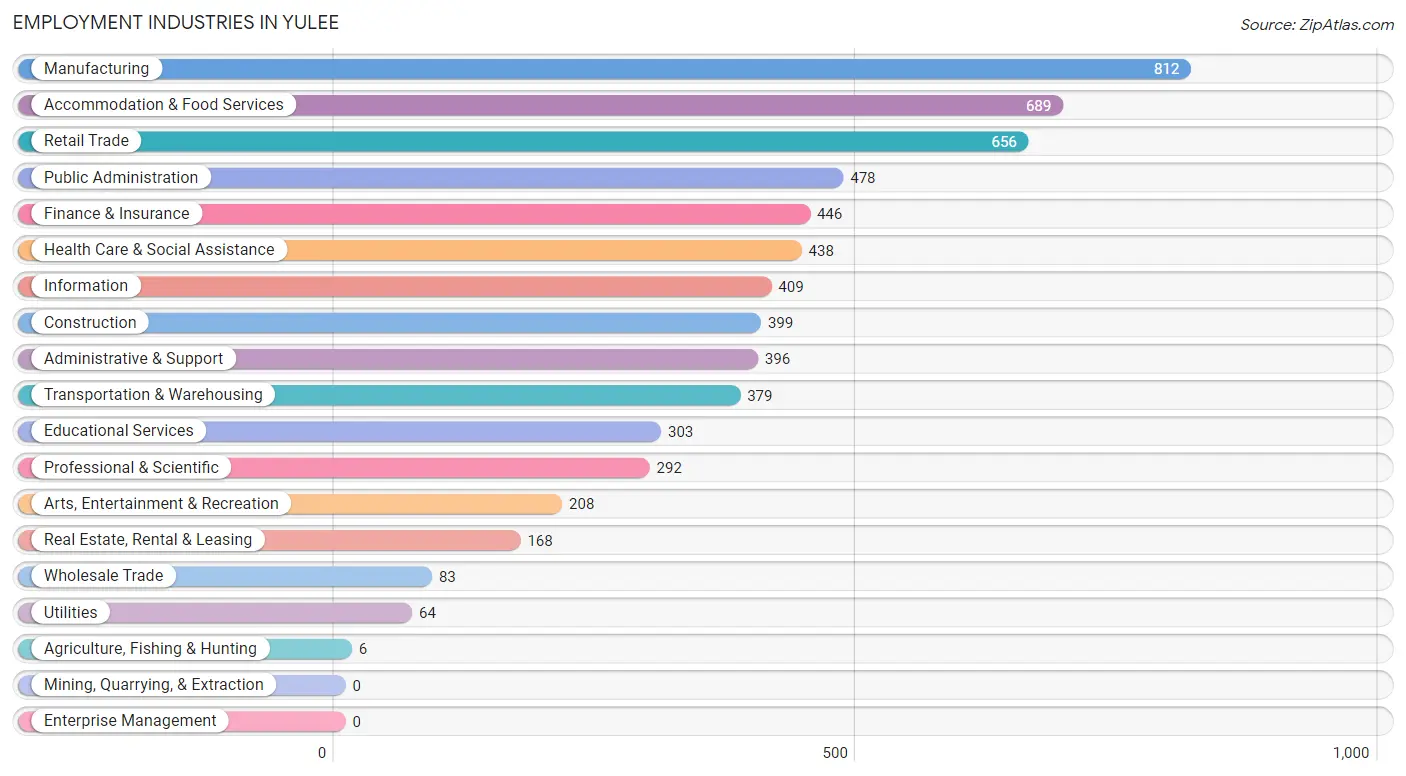
Employment Industries in Yulee
The major employment industries in Yulee include Manufacturing (812 | 12.4%), Accommodation & Food Services (689 | 10.6%), Retail Trade (656 | 10.1%), Public Administration (478 | 7.3%), and Finance & Insurance (446 | 6.8%).
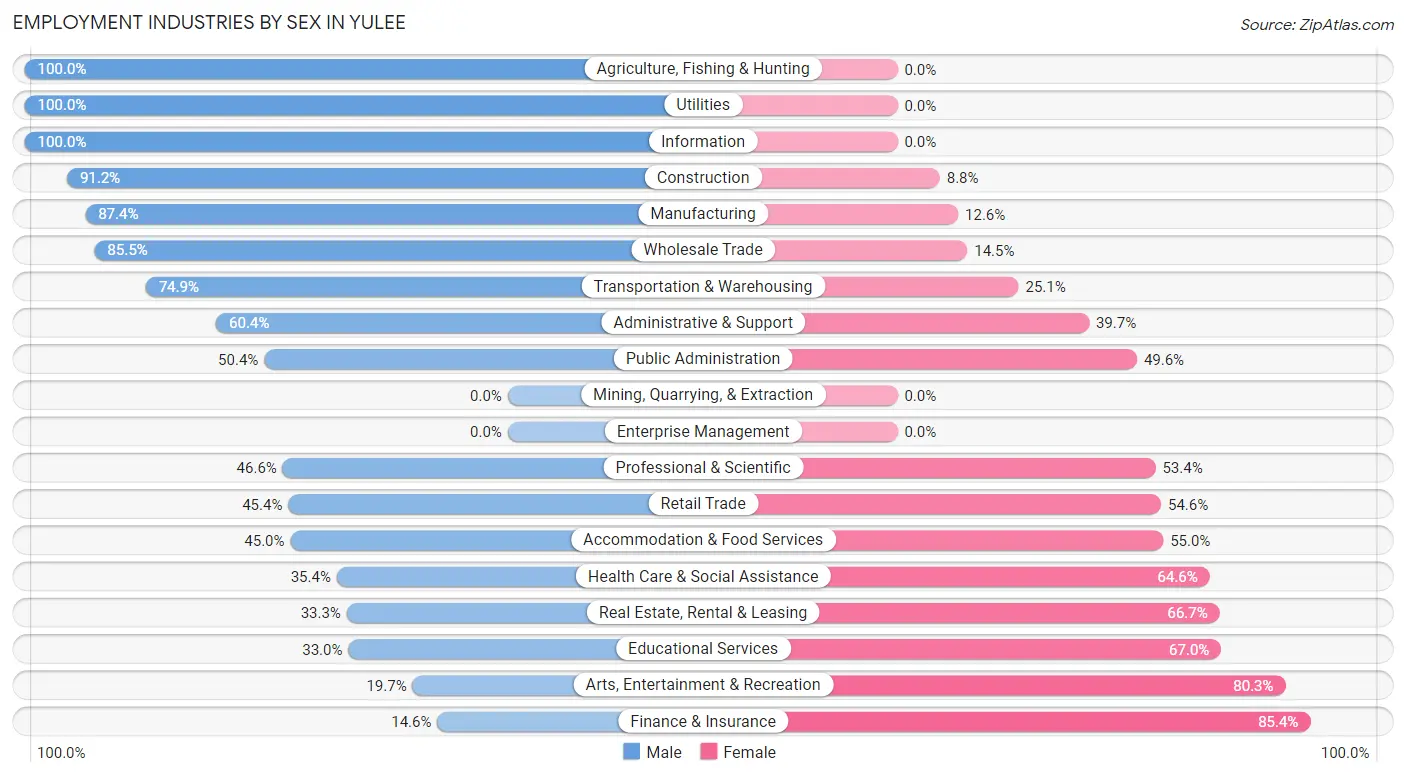
Employment Industries by Sex in Yulee
The Yulee industries that see more men than women are Agriculture, Fishing & Hunting (100.0%), Utilities (100.0%), and Information (100.0%), whereas the industries that tend to have a higher number of women are Finance & Insurance (85.4%), Arts, Entertainment & Recreation (80.3%), and Educational Services (67.0%).
| Industry | Male | Female |
| Agriculture, Fishing & Hunting | 6 (100.0%) | 0 (0.0%) |
| Mining, Quarrying, & Extraction | 0 (0.0%) | 0 (0.0%) |
| Construction | 364 (91.2%) | 35 (8.8%) |
| Manufacturing | 710 (87.4%) | 102 (12.6%) |
| Wholesale Trade | 71 (85.5%) | 12 (14.5%) |
| Retail Trade | 298 (45.4%) | 358 (54.6%) |
| Transportation & Warehousing | 284 (74.9%) | 95 (25.1%) |
| Utilities | 64 (100.0%) | 0 (0.0%) |
| Information | 409 (100.0%) | 0 (0.0%) |
| Finance & Insurance | 65 (14.6%) | 381 (85.4%) |
| Real Estate, Rental & Leasing | 56 (33.3%) | 112 (66.7%) |
| Professional & Scientific | 136 (46.6%) | 156 (53.4%) |
| Enterprise Management | 0 (0.0%) | 0 (0.0%) |
| Administrative & Support | 239 (60.4%) | 157 (39.7%) |
| Educational Services | 100 (33.0%) | 203 (67.0%) |
| Health Care & Social Assistance | 155 (35.4%) | 283 (64.6%) |
| Arts, Entertainment & Recreation | 41 (19.7%) | 167 (80.3%) |
| Accommodation & Food Services | 310 (45.0%) | 379 (55.0%) |
| Public Administration | 241 (50.4%) | 237 (49.6%) |
| Total | 3,714 (56.9%) | 2,809 (43.1%) |
Education in Yulee
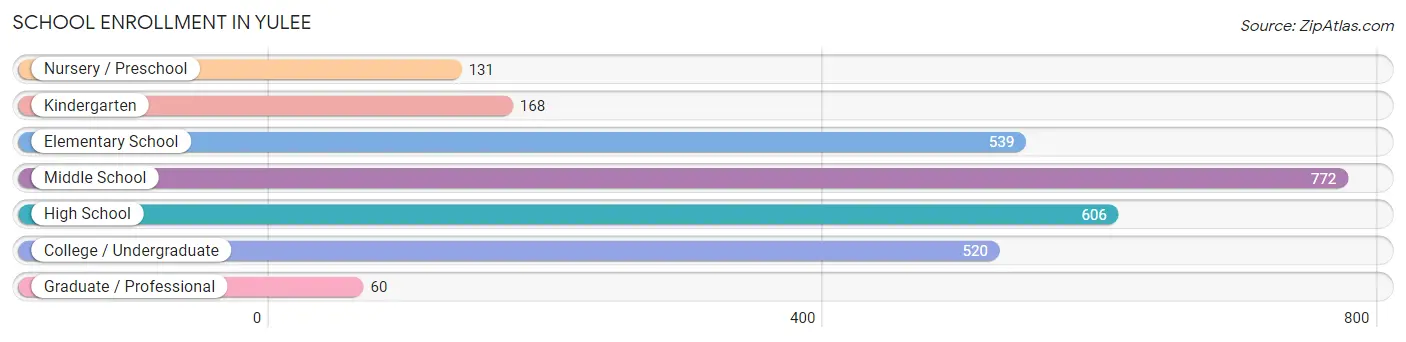
School Enrollment in Yulee
The most common levels of schooling among the 2,796 students in Yulee are middle school (772 | 27.6%), high school (606 | 21.7%), and elementary school (539 | 19.3%).
| School Level | # Students | % Students |
| Nursery / Preschool | 131 | 4.7% |
| Kindergarten | 168 | 6.0% |
| Elementary School | 539 | 19.3% |
| Middle School | 772 | 27.6% |
| High School | 606 | 21.7% |
| College / Undergraduate | 520 | 18.6% |
| Graduate / Professional | 60 | 2.1% |
| Total | 2,796 | 100.0% |
School Enrollment by Age by Funding Source in Yulee
Out of a total of 2,796 students who are enrolled in schools in Yulee, 554 (19.8%) attend a private institution, while the remaining 2,242 (80.2%) are enrolled in public schools. The age group of 25 to 34 year olds has the highest likelihood of being enrolled in private schools, with 65 (45.1% in the age bracket) enrolled. Conversely, the age group of 18 to 19 year olds has the lowest likelihood of being enrolled in a private school, with 185 (100.0% in the age bracket) attending a public institution.
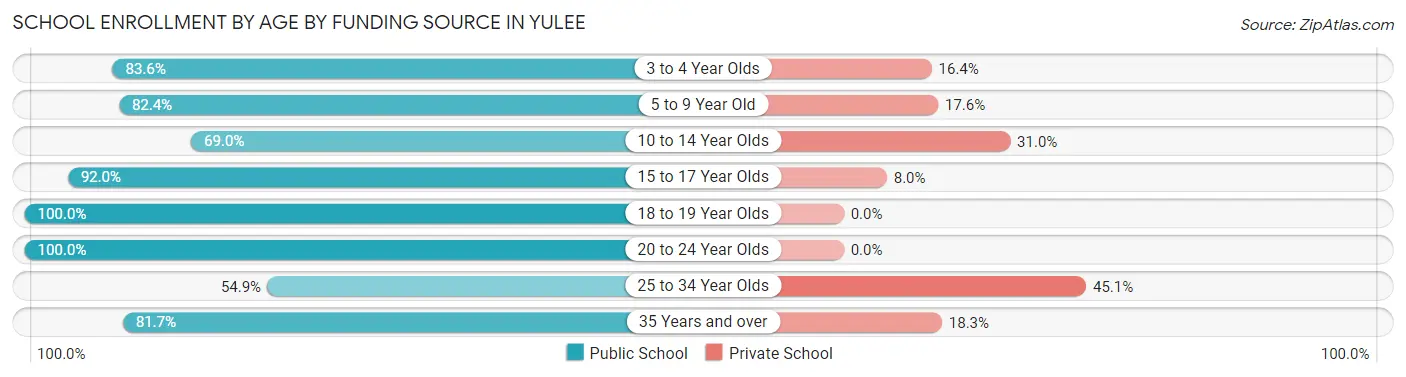
| Age Bracket | Public School | Private School |
| 3 to 4 Year Olds | 97 (83.6%) | 19 (16.4%) |
| 5 to 9 Year Old | 511 (82.4%) | 109 (17.6%) |
| 10 to 14 Year Olds | 654 (69.0%) | 294 (31.0%) |
| 15 to 17 Year Olds | 424 (92.0%) | 37 (8.0%) |
| 18 to 19 Year Olds | 185 (100.0%) | 0 (0.0%) |
| 20 to 24 Year Olds | 158 (100.0%) | 0 (0.0%) |
| 25 to 34 Year Olds | 79 (54.9%) | 65 (45.1%) |
| 35 Years and over | 134 (81.7%) | 30 (18.3%) |
| Total | 2,242 (80.2%) | 554 (19.8%) |
Educational Attainment by Field of Study in Yulee
Business (539 | 26.9%), education (376 | 18.8%), psychology (185 | 9.2%), arts & humanities (163 | 8.1%), and social sciences (154 | 7.7%) are the most common fields of study among 2,002 individuals in Yulee who have obtained a bachelor's degree or higher.
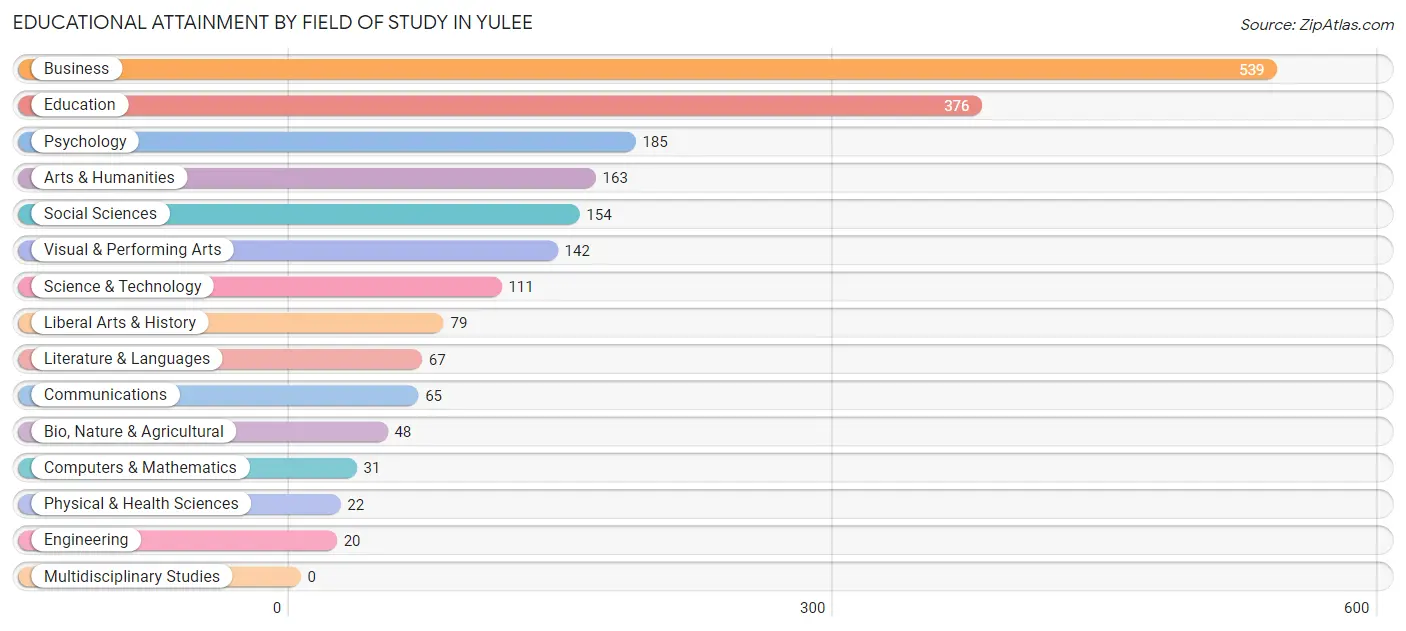
| Field of Study | # Graduates | % Graduates |
| Computers & Mathematics | 31 | 1.5% |
| Bio, Nature & Agricultural | 48 | 2.4% |
| Physical & Health Sciences | 22 | 1.1% |
| Psychology | 185 | 9.2% |
| Social Sciences | 154 | 7.7% |
| Engineering | 20 | 1.0% |
| Multidisciplinary Studies | 0 | 0.0% |
| Science & Technology | 111 | 5.5% |
| Business | 539 | 26.9% |
| Education | 376 | 18.8% |
| Literature & Languages | 67 | 3.4% |
| Liberal Arts & History | 79 | 4.0% |
| Visual & Performing Arts | 142 | 7.1% |
| Communications | 65 | 3.3% |
| Arts & Humanities | 163 | 8.1% |
| Total | 2,002 | 100.0% |
Transportation & Commute in Yulee
Vehicle Availability by Sex in Yulee
The most prevalent vehicle ownership categories in Yulee are males with 2 vehicles (1,728, accounting for 46.4%) and females with 2 vehicles (1,168, making up 62.9%).
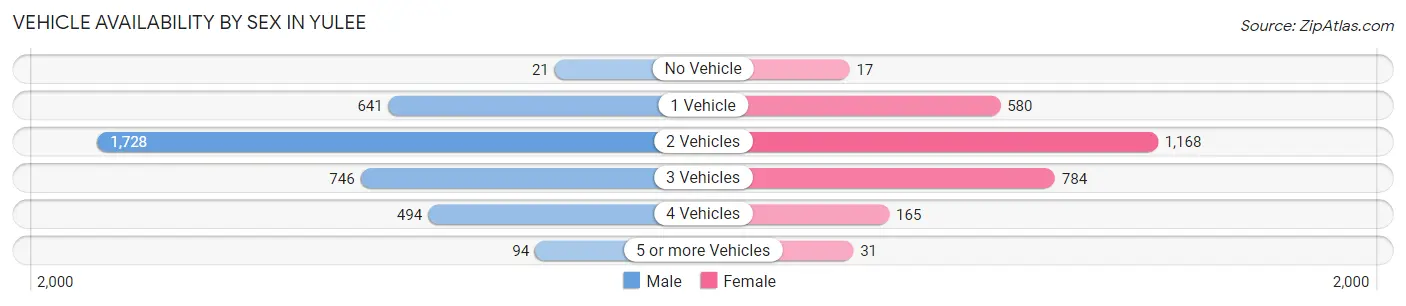
| Vehicles Available | Male | Female |
| No Vehicle | 21 (0.6%) | 17 (0.6%) |
| 1 Vehicle | 641 (17.2%) | 580 (21.1%) |
| 2 Vehicles | 1,728 (46.4%) | 1,168 (42.5%) |
| 3 Vehicles | 746 (20.0%) | 784 (28.6%) |
| 4 Vehicles | 494 (13.3%) | 165 (6.0%) |
| 5 or more Vehicles | 94 (2.5%) | 31 (1.1%) |
| Total | 3,724 (100.0%) | 2,745 (100.0%) |
Commute Time in Yulee
The most frequently occuring commute durations in Yulee are 30 to 34 minutes (1,129 commuters, 19.2%), 45 to 59 minutes (1,042 commuters, 17.7%), and 15 to 19 minutes (688 commuters, 11.7%).
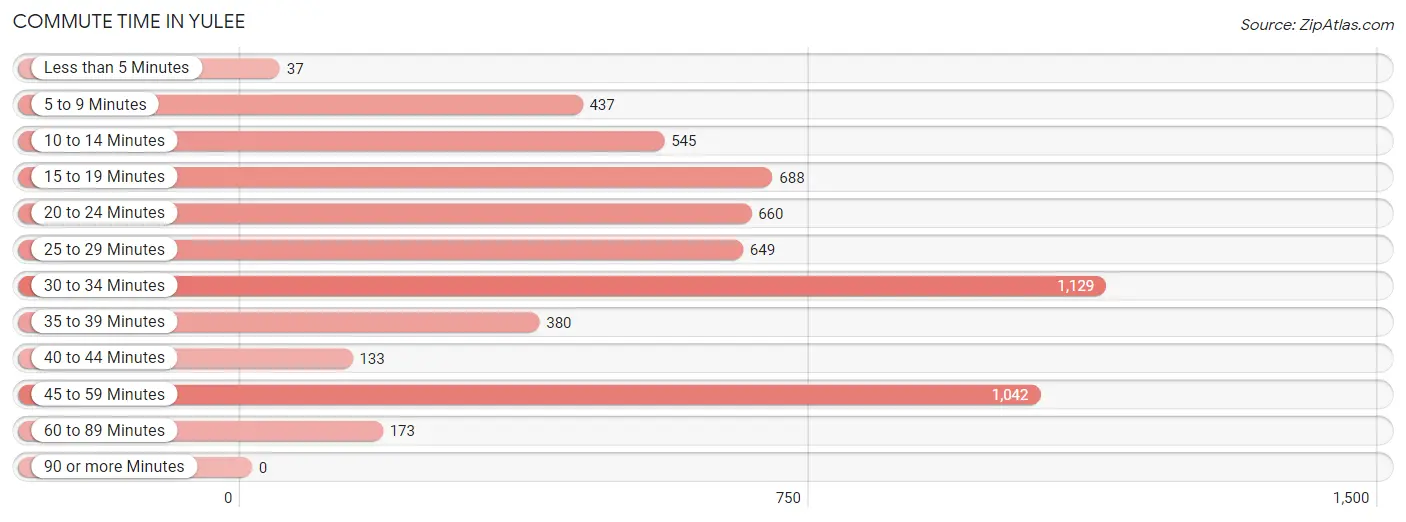
| Commute Time | # Commuters | % Commuters |
| Less than 5 Minutes | 37 | 0.6% |
| 5 to 9 Minutes | 437 | 7.4% |
| 10 to 14 Minutes | 545 | 9.3% |
| 15 to 19 Minutes | 688 | 11.7% |
| 20 to 24 Minutes | 660 | 11.2% |
| 25 to 29 Minutes | 649 | 11.1% |
| 30 to 34 Minutes | 1,129 | 19.2% |
| 35 to 39 Minutes | 380 | 6.5% |
| 40 to 44 Minutes | 133 | 2.3% |
| 45 to 59 Minutes | 1,042 | 17.7% |
| 60 to 89 Minutes | 173 | 2.9% |
| 90 or more Minutes | 0 | 0.0% |
Commute Time by Sex in Yulee
The most common commute times in Yulee are 45 to 59 minutes (860 commuters, 24.2%) for males and 15 to 19 minutes (456 commuters, 19.6%) for females.
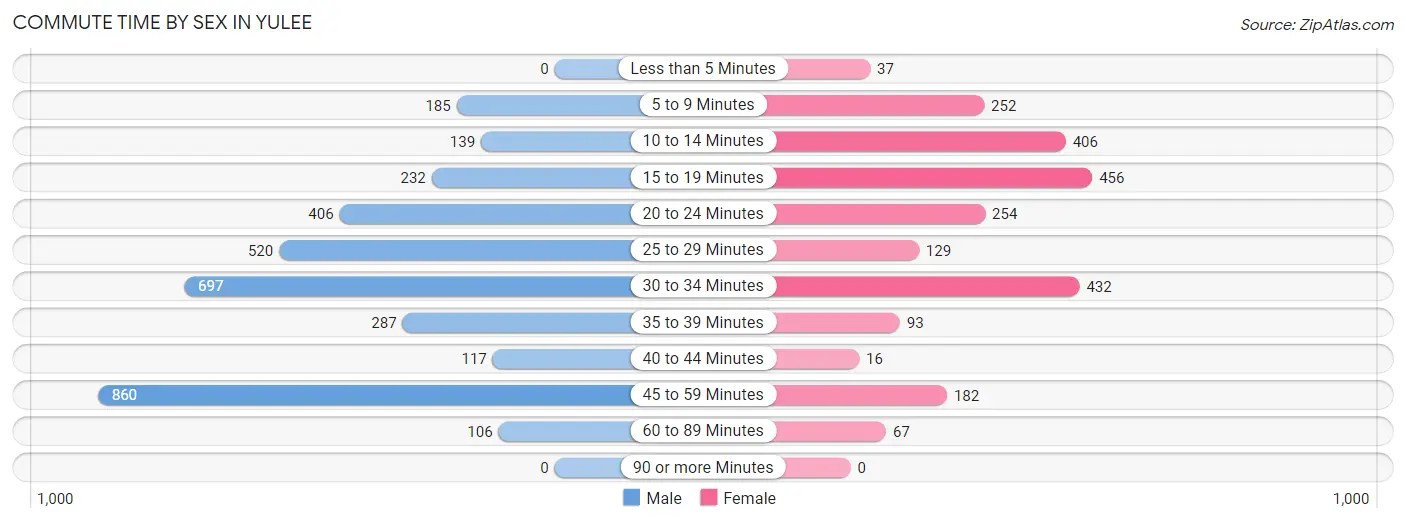
| Commute Time | Male | Female |
| Less than 5 Minutes | 0 (0.0%) | 37 (1.6%) |
| 5 to 9 Minutes | 185 (5.2%) | 252 (10.8%) |
| 10 to 14 Minutes | 139 (3.9%) | 406 (17.5%) |
| 15 to 19 Minutes | 232 (6.5%) | 456 (19.6%) |
| 20 to 24 Minutes | 406 (11.4%) | 254 (10.9%) |
| 25 to 29 Minutes | 520 (14.6%) | 129 (5.6%) |
| 30 to 34 Minutes | 697 (19.6%) | 432 (18.6%) |
| 35 to 39 Minutes | 287 (8.1%) | 93 (4.0%) |
| 40 to 44 Minutes | 117 (3.3%) | 16 (0.7%) |
| 45 to 59 Minutes | 860 (24.2%) | 182 (7.8%) |
| 60 to 89 Minutes | 106 (3.0%) | 67 (2.9%) |
| 90 or more Minutes | 0 (0.0%) | 0 (0.0%) |
Time of Departure to Work by Sex in Yulee
The most frequent times of departure to work in Yulee are 12:00 AM to 4:59 AM (603, 17.0%) for males and 8:00 AM to 8:29 AM (481, 20.7%) for females.
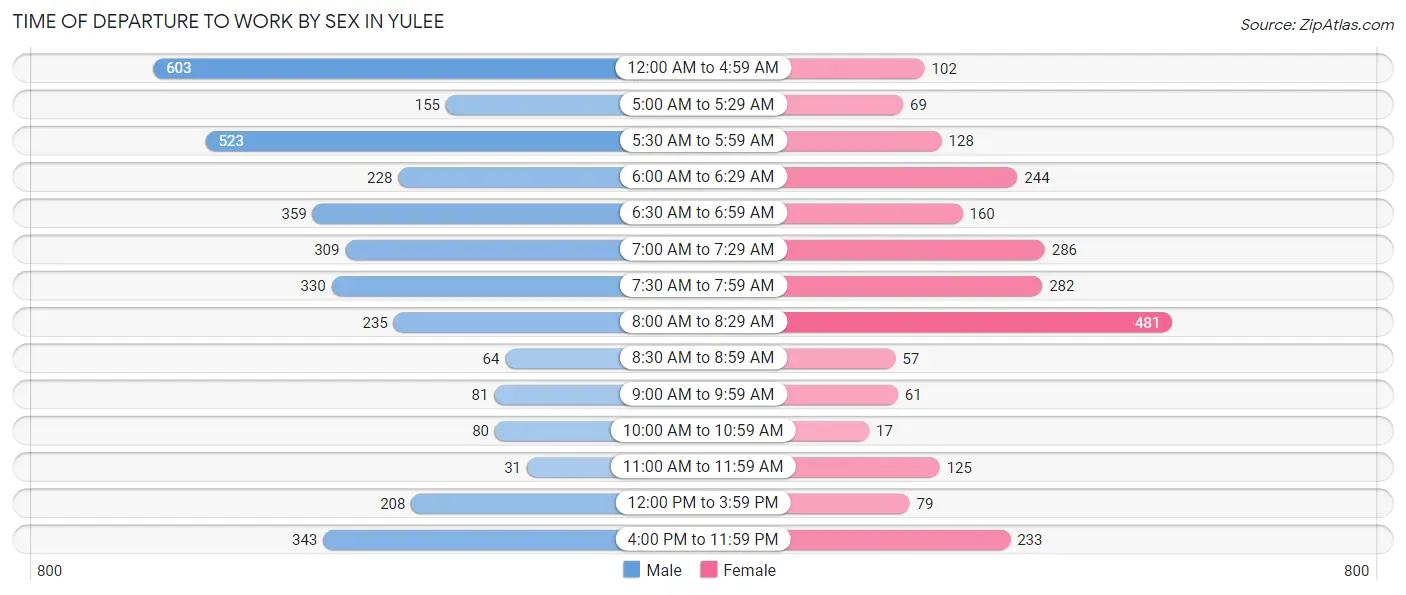
| Time of Departure | Male | Female |
| 12:00 AM to 4:59 AM | 603 (17.0%) | 102 (4.4%) |
| 5:00 AM to 5:29 AM | 155 (4.4%) | 69 (3.0%) |
| 5:30 AM to 5:59 AM | 523 (14.7%) | 128 (5.5%) |
| 6:00 AM to 6:29 AM | 228 (6.4%) | 244 (10.5%) |
| 6:30 AM to 6:59 AM | 359 (10.1%) | 160 (6.9%) |
| 7:00 AM to 7:29 AM | 309 (8.7%) | 286 (12.3%) |
| 7:30 AM to 7:59 AM | 330 (9.3%) | 282 (12.1%) |
| 8:00 AM to 8:29 AM | 235 (6.6%) | 481 (20.7%) |
| 8:30 AM to 8:59 AM | 64 (1.8%) | 57 (2.5%) |
| 9:00 AM to 9:59 AM | 81 (2.3%) | 61 (2.6%) |
| 10:00 AM to 10:59 AM | 80 (2.2%) | 17 (0.7%) |
| 11:00 AM to 11:59 AM | 31 (0.9%) | 125 (5.4%) |
| 12:00 PM to 3:59 PM | 208 (5.9%) | 79 (3.4%) |
| 4:00 PM to 11:59 PM | 343 (9.7%) | 233 (10.0%) |
| Total | 3,549 (100.0%) | 2,324 (100.0%) |
Housing Occupancy in Yulee
Occupancy by Ownership in Yulee
Of the total 5,337 dwellings in Yulee, owner-occupied units account for 4,279 (80.2%), while renter-occupied units make up 1,058 (19.8%).
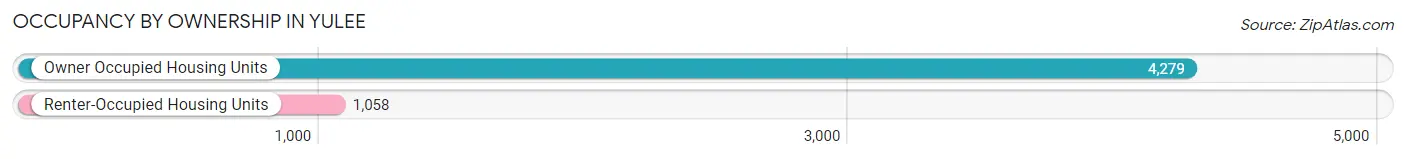
| Occupancy | # Housing Units | % Housing Units |
| Owner Occupied Housing Units | 4,279 | 80.2% |
| Renter-Occupied Housing Units | 1,058 | 19.8% |
| Total Occupied Housing Units | 5,337 | 100.0% |
Occupancy by Household Size in Yulee
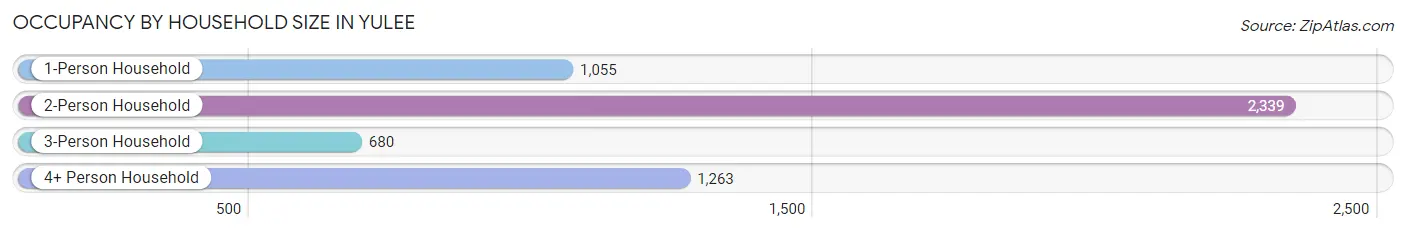
| Household Size | # Housing Units | % Housing Units |
| 1-Person Household | 1,055 | 19.8% |
| 2-Person Household | 2,339 | 43.8% |
| 3-Person Household | 680 | 12.7% |
| 4+ Person Household | 1,263 | 23.7% |
| Total Housing Units | 5,337 | 100.0% |
Occupancy by Ownership by Household Size in Yulee
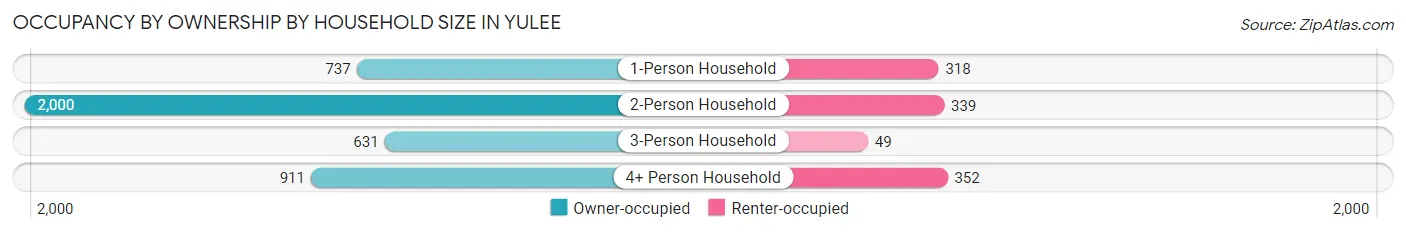
| Household Size | Owner-occupied | Renter-occupied |
| 1-Person Household | 737 (69.9%) | 318 (30.1%) |
| 2-Person Household | 2,000 (85.5%) | 339 (14.5%) |
| 3-Person Household | 631 (92.8%) | 49 (7.2%) |
| 4+ Person Household | 911 (72.1%) | 352 (27.9%) |
| Total Housing Units | 4,279 (80.2%) | 1,058 (19.8%) |
Occupancy by Educational Attainment in Yulee
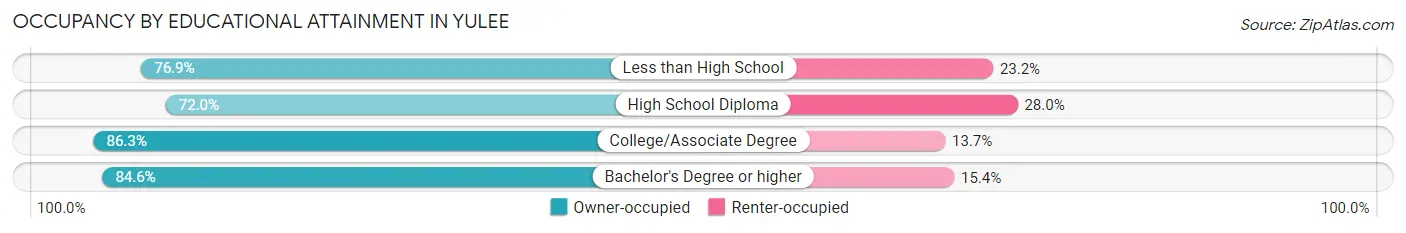
| Household Size | Owner-occupied | Renter-occupied |
| Less than High School | 395 (76.8%) | 119 (23.2%) |
| High School Diploma | 1,297 (72.0%) | 505 (28.0%) |
| College/Associate Degree | 1,585 (86.3%) | 251 (13.7%) |
| Bachelor's Degree or higher | 1,002 (84.6%) | 183 (15.4%) |
Occupancy by Age of Householder in Yulee
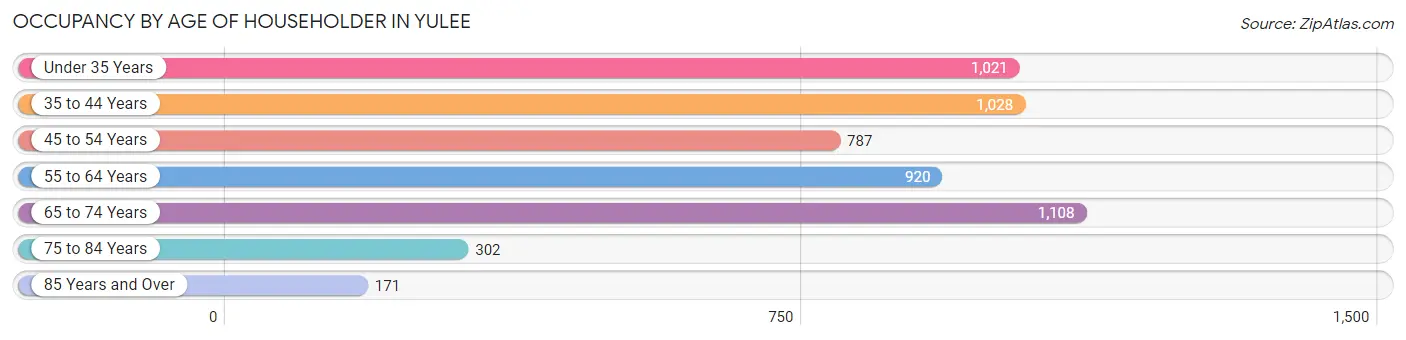
| Age Bracket | # Households | % Households |
| Under 35 Years | 1,021 | 19.1% |
| 35 to 44 Years | 1,028 | 19.3% |
| 45 to 54 Years | 787 | 14.7% |
| 55 to 64 Years | 920 | 17.2% |
| 65 to 74 Years | 1,108 | 20.8% |
| 75 to 84 Years | 302 | 5.7% |
| 85 Years and Over | 171 | 3.2% |
| Total | 5,337 | 100.0% |
Housing Finances in Yulee
Median Income by Occupancy in Yulee
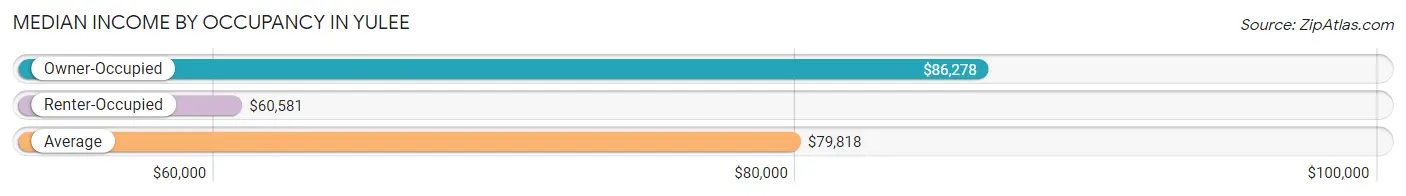
| Occupancy Type | # Households | Median Income |
| Owner-Occupied | 4,279 (80.2%) | $86,278 |
| Renter-Occupied | 1,058 (19.8%) | $60,581 |
| Average | 5,337 (100.0%) | $79,818 |
Occupancy by Householder Income Bracket in Yulee
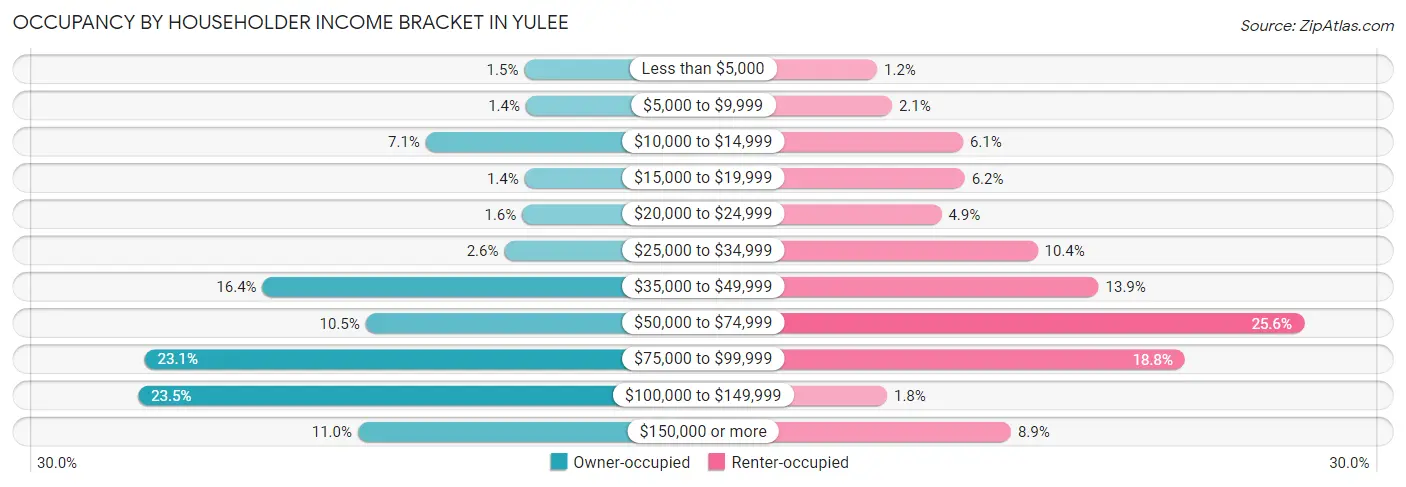
| Income Bracket | Owner-occupied | Renter-occupied |
| Less than $5,000 | 62 (1.5%) | 13 (1.2%) |
| $5,000 to $9,999 | 58 (1.4%) | 22 (2.1%) |
| $10,000 to $14,999 | 303 (7.1%) | 65 (6.1%) |
| $15,000 to $19,999 | 61 (1.4%) | 66 (6.2%) |
| $20,000 to $24,999 | 67 (1.6%) | 52 (4.9%) |
| $25,000 to $34,999 | 111 (2.6%) | 110 (10.4%) |
| $35,000 to $49,999 | 702 (16.4%) | 147 (13.9%) |
| $50,000 to $74,999 | 450 (10.5%) | 271 (25.6%) |
| $75,000 to $99,999 | 990 (23.1%) | 199 (18.8%) |
| $100,000 to $149,999 | 1,006 (23.5%) | 19 (1.8%) |
| $150,000 or more | 469 (11.0%) | 94 (8.9%) |
| Total | 4,279 (100.0%) | 1,058 (100.0%) |
Monthly Housing Cost Tiers in Yulee
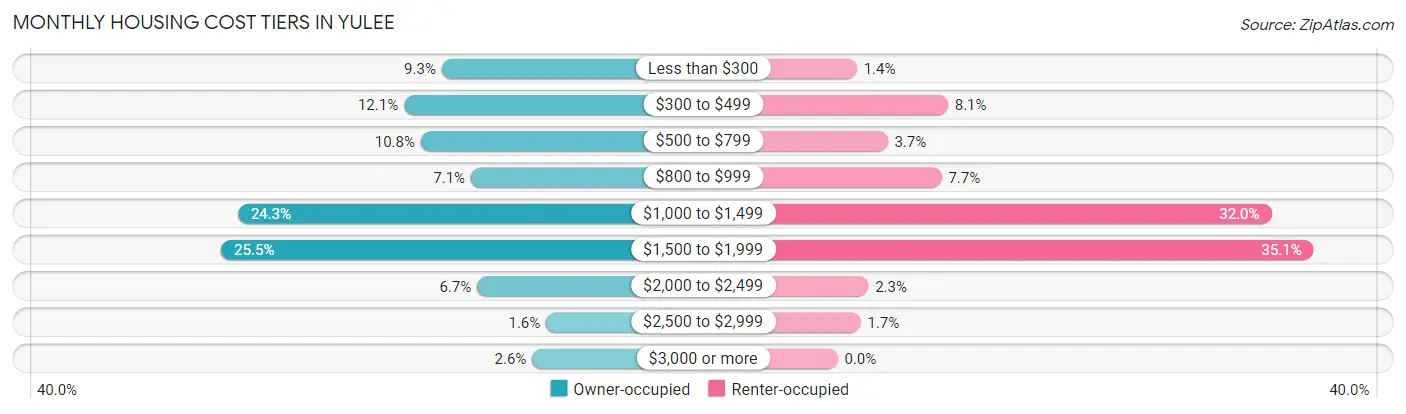
| Monthly Cost | Owner-occupied | Renter-occupied |
| Less than $300 | 397 (9.3%) | 15 (1.4%) |
| $300 to $499 | 516 (12.1%) | 86 (8.1%) |
| $500 to $799 | 463 (10.8%) | 39 (3.7%) |
| $800 to $999 | 305 (7.1%) | 81 (7.7%) |
| $1,000 to $1,499 | 1,040 (24.3%) | 338 (32.0%) |
| $1,500 to $1,999 | 1,092 (25.5%) | 371 (35.1%) |
| $2,000 to $2,499 | 286 (6.7%) | 24 (2.3%) |
| $2,500 to $2,999 | 68 (1.6%) | 18 (1.7%) |
| $3,000 or more | 112 (2.6%) | 0 (0.0%) |
| Total | 4,279 (100.0%) | 1,058 (100.0%) |
Physical Housing Characteristics in Yulee
Housing Structures in Yulee
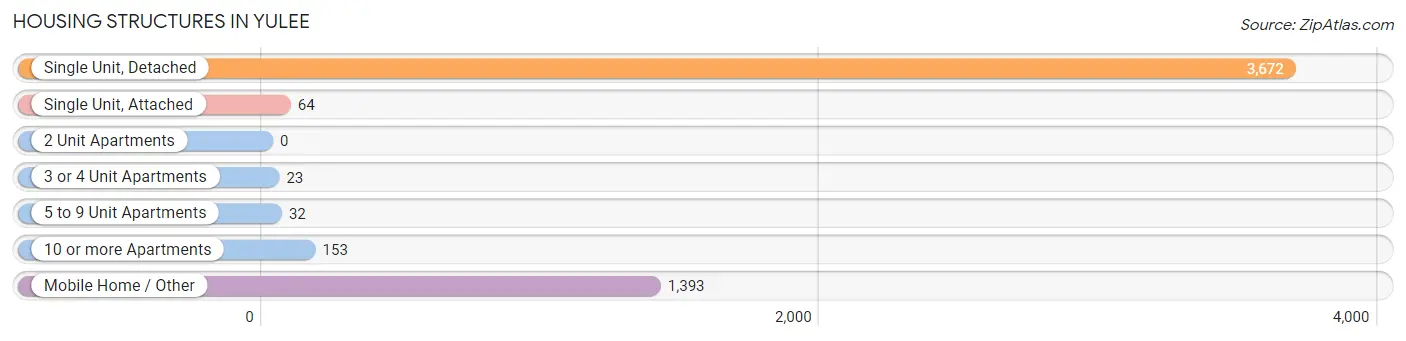
| Structure Type | # Housing Units | % Housing Units |
| Single Unit, Detached | 3,672 | 68.8% |
| Single Unit, Attached | 64 | 1.2% |
| 2 Unit Apartments | 0 | 0.0% |
| 3 or 4 Unit Apartments | 23 | 0.4% |
| 5 to 9 Unit Apartments | 32 | 0.6% |
| 10 or more Apartments | 153 | 2.9% |
| Mobile Home / Other | 1,393 | 26.1% |
| Total | 5,337 | 100.0% |
Housing Structures by Occupancy in Yulee
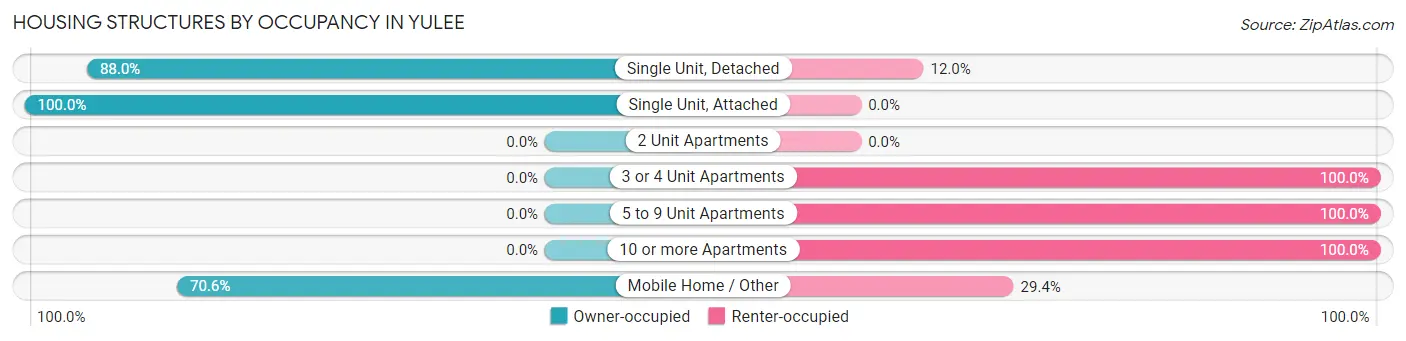
| Structure Type | Owner-occupied | Renter-occupied |
| Single Unit, Detached | 3,231 (88.0%) | 441 (12.0%) |
| Single Unit, Attached | 64 (100.0%) | 0 (0.0%) |
| 2 Unit Apartments | 0 (0.0%) | 0 (0.0%) |
| 3 or 4 Unit Apartments | 0 (0.0%) | 23 (100.0%) |
| 5 to 9 Unit Apartments | 0 (0.0%) | 32 (100.0%) |
| 10 or more Apartments | 0 (0.0%) | 153 (100.0%) |
| Mobile Home / Other | 984 (70.6%) | 409 (29.4%) |
| Total | 4,279 (80.2%) | 1,058 (19.8%) |
Housing Structures by Number of Rooms in Yulee
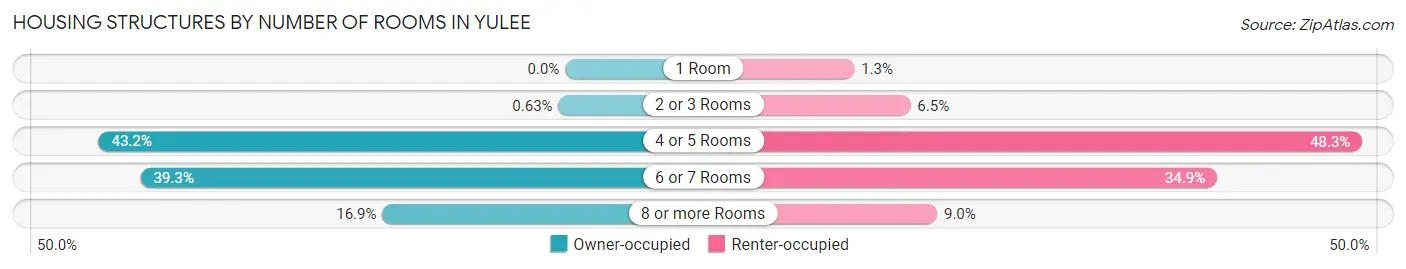
| Number of Rooms | Owner-occupied | Renter-occupied |
| 1 Room | 0 (0.0%) | 14 (1.3%) |
| 2 or 3 Rooms | 27 (0.6%) | 69 (6.5%) |
| 4 or 5 Rooms | 1,847 (43.2%) | 511 (48.3%) |
| 6 or 7 Rooms | 1,681 (39.3%) | 369 (34.9%) |
| 8 or more Rooms | 724 (16.9%) | 95 (9.0%) |
| Total | 4,279 (100.0%) | 1,058 (100.0%) |
Housing Structure by Heating Type in Yulee
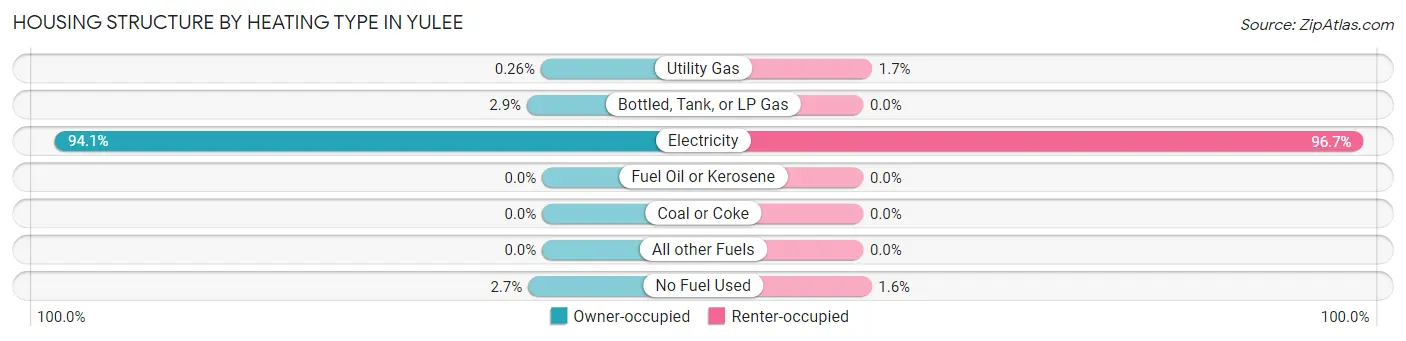
| Heating Type | Owner-occupied | Renter-occupied |
| Utility Gas | 11 (0.3%) | 18 (1.7%) |
| Bottled, Tank, or LP Gas | 126 (2.9%) | 0 (0.0%) |
| Electricity | 4,026 (94.1%) | 1,023 (96.7%) |
| Fuel Oil or Kerosene | 0 (0.0%) | 0 (0.0%) |
| Coal or Coke | 0 (0.0%) | 0 (0.0%) |
| All other Fuels | 0 (0.0%) | 0 (0.0%) |
| No Fuel Used | 116 (2.7%) | 17 (1.6%) |
| Total | 4,279 (100.0%) | 1,058 (100.0%) |
Household Vehicle Usage in Yulee
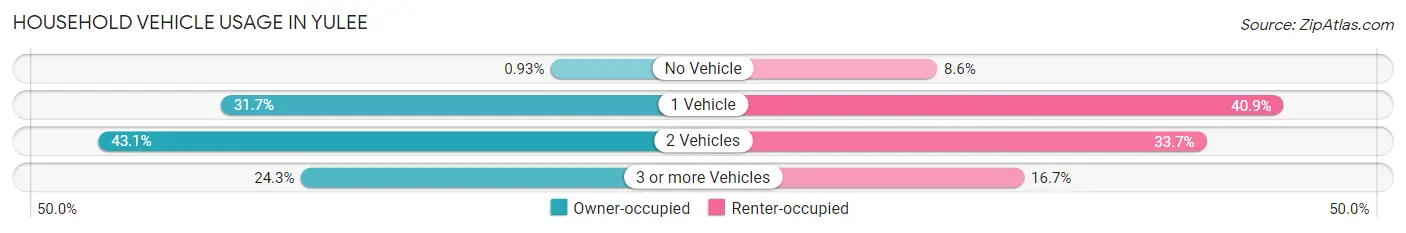
| Vehicles per Household | Owner-occupied | Renter-occupied |
| No Vehicle | 40 (0.9%) | 91 (8.6%) |
| 1 Vehicle | 1,356 (31.7%) | 433 (40.9%) |
| 2 Vehicles | 1,845 (43.1%) | 357 (33.7%) |
| 3 or more Vehicles | 1,038 (24.3%) | 177 (16.7%) |
| Total | 4,279 (100.0%) | 1,058 (100.0%) |
Real Estate & Mortgages in Yulee
Real Estate and Mortgage Overview in Yulee
| Characteristic | Without Mortgage | With Mortgage |
| Housing Units | 1,218 | 3,061 |
| Median Property Value | $217,300 | $262,200 |
| Median Household Income | $68,214 | $293 |
| Monthly Housing Costs | $375 | $72 |
| Real Estate Taxes | $954 | $148 |
Property Value by Mortgage Status in Yulee
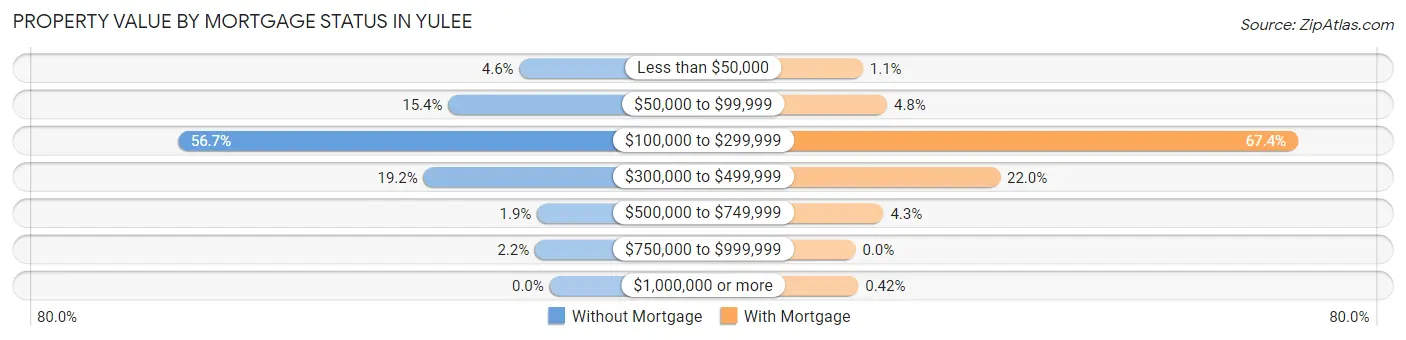
| Property Value | Without Mortgage | With Mortgage |
| Less than $50,000 | 56 (4.6%) | 34 (1.1%) |
| $50,000 to $99,999 | 188 (15.4%) | 147 (4.8%) |
| $100,000 to $299,999 | 690 (56.7%) | 2,063 (67.4%) |
| $300,000 to $499,999 | 234 (19.2%) | 674 (22.0%) |
| $500,000 to $749,999 | 23 (1.9%) | 130 (4.3%) |
| $750,000 to $999,999 | 27 (2.2%) | 0 (0.0%) |
| $1,000,000 or more | 0 (0.0%) | 13 (0.4%) |
| Total | 1,218 (100.0%) | 3,061 (100.0%) |
Household Income by Mortgage Status in Yulee
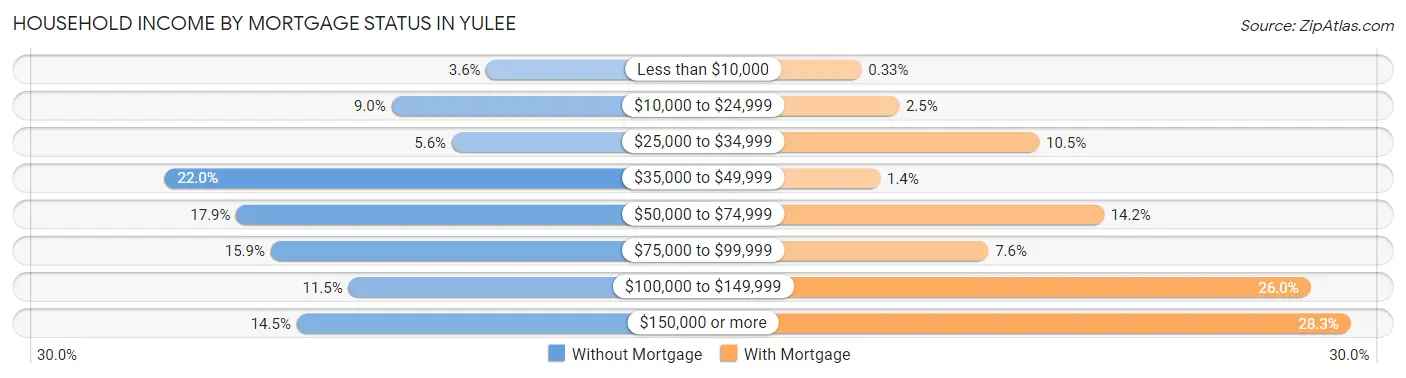
| Household Income | Without Mortgage | With Mortgage |
| Less than $10,000 | 44 (3.6%) | 10 (0.3%) |
| $10,000 to $24,999 | 110 (9.0%) | 76 (2.5%) |
| $25,000 to $34,999 | 68 (5.6%) | 321 (10.5%) |
| $35,000 to $49,999 | 268 (22.0%) | 43 (1.4%) |
| $50,000 to $74,999 | 218 (17.9%) | 434 (14.2%) |
| $75,000 to $99,999 | 194 (15.9%) | 232 (7.6%) |
| $100,000 to $149,999 | 140 (11.5%) | 796 (26.0%) |
| $150,000 or more | 176 (14.4%) | 866 (28.3%) |
| Total | 1,218 (100.0%) | 3,061 (100.0%) |
Property Value to Household Income Ratio in Yulee
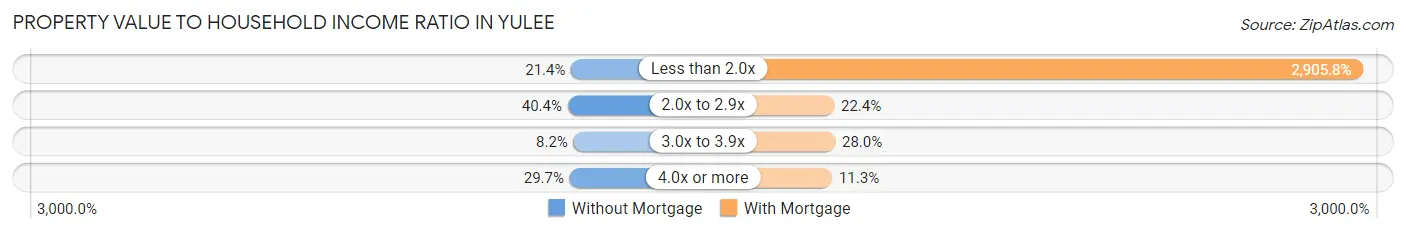
| Value-to-Income Ratio | Without Mortgage | With Mortgage |
| Less than 2.0x | 260 (21.3%) | 88,946 (2,905.8%) |
| 2.0x to 2.9x | 492 (40.4%) | 686 (22.4%) |
| 3.0x to 3.9x | 100 (8.2%) | 857 (28.0%) |
| 4.0x or more | 362 (29.7%) | 347 (11.3%) |
| Total | 1,218 (100.0%) | 3,061 (100.0%) |
Real Estate Taxes by Mortgage Status in Yulee
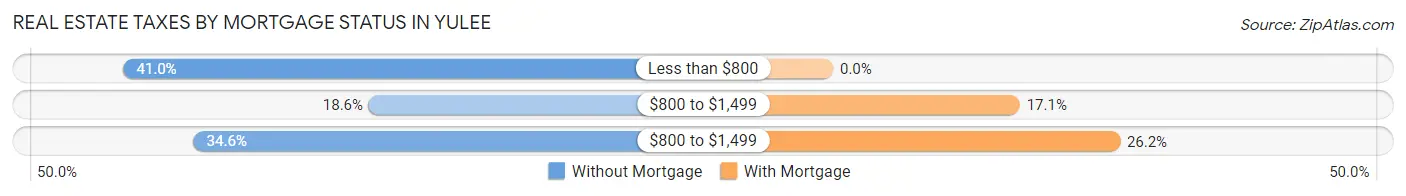
| Property Taxes | Without Mortgage | With Mortgage |
| Less than $800 | 499 (41.0%) | 0 (0.0%) |
| $800 to $1,499 | 226 (18.6%) | 522 (17.1%) |
| $800 to $1,499 | 421 (34.6%) | 802 (26.2%) |
| Total | 1,218 (100.0%) | 3,061 (100.0%) |
Health & Disability in Yulee
Health Insurance Coverage by Age in Yulee
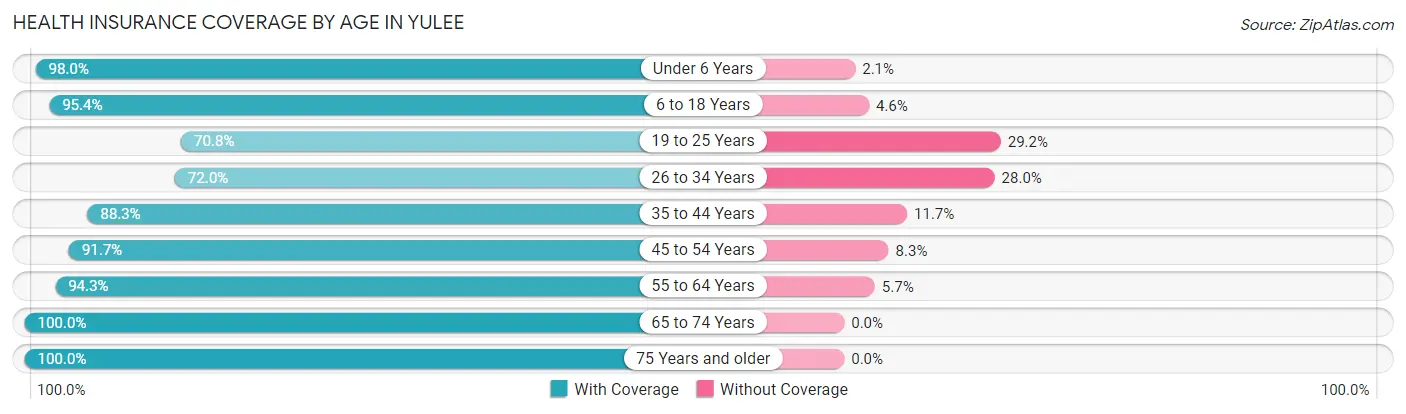
| Age Bracket | With Coverage | Without Coverage |
| Under 6 Years | 1,100 (98.0%) | 23 (2.1%) |
| 6 to 18 Years | 2,011 (95.4%) | 97 (4.6%) |
| 19 to 25 Years | 682 (70.8%) | 281 (29.2%) |
| 26 to 34 Years | 1,391 (72.0%) | 542 (28.0%) |
| 35 to 44 Years | 1,629 (88.3%) | 216 (11.7%) |
| 45 to 54 Years | 1,441 (91.7%) | 130 (8.3%) |
| 55 to 64 Years | 1,634 (94.3%) | 99 (5.7%) |
| 65 to 74 Years | 1,544 (100.0%) | 0 (0.0%) |
| 75 Years and older | 835 (100.0%) | 0 (0.0%) |
| Total | 12,267 (89.8%) | 1,388 (10.2%) |
Health Insurance Coverage by Citizenship Status in Yulee
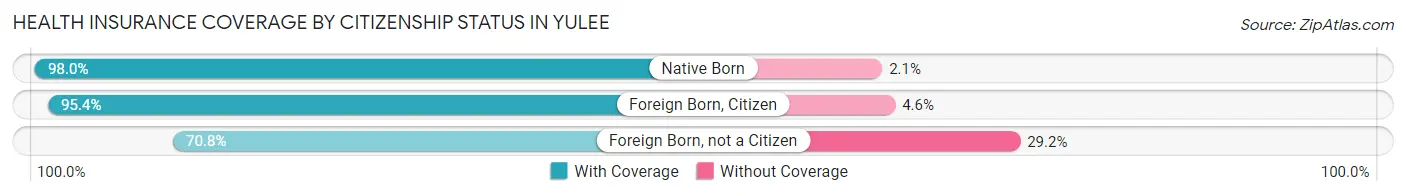
| Citizenship Status | With Coverage | Without Coverage |
| Native Born | 1,100 (98.0%) | 23 (2.1%) |
| Foreign Born, Citizen | 2,011 (95.4%) | 97 (4.6%) |
| Foreign Born, not a Citizen | 682 (70.8%) | 281 (29.2%) |
Health Insurance Coverage by Household Income in Yulee
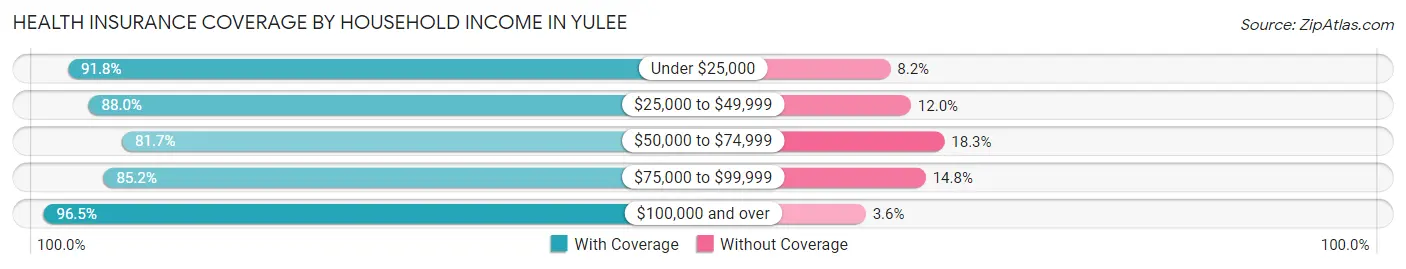
| Household Income | With Coverage | Without Coverage |
| Under $25,000 | 1,418 (91.8%) | 126 (8.2%) |
| $25,000 to $49,999 | 1,722 (88.0%) | 235 (12.0%) |
| $50,000 to $74,999 | 1,587 (81.7%) | 355 (18.3%) |
| $75,000 to $99,999 | 2,829 (85.2%) | 491 (14.8%) |
| $100,000 and over | 4,698 (96.5%) | 173 (3.5%) |
Public vs Private Health Insurance Coverage by Age in Yulee
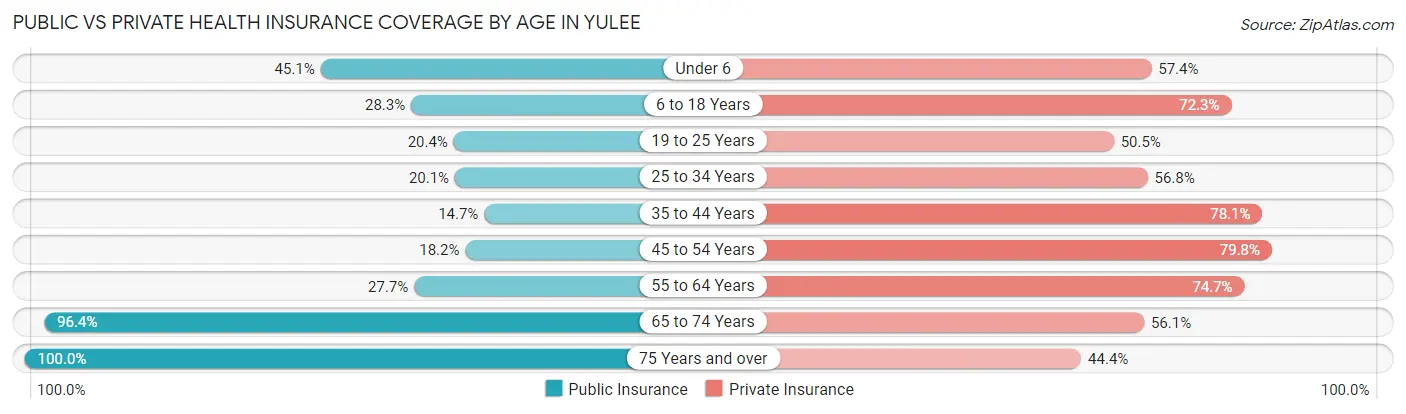
| Age Bracket | Public Insurance | Private Insurance |
| Under 6 | 506 (45.1%) | 645 (57.4%) |
| 6 to 18 Years | 596 (28.3%) | 1,524 (72.3%) |
| 19 to 25 Years | 196 (20.3%) | 486 (50.5%) |
| 25 to 34 Years | 389 (20.1%) | 1,097 (56.8%) |
| 35 to 44 Years | 271 (14.7%) | 1,440 (78.0%) |
| 45 to 54 Years | 286 (18.2%) | 1,254 (79.8%) |
| 55 to 64 Years | 480 (27.7%) | 1,295 (74.7%) |
| 65 to 74 Years | 1,488 (96.4%) | 866 (56.1%) |
| 75 Years and over | 835 (100.0%) | 371 (44.4%) |
| Total | 5,047 (37.0%) | 8,978 (65.7%) |
Disability Status by Sex by Age in Yulee
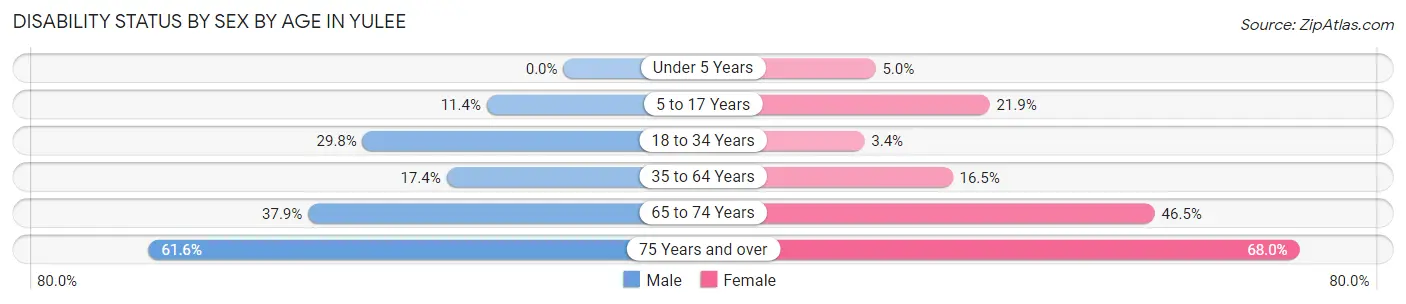
| Age Bracket | Male | Female |
| Under 5 Years | 0 (0.0%) | 20 (5.0%) |
| 5 to 17 Years | 133 (11.4%) | 200 (21.9%) |
| 18 to 34 Years | 527 (29.8%) | 42 (3.4%) |
| 35 to 64 Years | 447 (17.3%) | 423 (16.5%) |
| 65 to 74 Years | 285 (37.9%) | 368 (46.5%) |
| 75 Years and over | 226 (61.6%) | 318 (67.9%) |
Disability Class by Sex by Age in Yulee
Disability Class: Hearing Difficulty
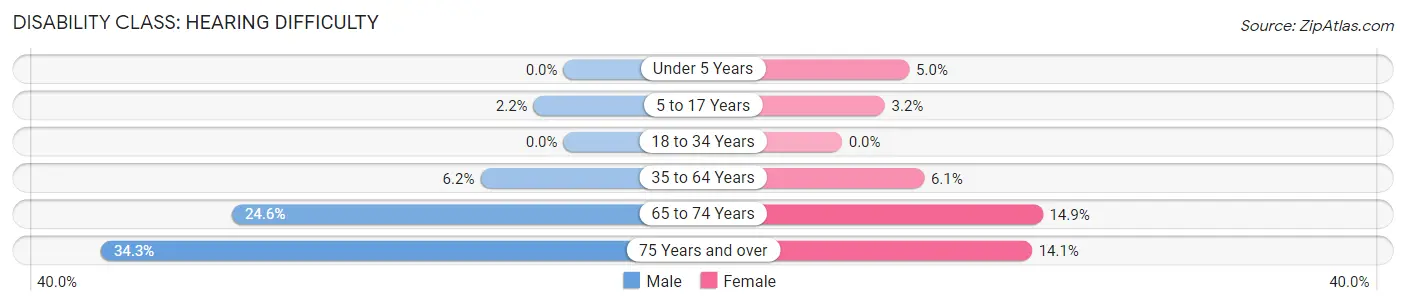
| Age Bracket | Male | Female |
| Under 5 Years | 0 (0.0%) | 20 (5.0%) |
| 5 to 17 Years | 26 (2.2%) | 29 (3.2%) |
| 18 to 34 Years | 0 (0.0%) | 0 (0.0%) |
| 35 to 64 Years | 159 (6.2%) | 157 (6.1%) |
| 65 to 74 Years | 185 (24.6%) | 118 (14.9%) |
| 75 Years and over | 126 (34.3%) | 66 (14.1%) |
Disability Class: Vision Difficulty
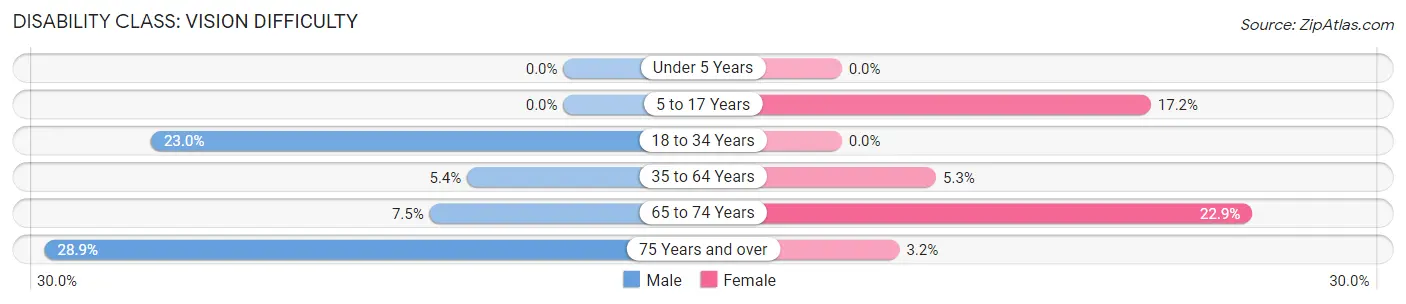
| Age Bracket | Male | Female |
| Under 5 Years | 0 (0.0%) | 0 (0.0%) |
| 5 to 17 Years | 0 (0.0%) | 157 (17.2%) |
| 18 to 34 Years | 406 (23.0%) | 0 (0.0%) |
| 35 to 64 Years | 138 (5.4%) | 135 (5.2%) |
| 65 to 74 Years | 56 (7.4%) | 181 (22.9%) |
| 75 Years and over | 106 (28.9%) | 15 (3.2%) |
Disability Class: Cognitive Difficulty
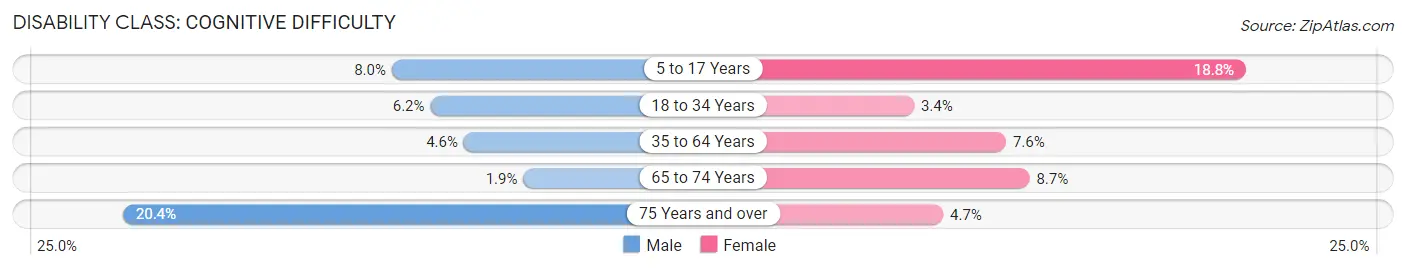
| Age Bracket | Male | Female |
| 5 to 17 Years | 93 (8.0%) | 171 (18.8%) |
| 18 to 34 Years | 109 (6.2%) | 42 (3.4%) |
| 35 to 64 Years | 119 (4.6%) | 196 (7.6%) |
| 65 to 74 Years | 14 (1.9%) | 69 (8.7%) |
| 75 Years and over | 75 (20.4%) | 22 (4.7%) |
Disability Class: Ambulatory Difficulty
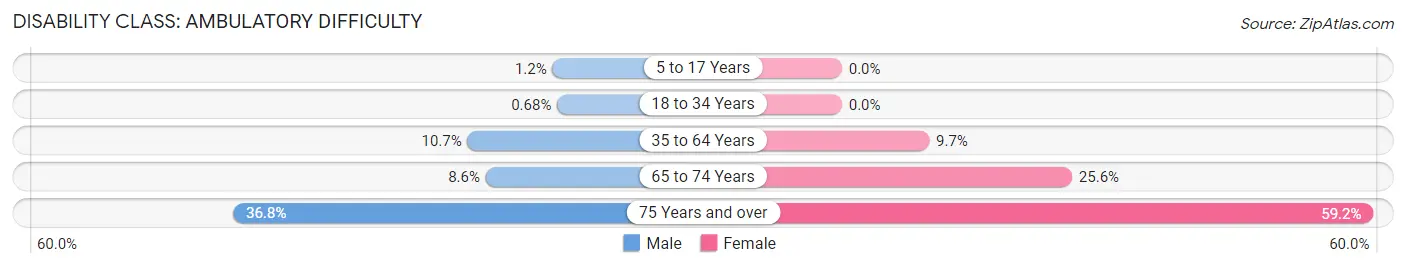
| Age Bracket | Male | Female |
| 5 to 17 Years | 14 (1.2%) | 0 (0.0%) |
| 18 to 34 Years | 12 (0.7%) | 0 (0.0%) |
| 35 to 64 Years | 275 (10.7%) | 250 (9.7%) |
| 65 to 74 Years | 65 (8.6%) | 203 (25.6%) |
| 75 Years and over | 135 (36.8%) | 277 (59.2%) |
Disability Class: Self-Care Difficulty
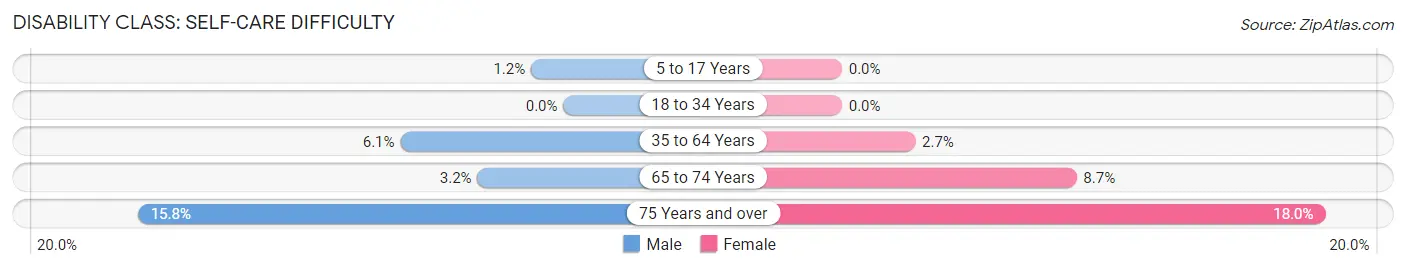
| Age Bracket | Male | Female |
| 5 to 17 Years | 14 (1.2%) | 0 (0.0%) |
| 18 to 34 Years | 0 (0.0%) | 0 (0.0%) |
| 35 to 64 Years | 156 (6.0%) | 70 (2.7%) |
| 65 to 74 Years | 24 (3.2%) | 69 (8.7%) |
| 75 Years and over | 58 (15.8%) | 84 (17.9%) |
Technology Access in Yulee
Computing Device Access in Yulee
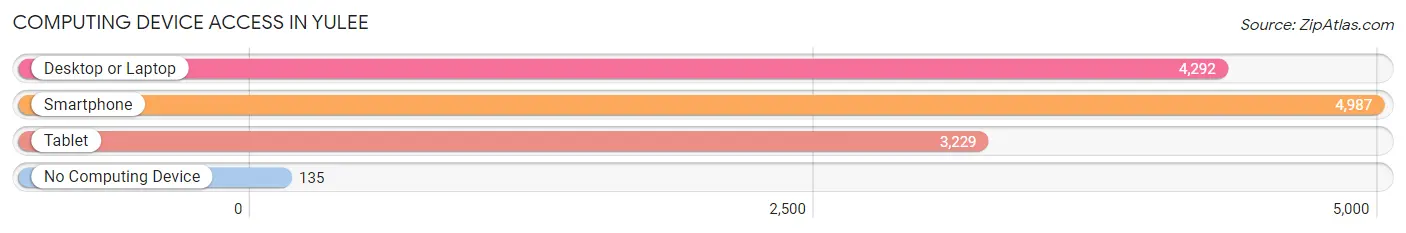
| Device Type | # Households | % Households |
| Desktop or Laptop | 4,292 | 80.4% |
| Smartphone | 4,987 | 93.4% |
| Tablet | 3,229 | 60.5% |
| No Computing Device | 135 | 2.5% |
| Total | 5,337 | 100.0% |
Internet Access in Yulee
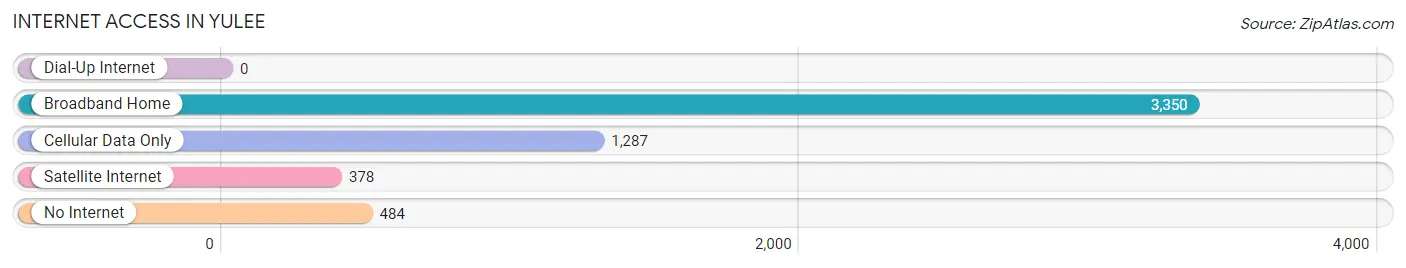
| Internet Type | # Households | % Households |
| Dial-Up Internet | 0 | 0.0% |
| Broadband Home | 3,350 | 62.8% |
| Cellular Data Only | 1,287 | 24.1% |
| Satellite Internet | 378 | 7.1% |
| No Internet | 484 | 9.1% |
| Total | 5,337 | 100.0% |
Yulee Summary
Yulee is a census-designated place (CDP) located in Nassau County, Florida, United States. It is part of the Jacksonville metropolitan area. The population was 11,491 at the 2010 census.
History
Yulee was founded in 1834 by David Levy Yulee, a United States Senator from Florida. He was the first person of Jewish heritage to be elected to the United States Senate. Yulee was a planter and businessman who owned several plantations in the area. He also built a railroad line that ran from Fernandina Beach to Cedar Key, which was the first cross-state railroad in Florida.
Yulee was originally known as Hickory Grove, but the name was changed to Yulee in 1856. The town was incorporated in 1859, but it was disincorporated in 1887.
Geography
Yulee is located in northeastern Florida, about 25 miles north of Jacksonville. It is situated along the Nassau River, which flows into the Atlantic Ocean. The town is bordered by the cities of Fernandina Beach and Callahan to the north, Hilliard to the east, and Bryceville to the south.
Yulee has a total area of 11.2 square miles, of which 10.9 square miles is land and 0.3 square miles is water.
Economy
Yulee is home to several businesses, including a Walmart Supercenter, a Lowe's Home Improvement store, and a Publix Super Market. The town is also home to several industrial parks, including the Yulee Industrial Park and the Yulee Commerce Park.
The town is served by the Jacksonville International Airport, which is located about 25 miles south of Yulee.
Demographics
As of the 2010 census, there were 11,491 people, 4,093 households, and 3,072 families residing in Yulee. The population density was 1,053.3 people per square mile. The racial makeup of the town was 79.2% White, 11.7% African American, 0.4% Native American, 2.2% Asian, 0.1% Pacific Islander, 4.2% from other races, and 2.2% from two or more races. Hispanic or Latino of any race were 8.7% of the population.
The median income for a household in Yulee was $50,945, and the median income for a family was $60,945. The per capita income for the town was $23,945. About 8.2% of families and 10.3% of the population were below the poverty line, including 14.2% of those under age 18 and 6.2% of those age 65 or over.
Common Questions
What is Per Capita Income in Yulee?
Per Capita income in Yulee is $34,559.
What is the Median Family Income in Yulee?
Median Family Income in Yulee is $87,566.
What is the Median Household income in Yulee?
Median Household Income in Yulee is $79,818.
What is Income or Wage Gap in Yulee?
Income or Wage Gap in Yulee is 32.7%.
Women in Yulee earn 67.3 cents for every dollar earned by a man.
What is Inequality or Gini Index in Yulee?
Inequality or Gini Index in Yulee is 0.38.
What is the Total Population of Yulee?
Total Population of Yulee is 13,776.
What is the Total Male Population of Yulee?
Total Male Population of Yulee is 7,370.
What is the Total Female Population of Yulee?
Total Female Population of Yulee is 6,406.
What is the Ratio of Males per 100 Females in Yulee?
There are 115.05 Males per 100 Females in Yulee.
What is the Ratio of Females per 100 Males in Yulee?
There are 86.92 Females per 100 Males in Yulee.
What is the Median Population Age in Yulee?
Median Population Age in Yulee is 37.6 Years.
What is the Average Family Size in Yulee
Average Family Size in Yulee is 3.0 People.
What is the Average Household Size in Yulee
Average Household Size in Yulee is 2.6 People.
How Large is the Labor Force in Yulee?
There are 6,773 People in the Labor Forcein in Yulee.
What is the Percentage of People in the Labor Force in Yulee?
61.7% of People are in the Labor Force in Yulee.
What is the Unemployment Rate in Yulee?
Unemployment Rate in Yulee is 1.9%.