Taiwanese GED/Equivalency

COMPARE

Taiwanese
Race
Ancestry
AfghanAfricanAlaska NativeAlaskan AthabascanAlbanianAleutAlsatianAmericanApacheArabArapahoArgentineanArmenianAssyrian/Chaldean/SyriacAustralianAustrianBahamianBangladeshiBarbadianBasqueBelgianBelizeanBermudanBhutaneseBlackfeetBolivianBrazilianBritishBritish West IndianBulgarianBurmeseCajunCambodianCanadianCape VerdeanCarpatho RusynCelticCentral AmericanCentral American IndianCherokeeCheyenneChickasawChileanChineseChippewaChoctawColombianColvilleComancheCosta RicanCreeCreekCroatianCrowCubanCypriotCzechCzechoslovakianDanishDelawareDominicanDutchDutch West IndianEastern EuropeanEcuadorianEgyptianEnglishEstonianEthiopianEuropeanFijianFilipinoFinnishFrenchFrench American IndianFrench CanadianGermanGerman RussianGhanaianGreekGuamanian/ChamorroGuatemalanGuyaneseHaitianHmongHonduranHopiHoumaHungarianIcelanderIndian (Asian)IndonesianInupiatIranianIraqiIrishIroquoisIsraeliItalianJamaicanJapaneseJordanianKenyanKiowaKoreanLaotianLatvianLebaneseLiberianLithuanianLumbeeLuxembourgerMacedonianMalaysianMalteseMarshalleseMenomineeMexicanMexican American IndianMongolianMoroccanNative HawaiianNavajoNepaleseNew ZealanderNicaraguanNigerianNorthern EuropeanNorwegianOkinawanOsageOttawaPaiutePakistaniPalestinianPanamanianParaguayanPennsylvania GermanPeruvianPimaPolishPortuguesePotawatomiPuebloPuerto RicanPuget Sound SalishRomanianRussianSalvadoranSamoanScandinavianScotch-IrishScottishSeminoleSenegaleseSerbianShoshoneSierra LeoneanSiouxSlavicSlovakSloveneSomaliSouth AfricanSouth AmericanSouth American IndianSoviet UnionSpaniardSpanishSpanish AmericanSpanish American IndianSri LankanSubsaharan AfricanSudaneseSwedishSwissSyrianTaiwaneseThaiTlingit-HaidaTohono O'OdhamTonganTrinidadian and TobagonianTsimshianTurkishU.S. Virgin IslanderUgandanUkrainianUruguayanUteVenezuelanVietnameseWelshWest IndianYakamaYaquiYugoslavianYumanYup'ikZimbabwean
Immigration
NonimmigrantsImmigrantsAfghanistanAfricaAlbaniaArgentinaArmeniaAsiaAustraliaAustriaBahamasBangladeshBarbadosBelarusBelgiumBelizeBoliviaBosnia and HerzegovinaBrazilBulgariaBurma/MyanmarCabo VerdeCambodiaCameroonCanadaCaribbeanCentral AmericaChileChinaColombiaCongoCosta RicaCroatiaCubaCzechoslovakiaDenmarkDominicaDominican RepublicEastern AfricaEastern AsiaEastern EuropeEcuadorEgyptEl SalvadorEnglandEritreaEthiopiaEuropeFijiFranceGermanyGhanaGreeceGrenadaGuatemalaGuyanaHaitiHondurasHong KongHungaryIndiaIndonesiaIranIraqIrelandIsraelItalyJamaicaJapanJordanKazakhstanKenyaKoreaKuwaitLaosLatin AmericaLatviaLebanonLiberiaLithuaniaMalaysiaMexicoMicronesiaMiddle AfricaMoldovaMoroccoNepalNetherlandsNicaraguaNigeriaNorth AmericaNorth MacedoniaNorthern AfricaNorthern EuropeNorwayOceaniaPakistanPanamaPeruPhilippinesPolandPortugalRomaniaRussiaSaudi ArabiaScotlandSenegalSerbiaSierra LeoneSingaporeSomaliaSouth AfricaSouth AmericaSouth Central AsiaSouth Eastern AsiaSouthern EuropeSpainSri LankaSt. Vincent and the GrenadinesSudanSwedenSwitzerlandSyriaTaiwanThailandTrinidad and TobagoTurkeyUgandaUkraineUruguayUzbekistanVenezuelaVietnamWest IndiesWestern AfricaWestern AsiaWestern EuropeYemenZaireZimbabweAzores
Select to Compare
Race
Ancestry
AfghanAfricanAlaska NativeAlaskan AthabascanAlbanianAleutAlsatianAmericanApacheArabArapahoArgentineanArmenianAssyrian/Chaldean/SyriacAustralianAustrianBahamianBangladeshiBarbadianBasqueBelgianBelizeanBermudanBhutaneseBlackfeetBolivianBrazilianBritishBritish West IndianBulgarianBurmeseCajunCambodianCanadianCape VerdeanCarpatho RusynCelticCentral AmericanCentral American IndianCherokeeCheyenneChickasawChileanChineseChippewaChoctawColombianColvilleComancheCosta RicanCreeCreekCroatianCrowCubanCypriotCzechCzechoslovakianDanishDelawareDominicanDutchDutch West IndianEastern EuropeanEcuadorianEgyptianEnglishEstonianEthiopianEuropeanFijianFilipinoFinnishFrenchFrench American IndianFrench CanadianGermanGerman RussianGhanaianGreekGuamanian/ChamorroGuatemalanGuyaneseHaitianHmongHonduranHopiHoumaHungarianIcelanderIndian (Asian)IndonesianInupiatIranianIraqiIrishIroquoisIsraeliItalianJamaicanJapaneseJordanianKenyanKiowaKoreanLaotianLatvianLebaneseLiberianLithuanianLumbeeLuxembourgerMacedonianMalaysianMalteseMarshalleseMenomineeMexicanMexican American IndianMongolianMoroccanNative HawaiianNavajoNepaleseNew ZealanderNicaraguanNigerianNorthern EuropeanNorwegianOkinawanOsageOttawaPaiutePakistaniPalestinianPanamanianParaguayanPennsylvania GermanPeruvianPimaPolishPortuguesePotawatomiPuebloPuerto RicanPuget Sound SalishRomanianRussianSalvadoranSamoanScandinavianScotch-IrishScottishSeminoleSenegaleseSerbianShoshoneSierra LeoneanSiouxSlavicSlovakSloveneSomaliSouth AfricanSouth AmericanSouth American IndianSoviet UnionSpaniardSpanishSpanish AmericanSpanish American IndianSri LankanSubsaharan AfricanSudaneseSwedishSwissSyrianThaiTlingit-HaidaTohono O'OdhamTonganTrinidadian and TobagonianTsimshianTurkishU.S. Virgin IslanderUgandanUkrainianUruguayanUteVenezuelanVietnameseWelshWest IndianYakamaYaquiYugoslavianYumanYup'ikZimbabwean
Immigration
NonimmigrantsImmigrantsAfghanistanAfricaAlbaniaArgentinaArmeniaAsiaAustraliaAustriaBahamasBangladeshBarbadosBelarusBelgiumBelizeBoliviaBosnia and HerzegovinaBrazilBulgariaBurma/MyanmarCabo VerdeCambodiaCameroonCanadaCaribbeanCentral AmericaChileChinaColombiaCongoCosta RicaCroatiaCubaCzechoslovakiaDenmarkDominicaDominican RepublicEastern AfricaEastern AsiaEastern EuropeEcuadorEgyptEl SalvadorEnglandEritreaEthiopiaEuropeFijiFranceGermanyGhanaGreeceGrenadaGuatemalaGuyanaHaitiHondurasHong KongHungaryIndiaIndonesiaIranIraqIrelandIsraelItalyJamaicaJapanJordanKazakhstanKenyaKoreaKuwaitLaosLatin AmericaLatviaLebanonLiberiaLithuaniaMalaysiaMexicoMicronesiaMiddle AfricaMoldovaMoroccoNepalNetherlandsNicaraguaNigeriaNorth AmericaNorth MacedoniaNorthern AfricaNorthern EuropeNorwayOceaniaPakistanPanamaPeruPhilippinesPolandPortugalRomaniaRussiaSaudi ArabiaScotlandSenegalSerbiaSierra LeoneSingaporeSomaliaSouth AfricaSouth AmericaSouth Central AsiaSouth Eastern AsiaSouthern EuropeSpainSri LankaSt. Vincent and the GrenadinesSudanSwedenSwitzerlandSyriaTaiwanThailandTrinidad and TobagoTurkeyUgandaUkraineUruguayUzbekistanVenezuelaVietnamWest IndiesWestern AfricaWestern AsiaWestern EuropeYemenZaireZimbabweAzores
GED/Equivalency
Income
Poverty
Unemployment
Labor Participation
Family Structure
Vehicle Availability
Education Level
Disability

Taiwanese GED/Equivalency
Tragic

84.7%
GED/EQUIVALENCY
8.1/ 100
METRIC RATING
221st/ 347
METRIC RANK

Taiwanese GED/Equivalency Correlation Chart

The statistical analysis conducted on geographies consisting of 31,724,936 people shows a slight negative correlation between the proportion of Taiwanese and percentage of population with at least ged/equivalency education in the United States with a correlation coefficient (R) of -0.058 and weighted average of 84.7%. On average, for every 1% (one percent) increase in Taiwanese within a typical geography, there is a decrease of 1.2% in percentage of population with at least ged/equivalency education.
Taiwanese GED/Equivalency
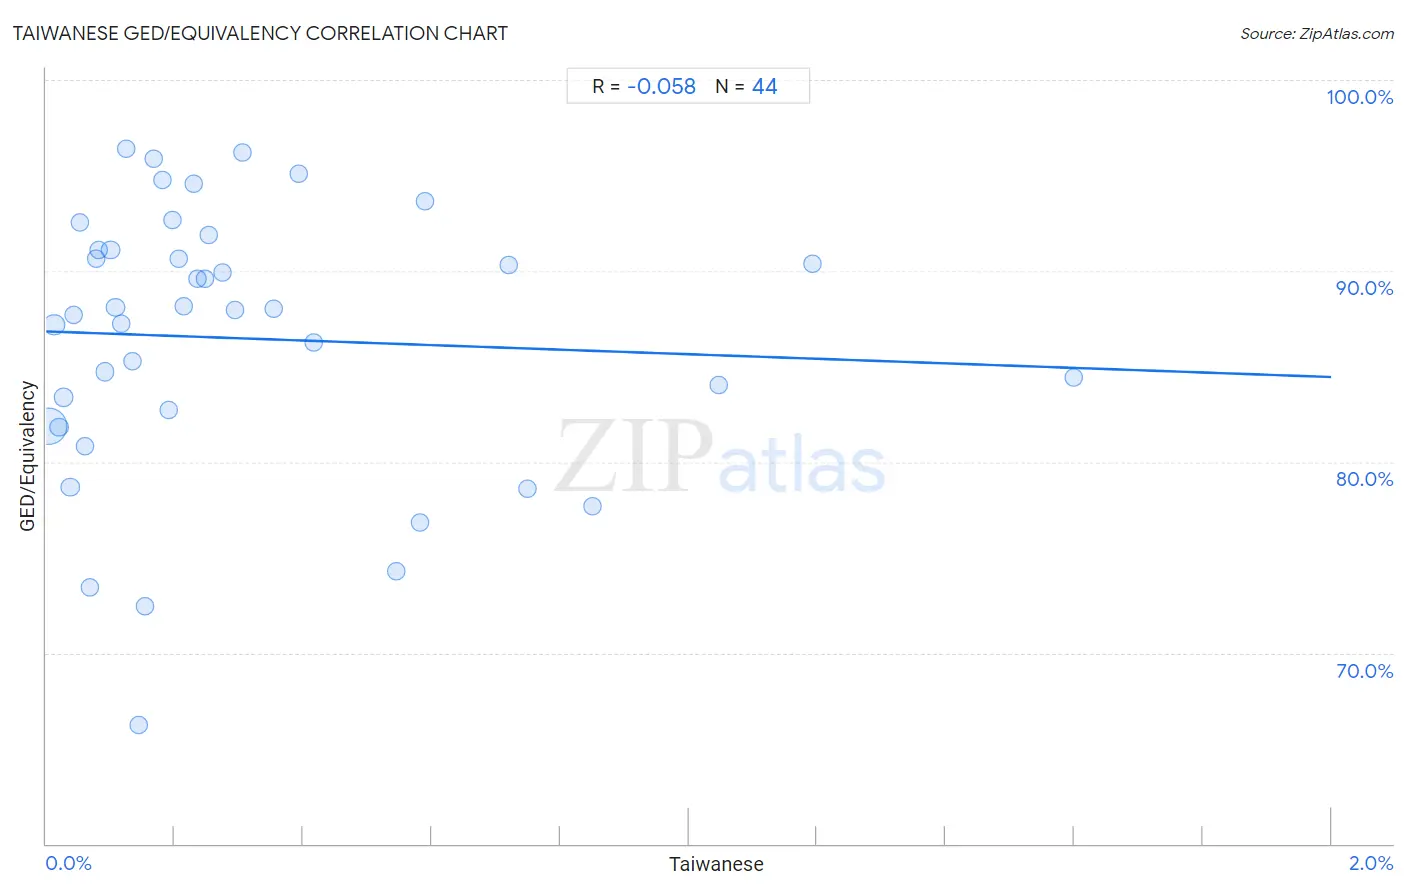
It is essential to understand that the correlation between the percentage of Taiwanese and percentage of population with at least ged/equivalency education does not imply a direct cause-and-effect relationship. It remains uncertain whether the presence of Taiwanese influences an upward or downward trend in the level of percentage of population with at least ged/equivalency education within an area, or if Taiwanese simply ended up residing in those areas with higher or lower levels of percentage of population with at least ged/equivalency education due to other factors.

Demographics Similar to Taiwanese by GED/Equivalency

In terms of ged/equivalency, the demographic groups most similar to Taiwanese are Potawatomi (84.7%, a difference of 0.010%), American (84.7%, a difference of 0.010%), Immigrants from Micronesia (84.7%, a difference of 0.040%), Nigerian (84.7%, a difference of 0.040%), and Alaska Native (84.7%, a difference of 0.040%).
DemographicsRating | RankGED/Equivalency
Osage
9.5
/100
|
#214
Tragic
84.8%
Peruvians
9.2
/100
|
#215
Tragic
84.7%
Immigrants from Micronesia
8.7
/100
|
#216
Tragic
84.7%
Nigerians
8.6
/100
|
#217
Tragic
84.7%
Alaska Natives
8.6
/100
|
#218
Tragic
84.7%
Potawatomi
8.2
/100
|
#219
Tragic
84.7%
Americans
8.2
/100
|
#220
Tragic
84.7%
Taiwanese
8.1
/100
|
#221
Tragic
84.7%
Iroquois
7.5
/100
|
#222
Tragic
84.6%
Immigrants from Uzbekistan
7.1
/100
|
#223
Tragic
84.6%
French American Indians
6.3
/100
|
#224
Tragic
84.6%
Immigrants from Thailand
5.8
/100
|
#225
Tragic
84.5%
Immigrants from Zaire
5.5
/100
|
#226
Tragic
84.5%
Immigrants from Costa Rica
5.4
/100
|
#227
Tragic
84.5%
Immigrants from Liberia
4.9
/100
|
#228
Tragic
84.4%

Taiwanese GED/Equivalency Correlation Summary

MeasurementTaiwanese DataGED/Equivalency Data
Minimum0.0036%66.2%
Maximum1.6%96.4%
Range1.6%30.1%
Mean0.31%86.5%
Median0.19%88.0%
Interquartile 25% (IQ1)0.087%82.3%
Interquartile 75% (IQ3)0.37%91.1%
Interquartile Range (IQR)0.29%8.8%
Standard Deviation (Sample)0.34%7.0%
Standard Deviation (Population)0.34%7.0%

Correlation Details

Taiwanese PercentileSample SizeGED/Equivalency
[
0.0%
-
0.5%
]
0.0036%
22,155,78381.9%
[
0.0%
-
0.5%
]
0.012%
3,425,75687.2%
[
0.0%
-
0.5%
]
0.020%
720,51981.8%
[
0.0%
-
0.5%
]
0.027%
1,852,20783.4%
[
0.0%
-
0.5%
]
0.037%
874,99978.7%
[
0.0%
-
0.5%
]
0.043%
240,26487.7%
[
0.0%
-
0.5%
]
0.052%
257,61092.5%
[
0.0%
-
0.5%
]
0.060%
80,64380.8%
[
0.0%
-
0.5%
]
0.068%
303,35173.4%
[
0.0%
-
0.5%
]
0.077%
135,55090.6%
[
0.0%
-
0.5%
]
0.082%
93,68891.1%
[
0.0%
-
0.5%
]
0.091%
204,04884.7%
[
0.0%
-
0.5%
]
0.10%
93,91791.1%
[
0.0%
-
0.5%
]
0.11%
335,51088.1%
[
0.0%
-
0.5%
]
0.12%
66,65887.3%
[
0.0%
-
0.5%
]
0.12%
37,04796.4%
[
0.0%
-
0.5%
]
0.13%
85,52585.3%
[
0.0%
-
0.5%
]
0.14%
47,54966.2%
[
0.0%
-
0.5%
]
0.15%
33,89072.4%
[
0.0%
-
0.5%
]
0.17%
33,29795.9%
[
0.0%
-
0.5%
]
0.18%
77,86894.8%
[
0.0%
-
0.5%
]
0.19%
63,42282.7%
[
0.0%
-
0.5%
]
0.20%
36,80692.7%
[
0.0%
-
0.5%
]
0.21%
61,75790.6%
[
0.0%
-
0.5%
]
0.21%
17,80888.1%
[
0.0%
-
0.5%
]
0.23%
42,11694.6%
[
0.0%
-
0.5%
]
0.23%
21,71289.6%
[
0.0%
-
0.5%
]
0.25%
40,06489.6%
[
0.0%
-
0.5%
]
0.25%
30,50991.9%
[
0.0%
-
0.5%
]
0.28%
18,53689.9%
[
0.0%
-
0.5%
]
0.29%
7,47188.0%
[
0.0%
-
0.5%
]
0.31%
65496.2%
[
0.0%
-
0.5%
]
0.35%
83,40188.0%
[
0.0%
-
0.5%
]
0.39%
7,62695.1%
[
0.0%
-
0.5%
]
0.42%
32,66586.3%
[
0.5%
-
1.0%
]
0.54%
1,47174.2%
[
0.5%
-
1.0%
]
0.58%
23,68976.8%
[
0.5%
-
1.0%
]
0.59%
3,05193.7%
[
0.5%
-
1.0%
]
0.72%
27890.3%
[
0.5%
-
1.0%
]
0.75%
66,24978.6%
[
0.5%
-
1.0%
]
0.85%
47077.7%
[
1.0%
-
1.5%
]
1.05%
4,48784.1%
[
1.0%
-
1.5%
]
1.19%
2,51590.4%
[
1.5%
-
2.0%
]
1.60%
2,50084.4%