Immigrants from Morocco GED/Equivalency

COMPARE

Immigrants from Morocco
Race
Ancestry
AfghanAfricanAlaska NativeAlaskan AthabascanAlbanianAleutAlsatianAmericanApacheArabArapahoArgentineanArmenianAssyrian/Chaldean/SyriacAustralianAustrianBahamianBangladeshiBarbadianBasqueBelgianBelizeanBermudanBhutaneseBlackfeetBolivianBrazilianBritishBritish West IndianBulgarianBurmeseCajunCambodianCanadianCape VerdeanCarpatho RusynCelticCentral AmericanCentral American IndianCherokeeCheyenneChickasawChileanChineseChippewaChoctawColombianColvilleComancheCosta RicanCreeCreekCroatianCrowCubanCypriotCzechCzechoslovakianDanishDelawareDominicanDutchDutch West IndianEastern EuropeanEcuadorianEgyptianEnglishEstonianEthiopianEuropeanFijianFilipinoFinnishFrenchFrench American IndianFrench CanadianGermanGerman RussianGhanaianGreekGuamanian/ChamorroGuatemalanGuyaneseHaitianHmongHonduranHopiHoumaHungarianIcelanderIndian (Asian)IndonesianInupiatIranianIraqiIrishIroquoisIsraeliItalianJamaicanJapaneseJordanianKenyanKiowaKoreanLaotianLatvianLebaneseLiberianLithuanianLumbeeLuxembourgerMacedonianMalaysianMalteseMarshalleseMenomineeMexicanMexican American IndianMongolianMoroccanNative HawaiianNavajoNepaleseNew ZealanderNicaraguanNigerianNorthern EuropeanNorwegianOkinawanOsageOttawaPaiutePakistaniPalestinianPanamanianParaguayanPennsylvania GermanPeruvianPimaPolishPortuguesePotawatomiPuebloPuerto RicanPuget Sound SalishRomanianRussianSalvadoranSamoanScandinavianScotch-IrishScottishSeminoleSenegaleseSerbianShoshoneSierra LeoneanSiouxSlavicSlovakSloveneSomaliSouth AfricanSouth AmericanSouth American IndianSoviet UnionSpaniardSpanishSpanish AmericanSpanish American IndianSri LankanSubsaharan AfricanSudaneseSwedishSwissSyrianTaiwaneseThaiTlingit-HaidaTohono O'OdhamTonganTrinidadian and TobagonianTsimshianTurkishU.S. Virgin IslanderUgandanUkrainianUruguayanUteVenezuelanVietnameseWelshWest IndianYakamaYaquiYugoslavianYumanYup'ikZimbabwean
Immigration
NonimmigrantsImmigrantsAfghanistanAfricaAlbaniaArgentinaArmeniaAsiaAustraliaAustriaBahamasBangladeshBarbadosBelarusBelgiumBelizeBoliviaBosnia and HerzegovinaBrazilBulgariaBurma/MyanmarCabo VerdeCambodiaCameroonCanadaCaribbeanCentral AmericaChileChinaColombiaCongoCosta RicaCroatiaCubaCzechoslovakiaDenmarkDominicaDominican RepublicEastern AfricaEastern AsiaEastern EuropeEcuadorEgyptEl SalvadorEnglandEritreaEthiopiaEuropeFijiFranceGermanyGhanaGreeceGrenadaGuatemalaGuyanaHaitiHondurasHong KongHungaryIndiaIndonesiaIranIraqIrelandIsraelItalyJamaicaJapanJordanKazakhstanKenyaKoreaKuwaitLaosLatin AmericaLatviaLebanonLiberiaLithuaniaMalaysiaMexicoMicronesiaMiddle AfricaMoldovaMoroccoNepalNetherlandsNicaraguaNigeriaNorth AmericaNorth MacedoniaNorthern AfricaNorthern EuropeNorwayOceaniaPakistanPanamaPeruPhilippinesPolandPortugalRomaniaRussiaSaudi ArabiaScotlandSenegalSerbiaSierra LeoneSingaporeSomaliaSouth AfricaSouth AmericaSouth Central AsiaSouth Eastern AsiaSouthern EuropeSpainSri LankaSt. Vincent and the GrenadinesSudanSwedenSwitzerlandSyriaTaiwanThailandTrinidad and TobagoTurkeyUgandaUkraineUruguayUzbekistanVenezuelaVietnamWest IndiesWestern AfricaWestern AsiaWestern EuropeYemenZaireZimbabweAzores
Select to Compare
Race
Ancestry
AfghanAfricanAlaska NativeAlaskan AthabascanAlbanianAleutAlsatianAmericanApacheArabArapahoArgentineanArmenianAssyrian/Chaldean/SyriacAustralianAustrianBahamianBangladeshiBarbadianBasqueBelgianBelizeanBermudanBhutaneseBlackfeetBolivianBrazilianBritishBritish West IndianBulgarianBurmeseCajunCambodianCanadianCape VerdeanCarpatho RusynCelticCentral AmericanCentral American IndianCherokeeCheyenneChickasawChileanChineseChippewaChoctawColombianColvilleComancheCosta RicanCreeCreekCroatianCrowCubanCypriotCzechCzechoslovakianDanishDelawareDominicanDutchDutch West IndianEastern EuropeanEcuadorianEgyptianEnglishEstonianEthiopianEuropeanFijianFilipinoFinnishFrenchFrench American IndianFrench CanadianGermanGerman RussianGhanaianGreekGuamanian/ChamorroGuatemalanGuyaneseHaitianHmongHonduranHopiHoumaHungarianIcelanderIndian (Asian)IndonesianInupiatIranianIraqiIrishIroquoisIsraeliItalianJamaicanJapaneseJordanianKenyanKiowaKoreanLaotianLatvianLebaneseLiberianLithuanianLumbeeLuxembourgerMacedonianMalaysianMalteseMarshalleseMenomineeMexicanMexican American IndianMongolianMoroccanNative HawaiianNavajoNepaleseNew ZealanderNicaraguanNigerianNorthern EuropeanNorwegianOkinawanOsageOttawaPaiutePakistaniPalestinianPanamanianParaguayanPennsylvania GermanPeruvianPimaPolishPortuguesePotawatomiPuebloPuerto RicanPuget Sound SalishRomanianRussianSalvadoranSamoanScandinavianScotch-IrishScottishSeminoleSenegaleseSerbianShoshoneSierra LeoneanSiouxSlavicSlovakSloveneSomaliSouth AfricanSouth AmericanSouth American IndianSoviet UnionSpaniardSpanishSpanish AmericanSpanish American IndianSri LankanSubsaharan AfricanSudaneseSwedishSwissSyrianTaiwaneseThaiTlingit-HaidaTohono O'OdhamTonganTrinidadian and TobagonianTsimshianTurkishU.S. Virgin IslanderUgandanUkrainianUruguayanUteVenezuelanVietnameseWelshWest IndianYakamaYaquiYugoslavianYumanYup'ikZimbabwean
Immigration
NonimmigrantsImmigrantsAfghanistanAfricaAlbaniaArgentinaArmeniaAsiaAustraliaAustriaBahamasBangladeshBarbadosBelarusBelgiumBelizeBoliviaBosnia and HerzegovinaBrazilBulgariaBurma/MyanmarCabo VerdeCambodiaCameroonCanadaCaribbeanCentral AmericaChileChinaColombiaCongoCosta RicaCroatiaCubaCzechoslovakiaDenmarkDominicaDominican RepublicEastern AfricaEastern AsiaEastern EuropeEcuadorEgyptEl SalvadorEnglandEritreaEthiopiaEuropeFijiFranceGermanyGhanaGreeceGrenadaGuatemalaGuyanaHaitiHondurasHong KongHungaryIndiaIndonesiaIranIraqIrelandIsraelItalyJamaicaJapanJordanKazakhstanKenyaKoreaKuwaitLaosLatin AmericaLatviaLebanonLiberiaLithuaniaMalaysiaMexicoMicronesiaMiddle AfricaMoldovaNepalNetherlandsNicaraguaNigeriaNorth AmericaNorth MacedoniaNorthern AfricaNorthern EuropeNorwayOceaniaPakistanPanamaPeruPhilippinesPolandPortugalRomaniaRussiaSaudi ArabiaScotlandSenegalSerbiaSierra LeoneSingaporeSomaliaSouth AfricaSouth AmericaSouth Central AsiaSouth Eastern AsiaSouthern EuropeSpainSri LankaSt. Vincent and the GrenadinesSudanSwedenSwitzerlandSyriaTaiwanThailandTrinidad and TobagoTurkeyUgandaUkraineUruguayUzbekistanVenezuelaVietnamWest IndiesWestern AfricaWestern AsiaWestern EuropeYemenZaireZimbabweAzores
GED/Equivalency
Income
Poverty
Unemployment
Labor Participation
Family Structure
Vehicle Availability
Education Level
Disability

Immigrants from Morocco GED/Equivalency
Good

86.1%
GED/EQUIVALENCY
69.5/ 100
METRIC RATING
160th/ 347
METRIC RANK

Immigrants from Morocco GED/Equivalency Correlation Chart

The statistical analysis conducted on geographies consisting of 178,912,438 people shows a moderate positive correlation between the proportion of Immigrants from Morocco and percentage of population with at least ged/equivalency education in the United States with a correlation coefficient (R) of 0.424 and weighted average of 86.1%. On average, for every 1% (one percent) increase in Immigrants from Morocco within a typical geography, there is an increase of 0.51% in percentage of population with at least ged/equivalency education.
Immigrants from Morocco GED/Equivalency
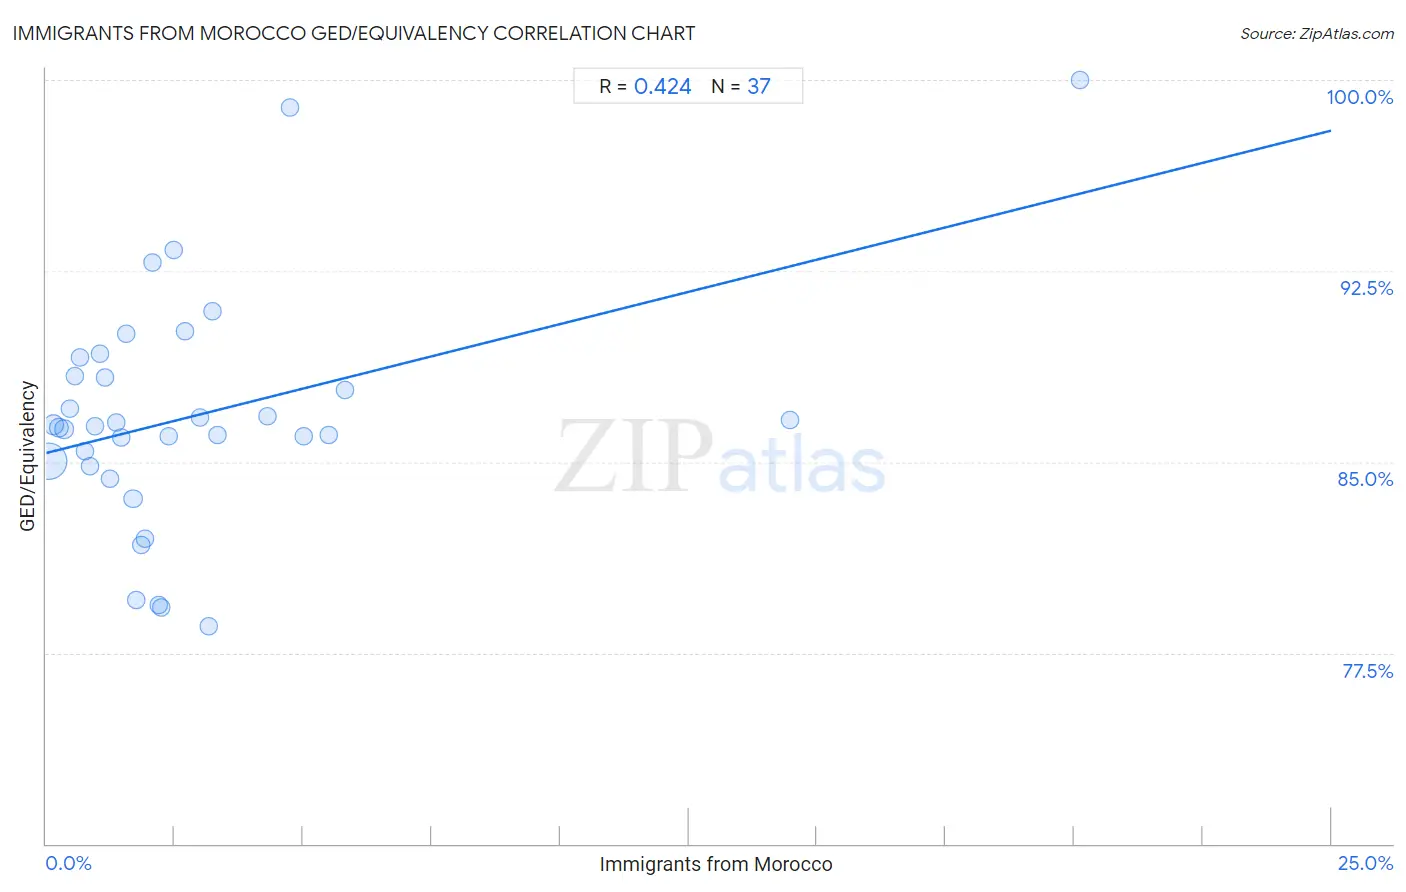
It is essential to understand that the correlation between the percentage of Immigrants from Morocco and percentage of population with at least ged/equivalency education does not imply a direct cause-and-effect relationship. It remains uncertain whether the presence of Immigrants from Morocco influences an upward or downward trend in the level of percentage of population with at least ged/equivalency education within an area, or if Immigrants from Morocco simply ended up residing in those areas with higher or lower levels of percentage of population with at least ged/equivalency education due to other factors.

Demographics Similar to Immigrants from Morocco by GED/Equivalency

In terms of ged/equivalency, the demographic groups most similar to Immigrants from Morocco are Immigrants from Syria (86.1%, a difference of 0.010%), Immigrants from Iraq (86.1%, a difference of 0.030%), German Russian (86.2%, a difference of 0.060%), Immigrants from Kenya (86.2%, a difference of 0.060%), and White/Caucasian (86.2%, a difference of 0.070%).
DemographicsRating | RankGED/Equivalency
Kenyans
76.6
/100
|
#153
Good
86.3%
Armenians
76.4
/100
|
#154
Good
86.3%
Iraqis
75.2
/100
|
#155
Good
86.2%
Immigrants from Nepal
73.3
/100
|
#156
Good
86.2%
Whites/Caucasians
72.2
/100
|
#157
Good
86.2%
German Russians
72.1
/100
|
#158
Good
86.2%
Immigrants from Kenya
71.8
/100
|
#159
Good
86.2%
Immigrants from Morocco
69.5
/100
|
#160
Good
86.1%
Immigrants from Syria
69.3
/100
|
#161
Good
86.1%
Immigrants from Iraq
68.1
/100
|
#162
Good
86.1%
Ugandans
66.3
/100
|
#163
Good
86.1%
Venezuelans
65.5
/100
|
#164
Good
86.0%
Alsatians
64.3
/100
|
#165
Good
86.0%
Immigrants from Albania
64.2
/100
|
#166
Good
86.0%
Ethiopians
63.7
/100
|
#167
Good
86.0%

Immigrants from Morocco GED/Equivalency Correlation Summary

MeasurementImmigrants from Morocco DataGED/Equivalency Data
Minimum0.040%78.5%
Maximum20.1%100.0%
Range20.1%21.5%
Mean2.9%86.8%
Median1.8%86.4%
Interquartile 25% (IQ1)0.91%84.9%
Interquartile 75% (IQ3)3.2%88.7%
Interquartile Range (IQR)2.3%3.8%
Standard Deviation (Sample)3.9%4.6%
Standard Deviation (Population)3.8%4.6%

Correlation Details

Immigrants from Morocco PercentileSample SizeGED/Equivalency
[
0.0%
-
0.5%
]
0.040%
140,164,14885.0%
[
0.0%
-
0.5%
]
0.14%
21,990,43486.5%
[
0.0%
-
0.5%
]
0.24%
6,980,89486.4%
[
0.0%
-
0.5%
]
0.35%
2,808,77486.3%
[
0.0%
-
0.5%
]
0.45%
1,874,10087.1%
[
0.5%
-
1.0%
]
0.55%
1,762,04988.4%
[
0.5%
-
1.0%
]
0.66%
779,66989.1%
[
0.5%
-
1.0%
]
0.75%
865,89185.4%
[
0.5%
-
1.0%
]
0.86%
378,60084.8%
[
0.5%
-
1.0%
]
0.95%
294,17486.4%
[
1.0%
-
1.5%
]
1.05%
254,25289.3%
[
1.0%
-
1.5%
]
1.15%
132,53588.3%
[
1.0%
-
1.5%
]
1.25%
92,24184.4%
[
1.0%
-
1.5%
]
1.36%
84,29286.5%
[
1.0%
-
1.5%
]
1.47%
74,04985.9%
[
1.5%
-
2.0%
]
1.55%
55,31290.0%
[
1.5%
-
2.0%
]
1.69%
183,49783.5%
[
1.5%
-
2.0%
]
1.74%
11,63779.6%
[
1.5%
-
2.0%
]
1.84%
3,59181.7%
[
1.5%
-
2.0%
]
1.93%
33,01682.0%
[
2.0%
-
2.5%
]
2.06%
9,68392.8%
[
2.0%
-
2.5%
]
2.19%
32079.4%
[
2.0%
-
2.5%
]
2.25%
97979.3%
[
2.0%
-
2.5%
]
2.39%
14,61986.0%
[
2.0%
-
2.5%
]
2.48%
4,35093.3%
[
2.5%
-
3.0%
]
2.69%
20,15590.1%
[
2.5%
-
3.0%
]
2.98%
19,53186.7%
[
3.0%
-
3.5%
]
3.16%
1,80478.5%
[
3.0%
-
3.5%
]
3.24%
5,12190.9%
[
3.0%
-
3.5%
]
3.34%
1,97586.1%
[
4.0%
-
4.5%
]
4.30%
46586.8%
[
4.5%
-
5.0%
]
4.74%
54898.9%
[
5.0%
-
5.5%
]
5.02%
5,12086.0%
[
5.5%
-
6.0%
]
5.51%
89086.1%
[
5.5%
-
6.0%
]
5.81%
2,56687.8%
[
14.0%
-
14.5%
]
14.46%
33286.7%
[
20.0%
-
20.5%
]
20.12%
825100.0%