Immigrants from Liberia GED/Equivalency
COMPARE
Immigrants from Liberia
Select to Compare
GED/Equivalency
Immigrants from Liberia GED/Equivalency
84.4%
GED/EQUIVALENCY
4.9/ 100
METRIC RATING
228th/ 347
METRIC RANK
Immigrants from Liberia GED/Equivalency Correlation Chart
The statistical analysis conducted on geographies consisting of 135,293,967 people shows a weak negative correlation between the proportion of Immigrants from Liberia and percentage of population with at least ged/equivalency education in the United States with a correlation coefficient (R) of -0.254 and weighted average of 84.4%. On average, for every 1% (one percent) increase in Immigrants from Liberia within a typical geography, there is a decrease of 0.48% in percentage of population with at least ged/equivalency education.
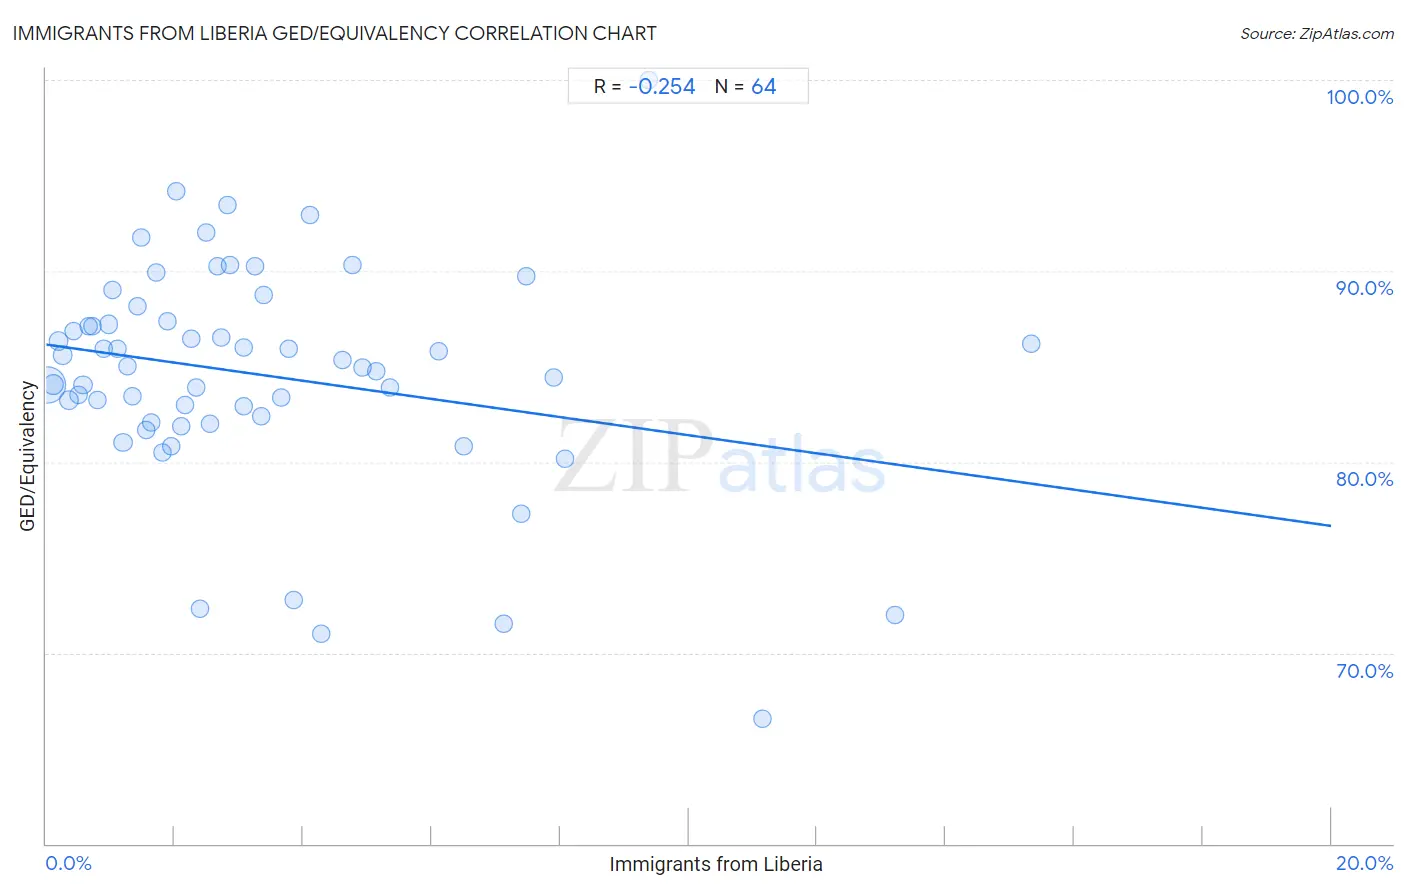
It is essential to understand that the correlation between the percentage of Immigrants from Liberia and percentage of population with at least ged/equivalency education does not imply a direct cause-and-effect relationship. It remains uncertain whether the presence of Immigrants from Liberia influences an upward or downward trend in the level of percentage of population with at least ged/equivalency education within an area, or if Immigrants from Liberia simply ended up residing in those areas with higher or lower levels of percentage of population with at least ged/equivalency education due to other factors.
Demographics Similar to Immigrants from Liberia by GED/Equivalency
In terms of ged/equivalency, the demographic groups most similar to Immigrants from Liberia are Immigrants from Uruguay (84.4%, a difference of 0.030%), Immigrants from Colombia (84.4%, a difference of 0.040%), Immigrants from Costa Rica (84.5%, a difference of 0.050%), Immigrants from Zaire (84.5%, a difference of 0.070%), and Immigrants from Middle Africa (84.4%, a difference of 0.070%).
| Demographics | Rating | Rank | GED/Equivalency |
| Taiwanese | 8.1 /100 | #221 | Tragic 84.7% |
| Iroquois | 7.5 /100 | #222 | Tragic 84.6% |
| Immigrants from Uzbekistan | 7.1 /100 | #223 | Tragic 84.6% |
| French American Indians | 6.3 /100 | #224 | Tragic 84.6% |
| Immigrants from Thailand | 5.8 /100 | #225 | Tragic 84.5% |
| Immigrants from Zaire | 5.5 /100 | #226 | Tragic 84.5% |
| Immigrants from Costa Rica | 5.4 /100 | #227 | Tragic 84.5% |
| Immigrants from Liberia | 4.9 /100 | #228 | Tragic 84.4% |
| Immigrants from Uruguay | 4.6 /100 | #229 | Tragic 84.4% |
| Immigrants from Colombia | 4.5 /100 | #230 | Tragic 84.4% |
| Immigrants from Middle Africa | 4.3 /100 | #231 | Tragic 84.4% |
| Immigrants from South America | 4.2 /100 | #232 | Tragic 84.4% |
| Immigrants from Panama | 4.1 /100 | #233 | Tragic 84.4% |
| Immigrants from Nigeria | 3.6 /100 | #234 | Tragic 84.3% |
| Ghanaians | 3.5 /100 | #235 | Tragic 84.3% |
Immigrants from Liberia GED/Equivalency Correlation Summary
| Measurement | Immigrants from Liberia Data | GED/Equivalency Data |
| Minimum | 0.028% | 66.5% |
| Maximum | 15.3% | 100.0% |
| Range | 15.3% | 33.5% |
| Mean | 3.4% | 84.5% |
| Median | 2.4% | 85.0% |
| Interquartile 25% (IQ1) | 1.2% | 82.2% |
| Interquartile 75% (IQ3) | 4.4% | 87.3% |
| Interquartile Range (IQR) | 3.2% | 5.0% |
| Standard Deviation (Sample) | 3.1% | 5.9% |
| Standard Deviation (Population) | 3.1% | 5.8% |
Correlation Details
| Immigrants from Liberia Percentile | Sample Size | GED/Equivalency |
[ 0.0% - 0.5% ] 0.028% | 92,542,380 | 84.0% |
[ 0.0% - 0.5% ] 0.11% | 16,925,035 | 84.0% |
[ 0.0% - 0.5% ] 0.19% | 8,256,951 | 86.3% |
[ 0.0% - 0.5% ] 0.26% | 4,351,180 | 85.6% |
[ 0.0% - 0.5% ] 0.35% | 4,457,993 | 83.2% |
[ 0.0% - 0.5% ] 0.42% | 1,577,371 | 86.8% |
[ 0.0% - 0.5% ] 0.50% | 1,692,279 | 83.5% |
[ 0.5% - 1.0% ] 0.57% | 912,468 | 84.0% |
[ 0.5% - 1.0% ] 0.66% | 503,893 | 87.1% |
[ 0.5% - 1.0% ] 0.73% | 376,329 | 87.1% |
[ 0.5% - 1.0% ] 0.80% | 335,805 | 83.2% |
[ 0.5% - 1.0% ] 0.89% | 183,456 | 85.9% |
[ 0.5% - 1.0% ] 0.96% | 448,826 | 87.2% |
[ 1.0% - 1.5% ] 1.03% | 347,729 | 89.0% |
[ 1.0% - 1.5% ] 1.11% | 103,306 | 85.9% |
[ 1.0% - 1.5% ] 1.20% | 518,373 | 81.0% |
[ 1.0% - 1.5% ] 1.26% | 89,285 | 85.0% |
[ 1.0% - 1.5% ] 1.34% | 107,193 | 83.4% |
[ 1.0% - 1.5% ] 1.42% | 121,884 | 88.2% |
[ 1.0% - 1.5% ] 1.48% | 8,705 | 91.8% |
[ 1.5% - 2.0% ] 1.57% | 21,905 | 81.7% |
[ 1.5% - 2.0% ] 1.64% | 113,593 | 82.1% |
[ 1.5% - 2.0% ] 1.72% | 176,668 | 89.9% |
[ 1.5% - 2.0% ] 1.81% | 42,534 | 80.5% |
[ 1.5% - 2.0% ] 1.89% | 56,572 | 87.3% |
[ 1.5% - 2.0% ] 1.94% | 23,101 | 80.8% |
[ 2.0% - 2.5% ] 2.03% | 9,507 | 94.2% |
[ 2.0% - 2.5% ] 2.10% | 52,655 | 81.9% |
[ 2.0% - 2.5% ] 2.17% | 47,729 | 83.0% |
[ 2.0% - 2.5% ] 2.25% | 33,620 | 86.5% |
[ 2.0% - 2.5% ] 2.34% | 95,009 | 83.9% |
[ 2.0% - 2.5% ] 2.40% | 91,692 | 72.3% |
[ 2.0% - 2.5% ] 2.49% | 6,295 | 92.0% |
[ 2.5% - 3.0% ] 2.55% | 50,464 | 82.0% |
[ 2.5% - 3.0% ] 2.67% | 12,017 | 90.3% |
[ 2.5% - 3.0% ] 2.73% | 13,811 | 86.5% |
[ 2.5% - 3.0% ] 2.83% | 5,234 | 93.5% |
[ 2.5% - 3.0% ] 2.87% | 35,244 | 90.3% |
[ 3.0% - 3.5% ] 3.07% | 17,716 | 86.0% |
[ 3.0% - 3.5% ] 3.08% | 15,709 | 82.9% |
[ 3.0% - 3.5% ] 3.25% | 30,544 | 90.3% |
[ 3.0% - 3.5% ] 3.34% | 8,596 | 82.4% |
[ 3.0% - 3.5% ] 3.39% | 48,577 | 88.8% |
[ 3.5% - 4.0% ] 3.66% | 23,363 | 83.4% |
[ 3.5% - 4.0% ] 3.78% | 32,912 | 85.9% |
[ 3.5% - 4.0% ] 3.86% | 1,425 | 72.8% |
[ 4.0% - 4.5% ] 4.10% | 11,051 | 92.9% |
[ 4.0% - 4.5% ] 4.27% | 14,550 | 71.0% |
[ 4.5% - 5.0% ] 4.60% | 22,337 | 85.4% |
[ 4.5% - 5.0% ] 4.76% | 21,620 | 90.3% |
[ 4.5% - 5.0% ] 4.93% | 23,804 | 84.9% |
[ 5.0% - 5.5% ] 5.14% | 84,951 | 84.7% |
[ 5.0% - 5.5% ] 5.35% | 37,169 | 83.9% |
[ 6.0% - 6.5% ] 6.12% | 32,967 | 85.8% |
[ 6.0% - 6.5% ] 6.49% | 22,493 | 80.8% |
[ 7.0% - 7.5% ] 7.11% | 13,075 | 71.5% |
[ 7.0% - 7.5% ] 7.38% | 35,780 | 77.3% |
[ 7.0% - 7.5% ] 7.48% | 468 | 89.7% |
[ 7.5% - 8.0% ] 7.91% | 28,392 | 84.4% |
[ 8.0% - 8.5% ] 8.07% | 10,682 | 80.2% |
[ 9.0% - 9.5% ] 9.38% | 32 | 100.0% |
[ 11.0% - 11.5% ] 11.15% | 3,156 | 66.5% |
[ 13.0% - 13.5% ] 13.21% | 1,658 | 72.0% |
[ 15.0% - 15.5% ] 15.34% | 2,849 | 86.2% |