Immigrants from Croatia GED/Equivalency
COMPARE
Immigrants from Croatia
Select to Compare
GED/Equivalency
Immigrants from Croatia GED/Equivalency
87.3%
GED/EQUIVALENCY
96.9/ 100
METRIC RATING
98th/ 347
METRIC RANK
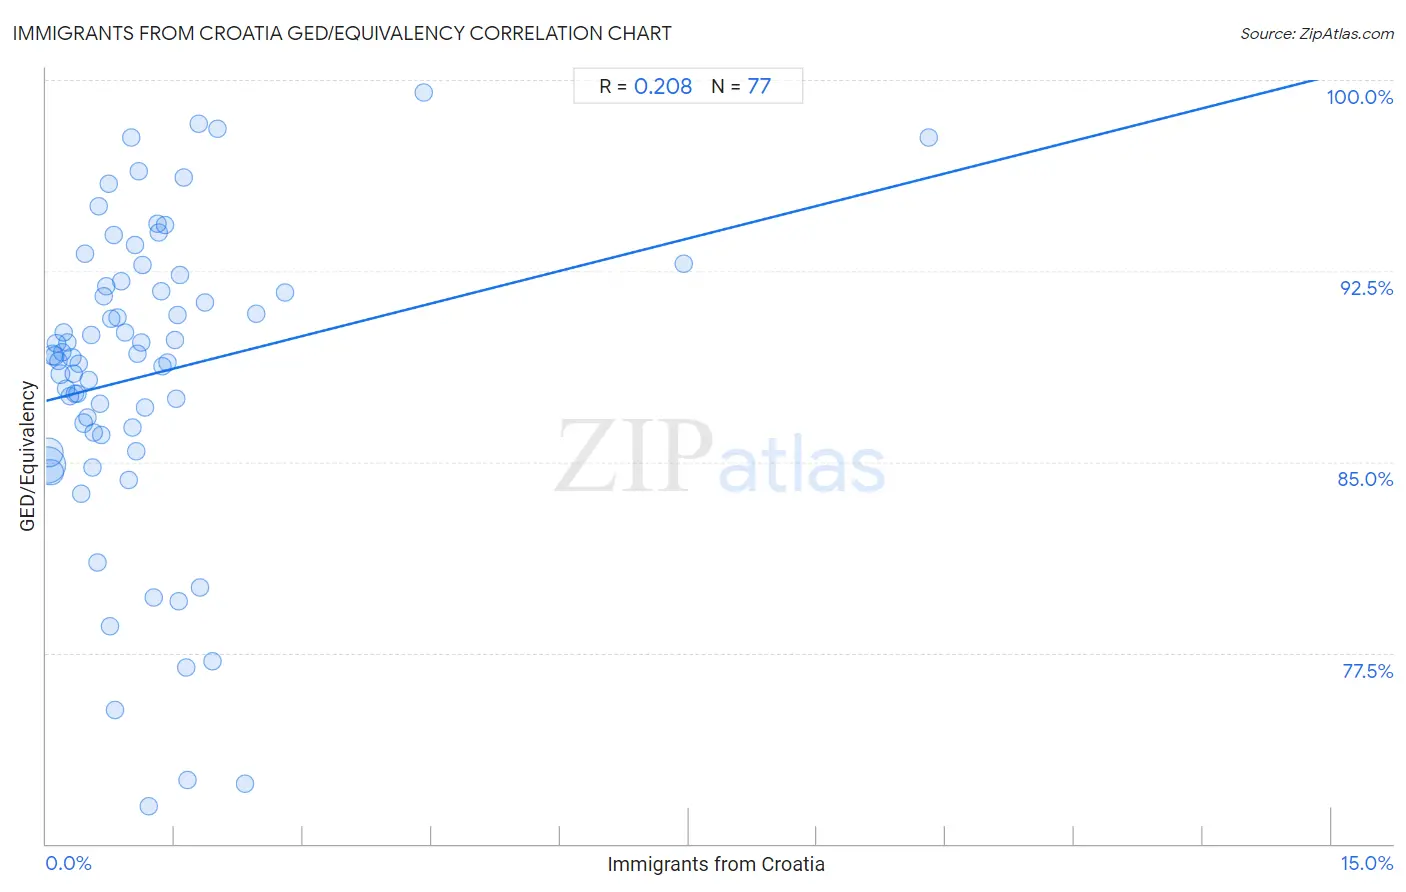
Immigrants from Croatia GED/Equivalency Correlation Chart
The statistical analysis conducted on geographies consisting of 132,577,989 people shows a weak positive correlation between the proportion of Immigrants from Croatia and percentage of population with at least ged/equivalency education in the United States with a correlation coefficient (R) of 0.208 and weighted average of 87.3%. On average, for every 1% (one percent) increase in Immigrants from Croatia within a typical geography, there is an increase of 0.85% in percentage of population with at least ged/equivalency education.
It is essential to understand that the correlation between the percentage of Immigrants from Croatia and percentage of population with at least ged/equivalency education does not imply a direct cause-and-effect relationship. It remains uncertain whether the presence of Immigrants from Croatia influences an upward or downward trend in the level of percentage of population with at least ged/equivalency education within an area, or if Immigrants from Croatia simply ended up residing in those areas with higher or lower levels of percentage of population with at least ged/equivalency education due to other factors.
Demographics Similar to Immigrants from Croatia by GED/Equivalency
In terms of ged/equivalency, the demographic groups most similar to Immigrants from Croatia are Immigrants from Belarus (87.3%, a difference of 0.010%), Palestinian (87.3%, a difference of 0.030%), Syrian (87.2%, a difference of 0.060%), Immigrants from Western Europe (87.3%, a difference of 0.070%), and Lebanese (87.2%, a difference of 0.11%).
| Demographics | Rating | Rank | GED/Equivalency |
| Immigrants from Eastern Asia | 97.9 /100 | #91 | Exceptional 87.4% |
| Israelis | 97.8 /100 | #92 | Exceptional 87.4% |
| Immigrants from North Macedonia | 97.8 /100 | #93 | Exceptional 87.4% |
| Immigrants from Russia | 97.8 /100 | #94 | Exceptional 87.4% |
| Immigrants from Greece | 97.7 /100 | #95 | Exceptional 87.4% |
| Czechoslovakians | 97.6 /100 | #96 | Exceptional 87.4% |
| Immigrants from Western Europe | 97.3 /100 | #97 | Exceptional 87.3% |
| Immigrants from Croatia | 96.9 /100 | #98 | Exceptional 87.3% |
| Immigrants from Belarus | 96.9 /100 | #99 | Exceptional 87.3% |
| Palestinians | 96.8 /100 | #100 | Exceptional 87.3% |
| Syrians | 96.6 /100 | #101 | Exceptional 87.2% |
| Lebanese | 96.2 /100 | #102 | Exceptional 87.2% |
| Jordanians | 96.1 /100 | #103 | Exceptional 87.2% |
| Immigrants from Hungary | 96.0 /100 | #104 | Exceptional 87.2% |
| Indians (Asian) | 95.9 /100 | #105 | Exceptional 87.1% |
Immigrants from Croatia GED/Equivalency Correlation Summary
| Measurement | Immigrants from Croatia Data | GED/Equivalency Data |
| Minimum | 0.010% | 71.5% |
| Maximum | 10.3% | 99.5% |
| Range | 10.3% | 28.0% |
| Mean | 1.2% | 88.4% |
| Median | 0.87% | 89.2% |
| Interquartile 25% (IQ1) | 0.42% | 86.1% |
| Interquartile 75% (IQ3) | 1.5% | 92.0% |
| Interquartile Range (IQR) | 1.0% | 5.9% |
| Standard Deviation (Sample) | 1.5% | 6.0% |
| Standard Deviation (Population) | 1.5% | 6.0% |
Correlation Details
| Immigrants from Croatia Percentile | Sample Size | GED/Equivalency |
[ 0.0% - 0.5% ] 0.010% | 53,227,368 | 84.9% |
[ 0.0% - 0.5% ] 0.031% | 32,238,248 | 85.4% |
[ 0.0% - 0.5% ] 0.049% | 22,841,552 | 84.6% |
[ 0.0% - 0.5% ] 0.077% | 6,961,575 | 89.2% |
[ 0.0% - 0.5% ] 0.098% | 5,243,750 | 89.2% |
[ 0.0% - 0.5% ] 0.12% | 2,516,308 | 89.7% |
[ 0.0% - 0.5% ] 0.14% | 1,631,746 | 89.0% |
[ 0.0% - 0.5% ] 0.16% | 1,325,015 | 88.4% |
[ 0.0% - 0.5% ] 0.19% | 1,125,105 | 89.3% |
[ 0.0% - 0.5% ] 0.21% | 545,986 | 90.1% |
[ 0.0% - 0.5% ] 0.23% | 769,935 | 87.9% |
[ 0.0% - 0.5% ] 0.25% | 589,204 | 89.7% |
[ 0.0% - 0.5% ] 0.27% | 484,873 | 87.6% |
[ 0.0% - 0.5% ] 0.30% | 341,651 | 89.1% |
[ 0.0% - 0.5% ] 0.32% | 227,065 | 88.5% |
[ 0.0% - 0.5% ] 0.34% | 318,546 | 87.7% |
[ 0.0% - 0.5% ] 0.36% | 203,231 | 87.7% |
[ 0.0% - 0.5% ] 0.39% | 208,826 | 88.9% |
[ 0.0% - 0.5% ] 0.41% | 65,108 | 83.8% |
[ 0.0% - 0.5% ] 0.43% | 159,676 | 86.5% |
[ 0.0% - 0.5% ] 0.45% | 135,542 | 93.2% |
[ 0.0% - 0.5% ] 0.48% | 119,493 | 86.8% |
[ 0.0% - 0.5% ] 0.49% | 164,910 | 88.2% |
[ 0.5% - 1.0% ] 0.52% | 77,634 | 90.0% |
[ 0.5% - 1.0% ] 0.54% | 40,579 | 84.8% |
[ 0.5% - 1.0% ] 0.56% | 83,552 | 86.2% |
[ 0.5% - 1.0% ] 0.59% | 80,692 | 81.0% |
[ 0.5% - 1.0% ] 0.61% | 14,359 | 95.0% |
[ 0.5% - 1.0% ] 0.63% | 87,443 | 87.3% |
[ 0.5% - 1.0% ] 0.65% | 30,057 | 86.1% |
[ 0.5% - 1.0% ] 0.67% | 56,899 | 91.5% |
[ 0.5% - 1.0% ] 0.70% | 38,116 | 91.9% |
[ 0.5% - 1.0% ] 0.73% | 4,536 | 95.9% |
[ 0.5% - 1.0% ] 0.74% | 6,785 | 78.6% |
[ 0.5% - 1.0% ] 0.76% | 47,950 | 90.6% |
[ 0.5% - 1.0% ] 0.78% | 65,748 | 93.9% |
[ 0.5% - 1.0% ] 0.80% | 9,073 | 75.2% |
[ 0.5% - 1.0% ] 0.83% | 31,458 | 90.7% |
[ 0.5% - 1.0% ] 0.87% | 52,121 | 92.1% |
[ 0.5% - 1.0% ] 0.92% | 35,889 | 90.1% |
[ 0.5% - 1.0% ] 0.96% | 20,996 | 84.3% |
[ 0.5% - 1.0% ] 0.99% | 8,820 | 97.8% |
[ 1.0% - 1.5% ] 1.00% | 499 | 86.4% |
[ 1.0% - 1.5% ] 1.03% | 486 | 93.5% |
[ 1.0% - 1.5% ] 1.05% | 5,598 | 85.4% |
[ 1.0% - 1.5% ] 1.06% | 470 | 89.2% |
[ 1.0% - 1.5% ] 1.08% | 3,966 | 96.4% |
[ 1.0% - 1.5% ] 1.11% | 18,166 | 89.7% |
[ 1.0% - 1.5% ] 1.13% | 3,999 | 92.7% |
[ 1.0% - 1.5% ] 1.15% | 34,752 | 87.1% |
[ 1.0% - 1.5% ] 1.20% | 1,254 | 71.5% |
[ 1.0% - 1.5% ] 1.25% | 38,209 | 79.7% |
[ 1.0% - 1.5% ] 1.29% | 5,496 | 94.3% |
[ 1.0% - 1.5% ] 1.31% | 70,431 | 94.0% |
[ 1.0% - 1.5% ] 1.34% | 34,539 | 91.7% |
[ 1.0% - 1.5% ] 1.35% | 2,444 | 88.8% |
[ 1.0% - 1.5% ] 1.38% | 362 | 94.3% |
[ 1.0% - 1.5% ] 1.41% | 8,801 | 88.9% |
[ 1.0% - 1.5% ] 1.50% | 2,739 | 89.8% |
[ 1.5% - 2.0% ] 1.52% | 330 | 87.5% |
[ 1.5% - 2.0% ] 1.53% | 1,374 | 90.8% |
[ 1.5% - 2.0% ] 1.55% | 1,875 | 79.5% |
[ 1.5% - 2.0% ] 1.57% | 24,440 | 92.4% |
[ 1.5% - 2.0% ] 1.60% | 811 | 96.2% |
[ 1.5% - 2.0% ] 1.63% | 307 | 76.9% |
[ 1.5% - 2.0% ] 1.65% | 910 | 72.5% |
[ 1.5% - 2.0% ] 1.78% | 8,804 | 98.3% |
[ 1.5% - 2.0% ] 1.79% | 20,401 | 80.1% |
[ 1.5% - 2.0% ] 1.85% | 6,914 | 91.2% |
[ 1.5% - 2.0% ] 1.94% | 412 | 77.2% |
[ 2.0% - 2.5% ] 2.00% | 6,590 | 98.1% |
[ 2.0% - 2.5% ] 2.32% | 29,870 | 72.4% |
[ 2.0% - 2.5% ] 2.45% | 286 | 90.8% |
[ 2.5% - 3.0% ] 2.78% | 2,442 | 91.6% |
[ 4.0% - 4.5% ] 4.41% | 1,428 | 99.5% |
[ 7.0% - 7.5% ] 7.44% | 766 | 92.8% |
[ 10.0% - 10.5% ] 10.30% | 398 | 97.7% |