Nicaraguan GED/Equivalency
COMPARE
Nicaraguan
Select to Compare
GED/Equivalency
Nicaraguan GED/Equivalency
80.9%
GED/EQUIVALENCY
0.0/ 100
METRIC RATING
312th/ 347
METRIC RANK
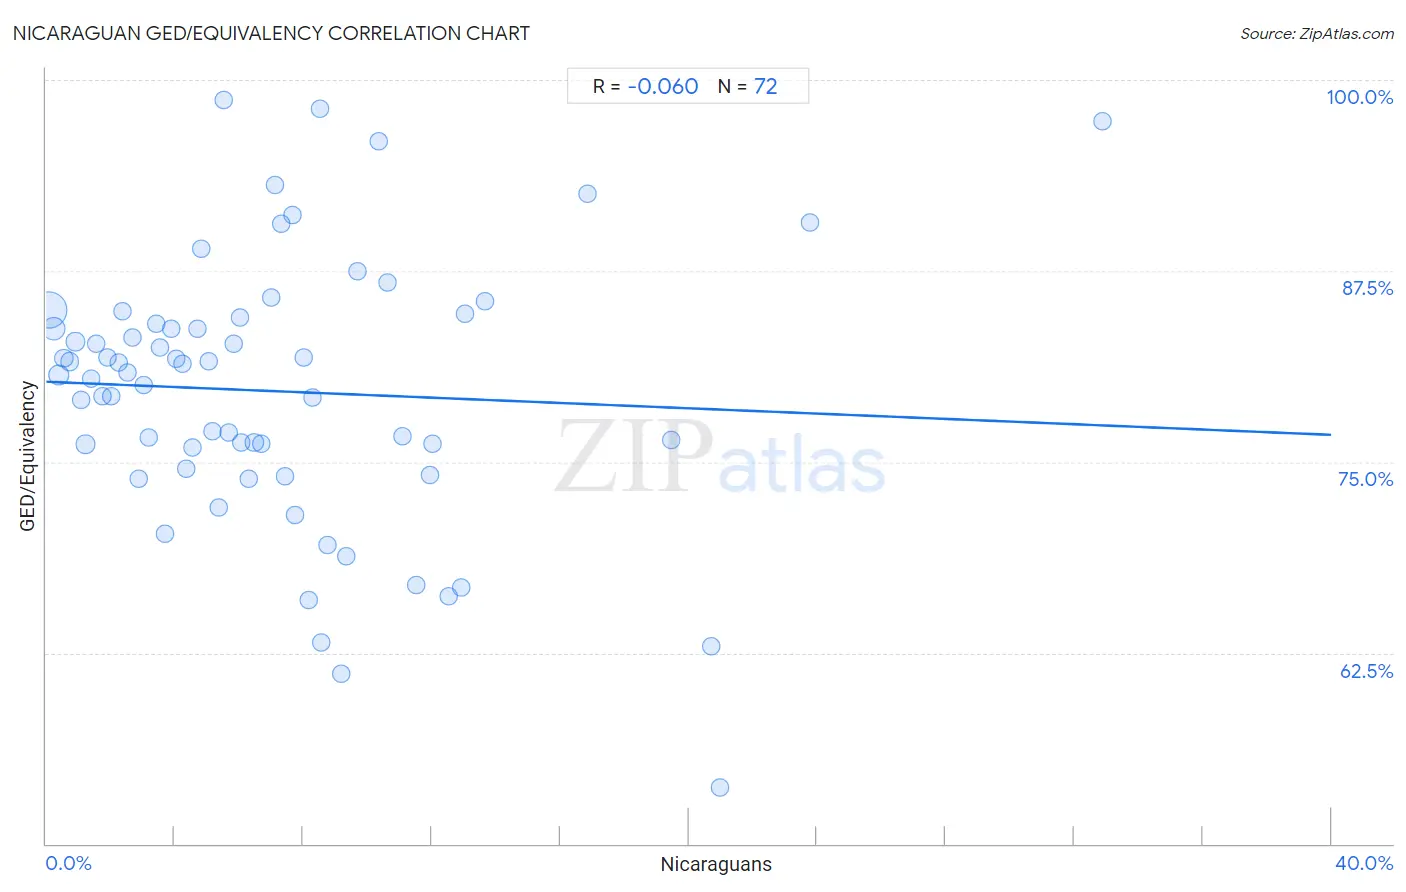
Nicaraguan GED/Equivalency Correlation Chart
The statistical analysis conducted on geographies consisting of 285,710,633 people shows a slight negative correlation between the proportion of Nicaraguans and percentage of population with at least ged/equivalency education in the United States with a correlation coefficient (R) of -0.060 and weighted average of 80.9%. On average, for every 1% (one percent) increase in Nicaraguans within a typical geography, there is a decrease of 0.087% in percentage of population with at least ged/equivalency education.
It is essential to understand that the correlation between the percentage of Nicaraguans and percentage of population with at least ged/equivalency education does not imply a direct cause-and-effect relationship. It remains uncertain whether the presence of Nicaraguans influences an upward or downward trend in the level of percentage of population with at least ged/equivalency education within an area, or if Nicaraguans simply ended up residing in those areas with higher or lower levels of percentage of population with at least ged/equivalency education due to other factors.
Demographics Similar to Nicaraguans by GED/Equivalency
In terms of ged/equivalency, the demographic groups most similar to Nicaraguans are Cape Verdean (80.9%, a difference of 0.0%), Belizean (80.9%, a difference of 0.020%), Immigrants from Guyana (81.0%, a difference of 0.040%), Native/Alaskan (80.9%, a difference of 0.040%), and Immigrants from Ecuador (81.0%, a difference of 0.10%).
| Demographics | Rating | Rank | GED/Equivalency |
| Immigrants from Grenada | 0.0 /100 | #305 | Tragic 81.3% |
| Guyanese | 0.0 /100 | #306 | Tragic 81.3% |
| Immigrants from Dominica | 0.0 /100 | #307 | Tragic 81.1% |
| Puerto Ricans | 0.0 /100 | #308 | Tragic 81.1% |
| Immigrants from Ecuador | 0.0 /100 | #309 | Tragic 81.0% |
| Immigrants from Guyana | 0.0 /100 | #310 | Tragic 81.0% |
| Natives/Alaskans | 0.0 /100 | #311 | Tragic 80.9% |
| Nicaraguans | 0.0 /100 | #312 | Tragic 80.9% |
| Cape Verdeans | 0.0 /100 | #313 | Tragic 80.9% |
| Belizeans | 0.0 /100 | #314 | Tragic 80.9% |
| Apache | 0.0 /100 | #315 | Tragic 80.7% |
| Central American Indians | 0.0 /100 | #316 | Tragic 80.6% |
| Immigrants from Caribbean | 0.0 /100 | #317 | Tragic 80.5% |
| Yaqui | 0.0 /100 | #318 | Tragic 80.5% |
| Immigrants from Belize | 0.0 /100 | #319 | Tragic 80.5% |
Nicaraguan GED/Equivalency Correlation Summary
| Measurement | Nicaraguan Data | GED/Equivalency Data |
| Minimum | 0.071% | 53.7% |
| Maximum | 32.9% | 98.7% |
| Range | 32.8% | 45.0% |
| Mean | 7.2% | 79.6% |
| Median | 5.9% | 80.7% |
| Interquartile 25% (IQ1) | 3.0% | 75.3% |
| Interquartile 75% (IQ3) | 9.3% | 84.2% |
| Interquartile Range (IQR) | 6.3% | 9.0% |
| Standard Deviation (Sample) | 6.0% | 8.8% |
| Standard Deviation (Population) | 6.0% | 8.7% |
Correlation Details
| Nicaraguan Percentile | Sample Size | GED/Equivalency |
[ 0.0% - 0.5% ] 0.071% | 178,754,693 | 84.9% |
[ 0.0% - 0.5% ] 0.24% | 49,107,345 | 83.7% |
[ 0.0% - 0.5% ] 0.40% | 23,754,500 | 80.7% |
[ 0.5% - 1.0% ] 0.56% | 9,798,453 | 81.8% |
[ 0.5% - 1.0% ] 0.73% | 5,908,354 | 81.6% |
[ 0.5% - 1.0% ] 0.90% | 4,651,071 | 82.9% |
[ 1.0% - 1.5% ] 1.07% | 2,205,053 | 79.1% |
[ 1.0% - 1.5% ] 1.22% | 2,076,820 | 76.2% |
[ 1.0% - 1.5% ] 1.39% | 1,566,499 | 80.4% |
[ 1.5% - 2.0% ] 1.56% | 1,007,813 | 82.7% |
[ 1.5% - 2.0% ] 1.74% | 475,924 | 79.3% |
[ 1.5% - 2.0% ] 1.89% | 915,272 | 81.8% |
[ 2.0% - 2.5% ] 2.04% | 427,526 | 79.3% |
[ 2.0% - 2.5% ] 2.24% | 500,382 | 81.5% |
[ 2.0% - 2.5% ] 2.36% | 411,420 | 84.9% |
[ 2.5% - 3.0% ] 2.53% | 411,448 | 80.8% |
[ 2.5% - 3.0% ] 2.67% | 195,945 | 83.2% |
[ 2.5% - 3.0% ] 2.88% | 130,164 | 73.9% |
[ 3.0% - 3.5% ] 3.04% | 56,882 | 80.1% |
[ 3.0% - 3.5% ] 3.20% | 217,683 | 76.6% |
[ 3.0% - 3.5% ] 3.41% | 112,426 | 84.0% |
[ 3.5% - 4.0% ] 3.53% | 268,454 | 82.5% |
[ 3.5% - 4.0% ] 3.69% | 72,794 | 70.3% |
[ 3.5% - 4.0% ] 3.88% | 164,477 | 83.7% |
[ 4.0% - 4.5% ] 4.06% | 121,587 | 81.8% |
[ 4.0% - 4.5% ] 4.25% | 57,397 | 81.5% |
[ 4.0% - 4.5% ] 4.36% | 150,561 | 74.6% |
[ 4.5% - 5.0% ] 4.54% | 381,917 | 76.0% |
[ 4.5% - 5.0% ] 4.69% | 81,449 | 83.7% |
[ 4.5% - 5.0% ] 4.84% | 52,719 | 88.9% |
[ 5.0% - 5.5% ] 5.08% | 34,628 | 81.6% |
[ 5.0% - 5.5% ] 5.18% | 80,975 | 77.0% |
[ 5.0% - 5.5% ] 5.37% | 39,581 | 72.0% |
[ 5.5% - 6.0% ] 5.52% | 1,287 | 98.7% |
[ 5.5% - 6.0% ] 5.66% | 73,148 | 76.9% |
[ 5.5% - 6.0% ] 5.85% | 49,851 | 82.7% |
[ 6.0% - 6.5% ] 6.02% | 82,658 | 84.5% |
[ 6.0% - 6.5% ] 6.09% | 59,115 | 76.2% |
[ 6.0% - 6.5% ] 6.32% | 94,134 | 73.9% |
[ 6.0% - 6.5% ] 6.48% | 443,665 | 76.3% |
[ 6.5% - 7.0% ] 6.69% | 81,226 | 76.2% |
[ 7.0% - 7.5% ] 7.00% | 14,957 | 85.7% |
[ 7.0% - 7.5% ] 7.12% | 1,194 | 93.2% |
[ 7.0% - 7.5% ] 7.32% | 18,719 | 90.6% |
[ 7.0% - 7.5% ] 7.42% | 58,131 | 74.1% |
[ 7.5% - 8.0% ] 7.65% | 35,034 | 91.2% |
[ 7.5% - 8.0% ] 7.75% | 284 | 71.5% |
[ 8.0% - 8.5% ] 8.01% | 102,282 | 81.8% |
[ 8.0% - 8.5% ] 8.15% | 2,379 | 66.0% |
[ 8.0% - 8.5% ] 8.27% | 73,842 | 79.2% |
[ 8.5% - 9.0% ] 8.52% | 270 | 98.1% |
[ 8.5% - 9.0% ] 8.58% | 46,911 | 63.2% |
[ 8.5% - 9.0% ] 8.74% | 14,698 | 69.5% |
[ 9.0% - 9.5% ] 9.19% | 59,121 | 61.1% |
[ 9.0% - 9.5% ] 9.33% | 34,335 | 68.8% |
[ 9.5% - 10.0% ] 9.68% | 62 | 87.5% |
[ 10.0% - 10.5% ] 10.36% | 2,549 | 96.0% |
[ 10.5% - 11.0% ] 10.62% | 1,083 | 86.8% |
[ 11.0% - 11.5% ] 11.07% | 867 | 76.6% |
[ 11.5% - 12.0% ] 11.53% | 34,742 | 66.9% |
[ 11.5% - 12.0% ] 11.93% | 41,056 | 74.2% |
[ 12.0% - 12.5% ] 12.03% | 582 | 76.2% |
[ 12.5% - 13.0% ] 12.54% | 54,873 | 66.2% |
[ 12.5% - 13.0% ] 12.92% | 12,069 | 66.8% |
[ 13.0% - 13.5% ] 13.02% | 630 | 84.7% |
[ 13.5% - 14.0% ] 13.65% | 740 | 85.5% |
[ 16.5% - 17.0% ] 16.84% | 95 | 92.6% |
[ 19.0% - 19.5% ] 19.47% | 262 | 76.4% |
[ 20.5% - 21.0% ] 20.70% | 19,399 | 63.0% |
[ 20.5% - 21.0% ] 20.96% | 334 | 53.7% |
[ 23.5% - 24.0% ] 23.78% | 143 | 90.7% |
[ 32.5% - 33.0% ] 32.88% | 1,694 | 97.3% |