New Zealander GED/Equivalency
COMPARE
New Zealander
Select to Compare
GED/Equivalency
New Zealander GED/Equivalency
88.0%
GED/EQUIVALENCY
99.4/ 100
METRIC RATING
55th/ 347
METRIC RANK
New Zealander GED/Equivalency Correlation Chart
The statistical analysis conducted on geographies consisting of 106,911,650 people shows a mild positive correlation between the proportion of New Zealanders and percentage of population with at least ged/equivalency education in the United States with a correlation coefficient (R) of 0.322 and weighted average of 88.0%. On average, for every 1% (one percent) increase in New Zealanders within a typical geography, there is an increase of 0.53% in percentage of population with at least ged/equivalency education.
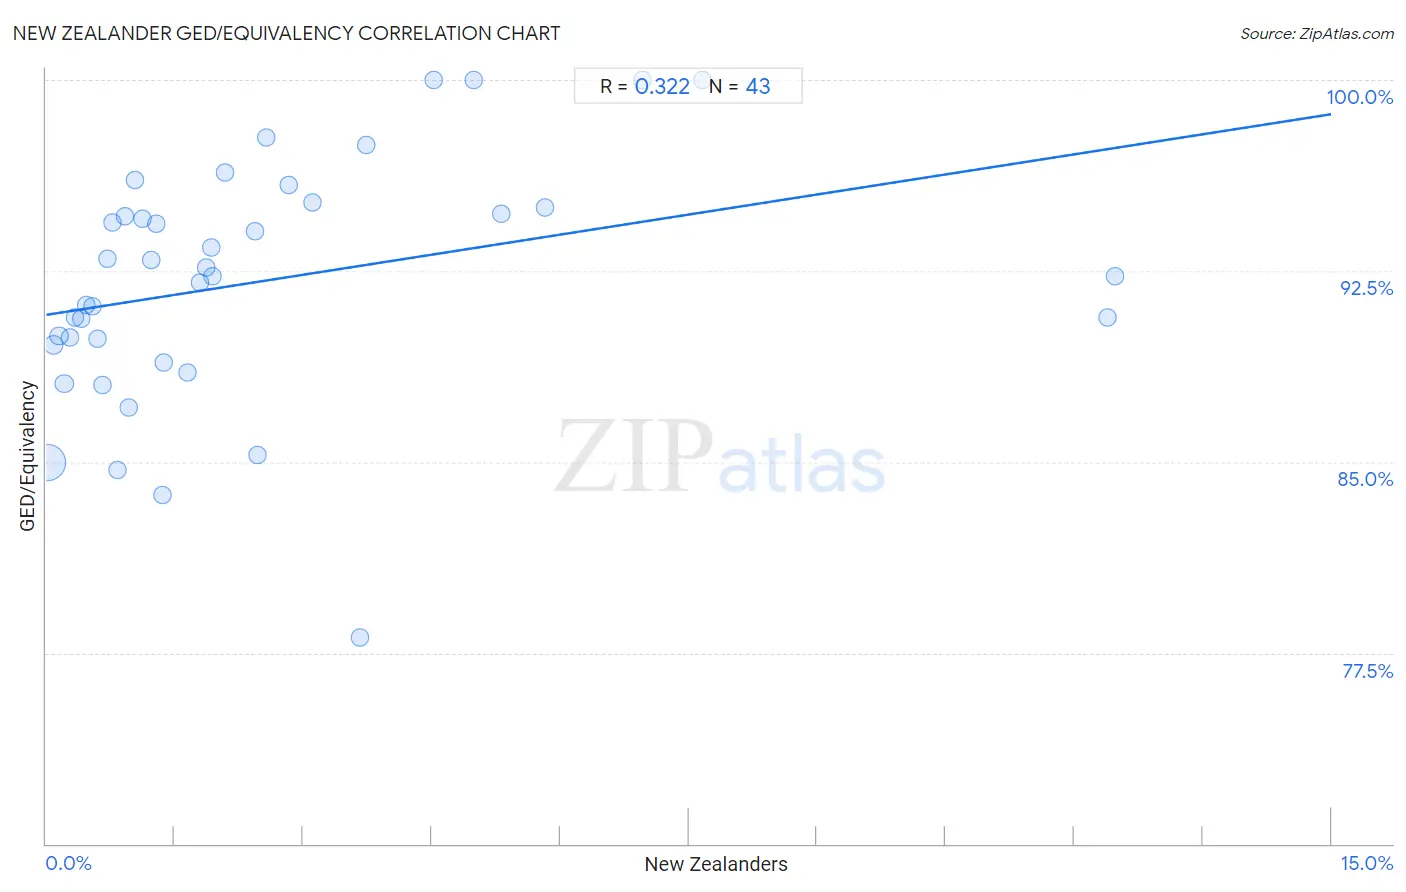
It is essential to understand that the correlation between the percentage of New Zealanders and percentage of population with at least ged/equivalency education does not imply a direct cause-and-effect relationship. It remains uncertain whether the presence of New Zealanders influences an upward or downward trend in the level of percentage of population with at least ged/equivalency education within an area, or if New Zealanders simply ended up residing in those areas with higher or lower levels of percentage of population with at least ged/equivalency education due to other factors.
Demographics Similar to New Zealanders by GED/Equivalency
In terms of ged/equivalency, the demographic groups most similar to New Zealanders are Soviet Union (88.0%, a difference of 0.0%), Zimbabwean (88.0%, a difference of 0.010%), Immigrants from South Africa (88.0%, a difference of 0.010%), Immigrants from Netherlands (88.0%, a difference of 0.020%), and Immigrants from Denmark (88.0%, a difference of 0.020%).
| Demographics | Rating | Rank | GED/Equivalency |
| Greeks | 99.5 /100 | #48 | Exceptional 88.1% |
| Australians | 99.5 /100 | #49 | Exceptional 88.1% |
| Immigrants from Korea | 99.5 /100 | #50 | Exceptional 88.1% |
| Immigrants from Netherlands | 99.4 /100 | #51 | Exceptional 88.0% |
| Zimbabweans | 99.4 /100 | #52 | Exceptional 88.0% |
| Immigrants from South Africa | 99.4 /100 | #53 | Exceptional 88.0% |
| Soviet Union | 99.4 /100 | #54 | Exceptional 88.0% |
| New Zealanders | 99.4 /100 | #55 | Exceptional 88.0% |
| Immigrants from Denmark | 99.4 /100 | #56 | Exceptional 88.0% |
| Immigrants from Czechoslovakia | 99.3 /100 | #57 | Exceptional 87.9% |
| Northern Europeans | 99.3 /100 | #58 | Exceptional 87.9% |
| Serbians | 99.3 /100 | #59 | Exceptional 87.9% |
| Scandinavians | 99.3 /100 | #60 | Exceptional 87.9% |
| Europeans | 99.3 /100 | #61 | Exceptional 87.9% |
| Germans | 99.3 /100 | #62 | Exceptional 87.9% |
New Zealander GED/Equivalency Correlation Summary
| Measurement | New Zealander Data | GED/Equivalency Data |
| Minimum | 0.016% | 78.1% |
| Maximum | 12.5% | 100.0% |
| Range | 12.5% | 21.9% |
| Mean | 2.5% | 92.1% |
| Median | 1.4% | 92.3% |
| Interquartile 25% (IQ1) | 0.66% | 89.6% |
| Interquartile 75% (IQ3) | 3.1% | 95.0% |
| Interquartile Range (IQR) | 2.5% | 5.4% |
| Standard Deviation (Sample) | 2.9% | 4.7% |
| Standard Deviation (Population) | 2.9% | 4.7% |
Correlation Details
| New Zealander Percentile | Sample Size | GED/Equivalency |
[ 0.0% - 0.5% ] 0.016% | 93,462,306 | 85.0% |
[ 0.0% - 0.5% ] 0.086% | 7,622,686 | 89.6% |
[ 0.0% - 0.5% ] 0.15% | 2,744,646 | 89.9% |
[ 0.0% - 0.5% ] 0.21% | 994,537 | 88.1% |
[ 0.0% - 0.5% ] 0.27% | 672,956 | 89.9% |
[ 0.0% - 0.5% ] 0.34% | 447,216 | 90.7% |
[ 0.0% - 0.5% ] 0.40% | 215,327 | 90.6% |
[ 0.0% - 0.5% ] 0.47% | 200,101 | 91.2% |
[ 0.5% - 1.0% ] 0.54% | 140,065 | 91.1% |
[ 0.5% - 1.0% ] 0.60% | 54,436 | 89.8% |
[ 0.5% - 1.0% ] 0.66% | 62,608 | 88.0% |
[ 0.5% - 1.0% ] 0.71% | 57,516 | 93.0% |
[ 0.5% - 1.0% ] 0.78% | 29,436 | 94.4% |
[ 0.5% - 1.0% ] 0.84% | 58,835 | 84.7% |
[ 0.5% - 1.0% ] 0.92% | 35,587 | 94.7% |
[ 0.5% - 1.0% ] 0.96% | 26,023 | 87.1% |
[ 1.0% - 1.5% ] 1.03% | 7,645 | 96.1% |
[ 1.0% - 1.5% ] 1.12% | 5,012 | 94.5% |
[ 1.0% - 1.5% ] 1.23% | 7,787 | 92.9% |
[ 1.0% - 1.5% ] 1.29% | 16,056 | 94.3% |
[ 1.0% - 1.5% ] 1.35% | 13,322 | 83.7% |
[ 1.0% - 1.5% ] 1.38% | 6,534 | 88.9% |
[ 1.5% - 2.0% ] 1.65% | 363 | 88.5% |
[ 1.5% - 2.0% ] 1.79% | 6,467 | 92.1% |
[ 1.5% - 2.0% ] 1.86% | 1,019 | 92.6% |
[ 1.5% - 2.0% ] 1.92% | 1,247 | 93.4% |
[ 1.5% - 2.0% ] 1.95% | 976 | 92.3% |
[ 2.0% - 2.5% ] 2.09% | 3,305 | 96.4% |
[ 2.0% - 2.5% ] 2.43% | 2,016 | 94.1% |
[ 2.0% - 2.5% ] 2.47% | 3,367 | 85.3% |
[ 2.5% - 3.0% ] 2.57% | 4,402 | 97.7% |
[ 2.5% - 3.0% ] 2.84% | 282 | 95.9% |
[ 3.0% - 3.5% ] 3.11% | 1,413 | 95.2% |
[ 3.5% - 4.0% ] 3.67% | 491 | 78.1% |
[ 3.5% - 4.0% ] 3.73% | 1,340 | 97.4% |
[ 4.5% - 5.0% ] 4.52% | 177 | 100.0% |
[ 4.5% - 5.0% ] 4.98% | 301 | 100.0% |
[ 5.0% - 5.5% ] 5.30% | 886 | 94.8% |
[ 5.5% - 6.0% ] 5.82% | 498 | 95.0% |
[ 6.5% - 7.0% ] 6.95% | 604 | 100.0% |
[ 7.5% - 8.0% ] 7.66% | 1,240 | 100.0% |
[ 12.0% - 12.5% ] 12.39% | 218 | 90.7% |
[ 12.0% - 12.5% ] 12.47% | 401 | 92.3% |