Israeli GED/Equivalency
COMPARE
Israeli
Select to Compare
GED/Equivalency
Israeli GED/Equivalency
87.4%
GED/EQUIVALENCY
97.8/ 100
METRIC RATING
92nd/ 347
METRIC RANK
Israeli GED/Equivalency Correlation Chart
The statistical analysis conducted on geographies consisting of 211,219,980 people shows a slight positive correlation between the proportion of Israelis and percentage of population with at least ged/equivalency education in the United States with a correlation coefficient (R) of 0.095 and weighted average of 87.4%. On average, for every 1% (one percent) increase in Israelis within a typical geography, there is an increase of 0.096% in percentage of population with at least ged/equivalency education.
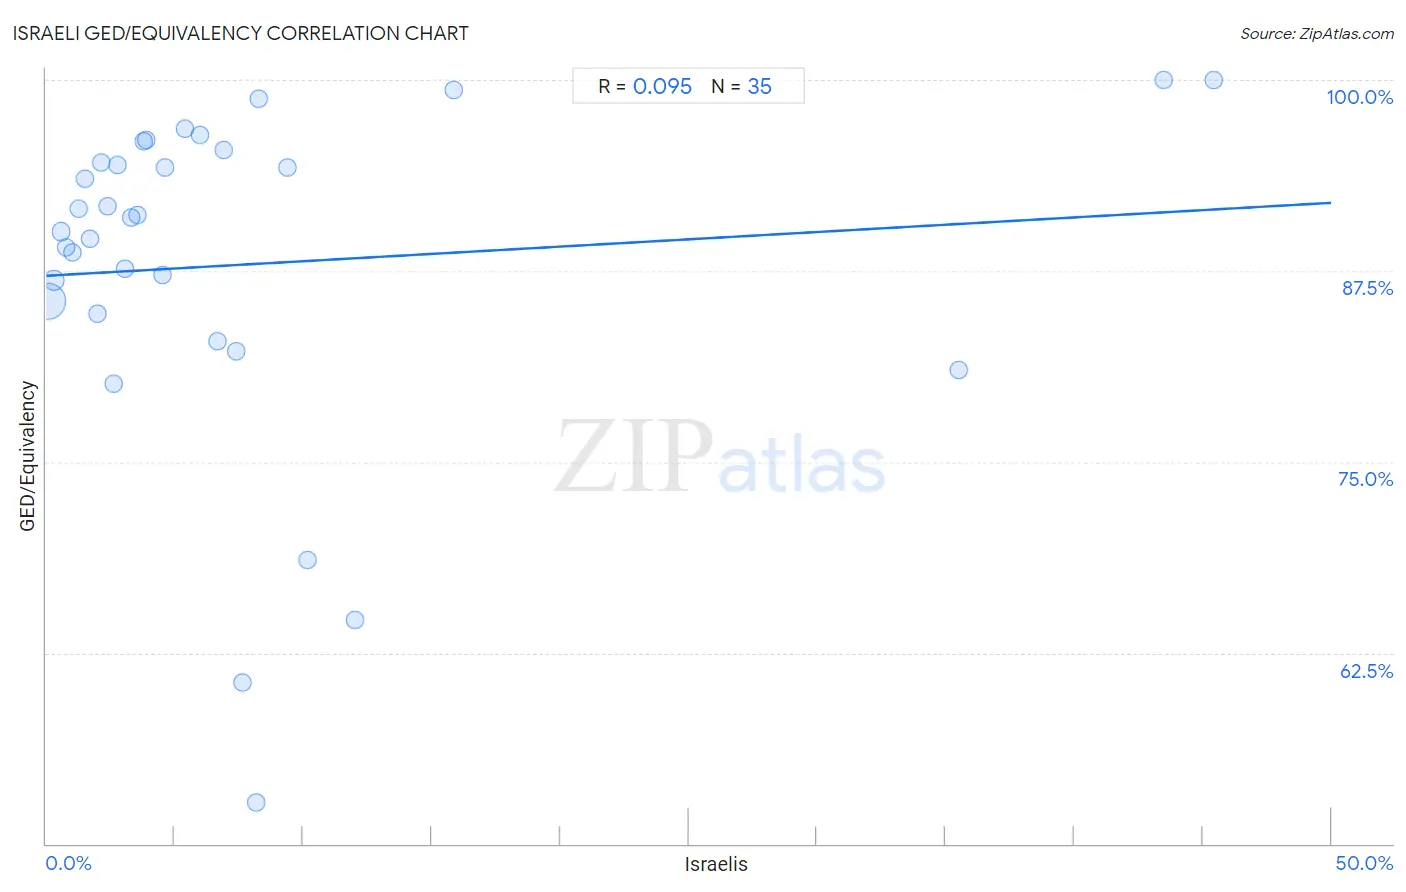
It is essential to understand that the correlation between the percentage of Israelis and percentage of population with at least ged/equivalency education does not imply a direct cause-and-effect relationship. It remains uncertain whether the presence of Israelis influences an upward or downward trend in the level of percentage of population with at least ged/equivalency education within an area, or if Israelis simply ended up residing in those areas with higher or lower levels of percentage of population with at least ged/equivalency education due to other factors.
Demographics Similar to Israelis by GED/Equivalency
In terms of ged/equivalency, the demographic groups most similar to Israelis are Immigrants from Eastern Asia (87.4%, a difference of 0.010%), Immigrants from North Macedonia (87.4%, a difference of 0.010%), Immigrants from Russia (87.4%, a difference of 0.010%), Hungarian (87.4%, a difference of 0.020%), and Welsh (87.4%, a difference of 0.020%).
| Demographics | Rating | Rank | GED/Equivalency |
| Dutch | 98.1 /100 | #85 | Exceptional 87.5% |
| Immigrants from Europe | 98.1 /100 | #86 | Exceptional 87.5% |
| Native Hawaiians | 98.1 /100 | #87 | Exceptional 87.5% |
| Immigrants from Norway | 98.1 /100 | #88 | Exceptional 87.5% |
| Hungarians | 97.9 /100 | #89 | Exceptional 87.4% |
| Welsh | 97.9 /100 | #90 | Exceptional 87.4% |
| Immigrants from Eastern Asia | 97.9 /100 | #91 | Exceptional 87.4% |
| Israelis | 97.8 /100 | #92 | Exceptional 87.4% |
| Immigrants from North Macedonia | 97.8 /100 | #93 | Exceptional 87.4% |
| Immigrants from Russia | 97.8 /100 | #94 | Exceptional 87.4% |
| Immigrants from Greece | 97.7 /100 | #95 | Exceptional 87.4% |
| Czechoslovakians | 97.6 /100 | #96 | Exceptional 87.4% |
| Immigrants from Western Europe | 97.3 /100 | #97 | Exceptional 87.3% |
| Immigrants from Croatia | 96.9 /100 | #98 | Exceptional 87.3% |
| Immigrants from Belarus | 96.9 /100 | #99 | Exceptional 87.3% |
Israeli GED/Equivalency Correlation Summary
| Measurement | Israeli Data | GED/Equivalency Data |
| Minimum | 0.067% | 52.7% |
| Maximum | 45.4% | 100.0% |
| Range | 45.4% | 47.3% |
| Mean | 7.8% | 87.9% |
| Median | 3.9% | 91.0% |
| Interquartile 25% (IQ1) | 2.0% | 84.7% |
| Interquartile 75% (IQ3) | 8.2% | 95.4% |
| Interquartile Range (IQR) | 6.2% | 10.7% |
| Standard Deviation (Sample) | 11.1% | 11.1% |
| Standard Deviation (Population) | 11.0% | 11.0% |
Correlation Details
| Israeli Percentile | Sample Size | GED/Equivalency |
[ 0.0% - 0.5% ] 0.067% | 182,777,738 | 85.5% |
[ 0.0% - 0.5% ] 0.31% | 18,445,836 | 86.9% |
[ 0.5% - 1.0% ] 0.57% | 4,297,920 | 90.1% |
[ 0.5% - 1.0% ] 0.78% | 2,004,396 | 89.0% |
[ 1.0% - 1.5% ] 1.02% | 1,399,138 | 88.7% |
[ 1.0% - 1.5% ] 1.26% | 625,147 | 91.6% |
[ 1.5% - 2.0% ] 1.50% | 254,179 | 93.6% |
[ 1.5% - 2.0% ] 1.70% | 376,622 | 89.6% |
[ 1.5% - 2.0% ] 1.98% | 240,808 | 84.7% |
[ 2.0% - 2.5% ] 2.12% | 237,176 | 94.6% |
[ 2.0% - 2.5% ] 2.40% | 130,559 | 91.7% |
[ 2.5% - 3.0% ] 2.63% | 66,201 | 80.1% |
[ 2.5% - 3.0% ] 2.76% | 57,201 | 94.4% |
[ 3.0% - 3.5% ] 3.06% | 68,936 | 87.6% |
[ 3.0% - 3.5% ] 3.29% | 70,940 | 91.0% |
[ 3.5% - 4.0% ] 3.53% | 71,502 | 91.2% |
[ 3.5% - 4.0% ] 3.79% | 32,884 | 96.0% |
[ 3.5% - 4.0% ] 3.90% | 5,617 | 96.1% |
[ 4.5% - 5.0% ] 4.52% | 598 | 87.2% |
[ 4.5% - 5.0% ] 4.61% | 18,210 | 94.3% |
[ 5.0% - 5.5% ] 5.39% | 5,564 | 96.8% |
[ 5.5% - 6.0% ] 5.98% | 8,851 | 96.4% |
[ 6.5% - 7.0% ] 6.66% | 4,550 | 82.9% |
[ 6.5% - 7.0% ] 6.91% | 7,307 | 95.4% |
[ 7.0% - 7.5% ] 7.39% | 717 | 82.2% |
[ 7.5% - 8.0% ] 7.65% | 810 | 60.6% |
[ 8.0% - 8.5% ] 8.15% | 319 | 52.7% |
[ 8.0% - 8.5% ] 8.26% | 1,066 | 98.7% |
[ 9.0% - 9.5% ] 9.41% | 6,123 | 94.3% |
[ 10.0% - 10.5% ] 10.17% | 1,534 | 68.6% |
[ 12.0% - 12.5% ] 12.03% | 349 | 64.7% |
[ 15.5% - 16.0% ] 15.84% | 486 | 99.4% |
[ 35.0% - 35.5% ] 35.48% | 93 | 81.0% |
[ 43.5% - 44.0% ] 43.51% | 308 | 100.0% |
[ 45.0% - 45.5% ] 45.42% | 295 | 100.0% |