Central American Indian GED/Equivalency
COMPARE
Central American Indian
Select to Compare
GED/Equivalency
Central American Indian GED/Equivalency
80.6%
GED/EQUIVALENCY
0.0/ 100
METRIC RATING
316th/ 347
METRIC RANK
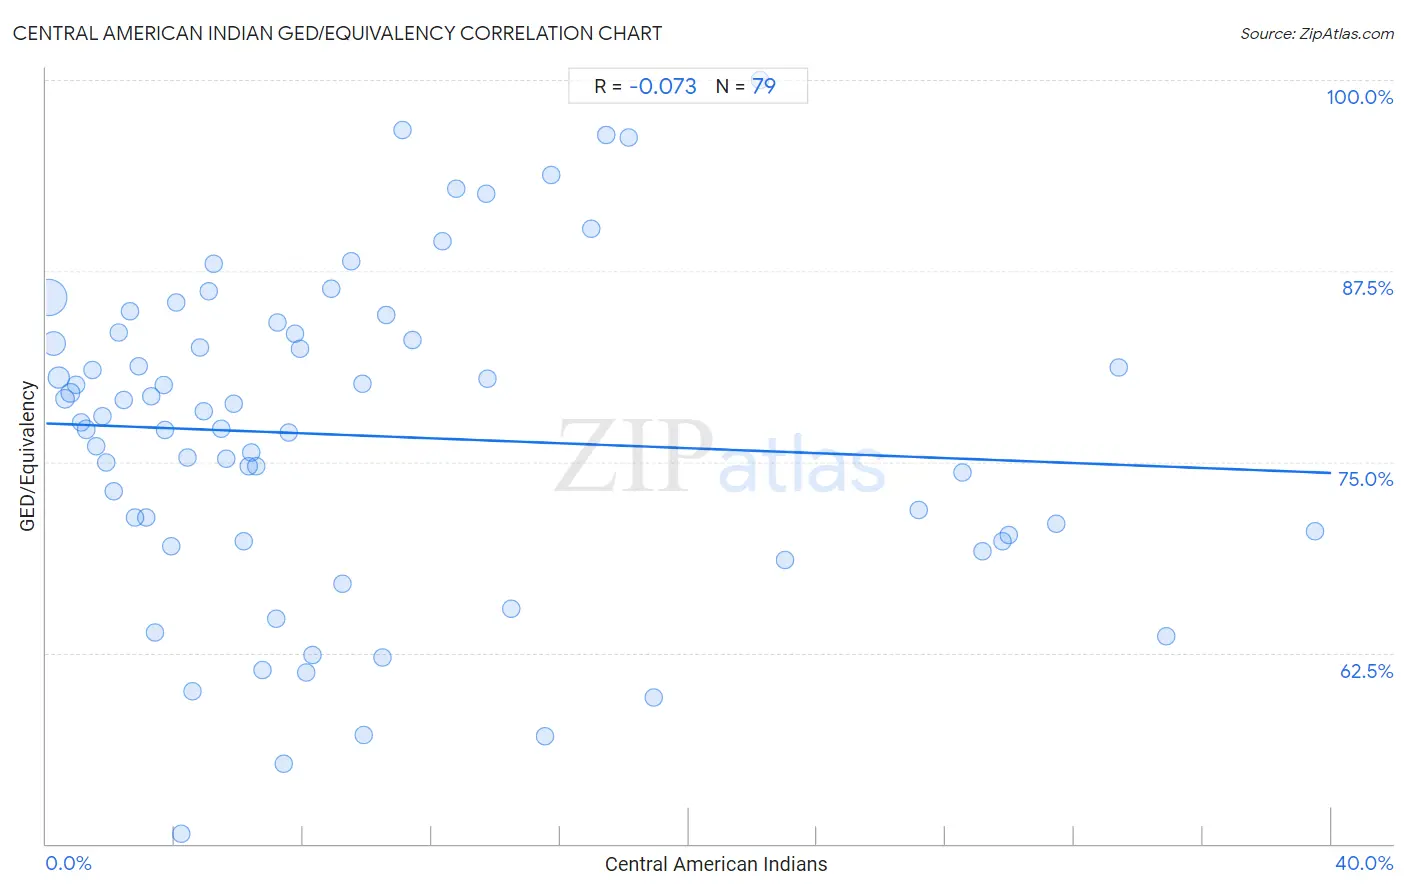
Central American Indian GED/Equivalency Correlation Chart
The statistical analysis conducted on geographies consisting of 326,142,643 people shows a slight negative correlation between the proportion of Central American Indians and percentage of population with at least ged/equivalency education in the United States with a correlation coefficient (R) of -0.073 and weighted average of 80.6%. On average, for every 1% (one percent) increase in Central American Indians within a typical geography, there is a decrease of 0.081% in percentage of population with at least ged/equivalency education.
It is essential to understand that the correlation between the percentage of Central American Indians and percentage of population with at least ged/equivalency education does not imply a direct cause-and-effect relationship. It remains uncertain whether the presence of Central American Indians influences an upward or downward trend in the level of percentage of population with at least ged/equivalency education within an area, or if Central American Indians simply ended up residing in those areas with higher or lower levels of percentage of population with at least ged/equivalency education due to other factors.
Demographics Similar to Central American Indians by GED/Equivalency
In terms of ged/equivalency, the demographic groups most similar to Central American Indians are Immigrants from Caribbean (80.5%, a difference of 0.10%), Apache (80.7%, a difference of 0.13%), Yaqui (80.5%, a difference of 0.13%), Immigrants from Belize (80.5%, a difference of 0.13%), and Belizean (80.9%, a difference of 0.39%).
| Demographics | Rating | Rank | GED/Equivalency |
| Immigrants from Ecuador | 0.0 /100 | #309 | Tragic 81.0% |
| Immigrants from Guyana | 0.0 /100 | #310 | Tragic 81.0% |
| Natives/Alaskans | 0.0 /100 | #311 | Tragic 80.9% |
| Nicaraguans | 0.0 /100 | #312 | Tragic 80.9% |
| Cape Verdeans | 0.0 /100 | #313 | Tragic 80.9% |
| Belizeans | 0.0 /100 | #314 | Tragic 80.9% |
| Apache | 0.0 /100 | #315 | Tragic 80.7% |
| Central American Indians | 0.0 /100 | #316 | Tragic 80.6% |
| Immigrants from Caribbean | 0.0 /100 | #317 | Tragic 80.5% |
| Yaqui | 0.0 /100 | #318 | Tragic 80.5% |
| Immigrants from Belize | 0.0 /100 | #319 | Tragic 80.5% |
| Immigrants from Cuba | 0.0 /100 | #320 | Tragic 80.2% |
| Yup'ik | 0.0 /100 | #321 | Tragic 80.0% |
| Lumbee | 0.0 /100 | #322 | Tragic 80.0% |
| Immigrants from Nicaragua | 0.0 /100 | #323 | Tragic 79.9% |
Central American Indian GED/Equivalency Correlation Summary
| Measurement | Central American Indian Data | GED/Equivalency Data |
| Minimum | 0.074% | 50.7% |
| Maximum | 39.5% | 100.0% |
| Range | 39.4% | 49.3% |
| Mean | 9.9% | 76.7% |
| Median | 6.7% | 77.6% |
| Interquartile 25% (IQ1) | 3.3% | 69.8% |
| Interquartile 75% (IQ3) | 13.7% | 83.4% |
| Interquartile Range (IQR) | 10.4% | 13.6% |
| Standard Deviation (Sample) | 9.4% | 10.5% |
| Standard Deviation (Population) | 9.4% | 10.4% |
Correlation Details
| Central American Indian Percentile | Sample Size | GED/Equivalency |
[ 0.0% - 0.5% ] 0.074% | 190,824,566 | 85.8% |
[ 0.0% - 0.5% ] 0.23% | 68,671,999 | 82.8% |
[ 0.0% - 0.5% ] 0.39% | 37,016,404 | 80.5% |
[ 0.5% - 1.0% ] 0.57% | 12,519,161 | 79.1% |
[ 0.5% - 1.0% ] 0.75% | 5,727,508 | 79.5% |
[ 0.5% - 1.0% ] 0.92% | 3,819,975 | 80.0% |
[ 1.0% - 1.5% ] 1.08% | 2,159,711 | 77.6% |
[ 1.0% - 1.5% ] 1.26% | 1,091,437 | 77.1% |
[ 1.0% - 1.5% ] 1.43% | 857,503 | 81.0% |
[ 1.5% - 2.0% ] 1.57% | 969,926 | 76.0% |
[ 1.5% - 2.0% ] 1.74% | 658,067 | 78.0% |
[ 1.5% - 2.0% ] 1.88% | 268,785 | 75.0% |
[ 2.0% - 2.5% ] 2.10% | 290,773 | 73.1% |
[ 2.0% - 2.5% ] 2.26% | 132,871 | 83.5% |
[ 2.0% - 2.5% ] 2.42% | 176,610 | 79.0% |
[ 2.5% - 3.0% ] 2.62% | 88,661 | 84.9% |
[ 2.5% - 3.0% ] 2.75% | 90,343 | 71.4% |
[ 2.5% - 3.0% ] 2.86% | 65,302 | 81.3% |
[ 3.0% - 3.5% ] 3.10% | 106,000 | 71.4% |
[ 3.0% - 3.5% ] 3.28% | 77,291 | 79.3% |
[ 3.0% - 3.5% ] 3.39% | 65,761 | 63.9% |
[ 3.5% - 4.0% ] 3.66% | 29,327 | 80.0% |
[ 3.5% - 4.0% ] 3.70% | 43,676 | 77.1% |
[ 3.5% - 4.0% ] 3.89% | 13,457 | 69.5% |
[ 4.0% - 4.5% ] 4.06% | 6,941 | 85.5% |
[ 4.0% - 4.5% ] 4.20% | 37,203 | 50.7% |
[ 4.0% - 4.5% ] 4.41% | 16,960 | 75.3% |
[ 4.5% - 5.0% ] 4.57% | 39,987 | 60.0% |
[ 4.5% - 5.0% ] 4.79% | 13,719 | 82.5% |
[ 4.5% - 5.0% ] 4.90% | 7,444 | 78.3% |
[ 5.0% - 5.5% ] 5.08% | 4,136 | 86.2% |
[ 5.0% - 5.5% ] 5.22% | 12,901 | 88.0% |
[ 5.0% - 5.5% ] 5.47% | 3,860 | 77.2% |
[ 5.5% - 6.0% ] 5.60% | 15,614 | 75.2% |
[ 5.5% - 6.0% ] 5.82% | 20,869 | 78.8% |
[ 6.0% - 6.5% ] 6.15% | 7,792 | 69.8% |
[ 6.0% - 6.5% ] 6.31% | 507 | 74.7% |
[ 6.0% - 6.5% ] 6.38% | 2,619 | 75.6% |
[ 6.5% - 7.0% ] 6.53% | 39,406 | 74.7% |
[ 6.5% - 7.0% ] 6.75% | 6,030 | 61.4% |
[ 7.0% - 7.5% ] 7.17% | 1,366 | 64.8% |
[ 7.0% - 7.5% ] 7.21% | 721 | 84.1% |
[ 7.0% - 7.5% ] 7.39% | 284 | 55.2% |
[ 7.5% - 8.0% ] 7.55% | 1,099 | 76.9% |
[ 7.5% - 8.0% ] 7.74% | 5,722 | 83.4% |
[ 7.5% - 8.0% ] 7.90% | 975 | 82.4% |
[ 8.0% - 8.5% ] 8.11% | 2,663 | 61.2% |
[ 8.0% - 8.5% ] 8.30% | 795 | 62.3% |
[ 8.5% - 9.0% ] 8.87% | 958 | 86.3% |
[ 9.0% - 9.5% ] 9.23% | 1,181 | 67.0% |
[ 9.0% - 9.5% ] 9.48% | 485 | 88.1% |
[ 9.5% - 10.0% ] 9.84% | 244 | 80.1% |
[ 9.5% - 10.0% ] 9.89% | 1,324 | 57.1% |
[ 10.0% - 10.5% ] 10.46% | 736 | 62.2% |
[ 10.5% - 11.0% ] 10.59% | 11,179 | 84.6% |
[ 11.0% - 11.5% ] 11.07% | 587 | 96.7% |
[ 11.0% - 11.5% ] 11.41% | 5,024 | 83.0% |
[ 12.0% - 12.5% ] 12.32% | 2,386 | 89.5% |
[ 12.5% - 13.0% ] 12.77% | 141 | 92.9% |
[ 13.5% - 14.0% ] 13.68% | 95 | 92.6% |
[ 13.5% - 14.0% ] 13.75% | 1,396 | 80.5% |
[ 14.0% - 14.5% ] 14.47% | 159 | 65.4% |
[ 15.5% - 16.0% ] 15.51% | 1,438 | 57.1% |
[ 15.5% - 16.0% ] 15.70% | 363 | 93.8% |
[ 16.5% - 17.0% ] 16.95% | 655 | 90.3% |
[ 17.0% - 17.5% ] 17.44% | 1,674 | 96.4% |
[ 18.0% - 18.5% ] 18.13% | 1,611 | 96.3% |
[ 18.5% - 19.0% ] 18.92% | 872 | 59.6% |
[ 22.0% - 22.5% ] 22.22% | 27 | 100.0% |
[ 23.0% - 23.5% ] 23.01% | 1,130 | 68.6% |
[ 27.0% - 27.5% ] 27.16% | 3,233 | 71.8% |
[ 28.5% - 29.0% ] 28.54% | 2,190 | 74.3% |
[ 29.0% - 29.5% ] 29.16% | 2,658 | 69.1% |
[ 29.5% - 30.0% ] 29.78% | 1,632 | 69.8% |
[ 29.5% - 30.0% ] 29.95% | 25,542 | 70.2% |
[ 31.0% - 31.5% ] 31.46% | 4,562 | 71.0% |
[ 33.0% - 33.5% ] 33.40% | 1,488 | 81.2% |
[ 34.5% - 35.0% ] 34.88% | 37,642 | 63.6% |
[ 39.0% - 39.5% ] 39.48% | 15,304 | 70.5% |