Immigrants from Kenya GED/Equivalency

COMPARE

Immigrants from Kenya
Race
Ancestry
AfghanAfricanAlaska NativeAlaskan AthabascanAlbanianAleutAlsatianAmericanApacheArabArapahoArgentineanArmenianAssyrian/Chaldean/SyriacAustralianAustrianBahamianBangladeshiBarbadianBasqueBelgianBelizeanBermudanBhutaneseBlackfeetBolivianBrazilianBritishBritish West IndianBulgarianBurmeseCajunCambodianCanadianCape VerdeanCarpatho RusynCelticCentral AmericanCentral American IndianCherokeeCheyenneChickasawChileanChineseChippewaChoctawColombianColvilleComancheCosta RicanCreeCreekCroatianCrowCubanCypriotCzechCzechoslovakianDanishDelawareDominicanDutchDutch West IndianEastern EuropeanEcuadorianEgyptianEnglishEstonianEthiopianEuropeanFijianFilipinoFinnishFrenchFrench American IndianFrench CanadianGermanGerman RussianGhanaianGreekGuamanian/ChamorroGuatemalanGuyaneseHaitianHmongHonduranHopiHoumaHungarianIcelanderIndian (Asian)IndonesianInupiatIranianIraqiIrishIroquoisIsraeliItalianJamaicanJapaneseJordanianKenyanKiowaKoreanLaotianLatvianLebaneseLiberianLithuanianLumbeeLuxembourgerMacedonianMalaysianMalteseMarshalleseMenomineeMexicanMexican American IndianMongolianMoroccanNative HawaiianNavajoNepaleseNew ZealanderNicaraguanNigerianNorthern EuropeanNorwegianOkinawanOsageOttawaPaiutePakistaniPalestinianPanamanianParaguayanPennsylvania GermanPeruvianPimaPolishPortuguesePotawatomiPuebloPuerto RicanPuget Sound SalishRomanianRussianSalvadoranSamoanScandinavianScotch-IrishScottishSeminoleSenegaleseSerbianShoshoneSierra LeoneanSiouxSlavicSlovakSloveneSomaliSouth AfricanSouth AmericanSouth American IndianSoviet UnionSpaniardSpanishSpanish AmericanSpanish American IndianSri LankanSubsaharan AfricanSudaneseSwedishSwissSyrianTaiwaneseThaiTlingit-HaidaTohono O'OdhamTonganTrinidadian and TobagonianTsimshianTurkishU.S. Virgin IslanderUgandanUkrainianUruguayanUteVenezuelanVietnameseWelshWest IndianYakamaYaquiYugoslavianYumanYup'ikZimbabwean
Immigration
NonimmigrantsImmigrantsAfghanistanAfricaAlbaniaArgentinaArmeniaAsiaAustraliaAustriaBahamasBangladeshBarbadosBelarusBelgiumBelizeBoliviaBosnia and HerzegovinaBrazilBulgariaBurma/MyanmarCabo VerdeCambodiaCameroonCanadaCaribbeanCentral AmericaChileChinaColombiaCongoCosta RicaCroatiaCubaCzechoslovakiaDenmarkDominicaDominican RepublicEastern AfricaEastern AsiaEastern EuropeEcuadorEgyptEl SalvadorEnglandEritreaEthiopiaEuropeFijiFranceGermanyGhanaGreeceGrenadaGuatemalaGuyanaHaitiHondurasHong KongHungaryIndiaIndonesiaIranIraqIrelandIsraelItalyJamaicaJapanJordanKazakhstanKenyaKoreaKuwaitLaosLatin AmericaLatviaLebanonLiberiaLithuaniaMalaysiaMexicoMicronesiaMiddle AfricaMoldovaMoroccoNepalNetherlandsNicaraguaNigeriaNorth AmericaNorth MacedoniaNorthern AfricaNorthern EuropeNorwayOceaniaPakistanPanamaPeruPhilippinesPolandPortugalRomaniaRussiaSaudi ArabiaScotlandSenegalSerbiaSierra LeoneSingaporeSomaliaSouth AfricaSouth AmericaSouth Central AsiaSouth Eastern AsiaSouthern EuropeSpainSri LankaSt. Vincent and the GrenadinesSudanSwedenSwitzerlandSyriaTaiwanThailandTrinidad and TobagoTurkeyUgandaUkraineUruguayUzbekistanVenezuelaVietnamWest IndiesWestern AfricaWestern AsiaWestern EuropeYemenZaireZimbabweAzores
Select to Compare
Race
Ancestry
AfghanAfricanAlaska NativeAlaskan AthabascanAlbanianAleutAlsatianAmericanApacheArabArapahoArgentineanArmenianAssyrian/Chaldean/SyriacAustralianAustrianBahamianBangladeshiBarbadianBasqueBelgianBelizeanBermudanBhutaneseBlackfeetBolivianBrazilianBritishBritish West IndianBulgarianBurmeseCajunCambodianCanadianCape VerdeanCarpatho RusynCelticCentral AmericanCentral American IndianCherokeeCheyenneChickasawChileanChineseChippewaChoctawColombianColvilleComancheCosta RicanCreeCreekCroatianCrowCubanCypriotCzechCzechoslovakianDanishDelawareDominicanDutchDutch West IndianEastern EuropeanEcuadorianEgyptianEnglishEstonianEthiopianEuropeanFijianFilipinoFinnishFrenchFrench American IndianFrench CanadianGermanGerman RussianGhanaianGreekGuamanian/ChamorroGuatemalanGuyaneseHaitianHmongHonduranHopiHoumaHungarianIcelanderIndian (Asian)IndonesianInupiatIranianIraqiIrishIroquoisIsraeliItalianJamaicanJapaneseJordanianKenyanKiowaKoreanLaotianLatvianLebaneseLiberianLithuanianLumbeeLuxembourgerMacedonianMalaysianMalteseMarshalleseMenomineeMexicanMexican American IndianMongolianMoroccanNative HawaiianNavajoNepaleseNew ZealanderNicaraguanNigerianNorthern EuropeanNorwegianOkinawanOsageOttawaPaiutePakistaniPalestinianPanamanianParaguayanPennsylvania GermanPeruvianPimaPolishPortuguesePotawatomiPuebloPuerto RicanPuget Sound SalishRomanianRussianSalvadoranSamoanScandinavianScotch-IrishScottishSeminoleSenegaleseSerbianShoshoneSierra LeoneanSiouxSlavicSlovakSloveneSomaliSouth AfricanSouth AmericanSouth American IndianSoviet UnionSpaniardSpanishSpanish AmericanSpanish American IndianSri LankanSubsaharan AfricanSudaneseSwedishSwissSyrianTaiwaneseThaiTlingit-HaidaTohono O'OdhamTonganTrinidadian and TobagonianTsimshianTurkishU.S. Virgin IslanderUgandanUkrainianUruguayanUteVenezuelanVietnameseWelshWest IndianYakamaYaquiYugoslavianYumanYup'ikZimbabwean
Immigration
NonimmigrantsImmigrantsAfghanistanAfricaAlbaniaArgentinaArmeniaAsiaAustraliaAustriaBahamasBangladeshBarbadosBelarusBelgiumBelizeBoliviaBosnia and HerzegovinaBrazilBulgariaBurma/MyanmarCabo VerdeCambodiaCameroonCanadaCaribbeanCentral AmericaChileChinaColombiaCongoCosta RicaCroatiaCubaCzechoslovakiaDenmarkDominicaDominican RepublicEastern AfricaEastern AsiaEastern EuropeEcuadorEgyptEl SalvadorEnglandEritreaEthiopiaEuropeFijiFranceGermanyGhanaGreeceGrenadaGuatemalaGuyanaHaitiHondurasHong KongHungaryIndiaIndonesiaIranIraqIrelandIsraelItalyJamaicaJapanJordanKazakhstanKoreaKuwaitLaosLatin AmericaLatviaLebanonLiberiaLithuaniaMalaysiaMexicoMicronesiaMiddle AfricaMoldovaMoroccoNepalNetherlandsNicaraguaNigeriaNorth AmericaNorth MacedoniaNorthern AfricaNorthern EuropeNorwayOceaniaPakistanPanamaPeruPhilippinesPolandPortugalRomaniaRussiaSaudi ArabiaScotlandSenegalSerbiaSierra LeoneSingaporeSomaliaSouth AfricaSouth AmericaSouth Central AsiaSouth Eastern AsiaSouthern EuropeSpainSri LankaSt. Vincent and the GrenadinesSudanSwedenSwitzerlandSyriaTaiwanThailandTrinidad and TobagoTurkeyUgandaUkraineUruguayUzbekistanVenezuelaVietnamWest IndiesWestern AfricaWestern AsiaWestern EuropeYemenZaireZimbabweAzores
GED/Equivalency
Income
Poverty
Unemployment
Labor Participation
Family Structure
Vehicle Availability
Education Level
Disability

Immigrants from Kenya GED/Equivalency
Good

86.2%
GED/EQUIVALENCY
71.8/ 100
METRIC RATING
159th/ 347
METRIC RANK

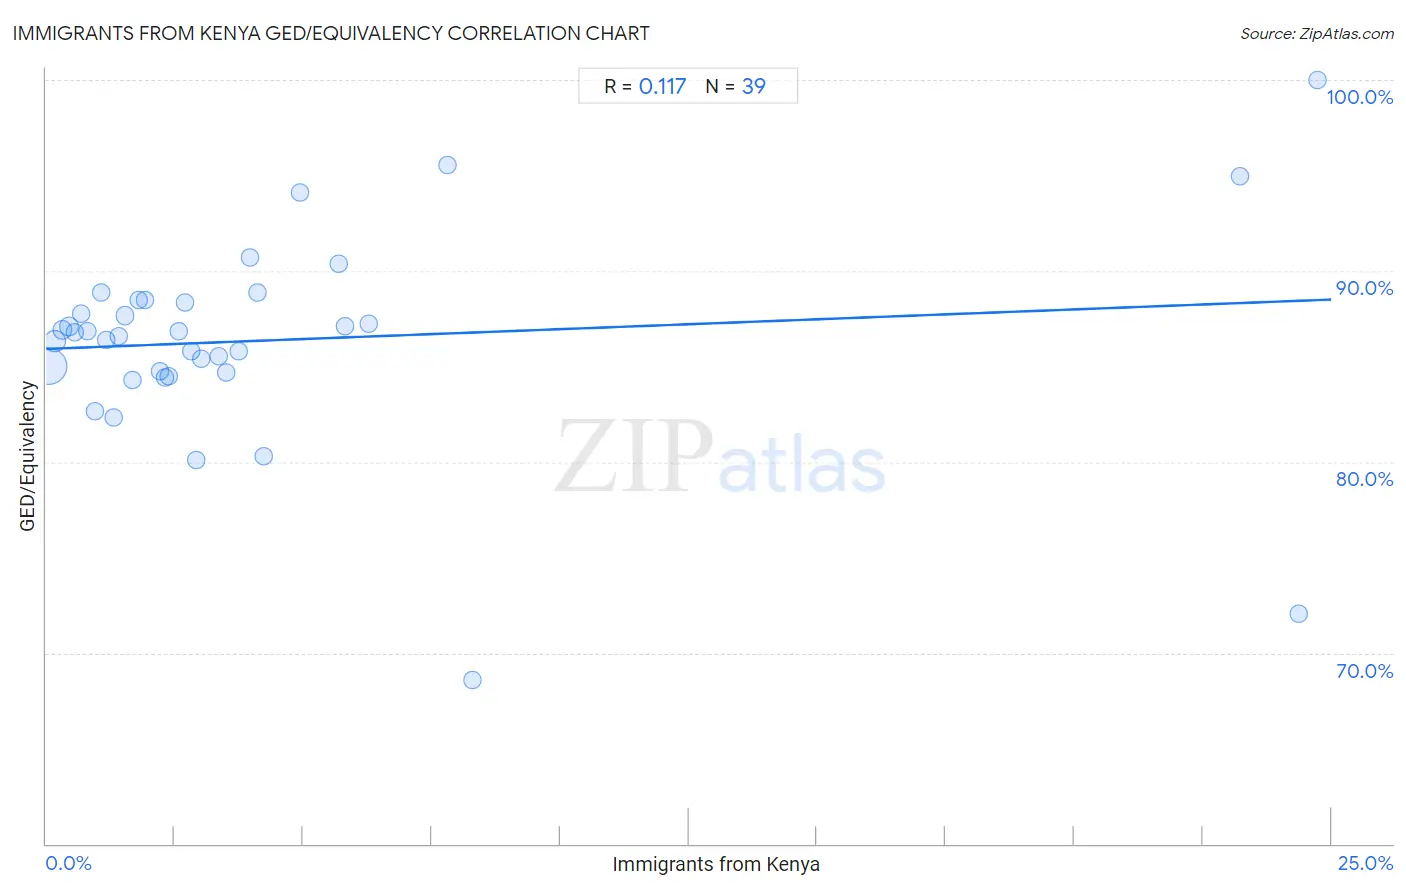
Immigrants from Kenya GED/Equivalency Correlation Chart

The statistical analysis conducted on geographies consisting of 218,076,690 people shows a poor positive correlation between the proportion of Immigrants from Kenya and percentage of population with at least ged/equivalency education in the United States with a correlation coefficient (R) of 0.117 and weighted average of 86.2%. On average, for every 1% (one percent) increase in Immigrants from Kenya within a typical geography, there is an increase of 0.10% in percentage of population with at least ged/equivalency education.
Immigrants from Kenya GED/Equivalency
It is essential to understand that the correlation between the percentage of Immigrants from Kenya and percentage of population with at least ged/equivalency education does not imply a direct cause-and-effect relationship. It remains uncertain whether the presence of Immigrants from Kenya influences an upward or downward trend in the level of percentage of population with at least ged/equivalency education within an area, or if Immigrants from Kenya simply ended up residing in those areas with higher or lower levels of percentage of population with at least ged/equivalency education due to other factors.

Demographics Similar to Immigrants from Kenya by GED/Equivalency

In terms of ged/equivalency, the demographic groups most similar to Immigrants from Kenya are White/Caucasian (86.2%, a difference of 0.010%), German Russian (86.2%, a difference of 0.010%), Immigrants from Nepal (86.2%, a difference of 0.040%), Immigrants from Morocco (86.1%, a difference of 0.060%), and Immigrants from Syria (86.1%, a difference of 0.060%).
DemographicsRating | RankGED/Equivalency
Brazilians
77.2
/100
|
#152
Good
86.3%
Kenyans
76.6
/100
|
#153
Good
86.3%
Armenians
76.4
/100
|
#154
Good
86.3%
Iraqis
75.2
/100
|
#155
Good
86.2%
Immigrants from Nepal
73.3
/100
|
#156
Good
86.2%
Whites/Caucasians
72.2
/100
|
#157
Good
86.2%
German Russians
72.1
/100
|
#158
Good
86.2%
Immigrants from Kenya
71.8
/100
|
#159
Good
86.2%
Immigrants from Morocco
69.5
/100
|
#160
Good
86.1%
Immigrants from Syria
69.3
/100
|
#161
Good
86.1%
Immigrants from Iraq
68.1
/100
|
#162
Good
86.1%
Ugandans
66.3
/100
|
#163
Good
86.1%
Venezuelans
65.5
/100
|
#164
Good
86.0%
Alsatians
64.3
/100
|
#165
Good
86.0%
Immigrants from Albania
64.2
/100
|
#166
Good
86.0%

Immigrants from Kenya GED/Equivalency Correlation Summary

MeasurementImmigrants from Kenya DataGED/Equivalency Data
Minimum0.045%68.6%
Maximum24.7%100.0%
Range24.7%31.4%
Mean4.4%86.4%
Median2.6%86.8%
Interquartile 25% (IQ1)1.2%84.7%
Interquartile 75% (IQ3)4.2%88.5%
Interquartile Range (IQR)3.1%3.8%
Standard Deviation (Sample)6.1%5.4%
Standard Deviation (Population)6.0%5.4%

Correlation Details

Immigrants from Kenya PercentileSample SizeGED/Equivalency
[
0.0%
-
0.5%
]
0.045%
154,725,82985.0%
[
0.0%
-
0.5%
]
0.17%
33,150,65186.3%
[
0.0%
-
0.5%
]
0.31%
12,130,43186.9%
[
0.0%
-
0.5%
]
0.44%
6,466,31487.1%
[
0.5%
-
1.0%
]
0.56%
3,981,70086.8%
[
0.5%
-
1.0%
]
0.67%
1,898,31987.8%
[
0.5%
-
1.0%
]
0.79%
1,468,34086.8%
[
0.5%
-
1.0%
]
0.94%
985,73682.6%
[
1.0%
-
1.5%
]
1.06%
830,19988.9%
[
1.0%
-
1.5%
]
1.16%
572,15186.4%
[
1.0%
-
1.5%
]
1.30%
389,92182.3%
[
1.0%
-
1.5%
]
1.42%
305,22786.6%
[
1.5%
-
2.0%
]
1.53%
264,98587.7%
[
1.5%
-
2.0%
]
1.68%
111,33184.3%
[
1.5%
-
2.0%
]
1.79%
229,90488.5%
[
1.5%
-
2.0%
]
1.92%
113,72088.5%
[
2.0%
-
2.5%
]
2.20%
191,12084.7%
[
2.0%
-
2.5%
]
2.30%
10,02684.4%
[
2.0%
-
2.5%
]
2.39%
55,33284.5%
[
2.5%
-
3.0%
]
2.58%
28,69386.8%
[
2.5%
-
3.0%
]
2.70%
16,08688.3%
[
2.5%
-
3.0%
]
2.82%
61,57885.8%
[
2.5%
-
3.0%
]
2.93%
16,88480.1%
[
3.0%
-
3.5%
]
3.02%
16,94785.4%
[
3.0%
-
3.5%
]
3.36%
2,61885.5%
[
3.0%
-
3.5%
]
3.50%
3,97684.7%
[
3.5%
-
4.0%
]
3.74%
10,81185.8%
[
3.5%
-
4.0%
]
3.96%
22790.7%
[
4.0%
-
4.5%
]
4.10%
2,46488.9%
[
4.0%
-
4.5%
]
4.23%
24,00880.3%
[
4.5%
-
5.0%
]
4.94%
32494.1%
[
5.5%
-
6.0%
]
5.68%
3,83890.4%
[
5.5%
-
6.0%
]
5.82%
3,21487.1%
[
6.0%
-
6.5%
]
6.27%
1,40387.2%
[
7.5%
-
8.0%
]
7.80%
42395.5%
[
8.0%
-
8.5%
]
8.30%
1,15768.6%
[
23.0%
-
23.5%
]
23.22%
26795.0%
[
24.0%
-
24.5%
]
24.37%
43972.1%
[
24.5%
-
25.0%
]
24.74%
97100.0%