Panamanian vs Senegalese Self-Care Disability
COMPARE
Panamanian
Senegalese
Self-Care Disability
Self-Care Disability Comparison
Panamanians
Senegalese
2.5%
SELF-CARE DISABILITY
6.4/ 100
METRIC RATING
210th/ 347
METRIC RANK
2.6%
SELF-CARE DISABILITY
1.3/ 100
METRIC RATING
238th/ 347
METRIC RANK
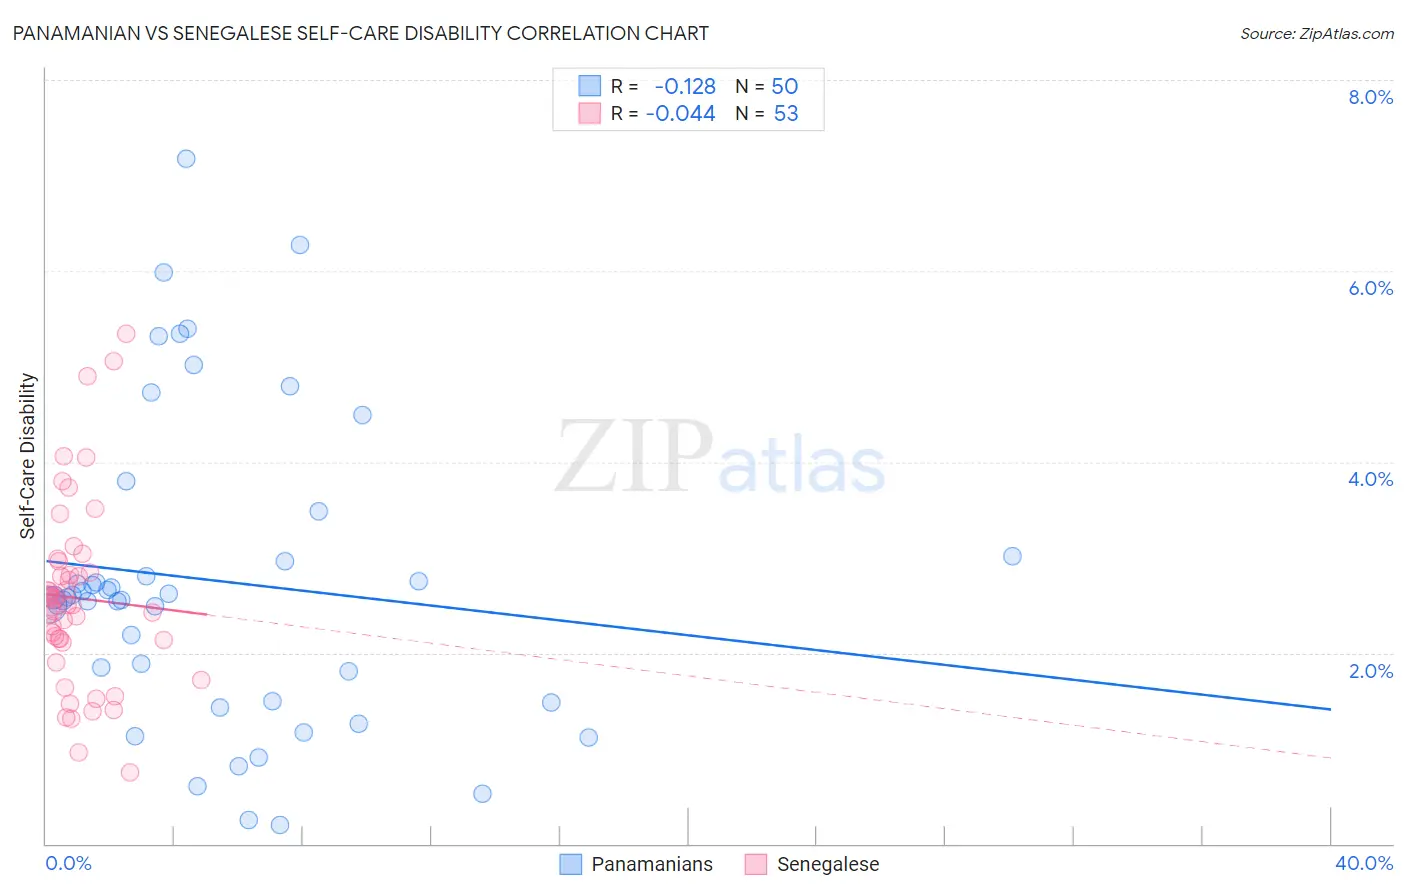
Panamanian vs Senegalese Self-Care Disability Correlation Chart
The statistical analysis conducted on geographies consisting of 280,994,783 people shows a poor negative correlation between the proportion of Panamanians and percentage of population with self-care disability in the United States with a correlation coefficient (R) of -0.128 and weighted average of 2.5%. Similarly, the statistical analysis conducted on geographies consisting of 78,103,112 people shows no correlation between the proportion of Senegalese and percentage of population with self-care disability in the United States with a correlation coefficient (R) of -0.044 and weighted average of 2.6%, a difference of 1.9%.
Self-Care Disability Correlation Summary
| Measurement | Panamanian | Senegalese |
| Minimum | 0.20% | 0.74% |
| Maximum | 7.2% | 5.3% |
| Range | 7.0% | 4.6% |
| Mean | 2.8% | 2.6% |
| Median | 2.6% | 2.5% |
| Interquartile 25% (IQ1) | 1.5% | 2.1% |
| Interquartile 75% (IQ3) | 3.0% | 2.9% |
| Interquartile Range (IQR) | 1.5% | 0.77% |
| Standard Deviation (Sample) | 1.6% | 0.96% |
| Standard Deviation (Population) | 1.6% | 0.95% |
Similar Demographics by Self-Care Disability
Demographics Similar to Panamanians by Self-Care Disability
In terms of self-care disability, the demographic groups most similar to Panamanians are Malaysian (2.5%, a difference of 0.23%), Native Hawaiian (2.6%, a difference of 0.27%), Samoan (2.6%, a difference of 0.29%), Central American (2.5%, a difference of 0.38%), and Ecuadorian (2.6%, a difference of 0.39%).
| Demographics | Rating | Rank | Self-Care Disability |
| Immigrants | Lebanon | 12.4 /100 | #203 | Poor 2.5% |
| Immigrants | Bahamas | 11.9 /100 | #204 | Poor 2.5% |
| Immigrants | Russia | 11.0 /100 | #205 | Poor 2.5% |
| Alaskan Athabascans | 10.4 /100 | #206 | Poor 2.5% |
| French | 9.9 /100 | #207 | Tragic 2.5% |
| Central Americans | 8.7 /100 | #208 | Tragic 2.5% |
| Malaysians | 7.7 /100 | #209 | Tragic 2.5% |
| Panamanians | 6.4 /100 | #210 | Tragic 2.5% |
| Native Hawaiians | 5.1 /100 | #211 | Tragic 2.6% |
| Samoans | 5.1 /100 | #212 | Tragic 2.6% |
| Ecuadorians | 4.7 /100 | #213 | Tragic 2.6% |
| Immigrants | Honduras | 4.7 /100 | #214 | Tragic 2.6% |
| Immigrants | Thailand | 4.5 /100 | #215 | Tragic 2.6% |
| Whites/Caucasians | 4.4 /100 | #216 | Tragic 2.6% |
| Celtics | 4.4 /100 | #217 | Tragic 2.6% |
Demographics Similar to Senegalese by Self-Care Disability
In terms of self-care disability, the demographic groups most similar to Senegalese are Immigrants from Panama (2.6%, a difference of 0.040%), Marshallese (2.6%, a difference of 0.070%), Immigrants from Syria (2.6%, a difference of 0.24%), Immigrants from Senegal (2.6%, a difference of 0.26%), and Bermudan (2.6%, a difference of 0.46%).
| Demographics | Rating | Rank | Self-Care Disability |
| Immigrants | Guatemala | 2.2 /100 | #231 | Tragic 2.6% |
| Albanians | 2.2 /100 | #232 | Tragic 2.6% |
| Liberians | 2.1 /100 | #233 | Tragic 2.6% |
| Vietnamese | 2.1 /100 | #234 | Tragic 2.6% |
| Bahamians | 2.0 /100 | #235 | Tragic 2.6% |
| Bermudans | 1.9 /100 | #236 | Tragic 2.6% |
| Immigrants | Senegal | 1.6 /100 | #237 | Tragic 2.6% |
| Senegalese | 1.3 /100 | #238 | Tragic 2.6% |
| Immigrants | Panama | 1.2 /100 | #239 | Tragic 2.6% |
| Marshallese | 1.2 /100 | #240 | Tragic 2.6% |
| Immigrants | Syria | 1.0 /100 | #241 | Tragic 2.6% |
| Spanish | 0.8 /100 | #242 | Tragic 2.6% |
| Hawaiians | 0.8 /100 | #243 | Tragic 2.6% |
| Yuman | 0.8 /100 | #244 | Tragic 2.6% |
| Immigrants | Western Asia | 0.6 /100 | #245 | Tragic 2.6% |